
A Novel Reinforcement Learning Approach for Spark Configuration Parameter Optimization


Abstract
:1. Introduction
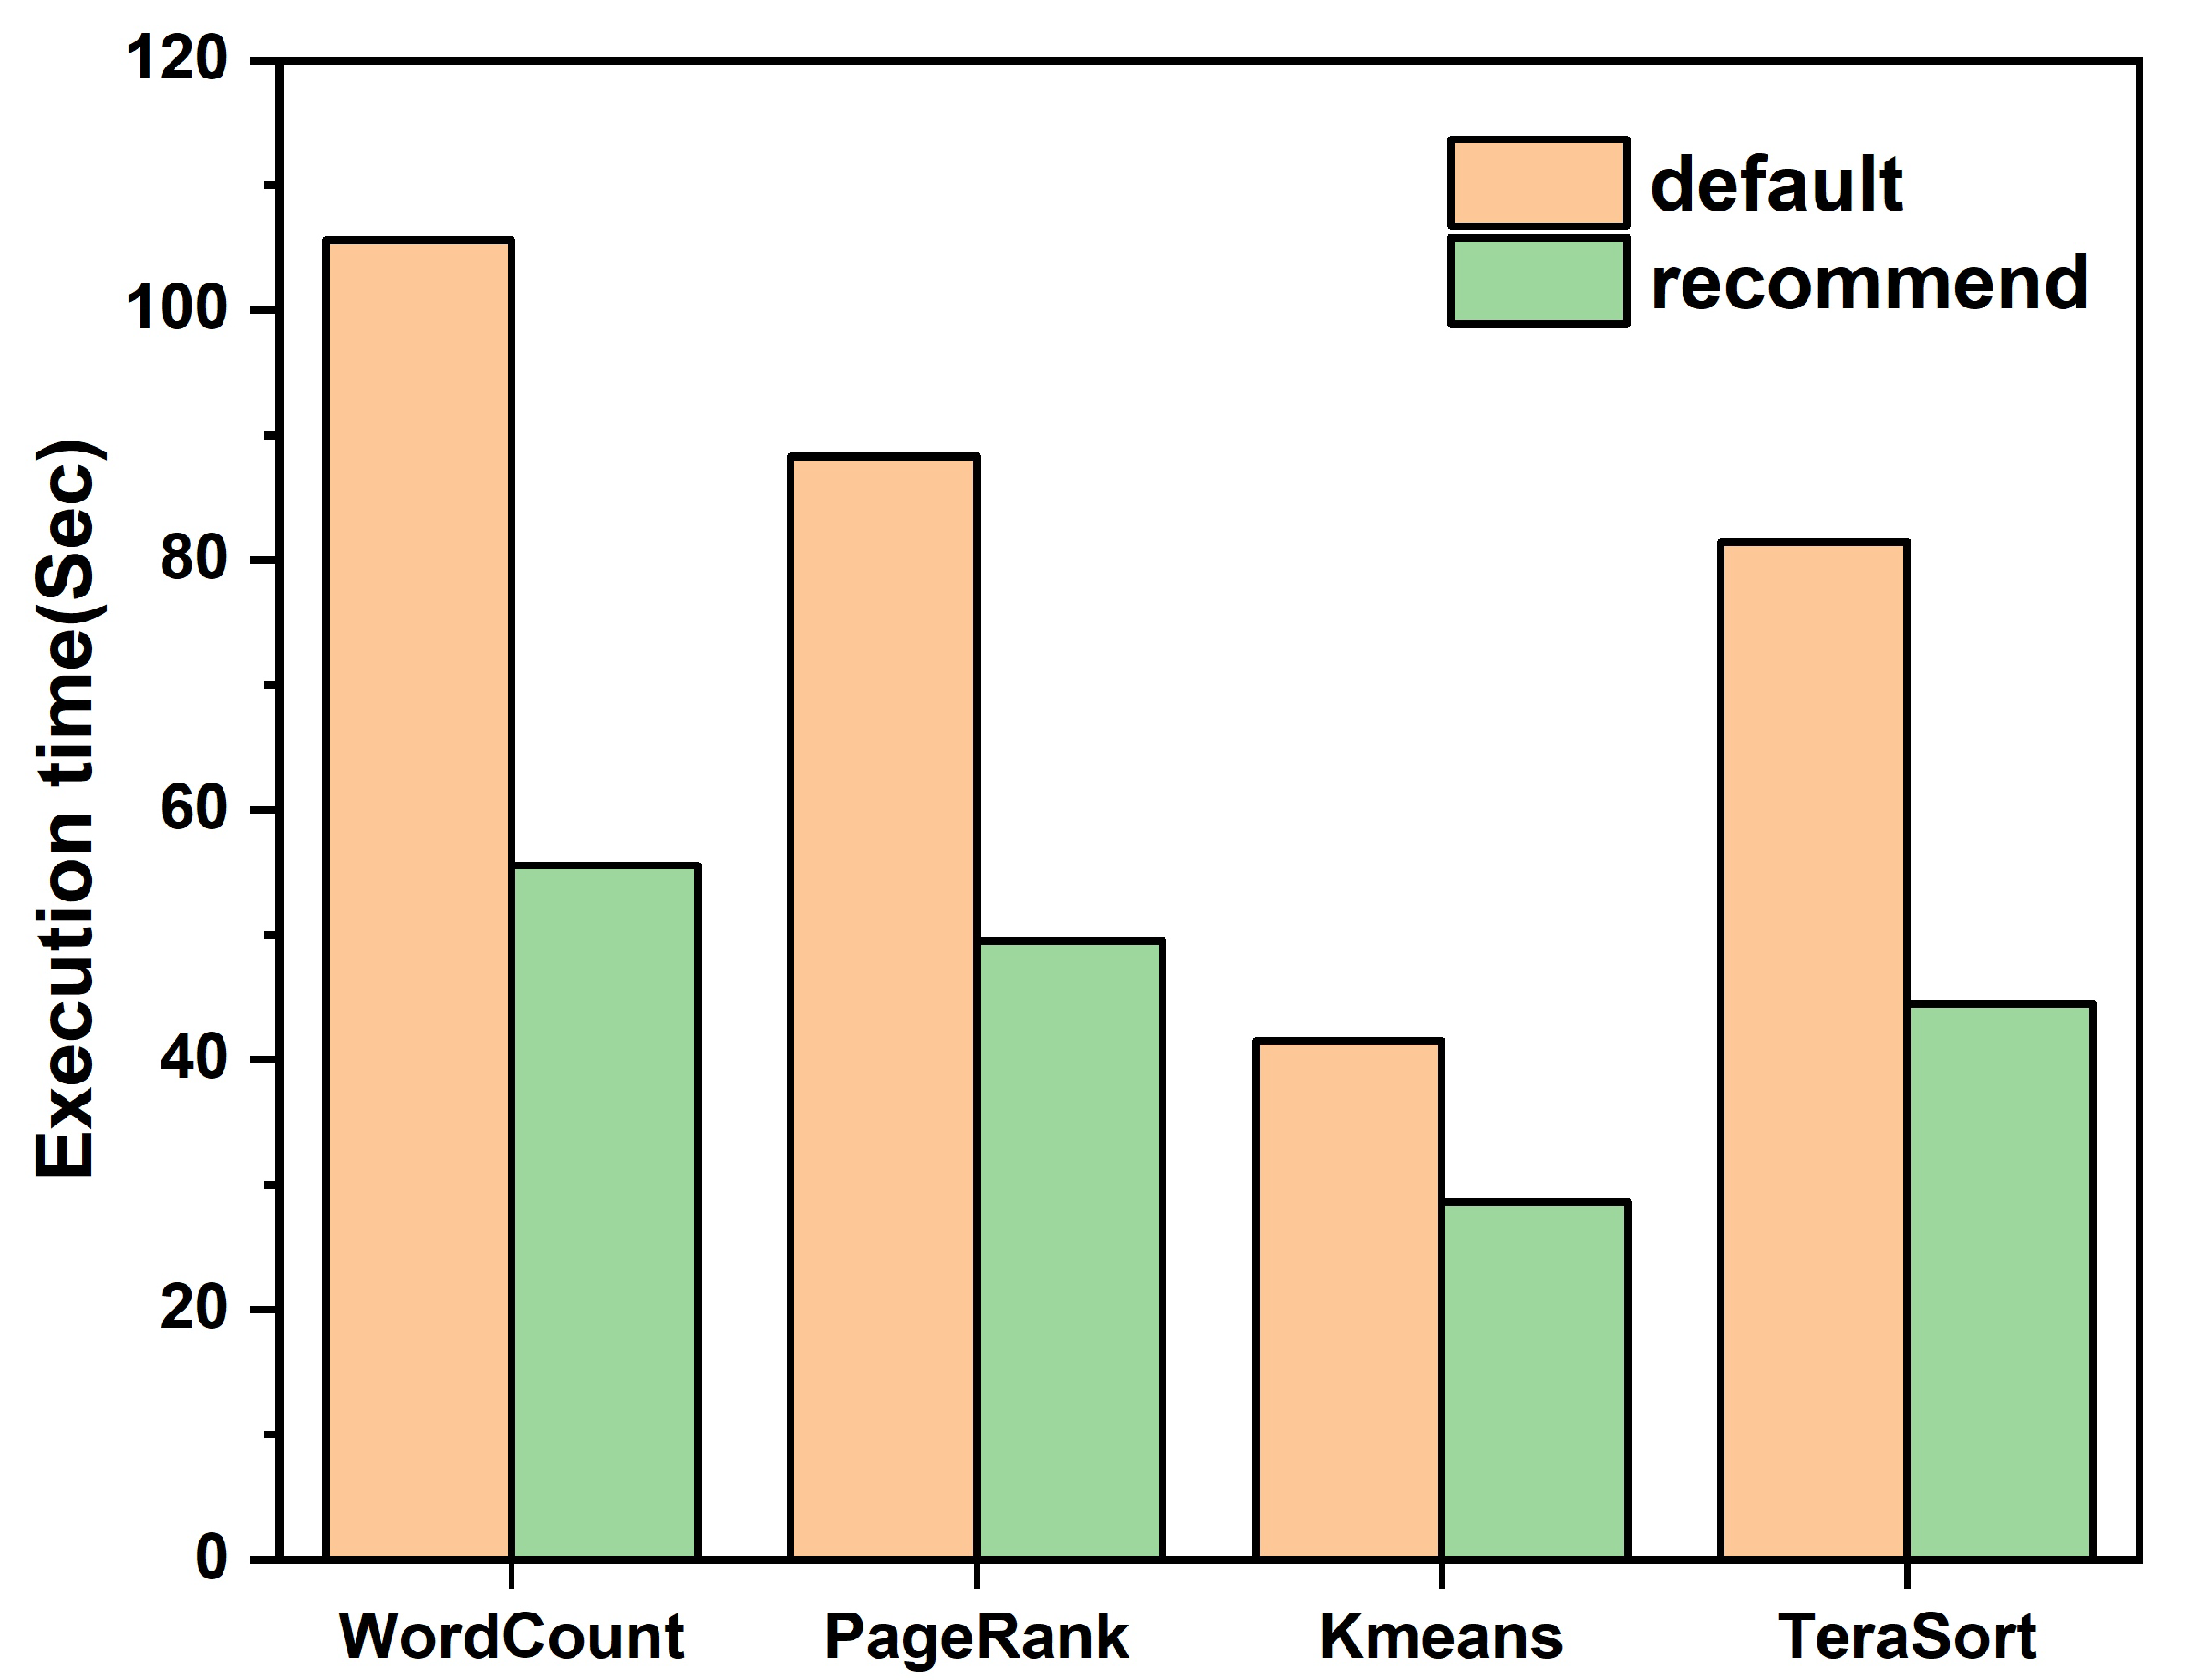
- We designed and implemented a Spark configuration parameter optimizer that accurately predicts the execution time of Spark applications and gives the recommended configuration parameters. Experiments demonstrate that the performance of Spark applications using the recommended configuration parameters is significantly improved compared to the default configuration.
- From more than 180 Spark configuration parameters, we screened out key configuration parameters that had greater impact on the application to reduce the complexity of the model.
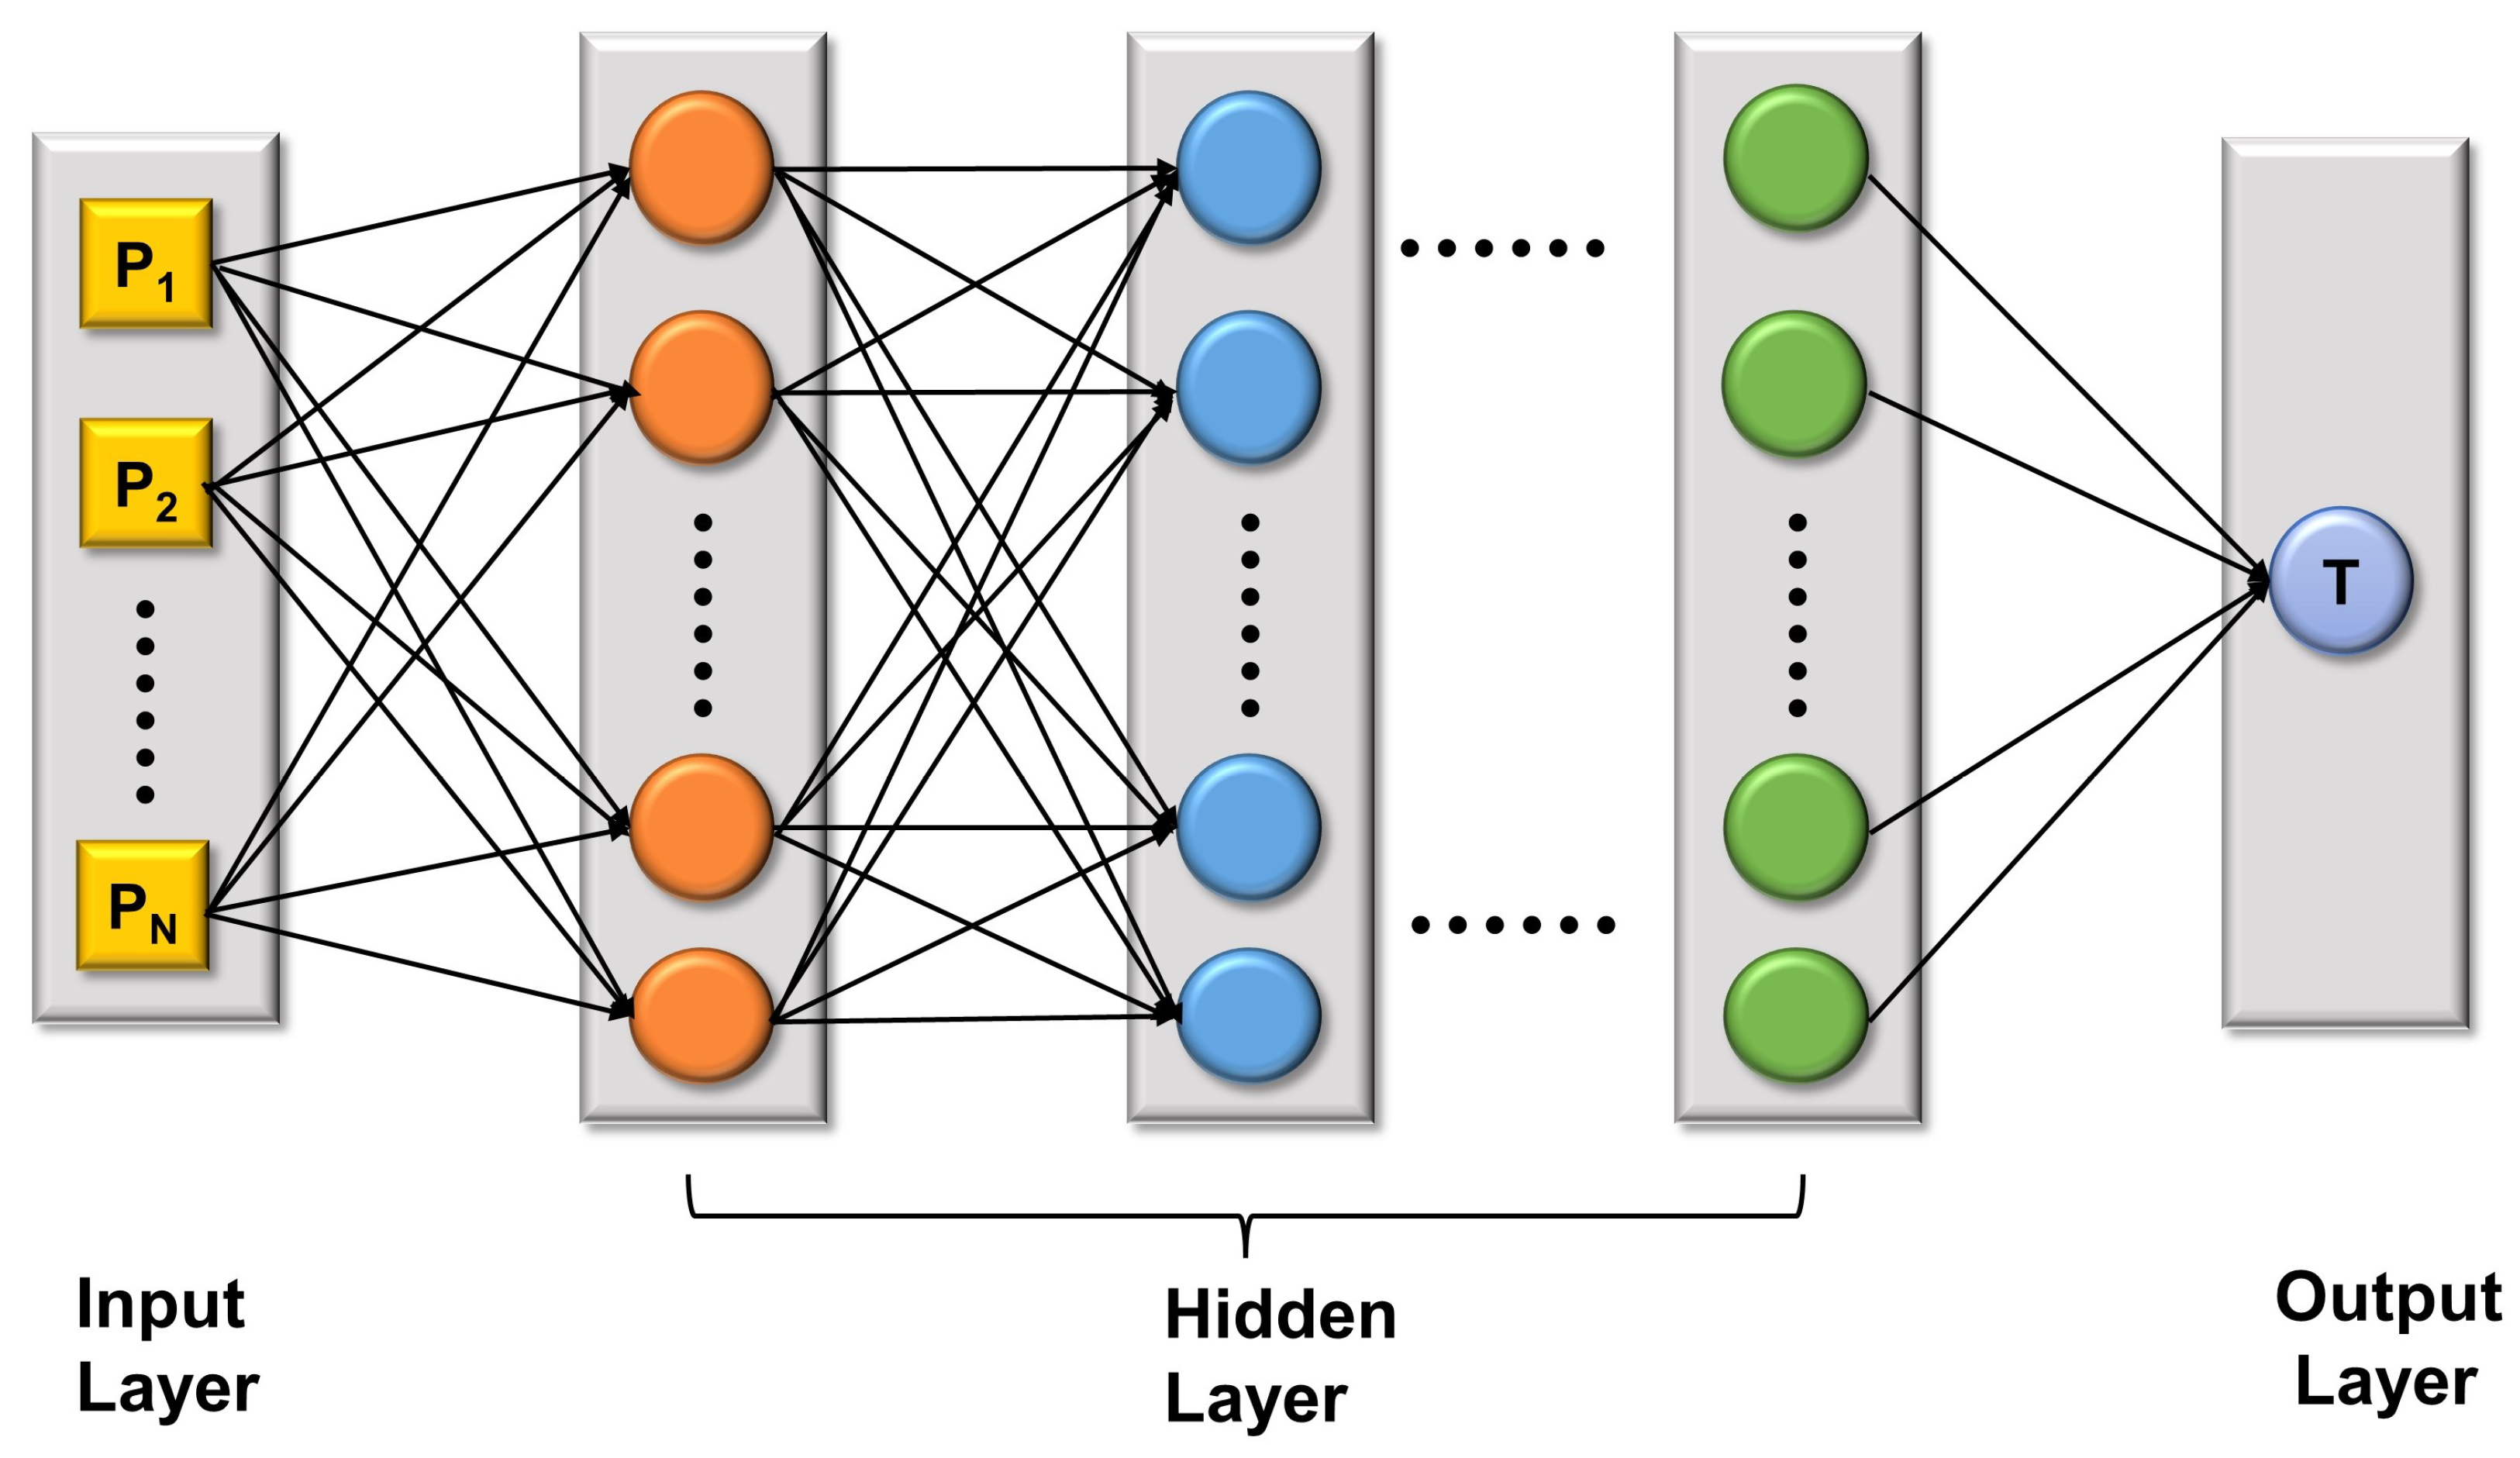
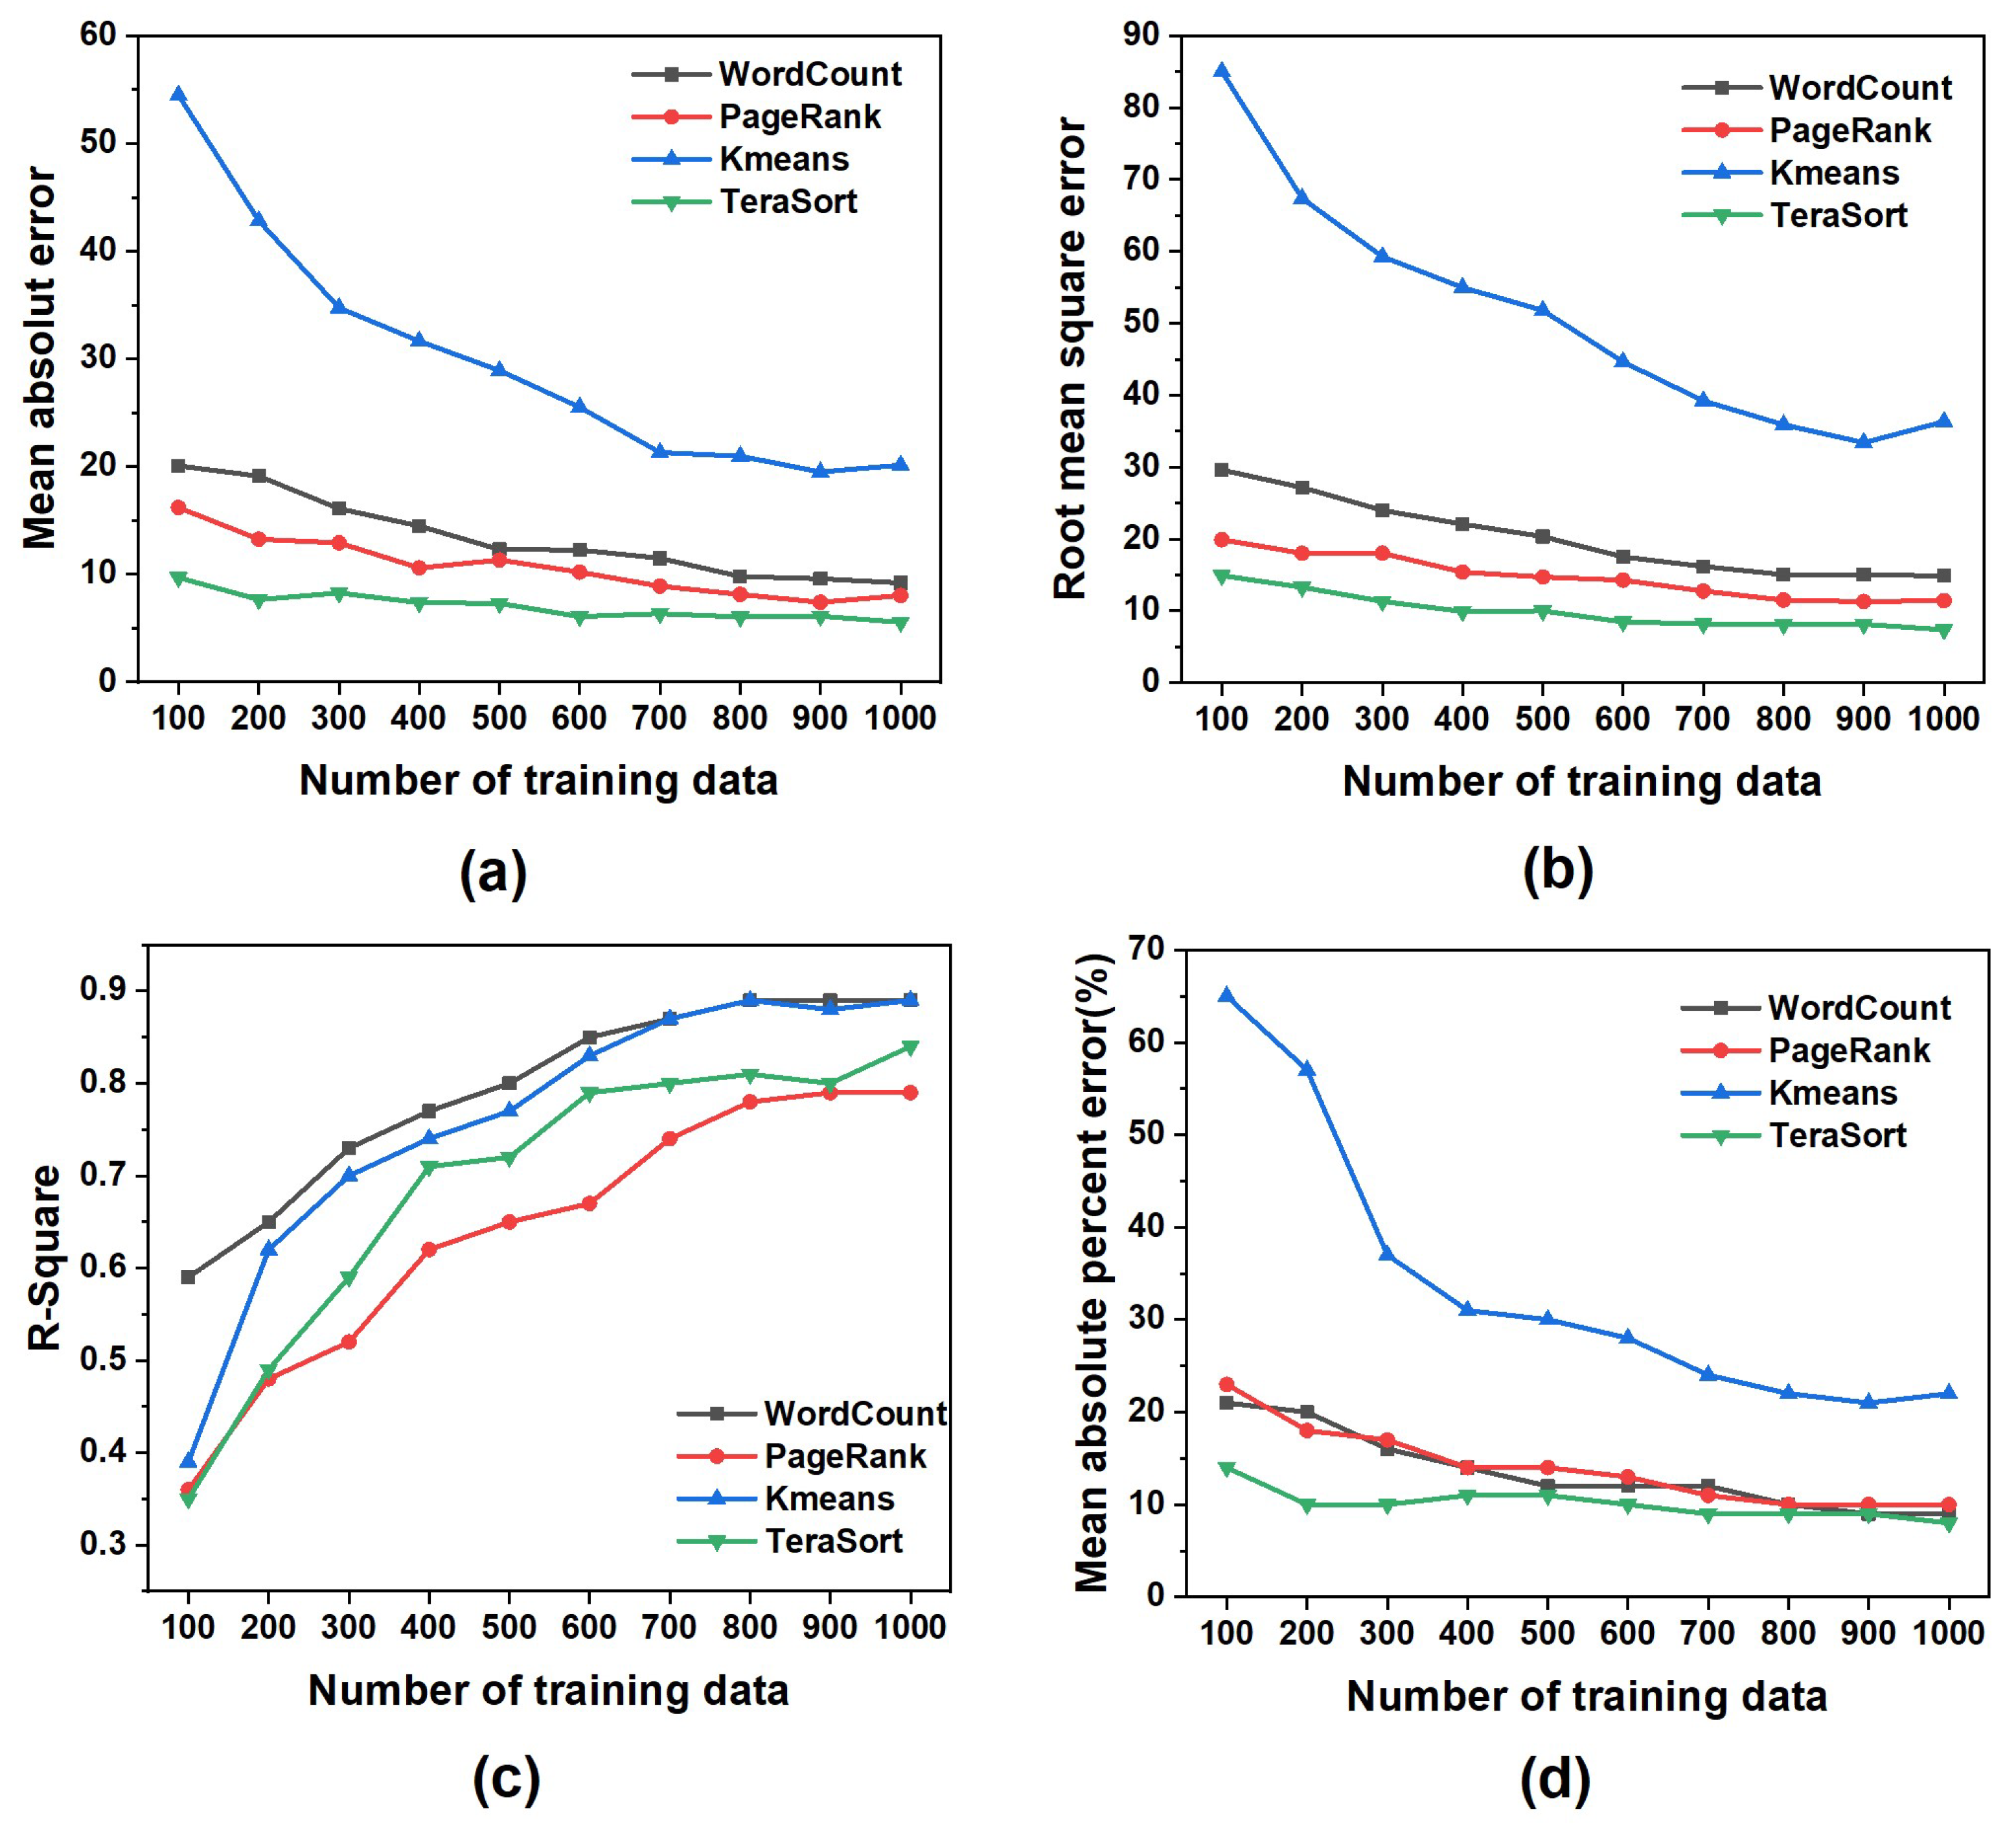
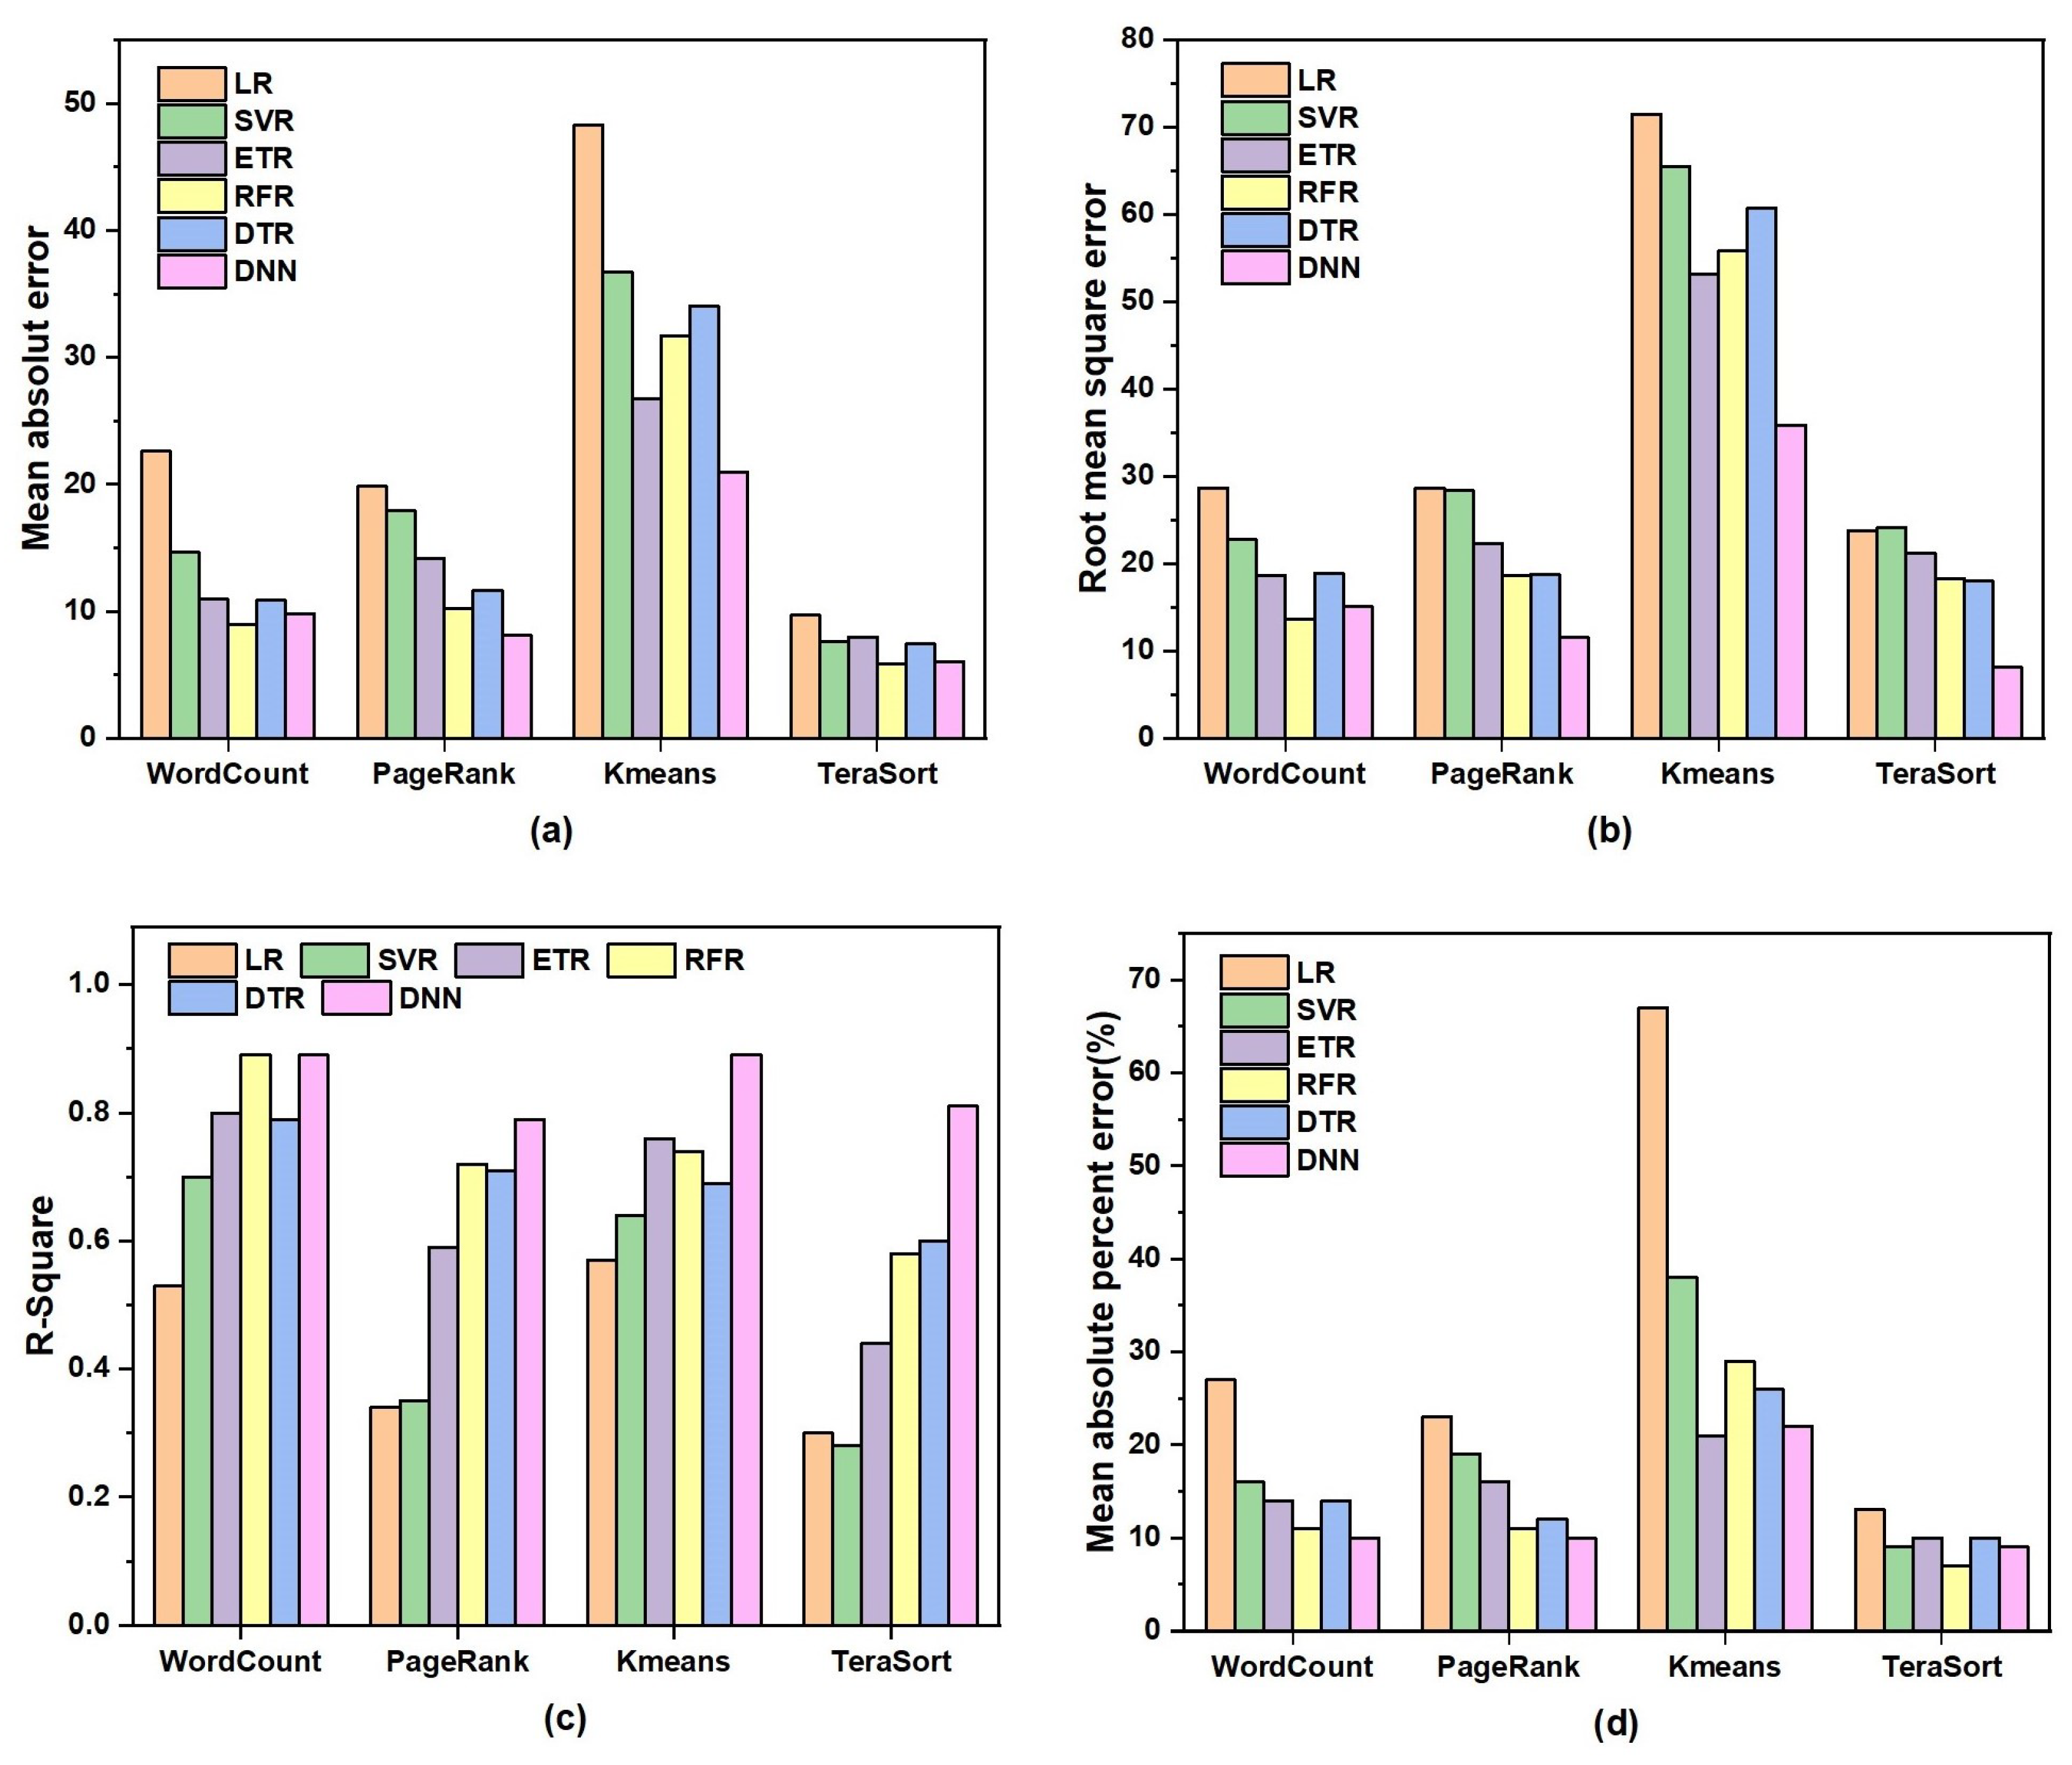
- We built a Spark application performance prediction model on the basis of a deep neural network, and verified the accuracy and usability of the model from multiple perspectives through experiments.
- On the basis of the Q-learning algorithm, we improved the optimal searching algorithm to explore unknown areas of the configuration parameter space, avoid local optimal solutions, and find a suitable parameter configuration for Spark applications in a short period of time.
2. Related Work
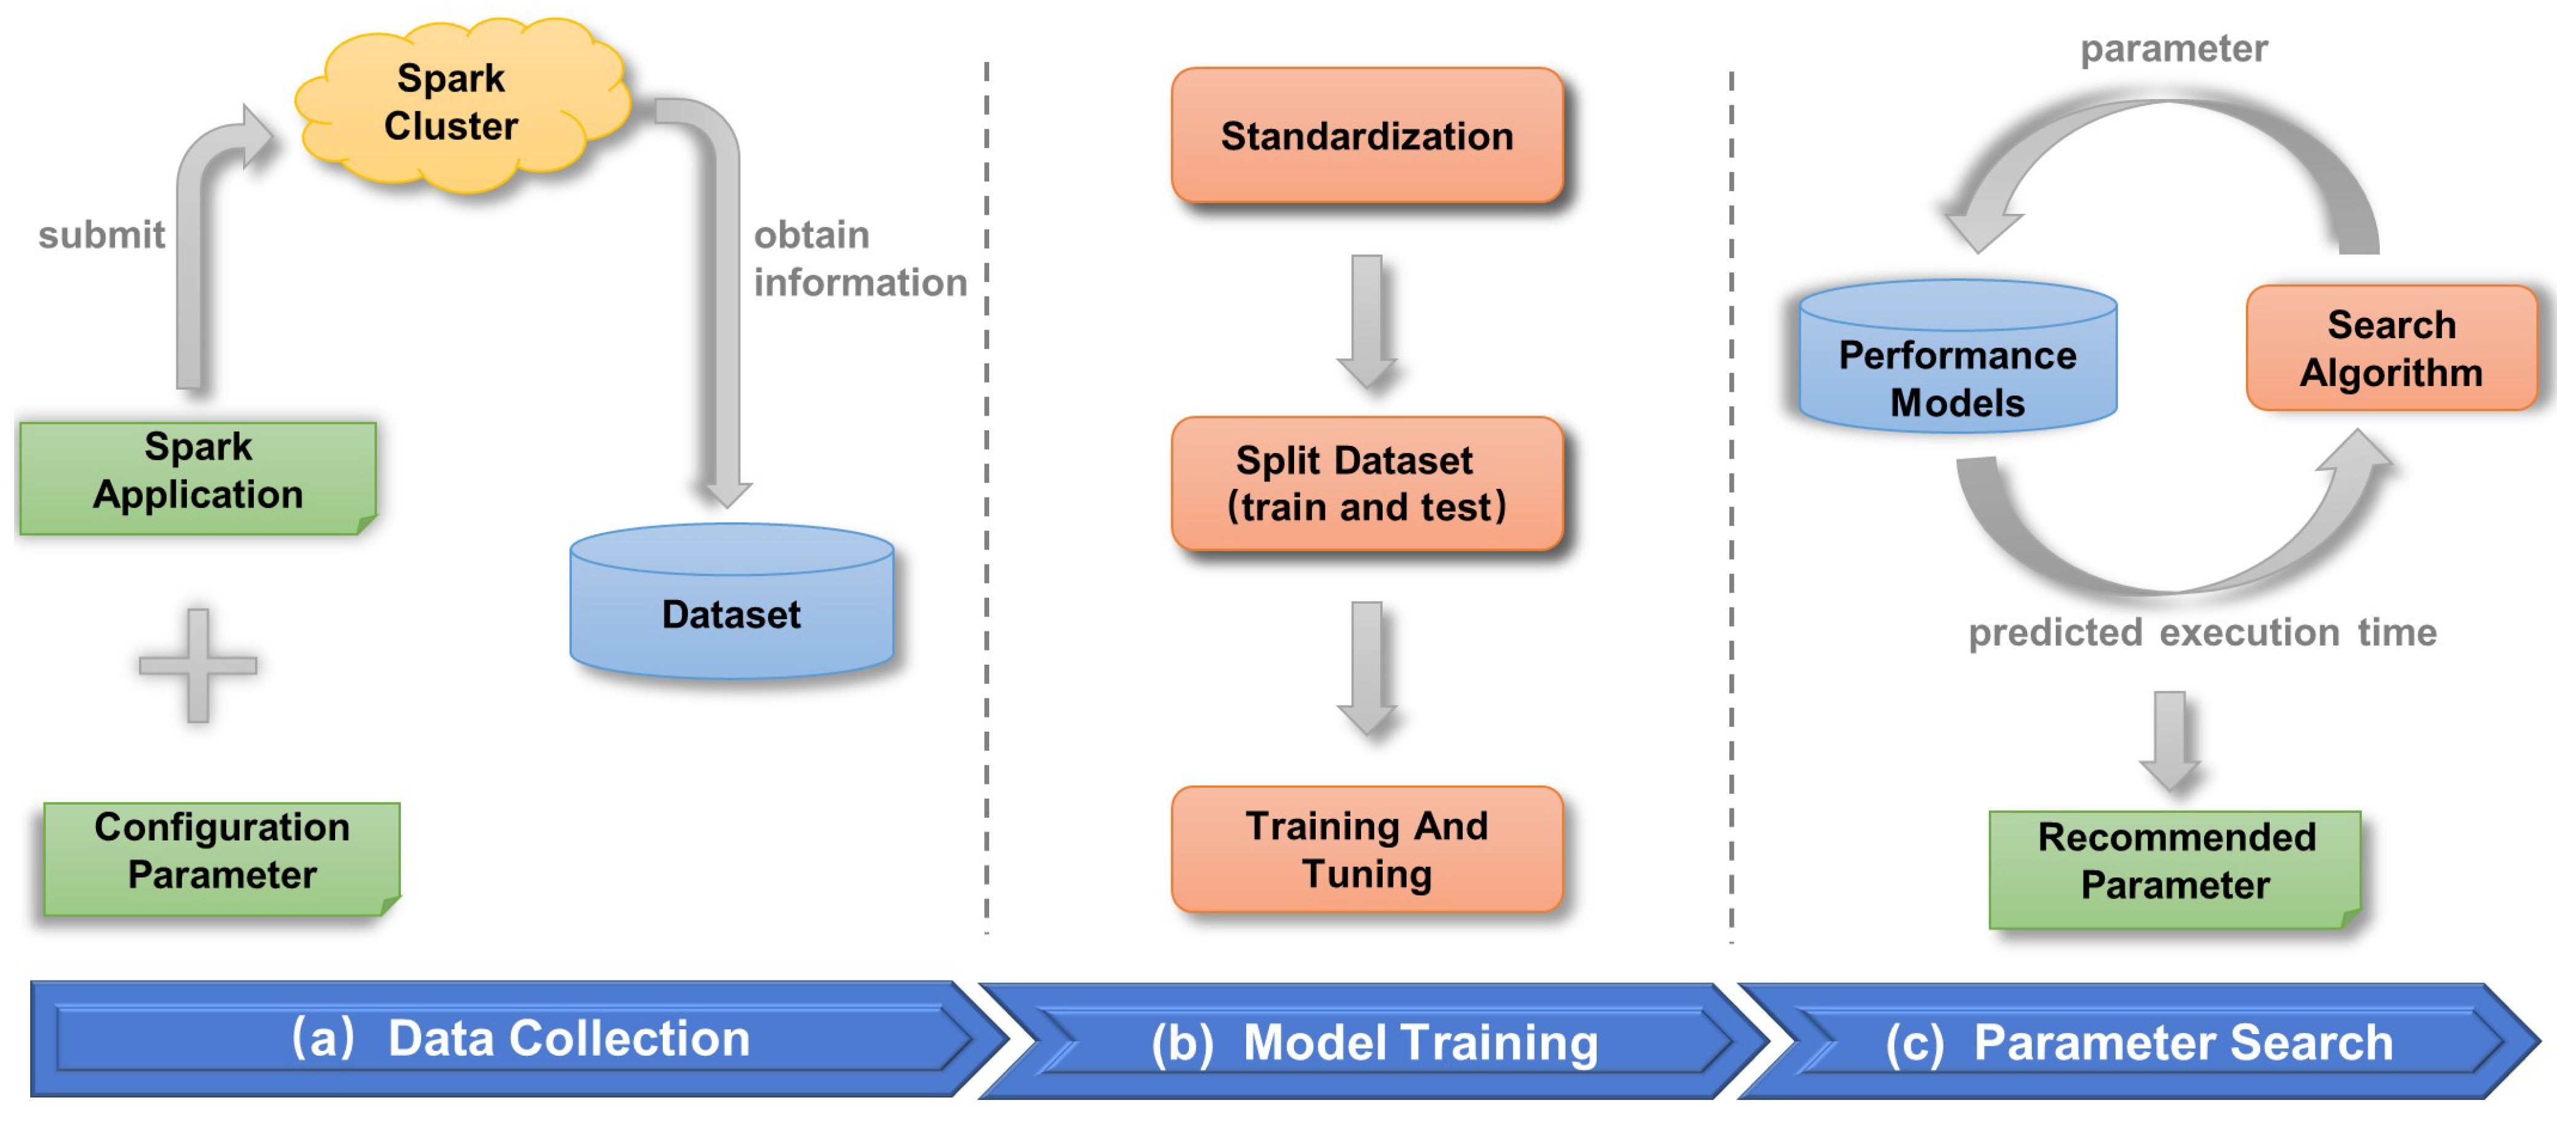
3. Methods
3.1. Data Collection and Preprocessing
3.1.1. Parameter Selection
3.1.2. Data Preprocessing
3.2. Performance Prediction Model
3.3. Parameter Searching
| Algorithm 1 The process of the improved Q-learning algorithm. |
Input: State List S = [, , , …, ]; Qtable List Q = [, , , …, ]; Output: bestConf; 1: initQtable(S, Q) 2: bestState = 3: for round from 1 to rounds do 4: s = bestState //Store the best state 5: while ratio > 0.1 do 6: a = chooseAction( s ) //use the -greedy strategy to select the action 7: = getOrCreateState(s, ) //if the state exists, return, does not exist, create and return 8: t, = getTime(s, ) //obtain the predicted execution time of the Spark application corresponding to the status 9: r = t − //use the time difference as a timely reward 10: updateQtable() // update Qtable according to Formula (7) 11: if < getTime( bestState ) then 12: bestState = //store the best state 13: ratio = (t − )/t //compute the ratio of performance improvement 14: s = 15: return bestState |
4. Experiments
4.1. Experimental Setup
4.2. Performance Metrics
4.3. Experimental Results
5. Conclusions
Author Contributions
Funding
Institutional Review Board Statement
Informed Consent Statement
Data Availability Statement
Acknowledgments
Conflicts of Interest
References
- Zaharia, M.; Xin, R.S.; Wendell, P.; Das, T.; Armbrust, M.; Dave, A.; Meng, X.; Rosen, J.; Venkataraman, S.; Franklin, M.J.; et al. Apache spark: A unified engine for big data processing. Commun. ACM 2016, 59, 56–65. [Google Scholar] [CrossRef]
- Zaharia, M.; Chowdhury, M.; Das, T.; Dave, A.; Ma, J.; McCauly, M.; Franklin, M.J.; Shenker, S.; Stoica, I. Resilient Distributed Datasets: A {Fault-Tolerant} Abstraction for {In-Memory} Cluster Computing. In Proceedings of the 9th USENIX Symposium on Networked Systems Design and Implementation (NSDI 12), San Jose, CA, USA, 25–27 April 2012; pp. 15–28. [Google Scholar]
- Cheng, G.; Ying, S.; Wang, B.; Li, Y. Efficient performance prediction for apache spark. J. Parallel Distrib. Comput. 2021, 149, 40–51. [Google Scholar] [CrossRef]
- Esmaeilzadeh, A.; Heidari, M.; Abdolazimi, R.; Hajibabaee, P.; Malekzadeh, M. Efficient large scale nlp feature engineering with apache spark. In Proceedings of the 2022 IEEE 12th Annual Computing and Communication Workshop and Conference (CCWC), Las Vegas, NV, USA, 26–29 January 2022; pp. 0274–0280. [Google Scholar]
- Haggag, M.; Tantawy, M.M.; El-Soudani, M.M. Implementing a deep learning model for intrusion detection on apache spark platform. IEEE Access 2020, 8, 163660–163672. [Google Scholar] [CrossRef]
- Roghani, H.; Bouyer, A.; Nourani, E. PLDLS: A novel parallel label diffusion and label Selection-based community detection algorithm based on Spark in social networks. Expert Syst. Appl. 2021, 183, 115377. [Google Scholar] [CrossRef]
- Yu, Z.; Bei, Z.; Qian, X. Datasize-aware high dimensional configurations auto-tuning of in-memory cluster computing. In Proceedings of the Twenty-Third International Conference on Architectural Support for Programming Languages and Operating Systems, Williamsburg, VA, USA, 24–28 March 2018; pp. 564–577. [Google Scholar]
- Gao, Z.; Wang, T.; Wang, Q.; Yang, Y. Execution Time Prediction for Apache Spark. In Proceedings of the 2018 International Conference on Computing and Big Data, Charleston, SC, USA, 8–10 September 2018; pp. 47–51. [Google Scholar]
- Rahman, M.A.; Hossen, J.; Sultana, A.; Al Mamun, A.; Aziz, N.A.A. A smart method for spark using neural network for big data. Int. J. Electr. Comput. Eng. 2021, 11, 2525. [Google Scholar] [CrossRef]
- Feng, Q.; Chen, L.; Chen, C.P.; Guo, L. Deep fuzzy clustering—A representation learning approach. IEEE Trans. Fuzzy Syst. 2020, 28, 1420–1433. [Google Scholar] [CrossRef]
- Baker, B.; Gupta, O.; Naik, N.; Raskar, R. Designing neural network architectures using reinforcement learning. arXiv 2016, arXiv:1611.02167. [Google Scholar]
- Zhong, Z.; Yang, Z.; Deng, B.; Yan, J.; Wu, W.; Shao, J.; Liu, C.L. Blockqnn: Efficient block-wise neural network architecture generation. IEEE Trans. Pattern Anal. Mach. Intell. 2020, 43, 2314–2328. [Google Scholar] [CrossRef] [PubMed] [Green Version]
- Herodotou, H.; Chen, Y.; Lu, J. A survey on automatic parameter tuning for big data processing systems. ACM Comput. Surv. (CSUR) 2020, 53, 1–37. [Google Scholar] [CrossRef]
- Gounaris, A.; Torres, J. A methodology for spark parameter tuning. Big Data Res. 2018, 11, 22–32. [Google Scholar] [CrossRef] [Green Version]
- Singhal, R.; Singh, P. Performance assurance model for applications on SPARK platform. In Proceedings of the Technology Conference on Performance Evaluation and Benchmarking, Munich, Germany, 28 August 2017; pp. 131–146. [Google Scholar]
- Huang, S.; Xu, J.; Liu, R.; Liao, H. A novel compression algorithm decision method for spark shuffle process. In Proceedings of the 2017 IEEE International Conference on Big Data (Big Data), Boston, MA, USA, 11–14 December 2017; pp. 2931–2940. [Google Scholar]
- Wang, G.; Xu, J.; He, B. A novel method for tuning configuration parameters of spark based on machine learning. In Proceedings of the 2016 IEEE 18th International Conference on High Performance Computing and Communications; IEEE 14th International Conference on Smart City; IEEE 2nd International Conference on Data Science and Systems (HPCC/SmartCity/DSS), Sydney, Australia, 12–14 December 2016; pp. 586–593. [Google Scholar]
- Islam, M.T.; Karunasekera, S.; Buyya, R. dSpark: Deadline-based resource allocation for big data applications in Apache Spark. In Proceedings of the 2017 IEEE 13th International Conference on E-Science (e-Science), Auckland, New Zealand, 24–27 October 2017; pp. 89–98. [Google Scholar]
- Chao, Z.; Shi, S.; Gao, H.; Luo, J.; Wang, H. A gray-box performance model for apache spark. Future Gener. Comput. Syst. 2018, 89, 58–67. [Google Scholar] [CrossRef]
- Shah, S.; Amannejad, Y.; Krishnamurthy, D.; Wang, M. PERIDOT: Modeling Execution Time of Spark Applications. IEEE Open J. Comput. Soc. 2021, 2, 346–359. [Google Scholar] [CrossRef]
- Gu, J.; Li, Y.; Tang, H.; Wu, Z. Auto-tuning spark configurations based on neural network. In Proceedings of the 2018 IEEE International Conference on Communications (ICC), Kansas City, MO, USA, 20–24 May 2018; pp. 1–6. [Google Scholar]
- Tooley, R. Auto-Tuning Spark with Bayesian Optimisation. Available online: https://www.cl.cam.ac.uk/~ey204/pubs/MPHIL_P3/2021_Ross.pdf (accessed on 26 June 2022).
- Patanshetti, T.; Pawar, A.A.; Patel, D.; Thakare, S. Auto Tuning of Hadoop and Spark parameters. arXiv 2021, arXiv:2111.02604. [Google Scholar]
- Karau, H.; Warren, R. High Performance Spark: Best Practices for Scaling and Optimizing Apache Spark; O’Reilly Media, Inc.: Sebastopol, CA, USA, 2017. [Google Scholar]
- Apache. Spark Configuration. 2022. Available online: https://spark.apache.org/docs/latest/configuration.html (accessed on 26 June 2022).
- Petridis, P.; Gounaris, A.; Torres, J. Spark parameter tuning via trial-and-error. In Proceedings of the INNS Conference on Big Data, Thessaloniki, Greece, 23–25 October 2016; pp. 226–237. [Google Scholar]
- Huang, S.; Huang, J.; Dai, J.; Xie, T.; Huang, B. The HiBench benchmark suite: Characterization of the MapReduce-based data analysis. In Proceedings of the 2010 IEEE 26th International Conference on Data Engineering Workshops (ICDEW 2010), Long Beach, CA, USA, 1–6 March 2010; pp. 41–51. [Google Scholar]
- Herodotou, H.; Lim, H.; Luo, G.; Borisov, N.; Dong, L.; Cetin, F.B.; Babu, S. Starfish: A Self-tuning System for Big Data Analytics. Cidr 2011, 11, 261–272. [Google Scholar]
- Sutton, R.S.; Barto, A.G. Reinforcement Learning: An Introduction; MIT Press: Cambridge, MA, USA, 2018. [Google Scholar]


| Spark Parameters | Function | Default | Range/Step |
|---|---|---|---|
| spark.executor.cores | Number of cores to use on each executor | 1 | 1–8, 1 |
| spark.executor.memory | Amount of memory to use per executor process | 1 | 1–8, 1 |
| spark.executor.instances | Number of executors | 2 | 2–8,1 |
| spark.driver.cores | Number of cores to use for the driver process | 1 | 1–4, 1 |
| spark.driver.memory | Amount of memory to use for the driver process | 1 g | 1–4, 1 |
| spark.reducer.maxSizeInFlight | Maximal size of map outputs to fetch simultaneously from each reduce task | 48 m | 48–96, 8 |
| spark.shuffle.compress | Whether to compress map output files | true | true, false |
| spark.shuffle.spill.compress | Whether to compress data spilled during shuffles | true | true, false |
| spark.shuffle.file.buffer | Size of the inmemory buffer for each shuffle file output stream | 32 k | 32–128, 16 |
| spark.broadcast.blockSize | Size of each piece of a block for TorrentBroadcastFactory | 4 m | 4–24, 2 |
| spark.broadcast.compress | Whether to compress broadcast variables before sending them | true | true, false |
| spark.memory.fraction | Fraction of (heap space—300 MB) used for execution and storage | 0.6 | 0.3–0.8, 0.1 |
| spark.memory.storageFraction | Amount of storage memory | 0.5 | 0.3-0.8, 0.1 |
| spark.rpc.message.maxSize | Maximal message size to allow in “control plane” communication | 128 m | 128–256, 32 |
| spark.rdd.compress | Whether to compress serialized RDD partitions | false | true, false |
| spark.io.compression.codec | The codec used to compress internal data such as RDD partitions, event logs, broadcast variables, and shuffle outputs | lz4 | Lz4, snappy |
| Algorithms | WordCount | PageRank | Kmeans | TeraSort | ||||
|---|---|---|---|---|---|---|---|---|
| Value (s) 1 | Time (ms) 2 | Value (s) 1 | Time (ms) 2 | Value (s) 1 | Time (ms) 2 | Value (s) 1 | Time (ms) 2 | |
| Rand | 51.9 | 653.0 | 50.5 | 463.8 | 26.2 | 589.4 | 42.6 | 818.6 |
| Simulated Annealing | 50.9 | 830.6 | 49.4 | 835.8 | 25.8 | 854.0 | 41.8 | 905.4 |
| Q-learning | 50.2 | 463.8 | 49.6 | 435.0 | 26.1 | 296.4 | 42.5 | 358.0 |
| Spark Application | Time (s) |
|---|---|
| WordCount | 61.571 |
| PageRank | 61.402 |
| Kmeans | 61.543 |
| TeraSort | 61.345 |
| Parameter | Default | Recommend | |||
|---|---|---|---|---|---|
| WordCount | PageRank | Kmeans | TeraSort | ||
| spark.executor.cores | 1 | 8 | 6 | 7 | 5 |
| spark.executor.memory | 1 g | 5 g | 4 g | 4 g | 7 g |
| spark.executor.instances | 2 | 4 | 5 | 5 | 6 |
| spark.driver.cores | 1 | 2 | 3 | 3 | 3 |
| spark.driver.memory | 1 g | 3 g | 1 g | 2 g | 3 g |
| spark.reducer.maxSizeInFlight | 48 m | 48 m | 72 m | 56 m | 36 m |
| spark.shuffle.compress | true | true | true | false | true |
| spark.shuffle.spill.compress | true | true | false | true | false |
| spark.shuffle.file.buffer | 32 k | 48 k | 96 k | 48 k | 112 k |
| spark.broadcast.blockSize | 4 m | 4 m | 10 m | 6 m | 6 m |
| spark.broadcast.compress | true | true | false | true | false |
| spark.memory.fraction | 0.6 | 0.4 | 0.7 | 0.5 | 0.4 |
| spark.memory.storageFraction | 0.5 | 0.6 | 0.5 | 0.5 | 0.4 |
| spark.rpc.message.maxSize | 128 m | 256 m | 128 m | 192 m | 160 m |
| spark.rdd.compress | false | true | false | false | true |
| spark.io.compression.code | lz4 | lz4 | snappy | lz4 | snappy |
Publisher’s Note: MDPI stays neutral with regard to jurisdictional claims in published maps and institutional affiliations. |
© 2022 by the authors. Licensee MDPI, Basel, Switzerland. This article is an open access article distributed under the terms and conditions of the Creative Commons Attribution (CC BY) license (https://creativecommons.org/licenses/by/4.0/).
Share and Cite
Huang, X.; Zhang, H.; Zhai, X. A Novel Reinforcement Learning Approach for Spark Configuration Parameter Optimization. Sensors 2022, 22, 5930. https://doi.org/10.3390/s22155930
Huang X, Zhang H, Zhai X. A Novel Reinforcement Learning Approach for Spark Configuration Parameter Optimization. Sensors. 2022; 22(15):5930. https://doi.org/10.3390/s22155930
Chicago/Turabian StyleHuang, Xu, Hong Zhang, and Xiaomeng Zhai. 2022. "A Novel Reinforcement Learning Approach for Spark Configuration Parameter Optimization" Sensors 22, no. 15: 5930. https://doi.org/10.3390/s22155930
APA StyleHuang, X., Zhang, H., & Zhai, X. (2022). A Novel Reinforcement Learning Approach for Spark Configuration Parameter Optimization. Sensors, 22(15), 5930. https://doi.org/10.3390/s22155930