1. Introduction
With the advances in the smart sensor and Industrial Internet of Things (IIoT) technologies, the development of intelligent manufacturing has been accelerated dramatically [
1,
2,
3]. In modern manufacturing, intelligentization can help manufacturers at present to rise to the challenge of remaining ahead in the highly competitive market. The continuously improved sensor technology and data processing capability with big data, artificial intelligence, cloud computing, and edge technology are widely used in industrial equipment, process control, and factory management, leading to the further development of intelligent manufacturing. Intelligent manufacturing combines real-time data analysis, artificial intelligence (AI), and other machine learning technologies in manufacturing to improve production quality, reliability, and resource efficiency [
4,
5,
6]. Sensors are attached to the manufacturing machines to collect and process real-time data through sensor networks for intelligent manufacturing, whereas AI algorithms based on the acquired data are designed to coordinate all operations of the manufacturing, such as equipment maintenance, manufacturing practices, and final product testing.
The condition of manufacturing systems needs to be monitored because they have become more complex with multiple functions [
7,
8]. A malfunctioning component can halt the manufacturing system. Information acquisition and analysis techniques are required to face these challenges because manufacturing systems have become more complex. Condition monitoring (CM) observes machinery condition parameters to identify changes and anomalies that indicate developing faults, reduce unexpected machine downtime, and ensure effective maintenance through intelligent manufacturing technologies [
9,
10], thereby reducing manufacturing costs and improving product quality to maintain competitiveness.
The IIoT extends information technology to operational technology by combining networked sensors and intelligent devices for applications in manufacturing systems, including data collection to drive artificial intelligence and adding intelligence to manufacturing equipment, processes, and management [
11]. IIoT technology uses sensor nodes to collect massive data, improve production and manufacturing efficiency with the minimal cost through manufacturing operation visibility and data analysis, and continuously optimize manufacturing processes. The implementation of the IIoT is expected to help industrial manufacturing enterprises improve productivity, grow businesses, and improve customer service. IIoT sensors help the platform to collect data from the various modules of the system and allow our packaging equipment to be more efficient and productive. IIoT sensor nodes monitor the manufacturing process, evaluate the status of environmental conditions, predict the potential safety threats of systems, and allow critical maintenance operations to be completed online. These data can then be transferred to the controller of the system and processed by powerful analytics software that enables manufacturing modules to optimize manufacturing operations for improved performance. The IIoT platform is used to perform predictive analytics for the maintenance of the manufacturing system. Predictive analytics can identify failures and estimate the operating life of specific components with IIoT sensors, continuously collecting the sensor data of the system to monitor its status. Based on this data analysis, manufacturing machines can be repaired, or their components can be replaced in advance to minimize disruptions.
To obtain a more stable and efficient IIoT system, edge computing devices are deployed between cloud servers and the IIoT sensors and close to the sensors on the manufacturing machines to monitor the machine’s condition [
12,
13]. Edge devices can collect, process, and store data in a more distributed fashion and closer to the endpoints, hastening response times, reducing latency, and conserving network resources. In addition, edge computing reduces data transmission and network traffic. The distributed edge computing devices cause low latency processing to the shop floor and offload computing from the cloud servers to the edge devices. However, the computational capabilities and resources of edge devices are limited. Thus, an on-device program of the devices can help data preprocessing to reduce the data transmission and algorithm computing on the cloud servers efficiently.
Anomaly detection can identify the deteriorating condition of the machine by observing the exceptional patterns during the normal operation of the equipment. The anomalies are the early signs of system failure, which may lead to systematic faults or equipment breakdown [
14,
15]. However, only 20 percent of all anomalies in manufacturing are predicted and understood beforehand [
16]. Vibration analysis is a fundamental method to monitor and diagnose the machine’s condition with the vibration amplitude and frequency, given that the vibration sensor can be installed on the machines to monitor system conditions without breaking the structures. Static thresholding is one of the simplest techniques to identify anomalous sequences within a time series; an alert is raised whenever a data point exceeds the expected range. However, this approach often fails to detect contextual anomalies because the machine’s condition changes.
Traditional statistical methods are used for anomaly detection at the early stages. Statistical anomaly detection techniques assume that normal data instances occur in high probability regions of a stochastic model, whereas anomalies occur in the low probability regions of the stochastic model [
17]. However, selecting the best statistic to construct hypothesis tests for complex distributions with high dimensional data sets is very difficult. The traditional methods of anomaly detection cannot deal well with the modern manufacturing industry problems.
Machine learning methods process data for anomaly detection with analytical model building automatically and simplify sensor dataset handling to detect the new types of anomalies by self-training. The machine learning methods for anomaly detection are classified into supervised and unsupervised approaches. Supervised algorithms are trained models with datasets that are already labeled as normal and abnormal. The algorithm then processes the real sensor data and detects anomalies based on the trained model. A supervised algorithm only detects the normal or abnormal categories on which it has been trained with the pre-labeled datasets. Thus, a supervised machine learning algorithm cannot recognize a pattern that has not been previously trained. The new type of anomaly should be trained by the supervised models continuously to obtain a more robust detection system for every possible data distribution and pattern. This condition is not always practical for real industrial manufacturing situations. Unsupervised machine learning algorithms, different from supervised learning approaches, learn the normal behavior without the pre-labeled datasets, and then statistical techniques are applied to determine if a specific data point is an anomaly because very few anomalies are available during the normal operations of the manufacturing. The unsupervised anomaly detection methods can detect any type of anomaly, even those never seen before.
The anomaly detection should work with large amounts of different data types, which are often unstructured. Therefore, traditional machine learning models face the challenges of dealing with these unstructured data. These models are trained on structured data that have input features with corresponding output labels, so the unstructured data cannot be directly used as input features. However, traditional machine learning methods build a single model of prediction for all anomaly detection entries, and the model parameters are difficult to fit through the high-dimensional data and sequence datasets. The datasets used by traditional methods to train the model may not contain abnormal signals because anomalies are rare in real manufacturing scenarios. In addition, anomalies that have occurred in the past may not be a perfect indication of problems occurring in the future because anomaly detection detects faults under time-varying operational conditions the in long-term running. Recently, many studies have been conducted with deep learning on condition monitoring for manufacturing machines, the fault features of which are automatically extracted from the sensor data by the deep learning methods, and the feature extractor is not reconstructed for every specific fault diagnosis. The deep learning approach uses the available data to learn the underlying model of the time series, enabling it to perform more complex anomaly detection tasks. However, most methods take directly raw time-series vibration signals as input. The large amount of data is a great burden on the system. The high volume of the sensor data is also challenging to the system’s ability for data transmission and processing. We proposed an edge-to-cloud condition monitoring platform for anomaly detection. The relative wavelet energy-based LSTM model is implemented, and the relative wavelet energy is computed on the edge layer to reduce the network traffic overhead and accelerate the model deployment.
The remainder of the paper is organized as follows: The methodology of the IIoT-based anomaly detection using relative wavelet energy and the LSTM model is discussed in
Section 3.
Section 4 describes the setup of the IIoT-based condition monitoring system deployed in a real shop site to validate the proposed anomaly detection method. The performance of the method is also discussed, based on the experimental results in this section. Finally, we conclude the study in
Section 6.
2. Setup for Hardware Platform
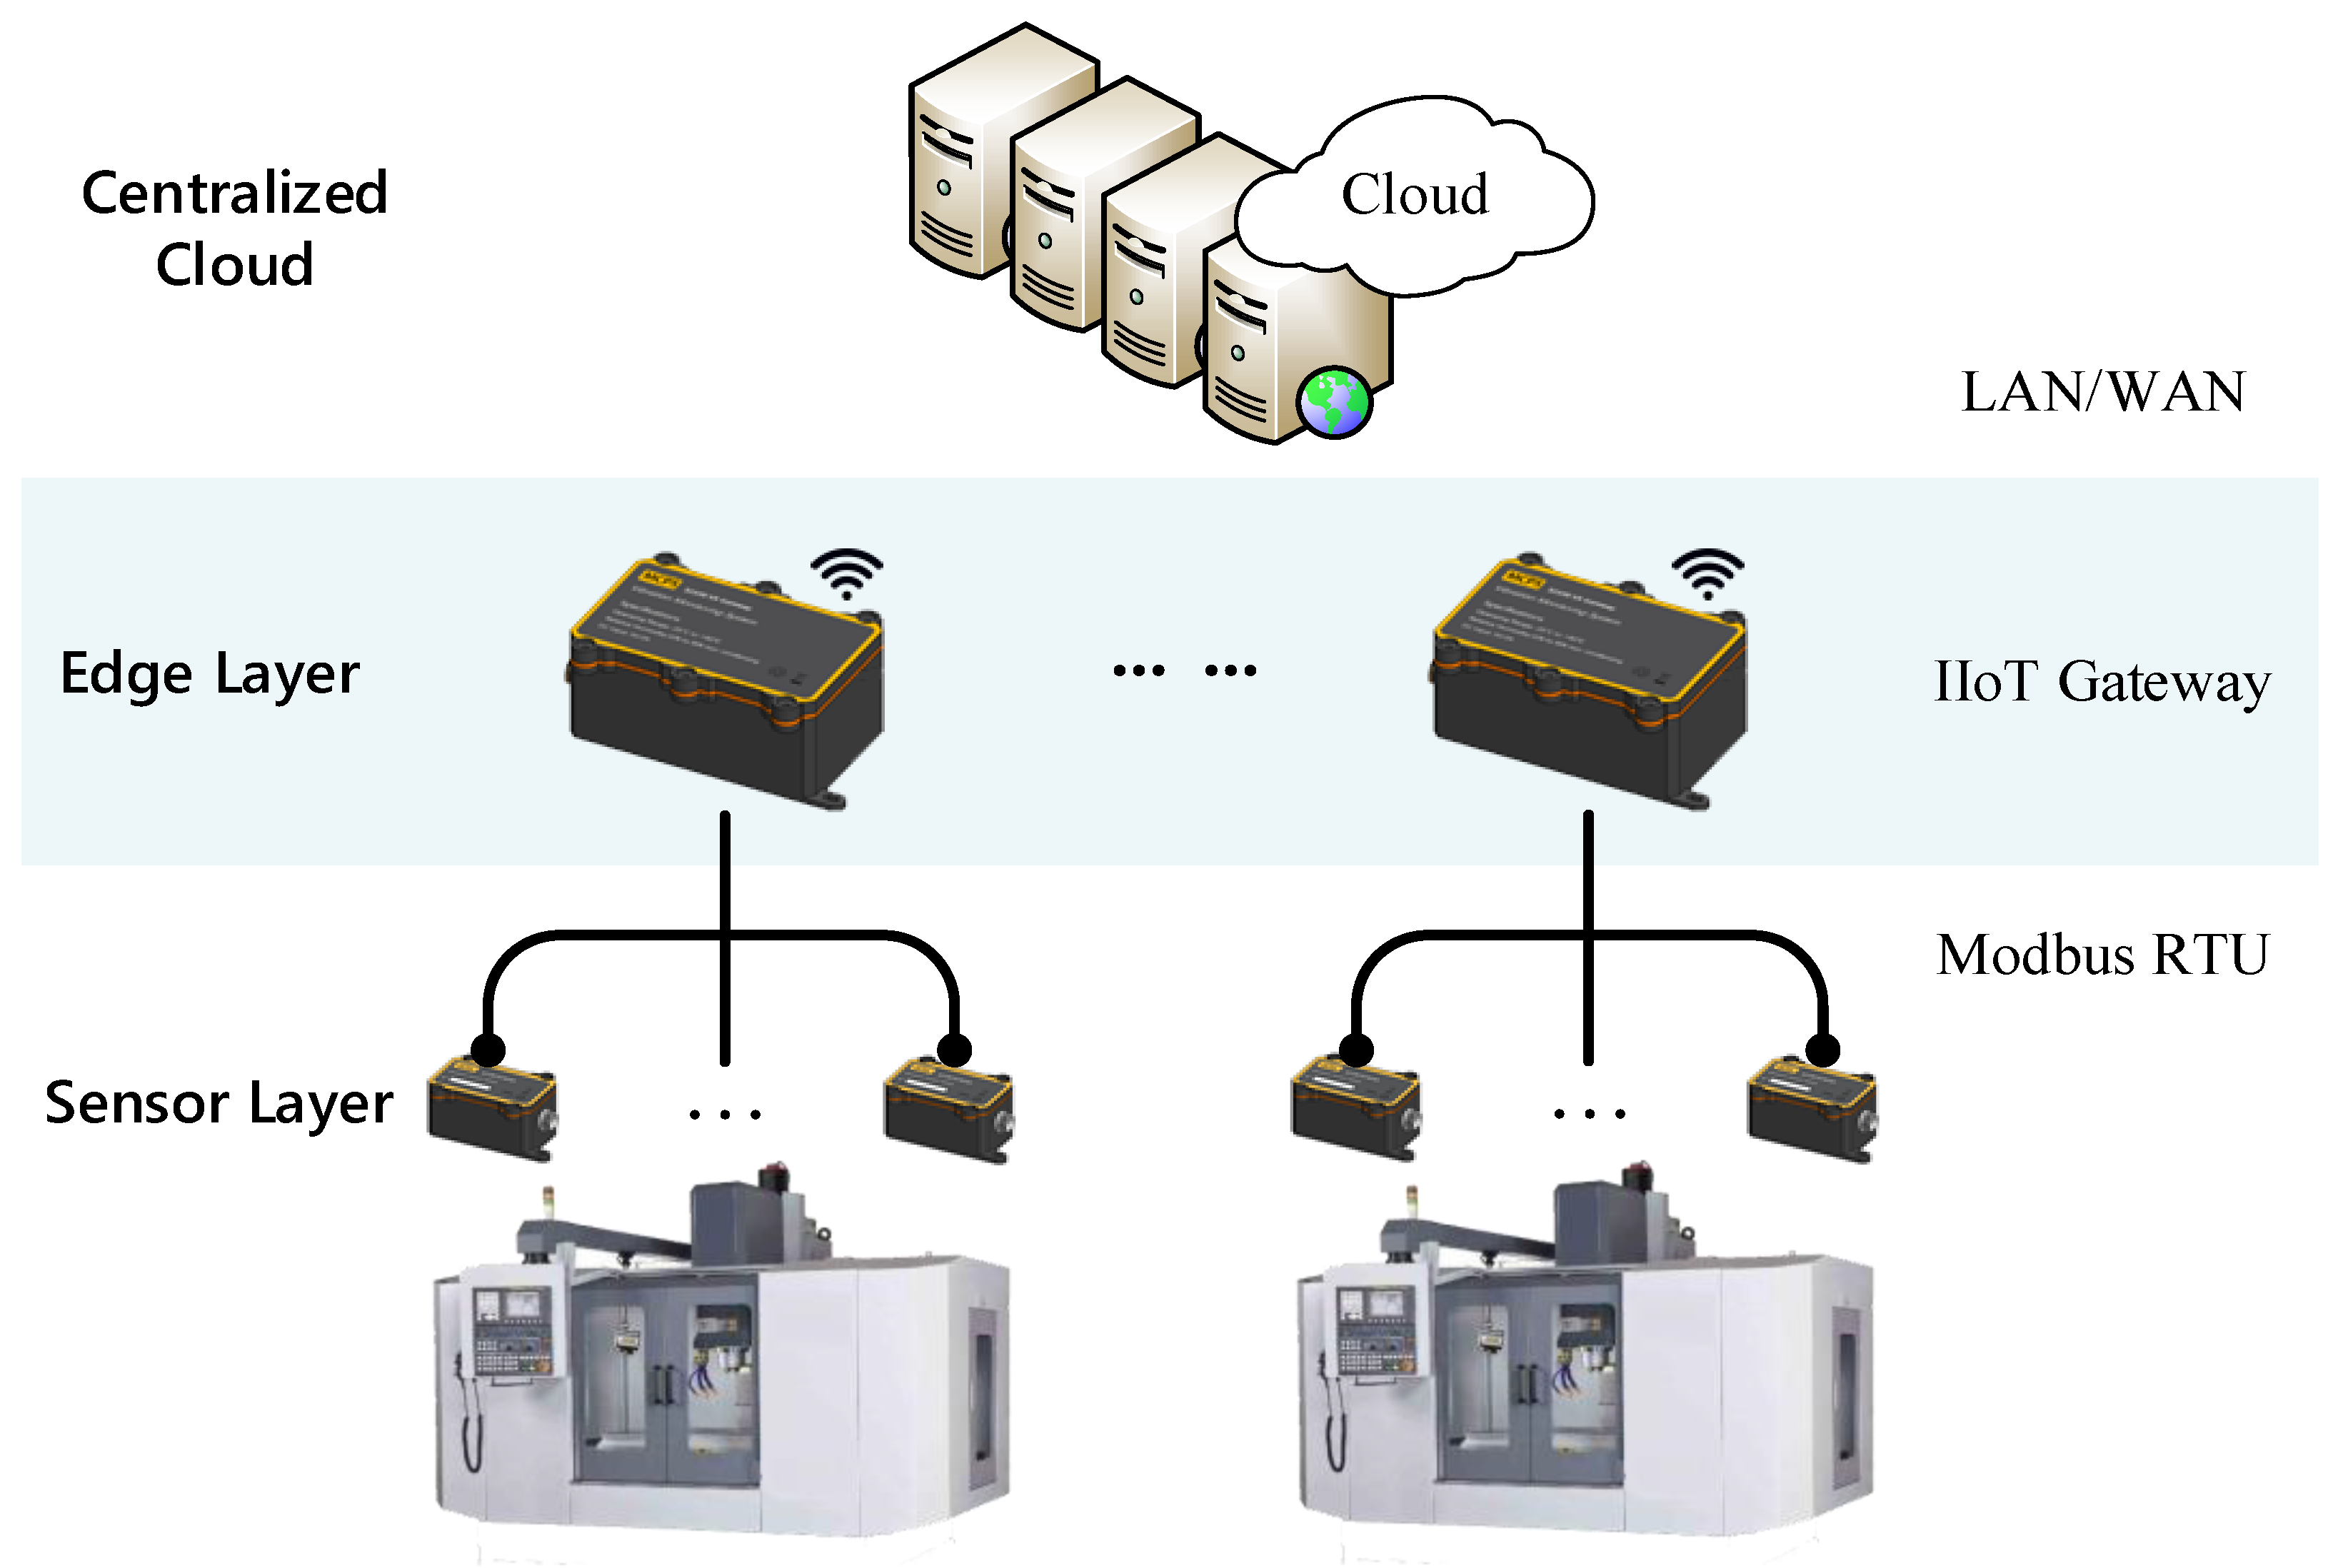
Machine condition monitoring is performed through IIoT devices organized as a hierarchy network. The proposed edge-to-cloud condition monitoring system with an unsupervised learning approach is illustrated in
Figure 1. This system consists of three layers, including a centralized cloud, edge layer, and sensor layer. Smart sensor devices on the sensor layer collect the vibration signal on the manufacturing machines. The IIoT gateways of the edge layer implement the functions of signal conditioning, data acquisition, and signal preprocessing, whereas the unsupervised learning algorithms on the centralized cloud servers monitor the condition of the manufacturing machines and detect faults.
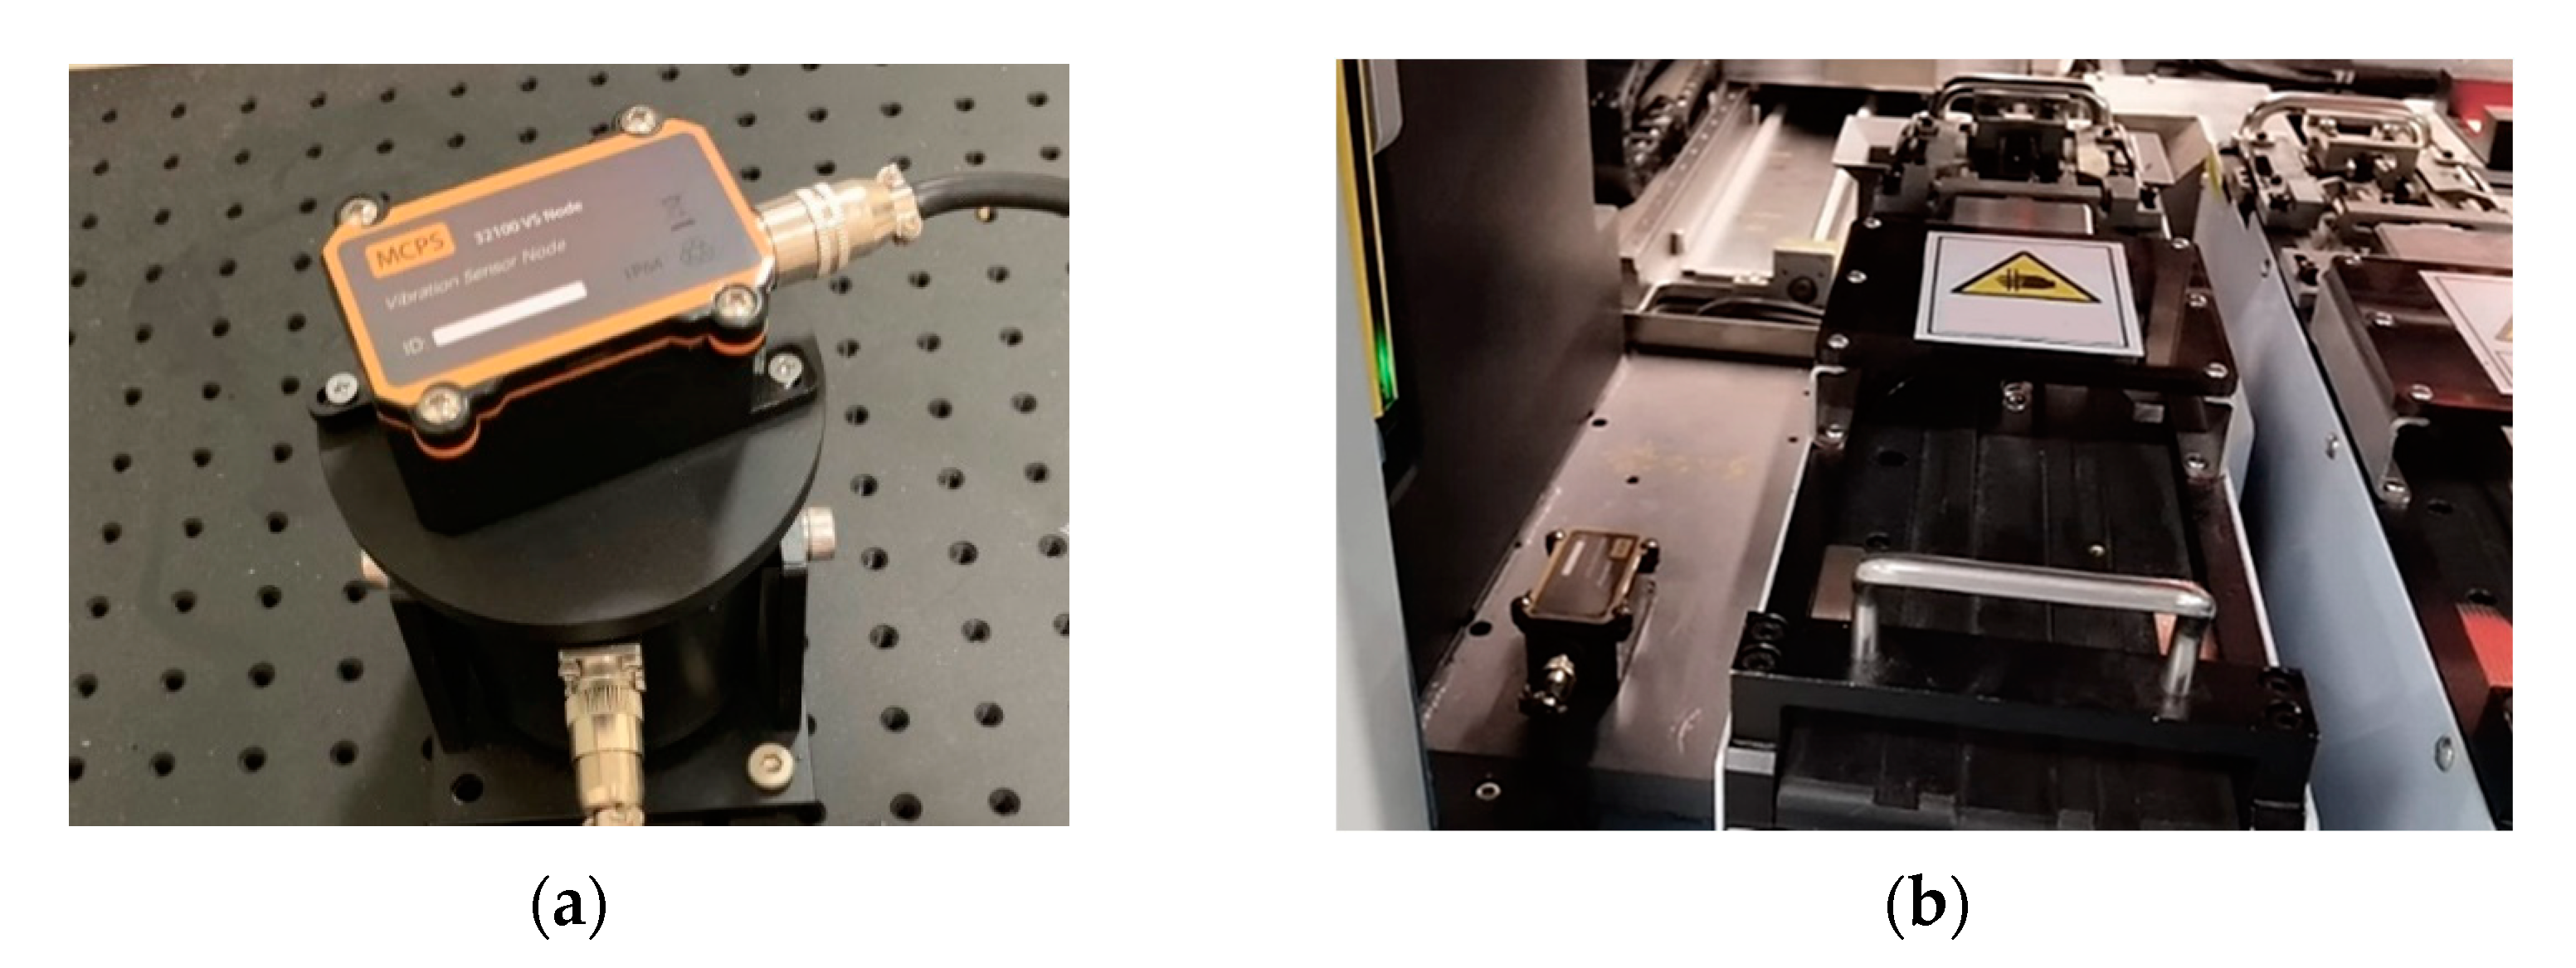
The smart sensor devices construct the sensor layer. Each sensor device consists of sensors, a signal conditioning circuit, communication components, a power management unit, and a microcontroller. The IIoT devices have been deployed in different places of the machines to collect sensor data in real-time. These sensor data represent the running state of the machines, and the devices transfer the sensor data through the IIoT sensor networks.
The IIoT gateway is deployed to connect the IIoT sensor network to the centralized cloud. To connect the cloud servers, the gateway supports a wired Ethernet connection and wireless networking protocols over the Internet. In addition, the gateway connects the smart sensor devices through RS485 using a Modbus RTU protocol. Modbus is a popular industrial protocol because it is simple and universal, especially for the compatibility of legacy industrial systems. This finding indicates that a Modbus connection can provide digital communications in older systems with new devices.
3. Methodology
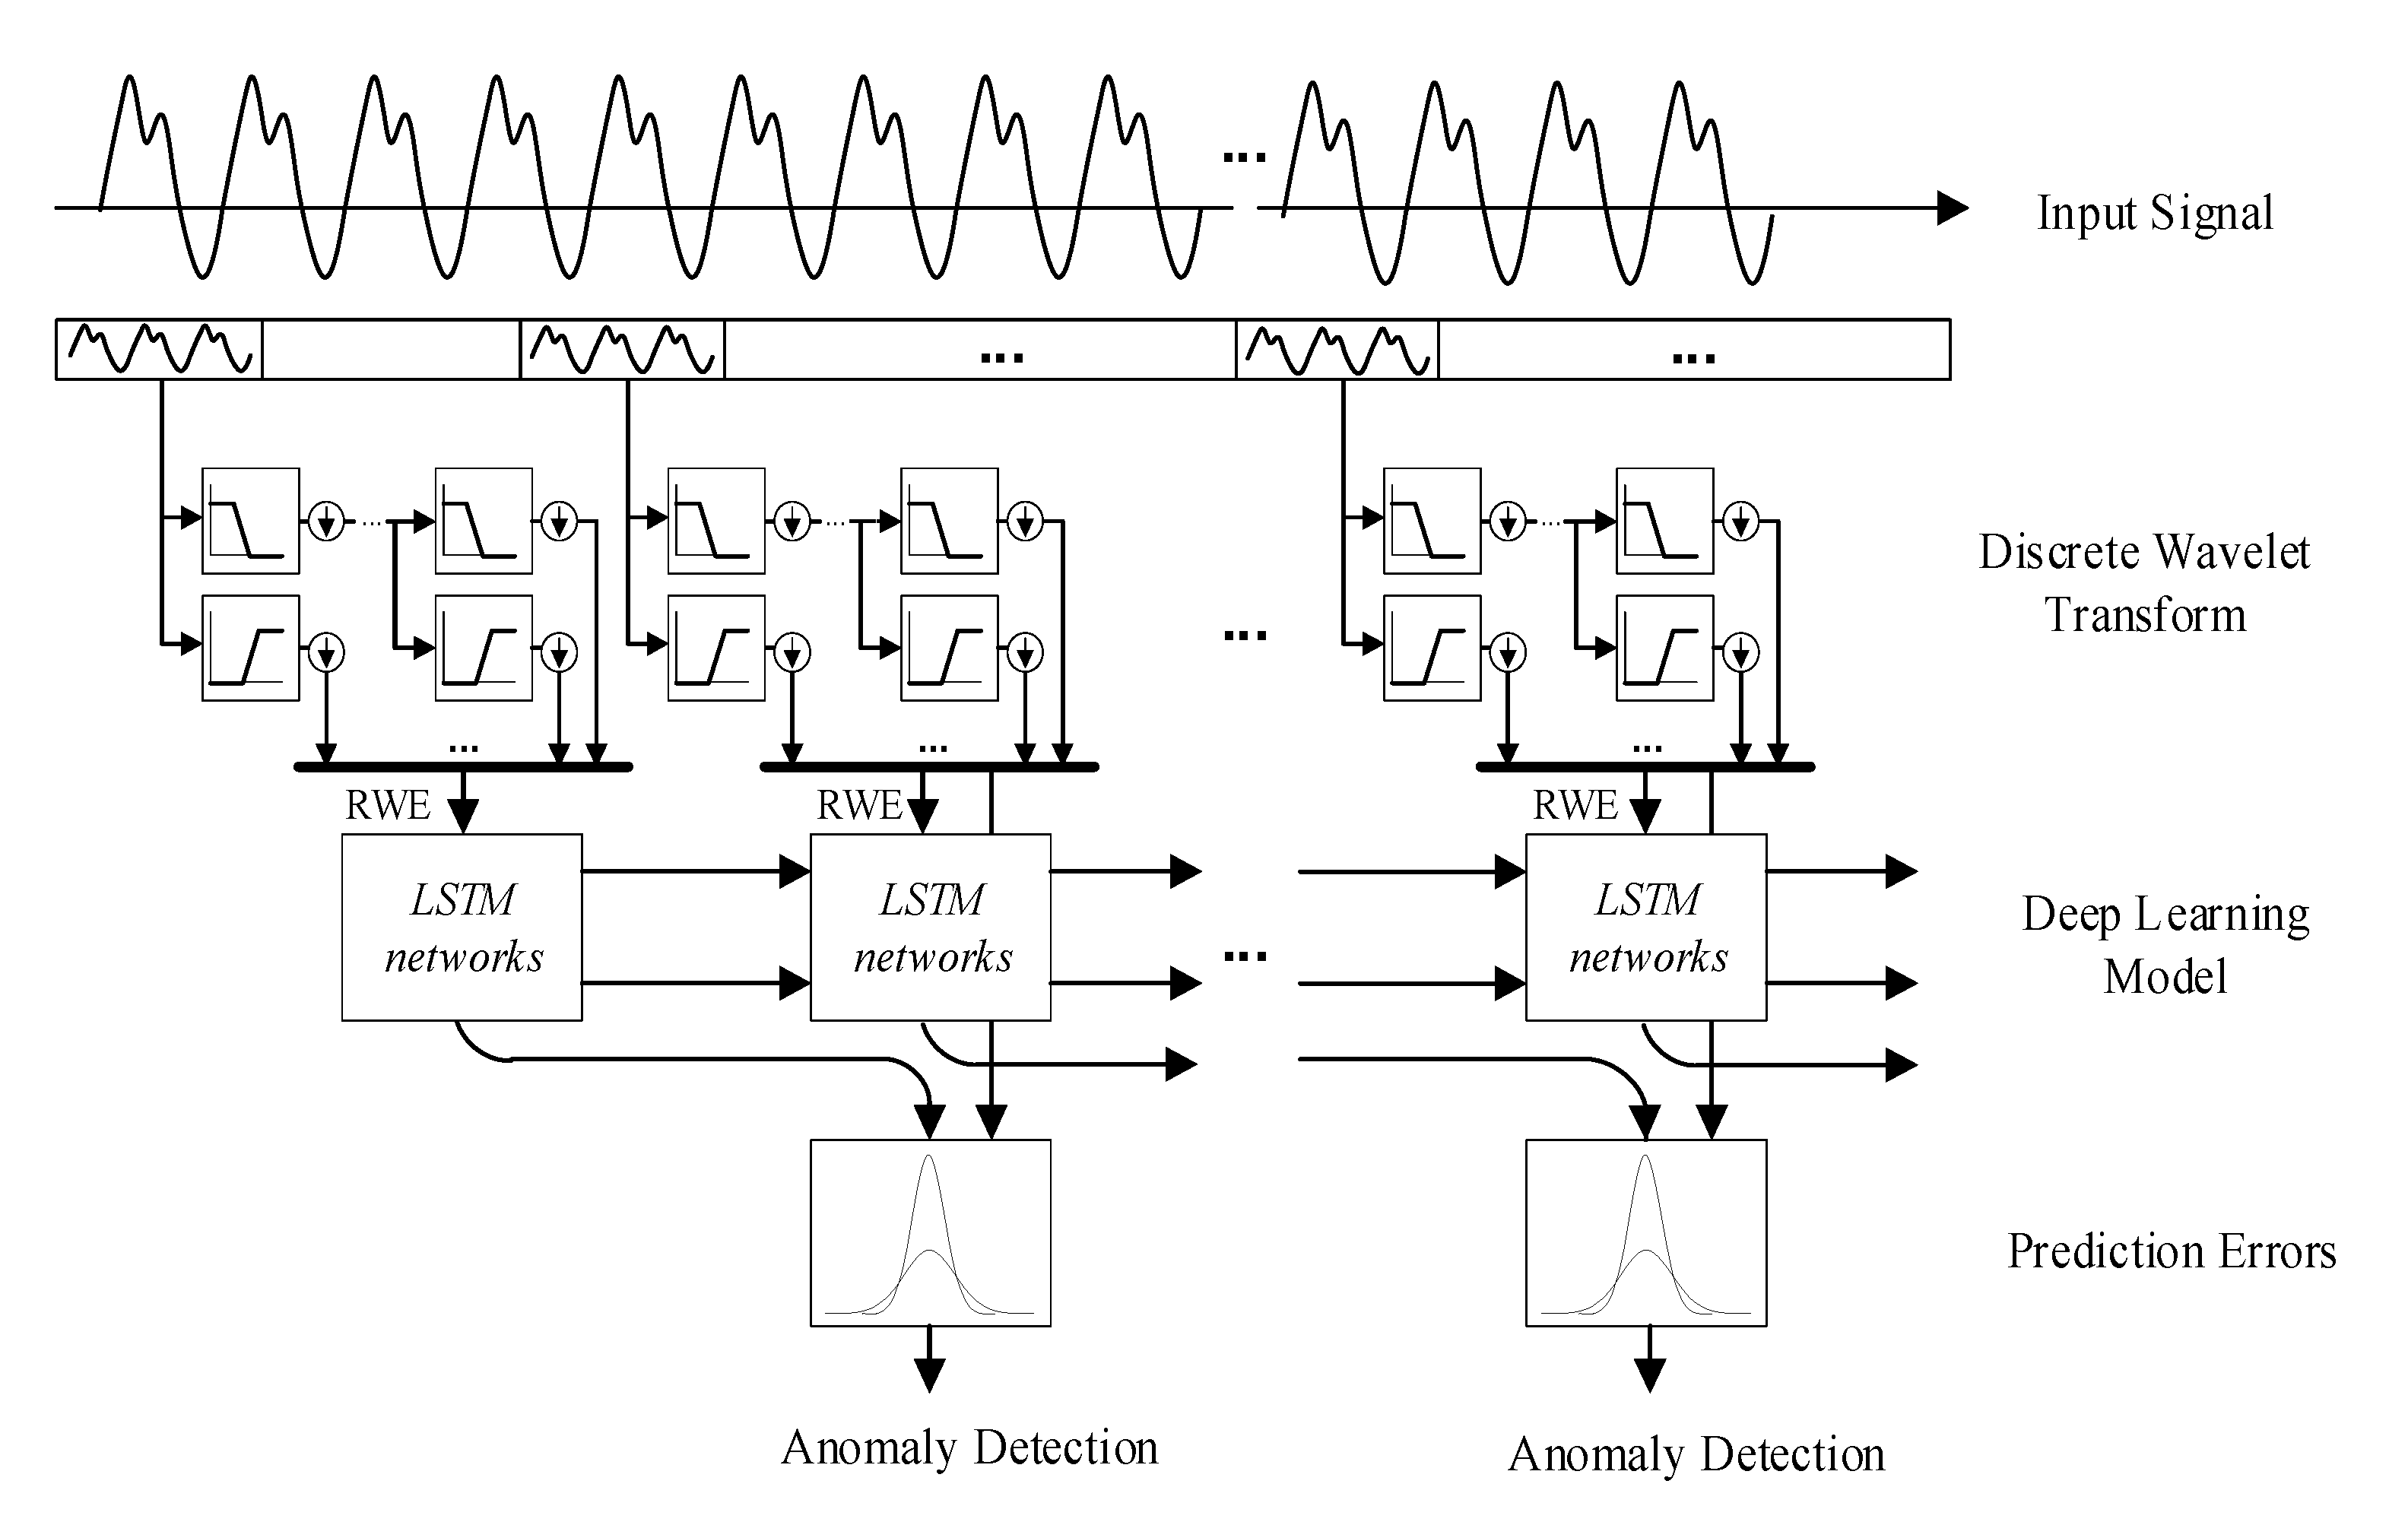
The overview of the proposed anomaly detection algorithm is shown in
Figure 2; it consists of a discrete wavelet transform and relative wavelet energy calculation module to extract local features of a short discrete sampling window and an LSTM module for estimating the long-term trends. In this section, we initially introduce how the input data are processed on the edge layer and how the LSTM module is trained with the relative wavelet energy as the features, and then explain how to implement anomaly detection finally.
3.1. Data Processing on the Edge Layer
Satisfying the IIoT data processing requirements by the traditional heterogeneous network architecture is very challenging because the massive sensor data are generated with the growth of the sensors’ number. Edge computing technology helps to extend cloud-computing capabilities to the edge layer of the network. It can manage the data transmission and enable data preprocessing to avoid network congestion and reduce the computing loads on the clouds.
The developing fault trend of the manufacturing systems is slow, whereas a high sampling frequency is required to capture the failure-generated signal, which is modulated at a high frequency. To maintain a trade-off between the sensitivity of failure detection and the number of data, we identify the optimal discrete sampling window size and interval to measure the sensor signal.
The time series
, which is a temporal sequence of the observations, is considered, and
is a reading at the n-th time point of the sensor output. The output signal of the sensors in the time series reflects the working condition of the system. L is a discrete sampling window length. The sequence in the sampling window at time t
i is represented as
, with the sampling interval Δ, where T = {t
i}
i=1,2,…, is the start time for each sampling window and
. The signal digitization with the discrete sampling window method is shown in
Figure 3.
Time and frequency-based analysis methods are also used with the time series sensor data collected during the manufacturing process for condition monitoring. The signal analysis for failure detection does not only focus on all global properties of a signal in scope but also on information about local features of the signal, such as changes in frequency. Since changes in environmental and operating conditions can influence the vibration sources of the anomaly detection and make the signals non-stationary with a changing frequency and amplitude characteristics, traditional Fourier spectral analysis, such as fast Fourier transform (FFT) and short-time Fourier transform (STFT), cannot adequately be applied to non-stationary signals [
18,
19]. In essence, Fourier analysis is a global transform in both the time domain and frequency domain; therefore, it is unable to reveal the time-frequency local properties, which are the main features in the transient and non-stationary anomaly signals. However, the wavelet transform performs multiresolution analysis to extract the local features of the signals over time with the adaptive time-frequency analysis.
In our study, we apply the discrete wavelet transform (DWT) [
20] to decompose the collected sensor signal in each sampling window
. The discrete wavelet transform decomposes the given signal into a number of sets, where each set is a time series of coefficients at each decomposed level describing the time evolution of the signal in the corresponding frequency band. The signals are represented through a combined series expansion, namely, the approximation and the detail coefficients by the transform. We investigate the transform as the processing method used for the extraction of the features from the frequency information and location information.
Figure 4 shows the discrete wavelet transform with three levels of high-pass and low-pass filter banks.
Relative wavelet energy describes information about the relative energy associated with different frequency ranges and can be considered a time-scale density [
21,
22]. This method can detect the similarity between the phase periods of the signals. The relative wavelet energy
at the decomposed level
j is defined as follows:
with the energy of the signal at each decomposed level
Ej described as follows:
The total energy for all levels is defined by the following:
where
Cj(
k) is the DWT coefficient at the decomposed level
j. The relative wavelet energy is used as the input feature to the prognostic algorithm. The calculated relative wavelet energy features are passed from the edge layer for anomaly detection on the cloud.
3.2. Proposed Prognostic Method Based on LSTM Model
Long short-term memory (LSTM) is a type of deep neural network algorithm [
23,
24], with the capability of feature learning based on recurrent neural network (RNN) architecture. In addition, the LSTM is a probabilistic recurrent neural network, which includes an input gate, a forget gate, a control gate, and an output gate; it is well-suited to learning the long-time lagged features from the time series. We used the LSTM model for anomaly detection in the time series in our proposed condition monitoring system, given its strong time series data processing ability.
A sequence of the relative wavelet energy R(ti) is used as the input of the LSTM, and each input data point is an m-dimensional vector of the relative wavelet energy at the time instance ti, which is generated from the edge layer. The LSTM model predicts the output vector with the extracted temporal evolutionary information from the input sequence. The temporal evolutionary information contains information about the machine condition with the aging process so that the anomalies can be extrapolated.
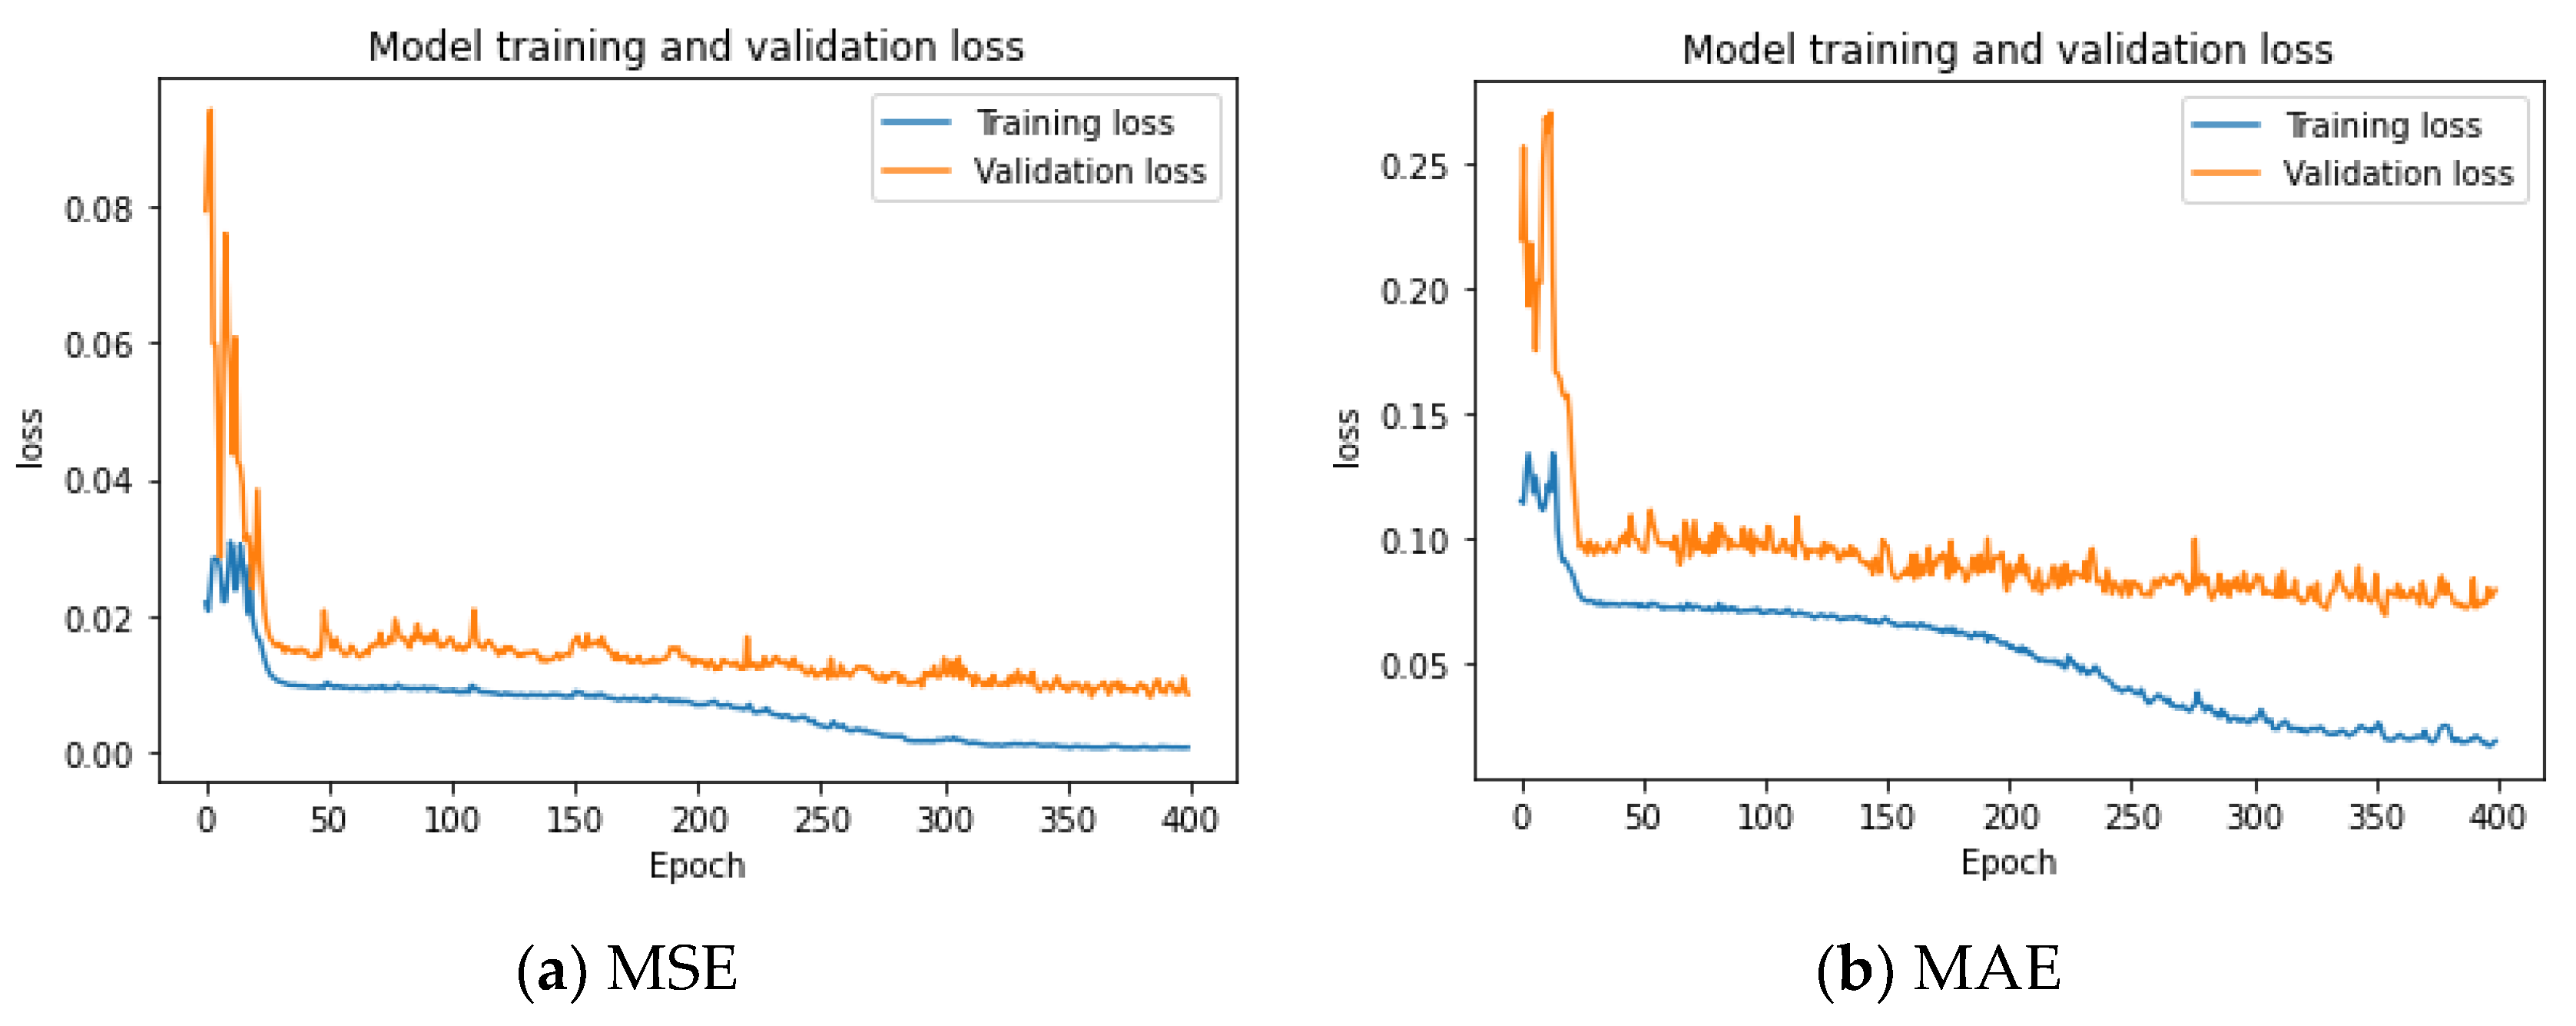
In our proposed LSTM network, we concatenate multiple LSTM units and a final fully connected layer with a stacked multilayered structure. Each LSTM layer has three inputs, including the previously hidden state , cell state , and current input , and the hyperbolic tangent (tanh) activation function is adopted to process the output to be passed to the subsequent layer. The last fully connected layer is formed by m hidden neurons with a softmax activation function to produce the predicted output to approximate as the prediction of the relative wavelet energy at time T + 1. In the training process, the mean squared error (MSE) is used as the statistical metric to evaluate the model performance.
3.3. Anomaly Detection with Euclidean Distance
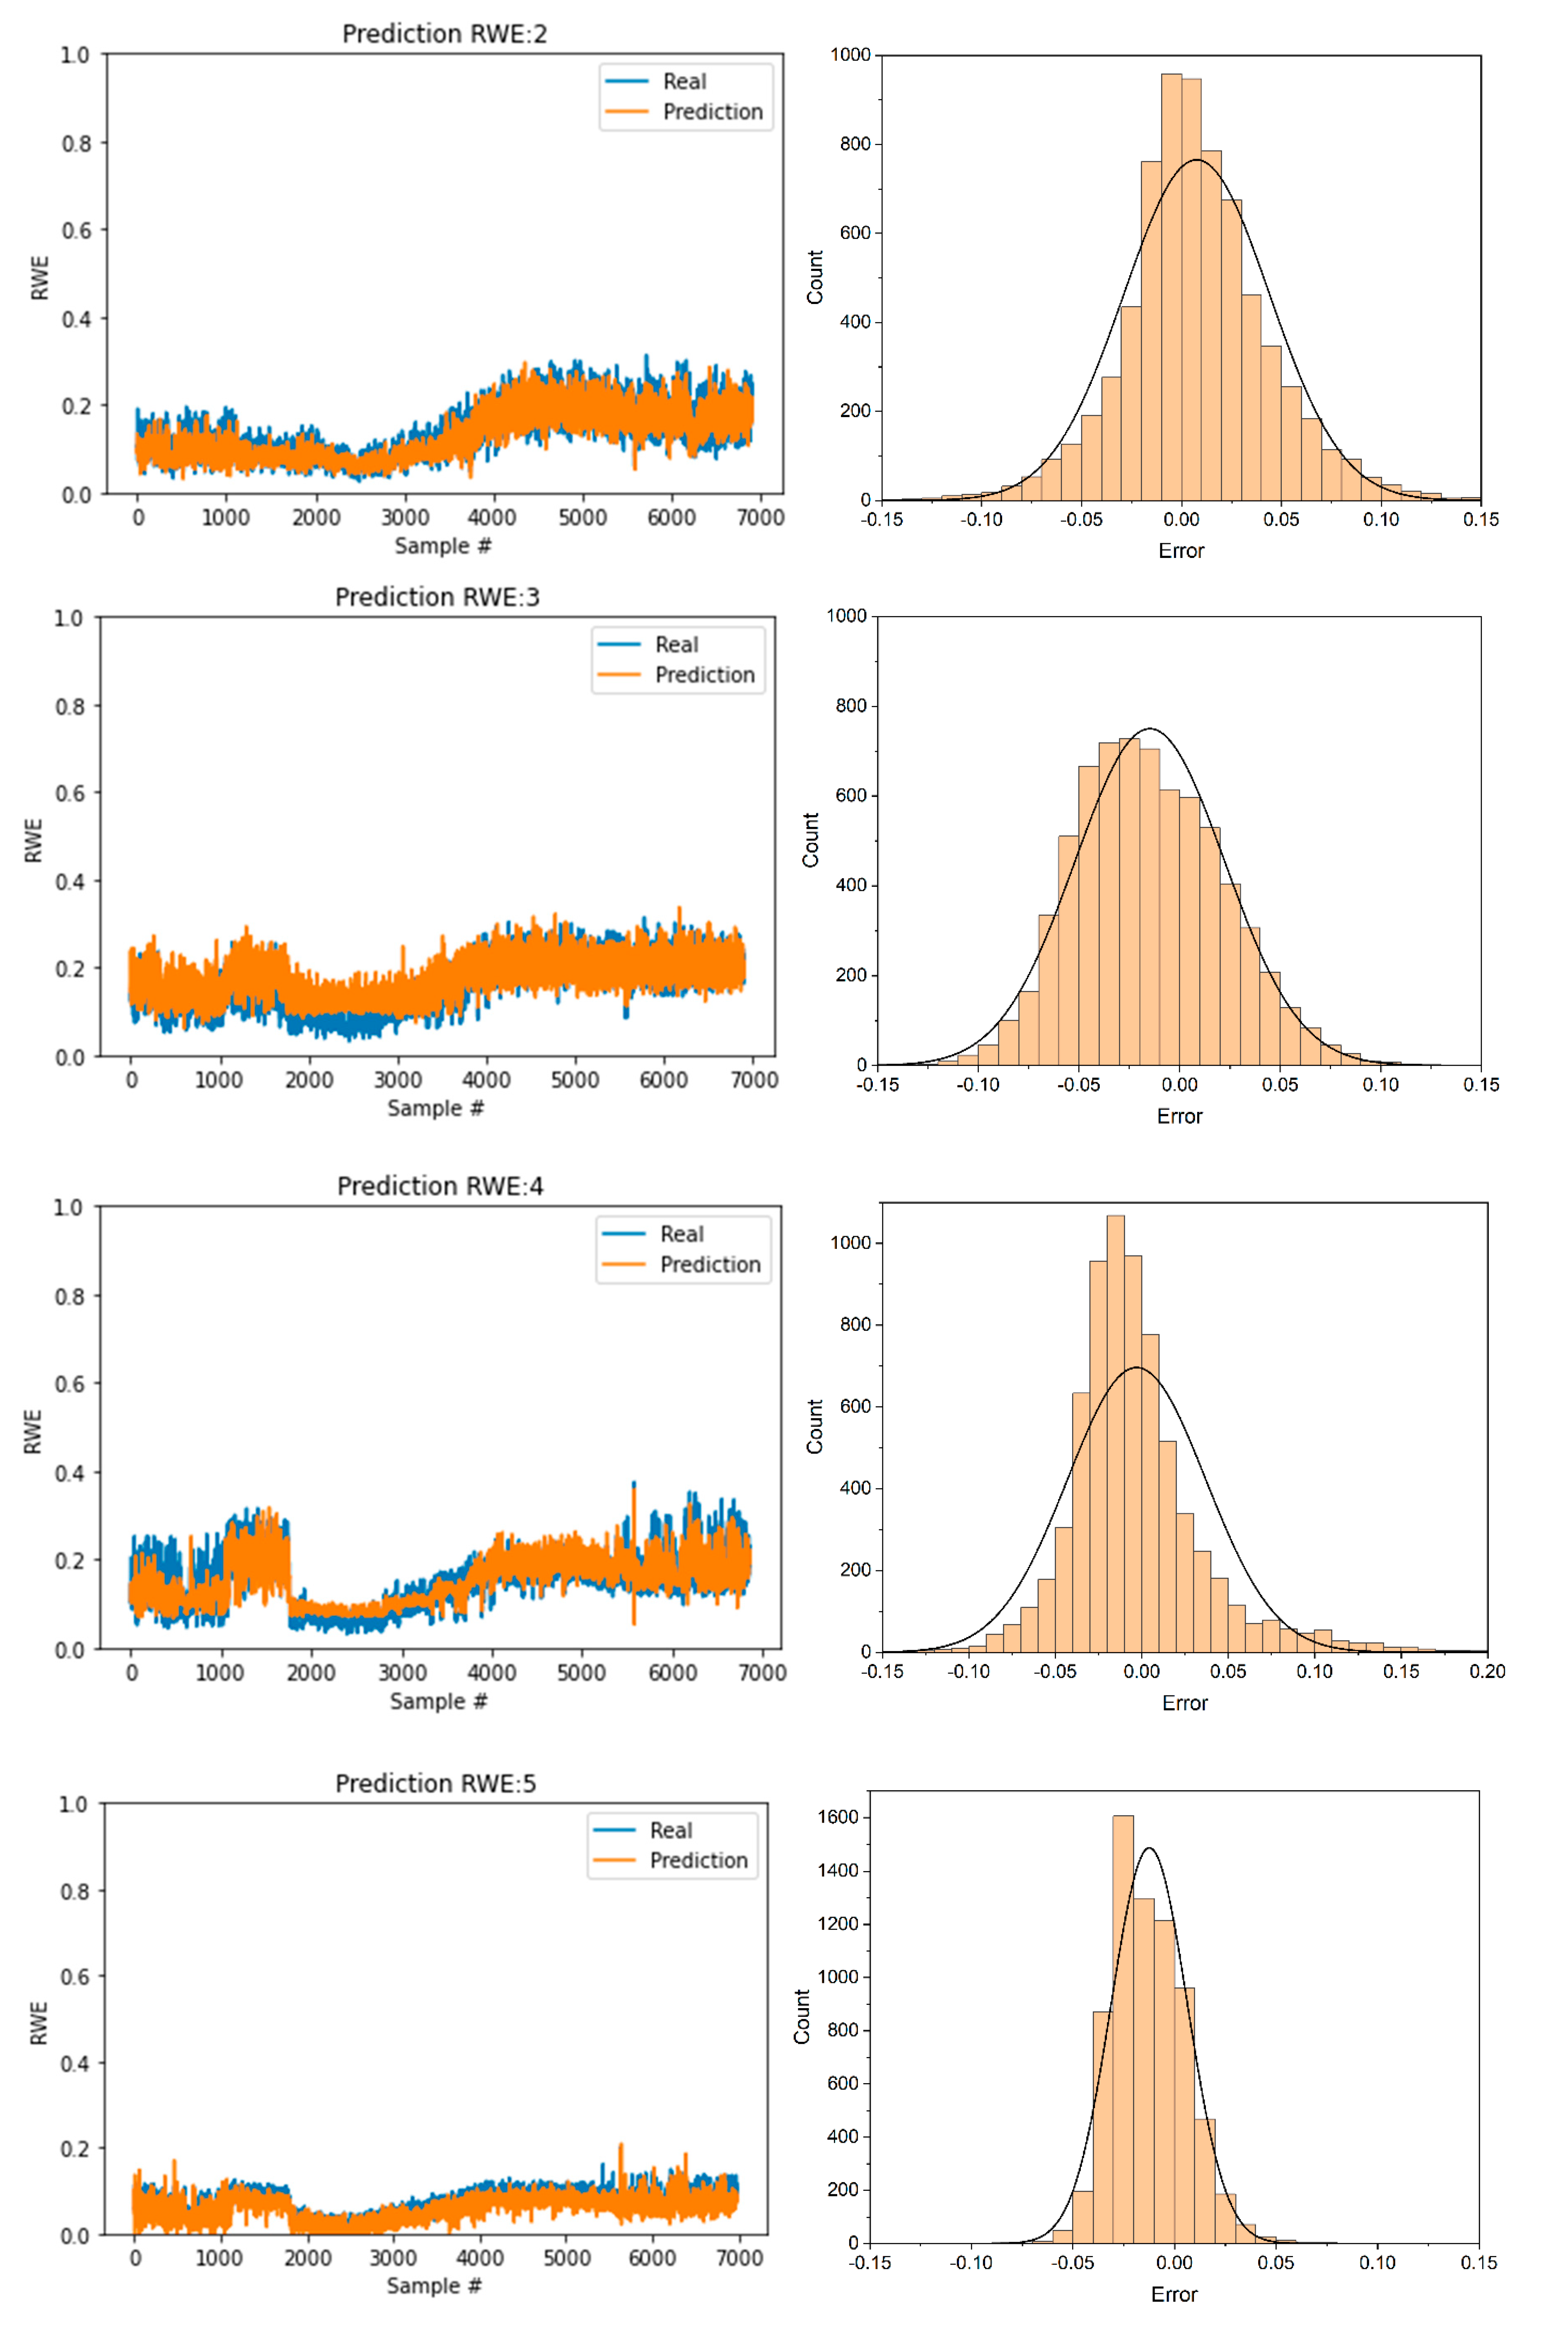
At time t, the relative wave energy is calculated from the time series input, and the output of the LSTM model is the prediction of the relative wavelet energy at time t + 1. The difference between the estimation and real value at time t + 1 is the prediction error.
The prediction errors of the signal relative wavelet energy are used as the measurement indicator of anomaly detection. The errors between predicted and real relative wavelet energy vectors can estimate the development trend of the machine condition by the analysis of the transient features of non-stationary signals, given that the wavelet energy changes reflect the development trend of the machine condition. The error can be defined as follows:
where
is the relative wavelet energy at scale
j.
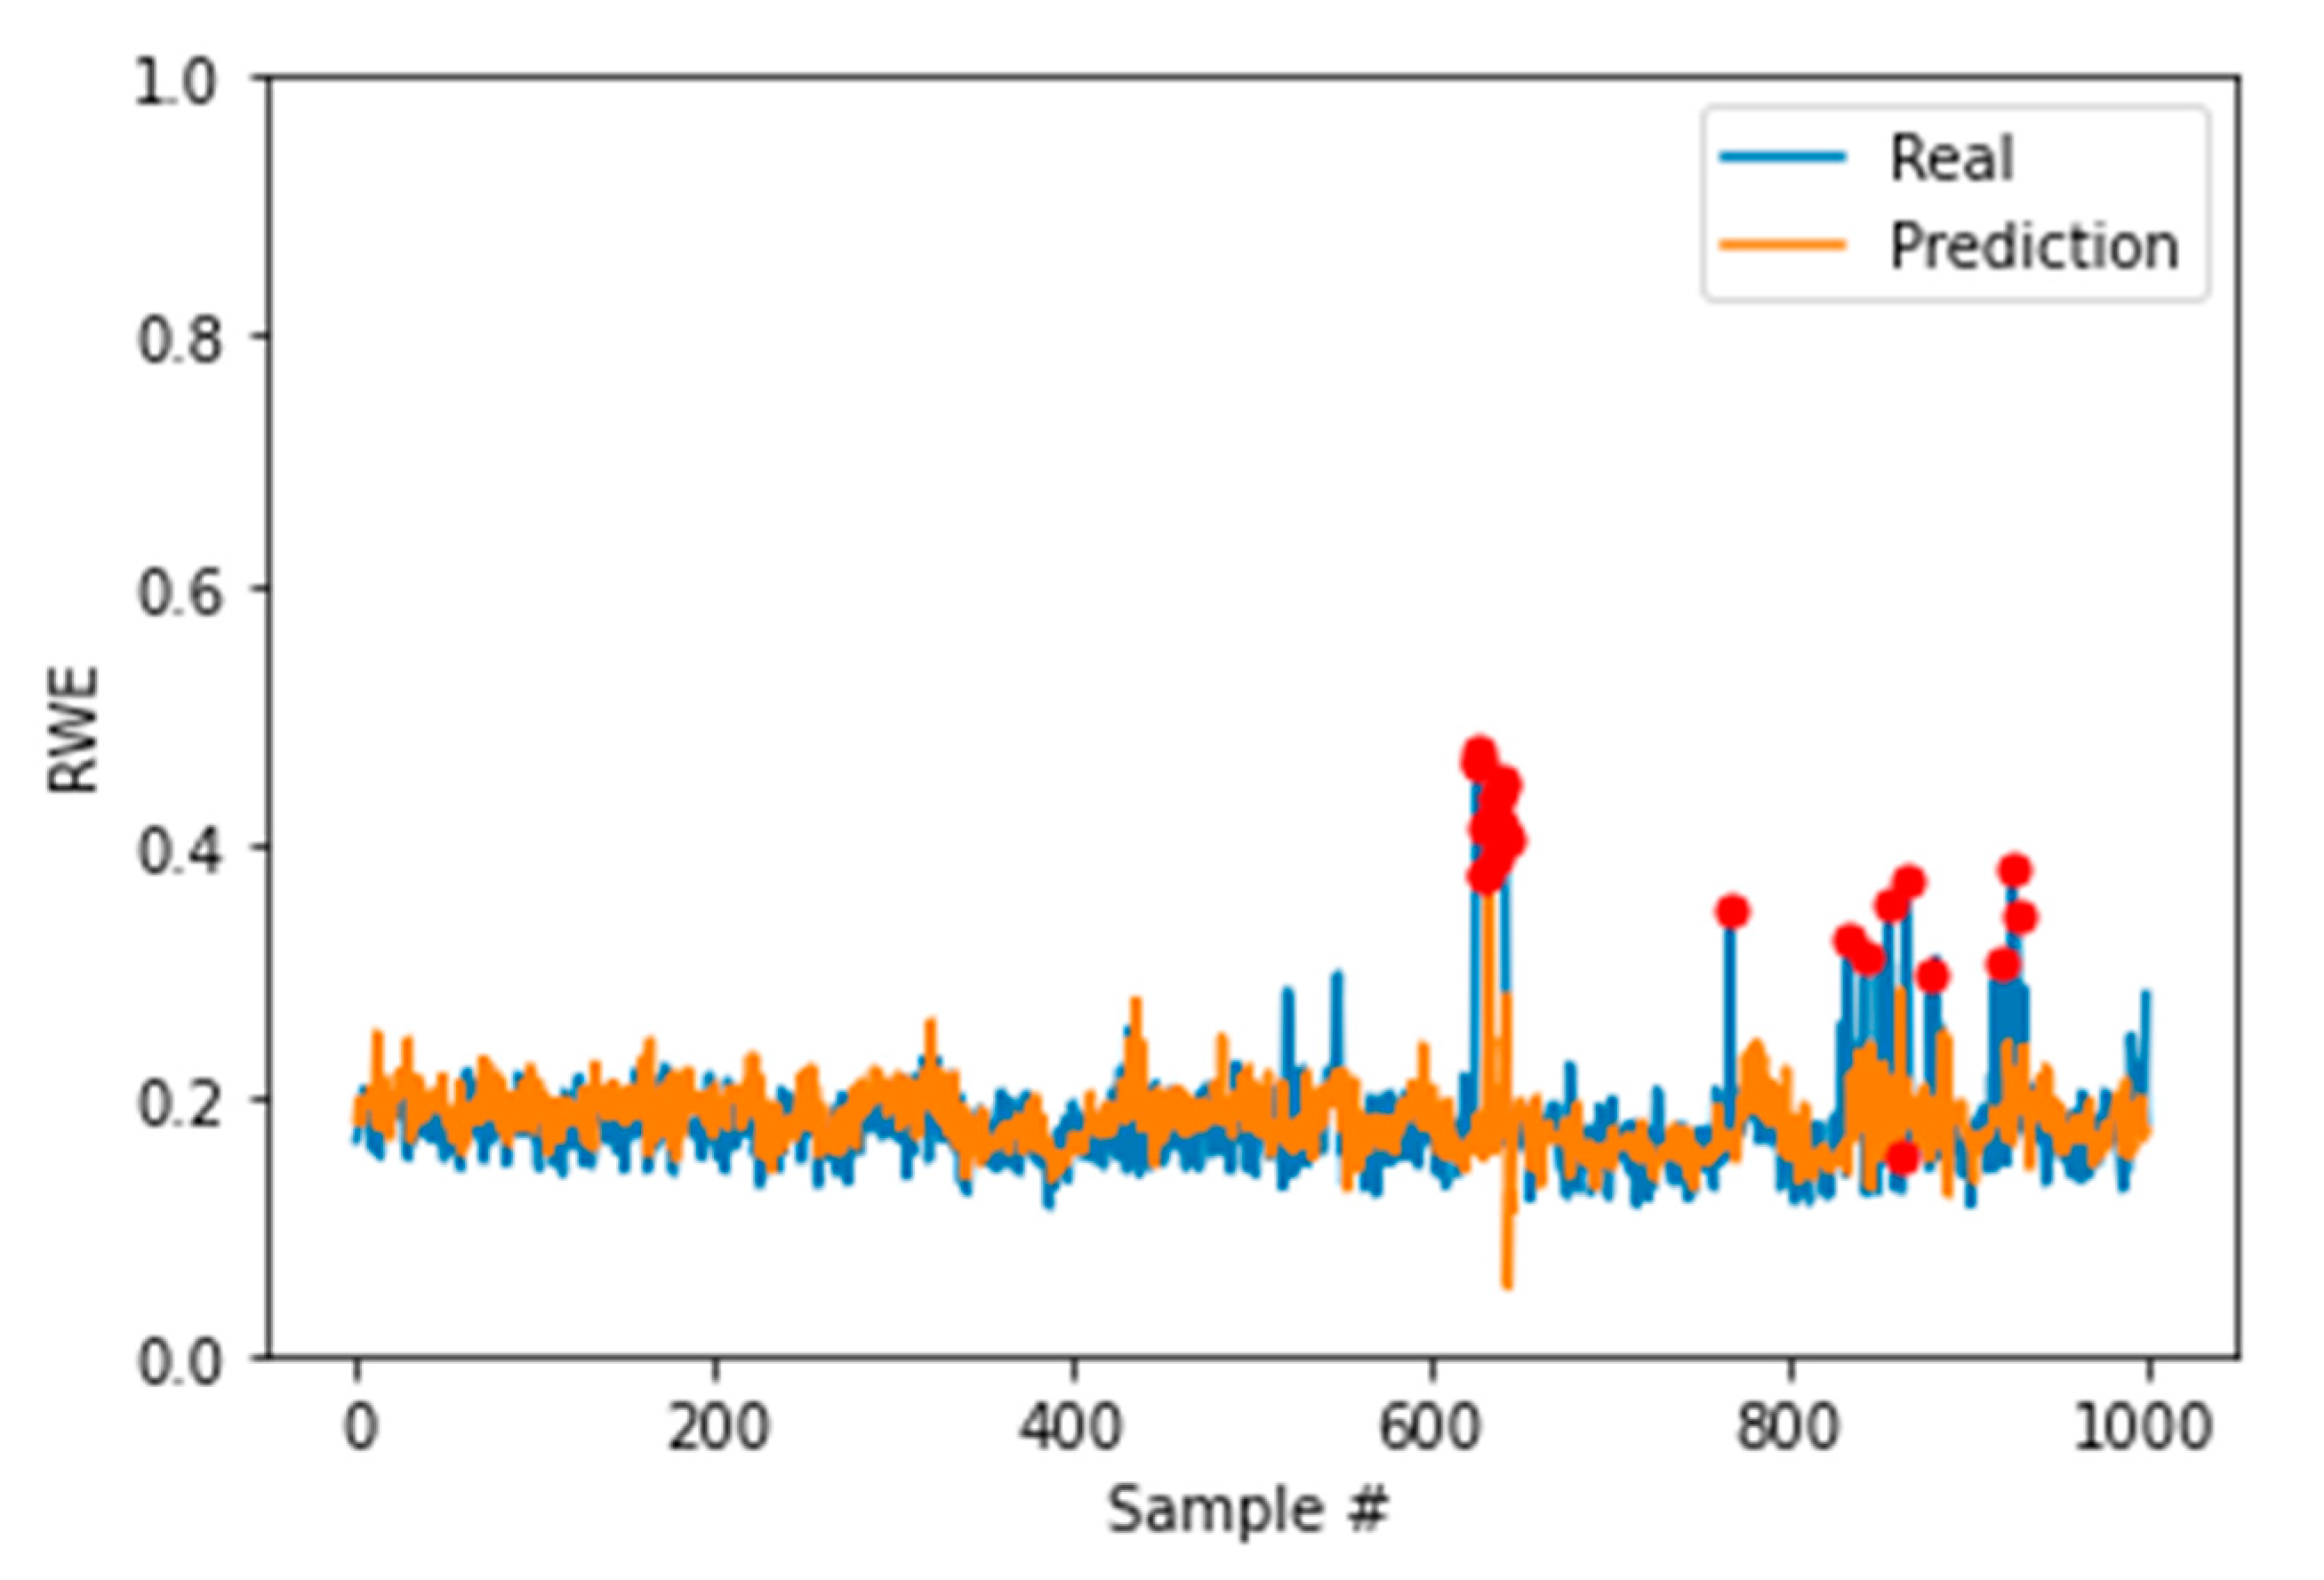
With the statistical tests, the prediction errors can be modeled as a normal distribution with the standard deviation, δ. The prediction error of the anomaly point resides far away from the normal data points, which are the majority of all the data points. The interquartile range (IQR) and standard deviation are metrics to measure the spread of values in a dataset, as shown in
Figure 5. The IQR does not consider all the data points in the dataset, and it is concerned more about the positions of the data. However, the standard deviation considers all the data points of a dataset, also including the outliers. In general, if the data point is not within three standard deviations of the mean value, it should be considered an outlier. According to the empirical rule, 99.7% of the data observed, following a normal distribution, lie within three standard deviations of the mean [
25]. Therefore, the data points that are not within three standard deviations of the mean value are identified as anomaly data. 3δ will be used as the threshold for anomaly detection in our research.


