
Infrared Sensation-Based Salient Targets Enhancement Methods in Low-Visibility Scenes


Abstract
:1. Introduction
2. The Related Work
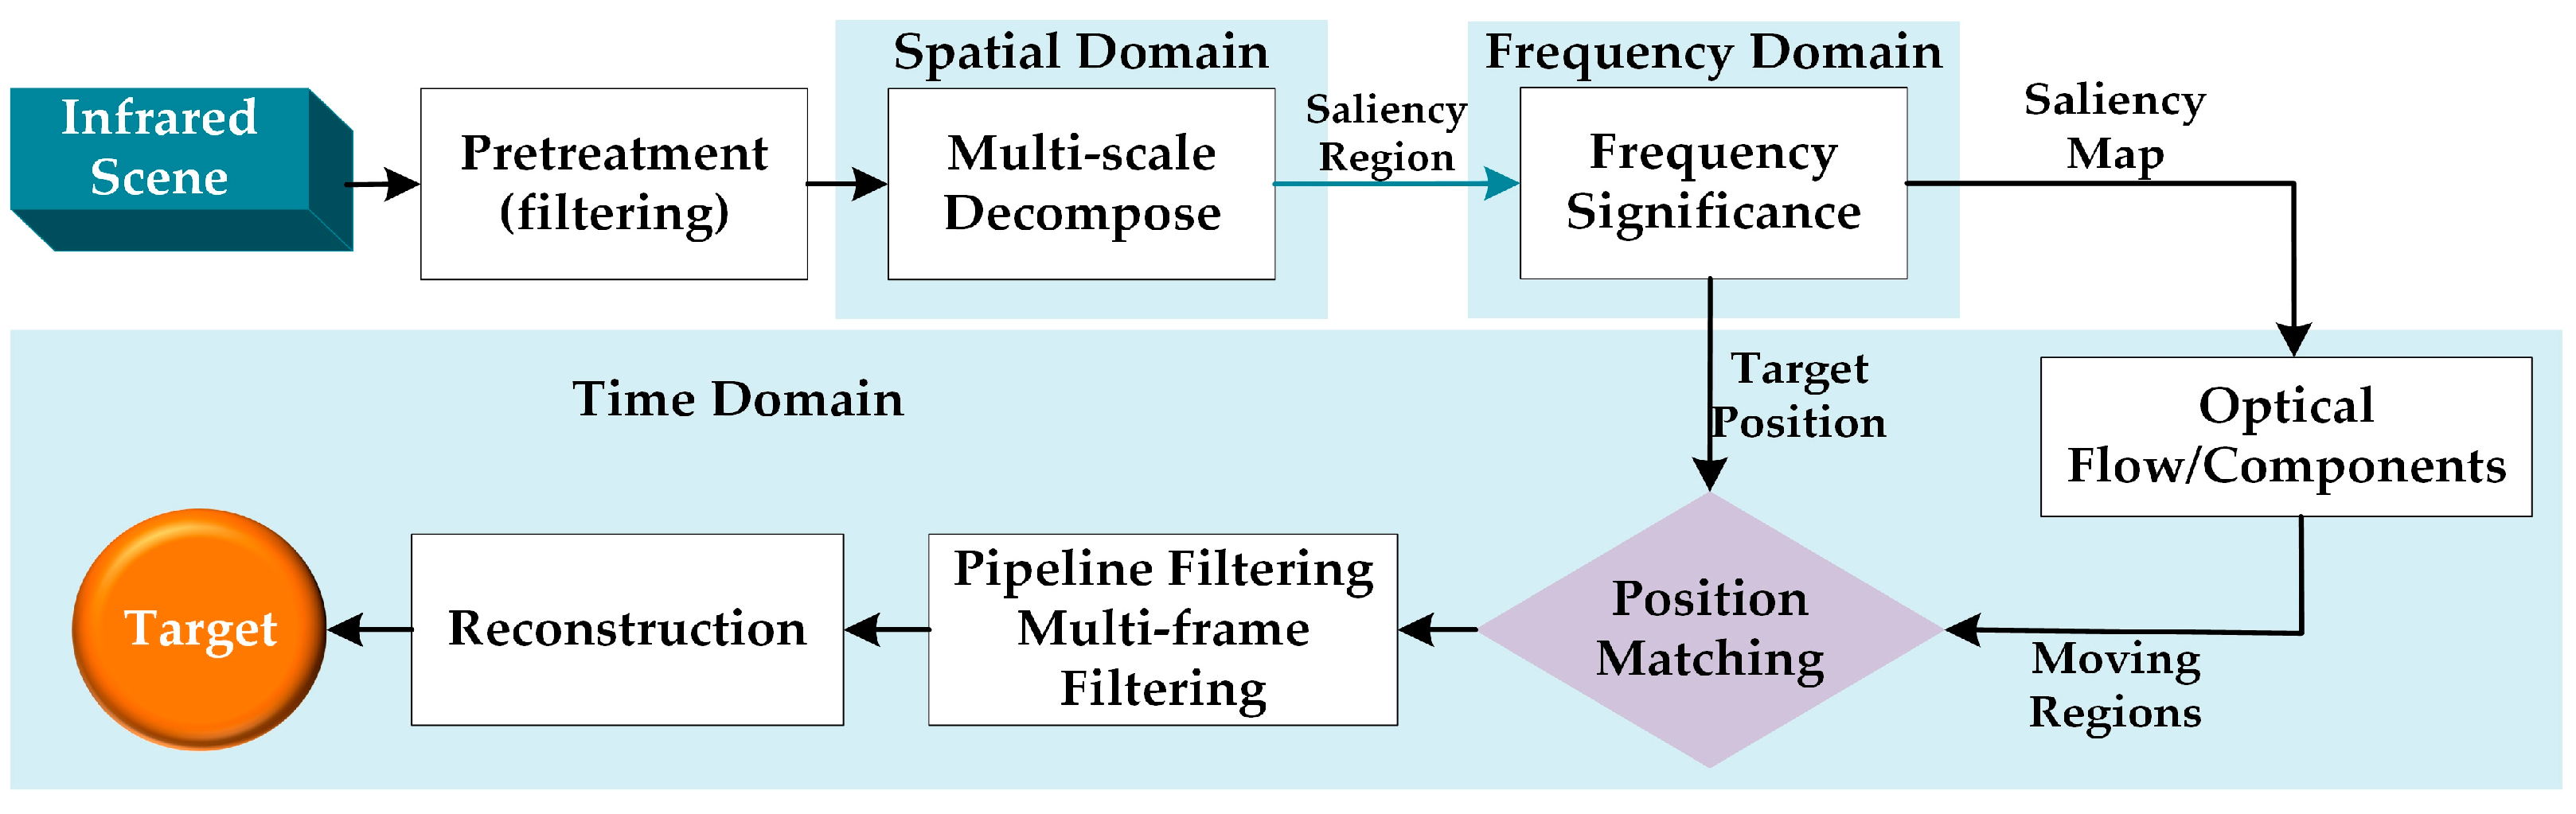
3. Proposed Methods
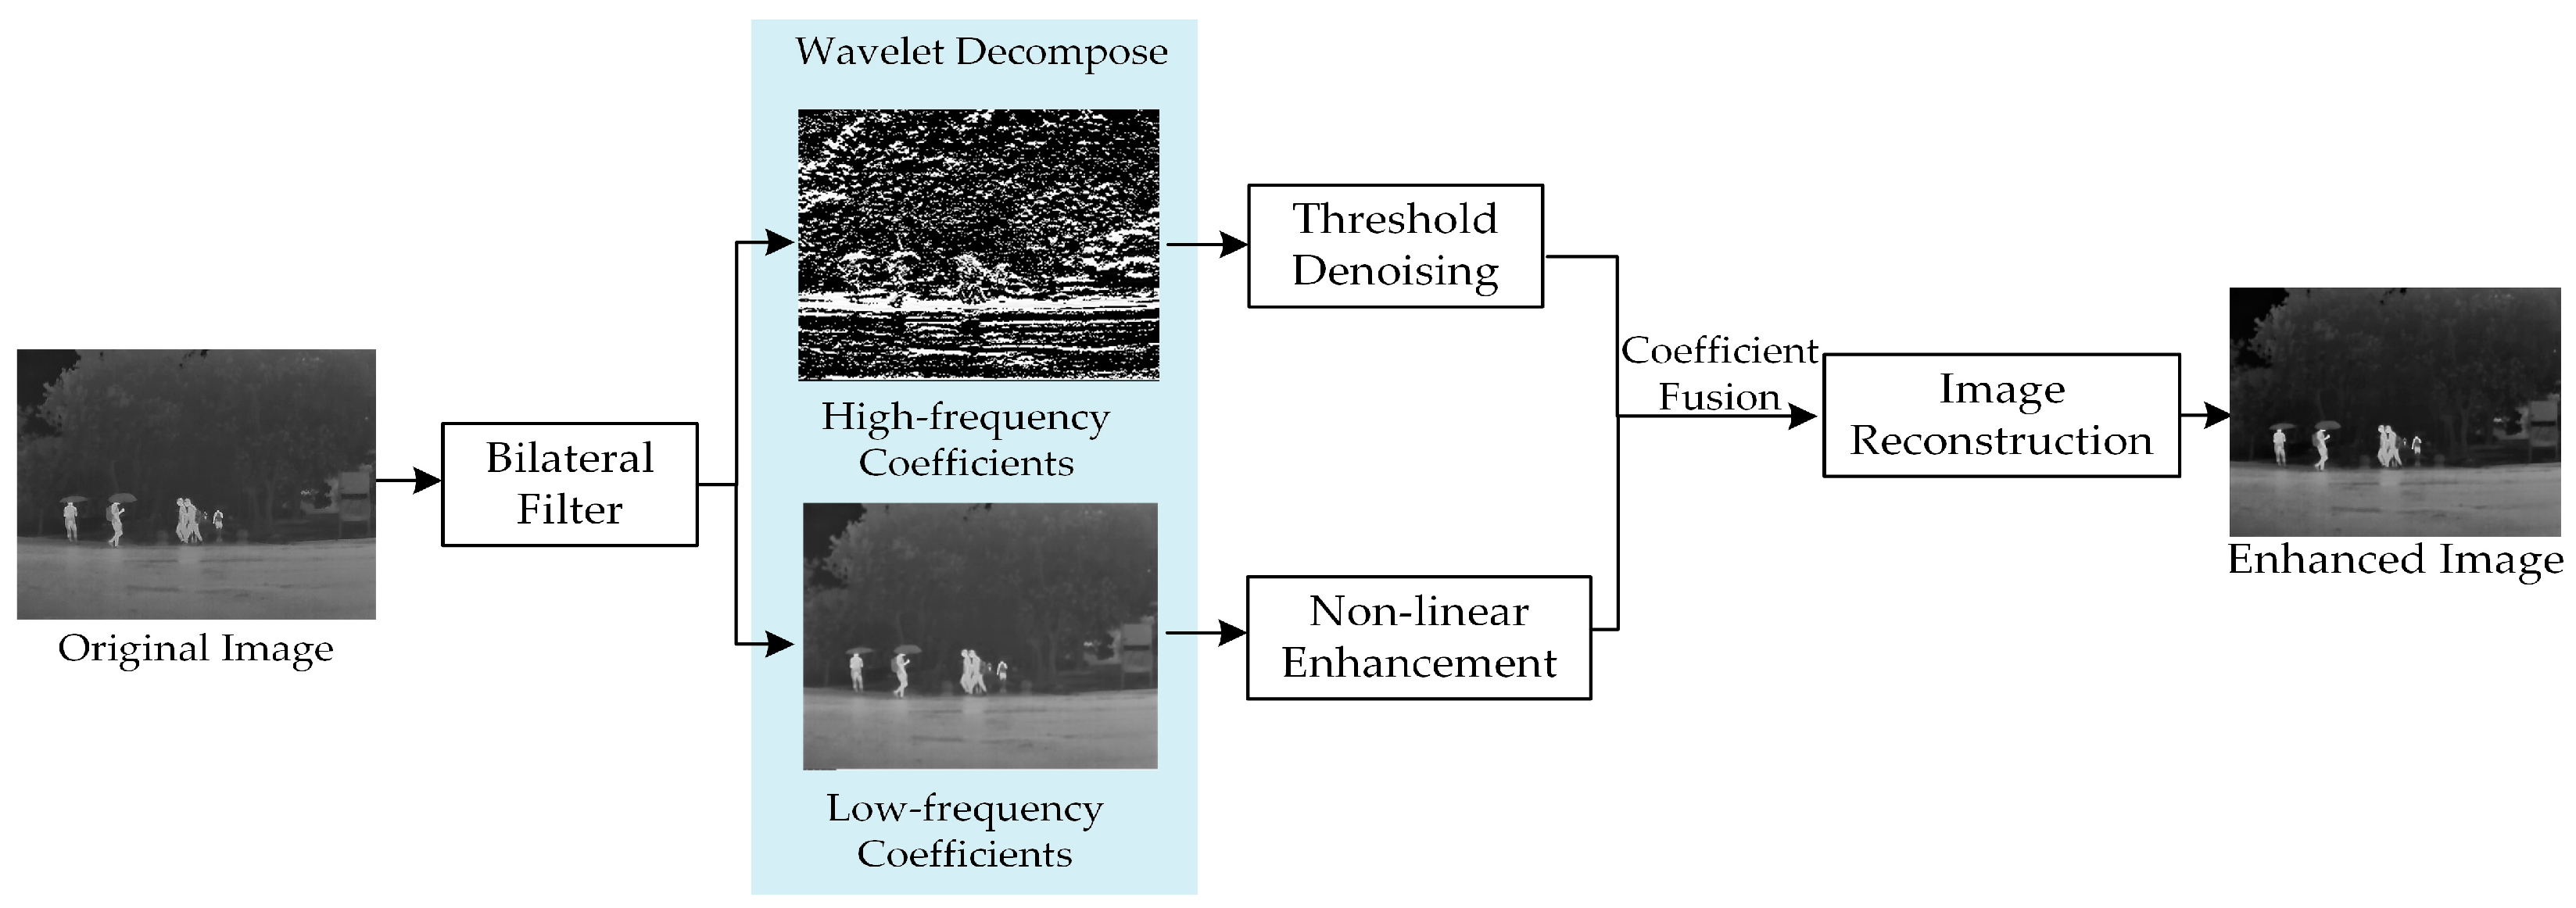
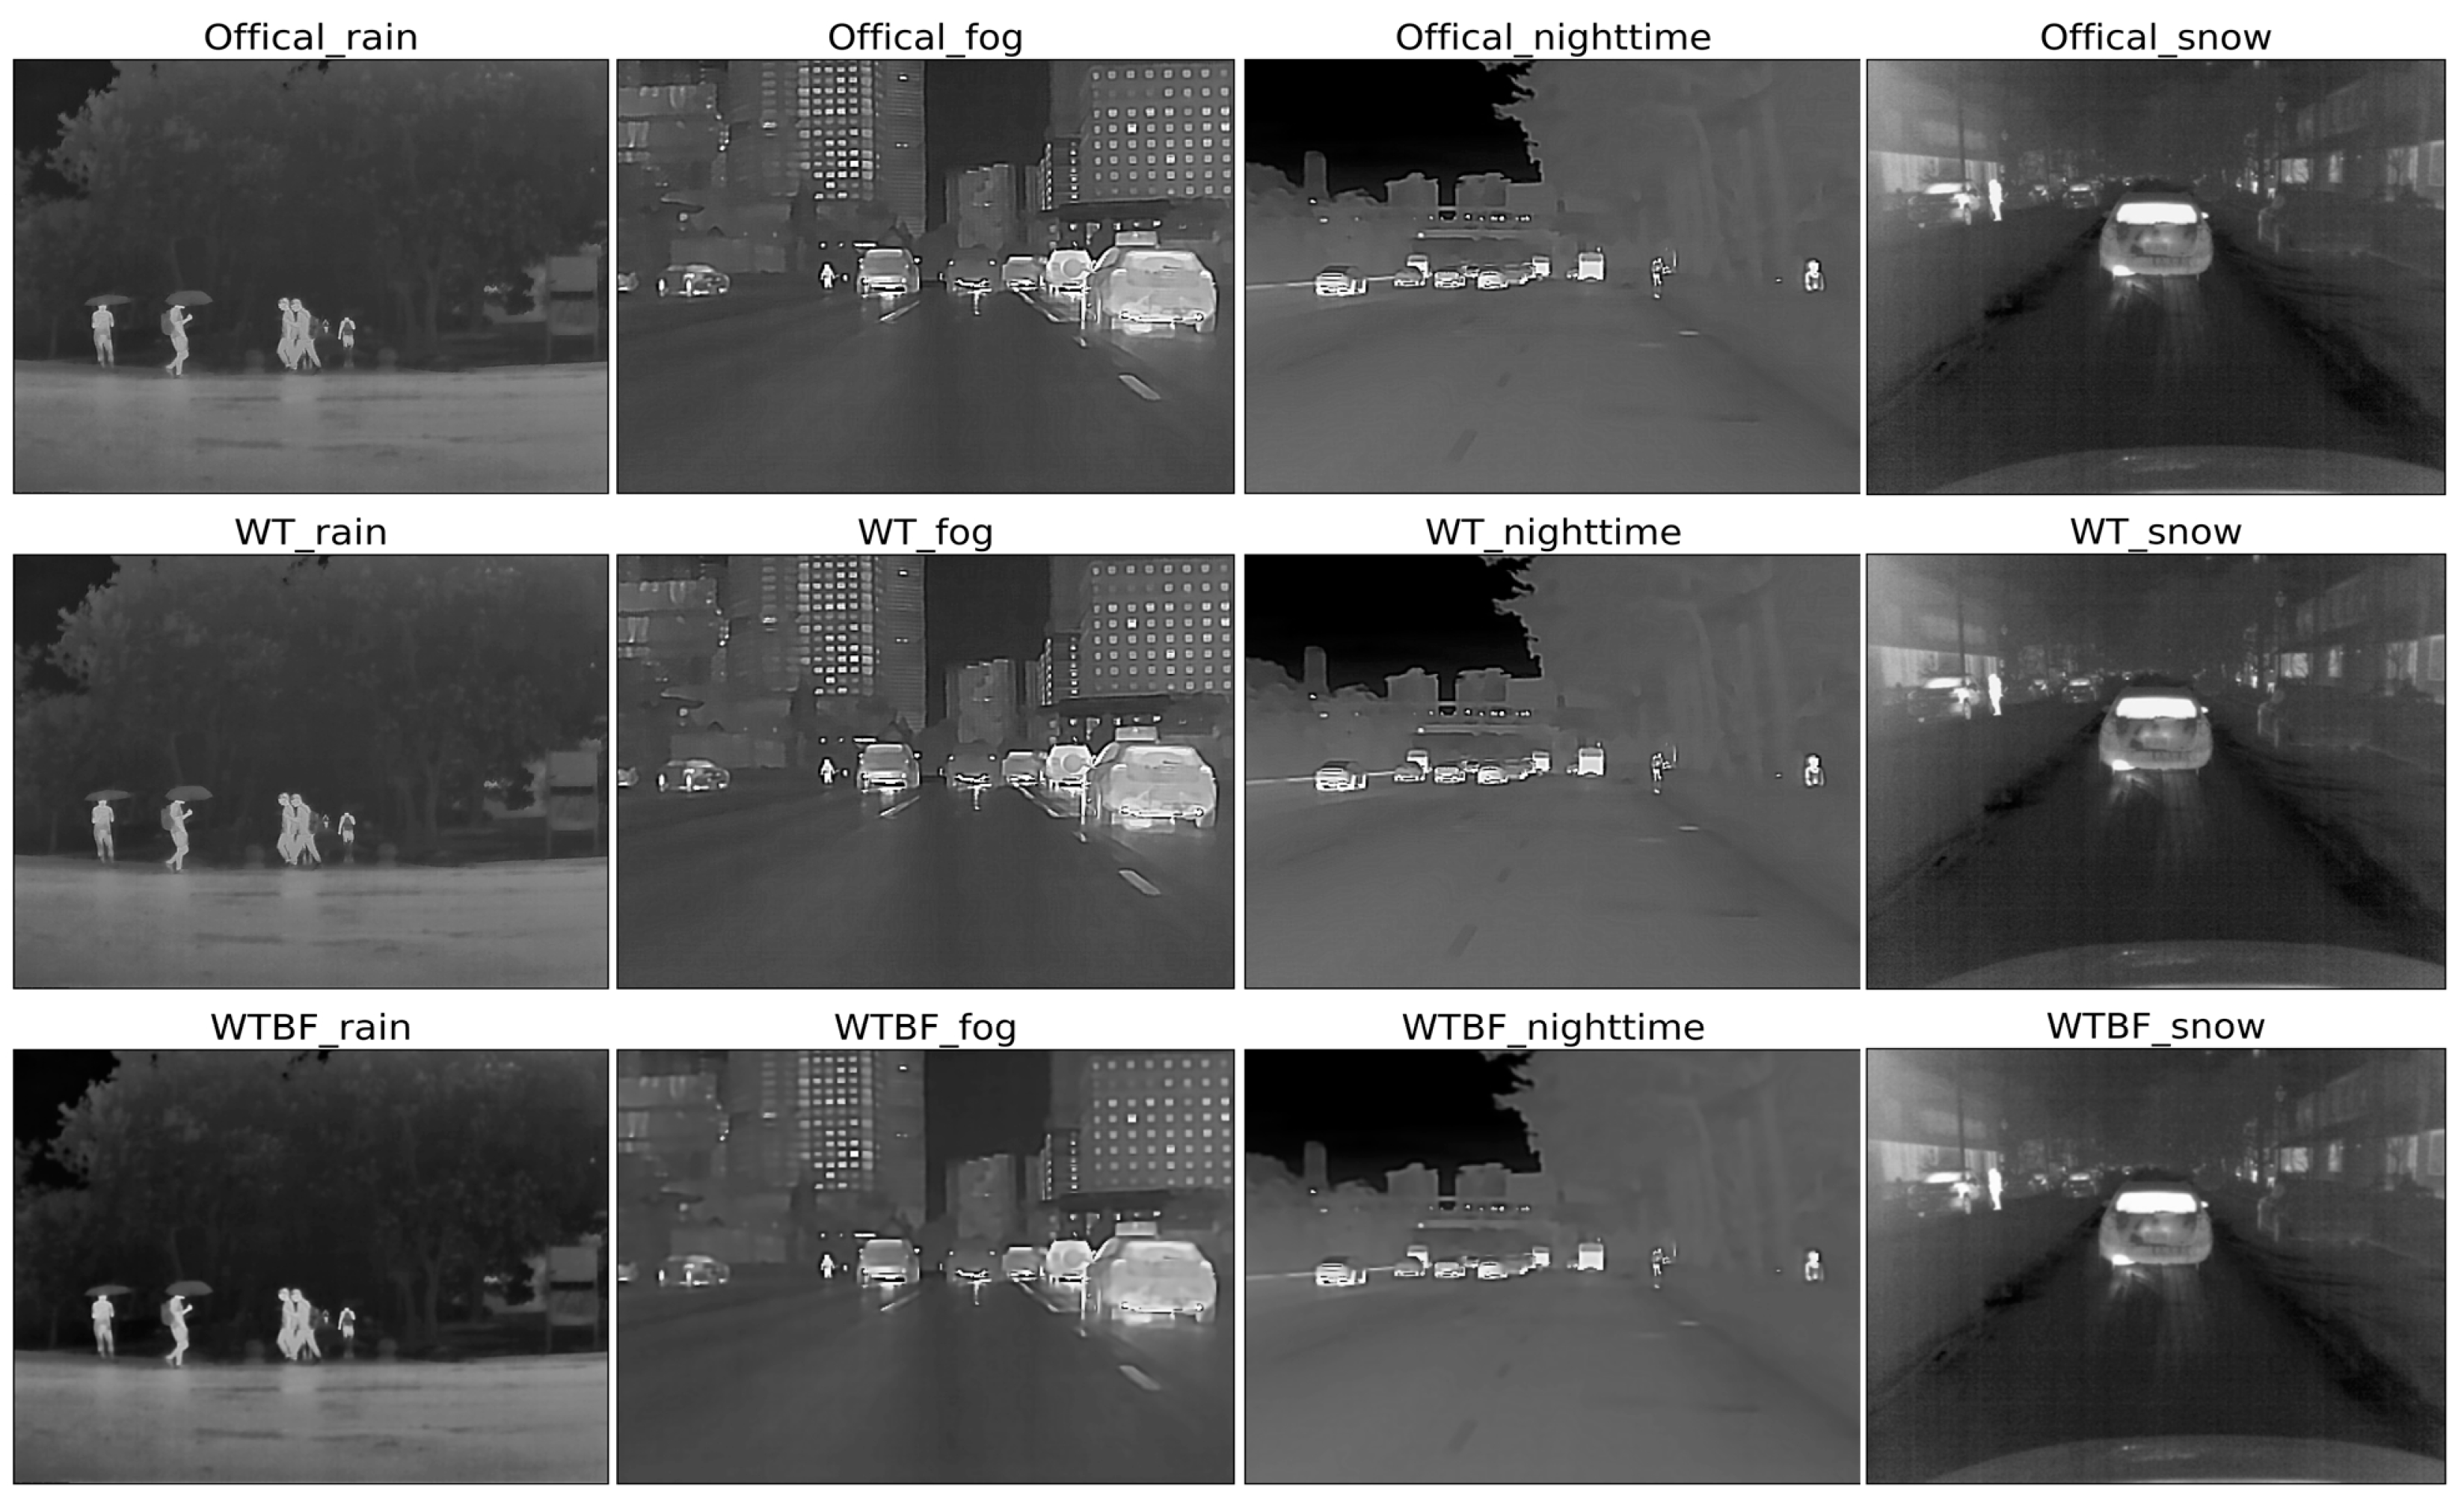
3.1. Threshold Denoising Based on WTBF
3.1.1. Wavelet Coefficients Analysis
3.1.2. Threshold Denoising
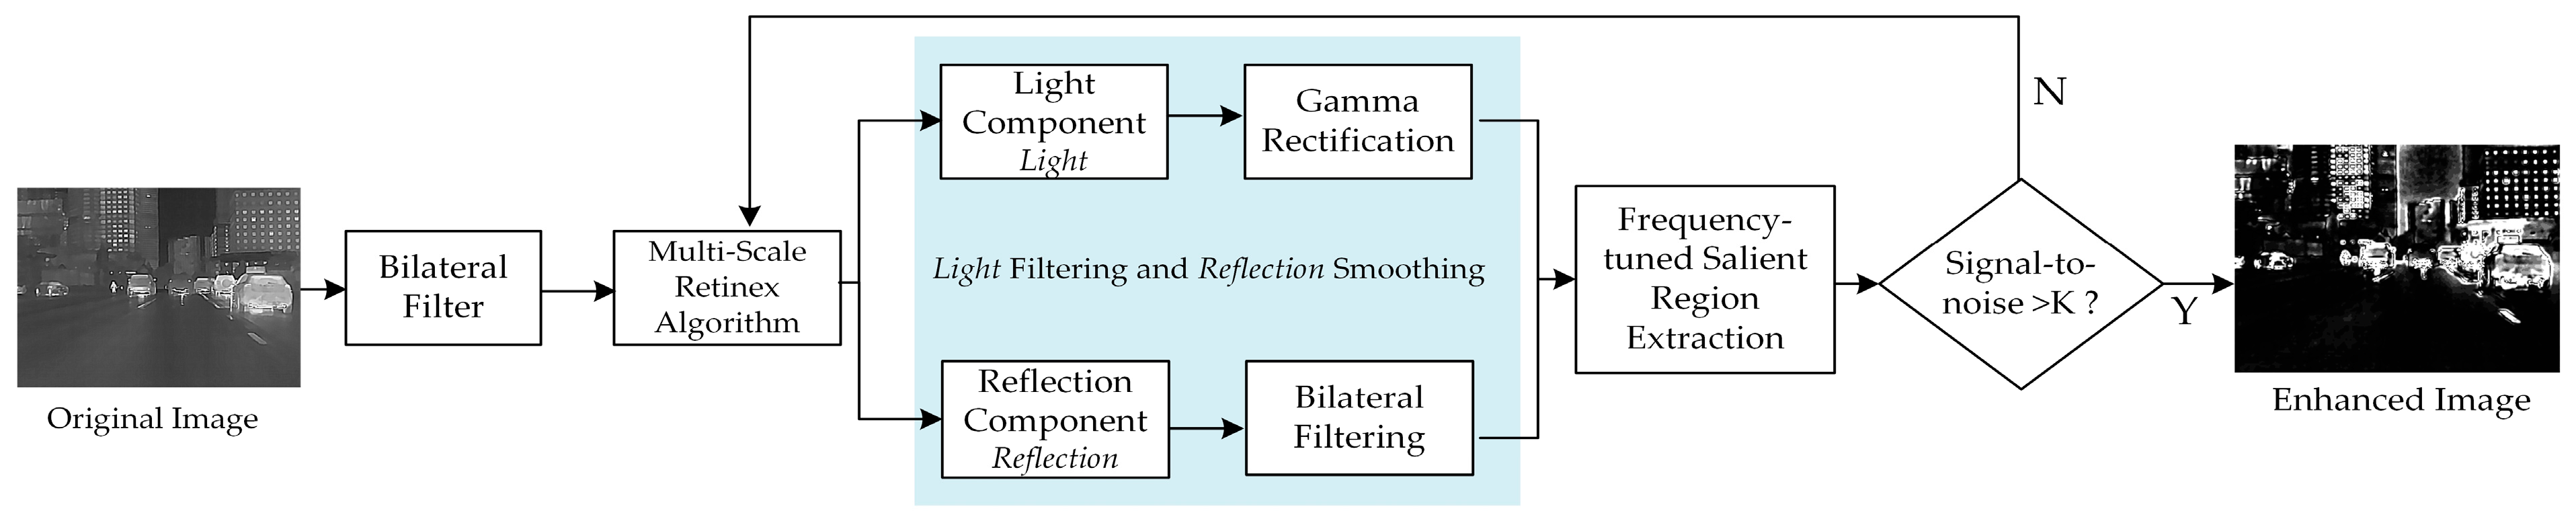
3.2. Salient Components Enhancement Based on MSRFT
3.2.1. Multi-Scale Retinex Algorithm
3.2.2. Light Filtering and Reflection Smoothing
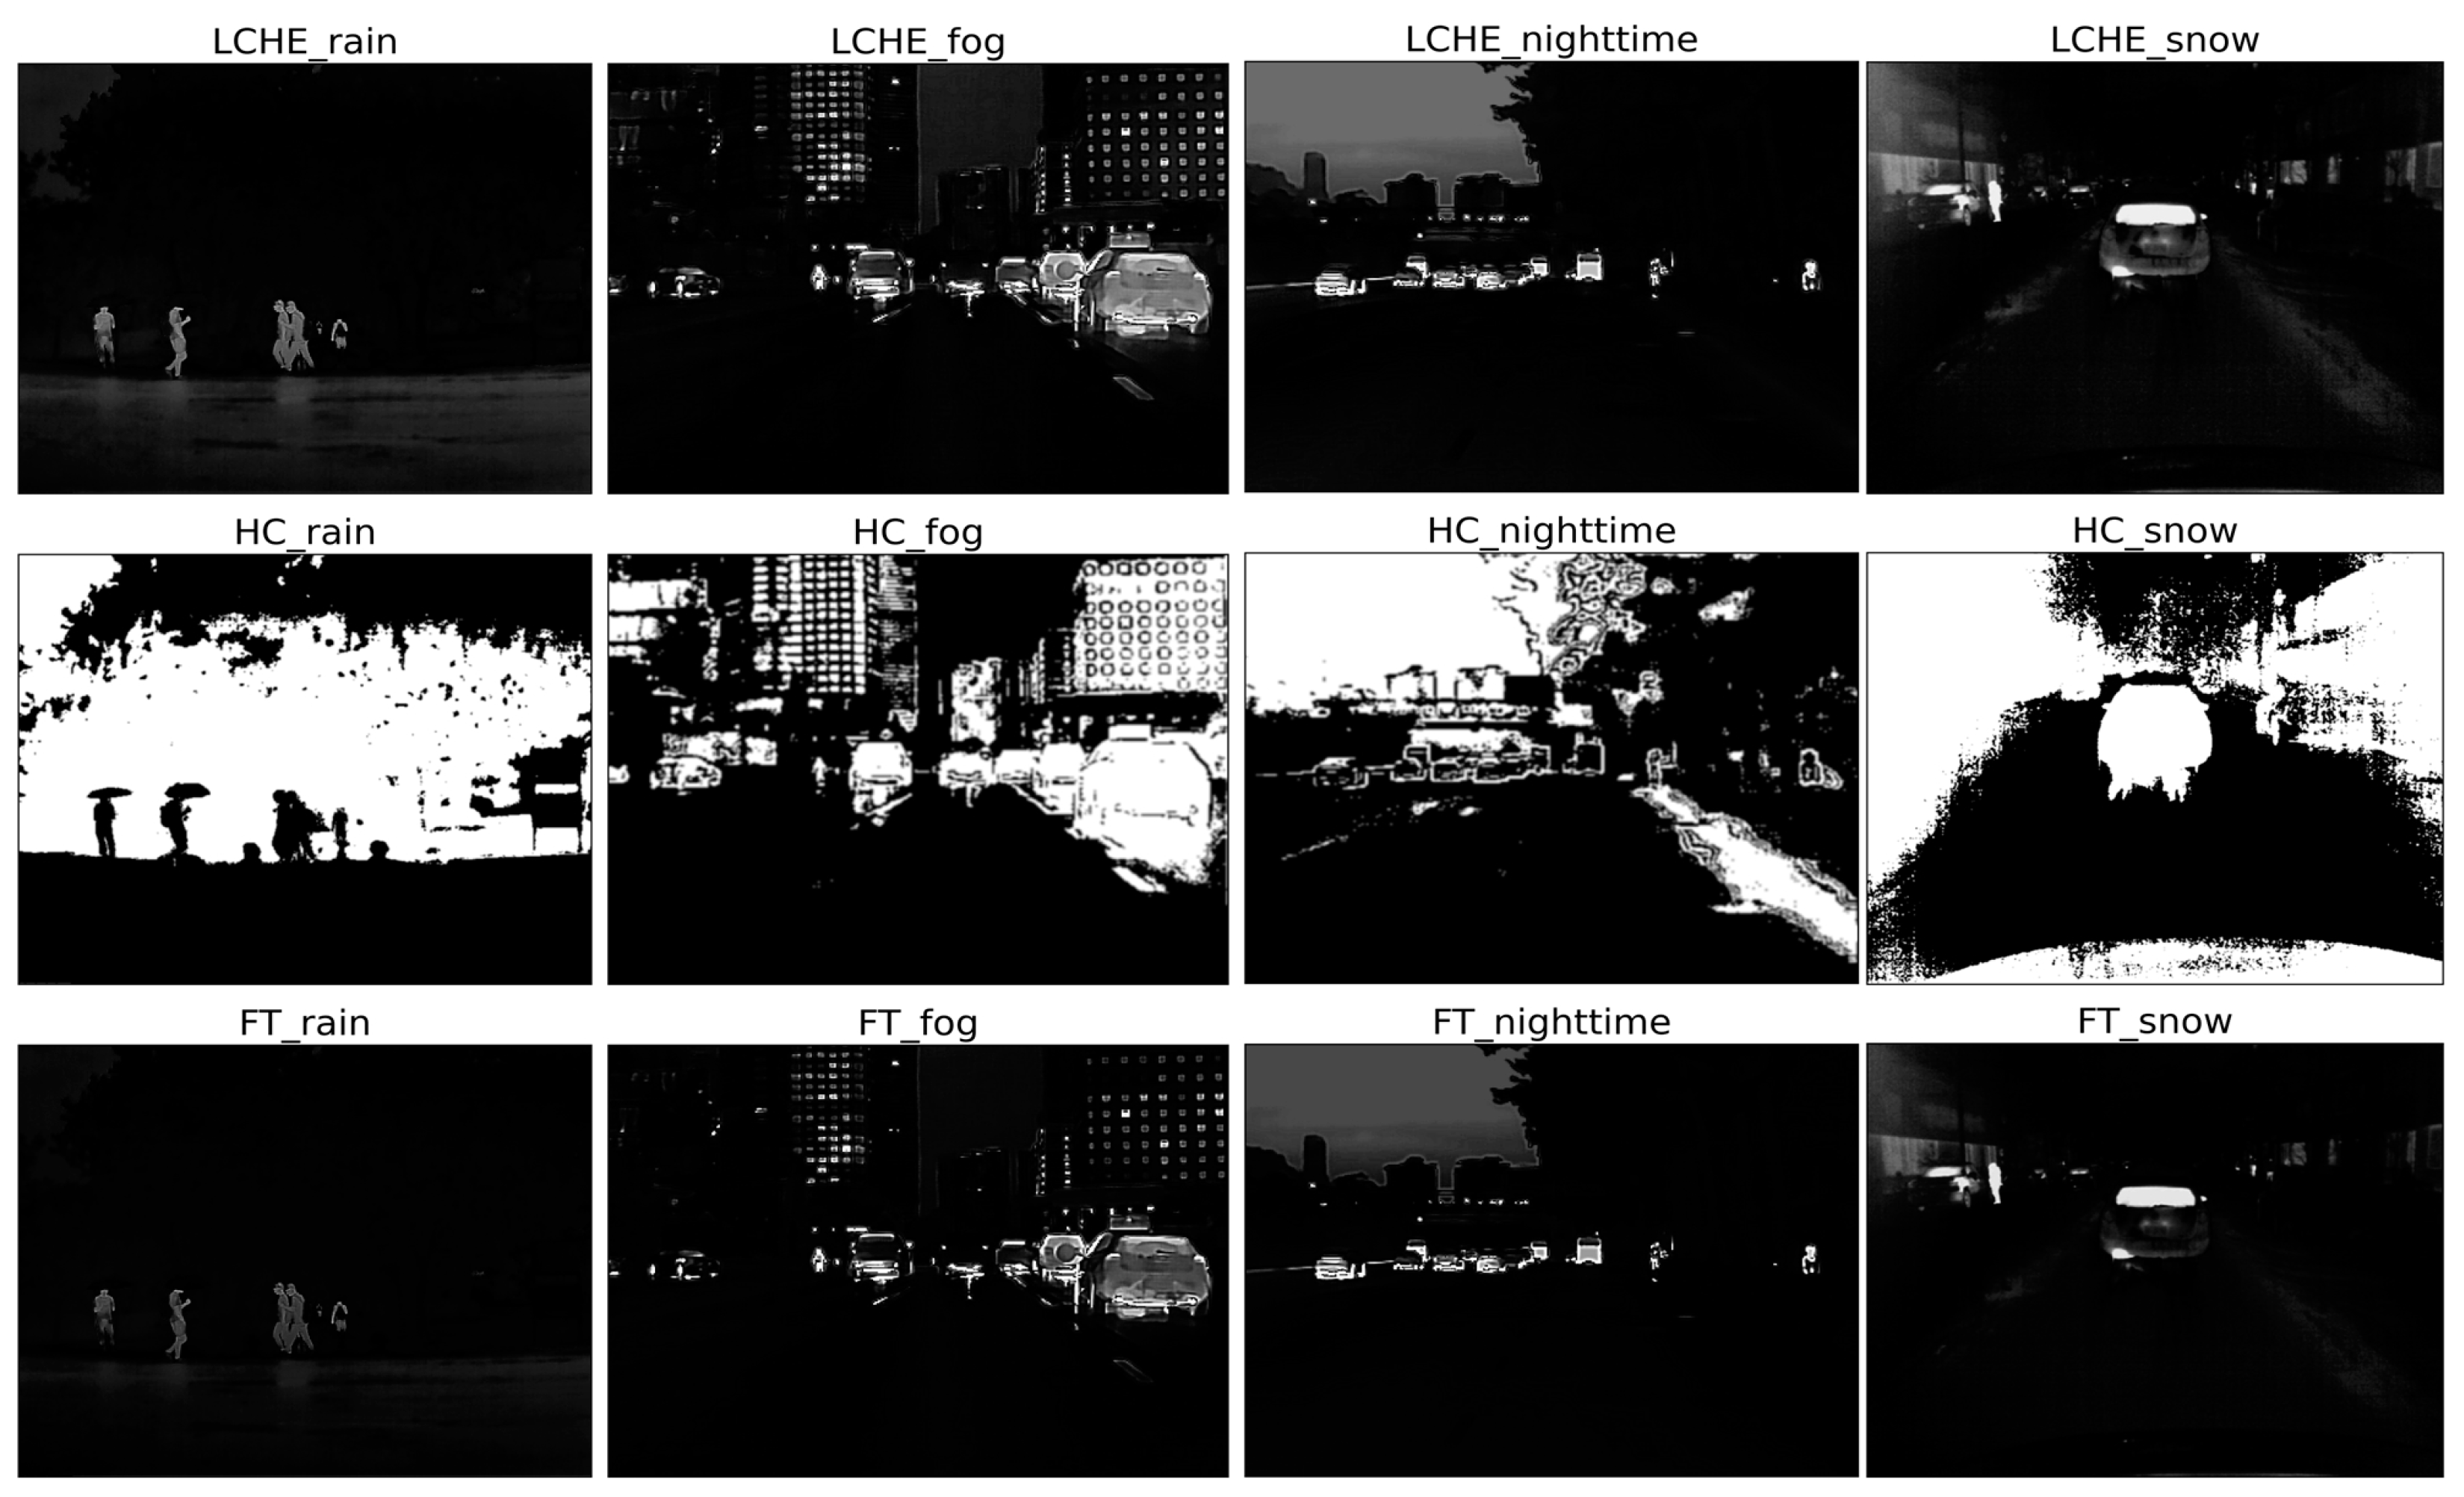
3.2.3. Frequency-Tuned Salient Region Extraction
3.3. Global Contrast Based Saliency Map Detection (LCHE)
3.3.1. Global Contrast Based Salient Region Extraction
3.3.2. Grayscale Distribution Equalization
3.4. Object Detector Based on Deep Learning
3.4.1. Network Structural Improvement
3.4.2. Pre-Trained Models
4. Experiments and Results
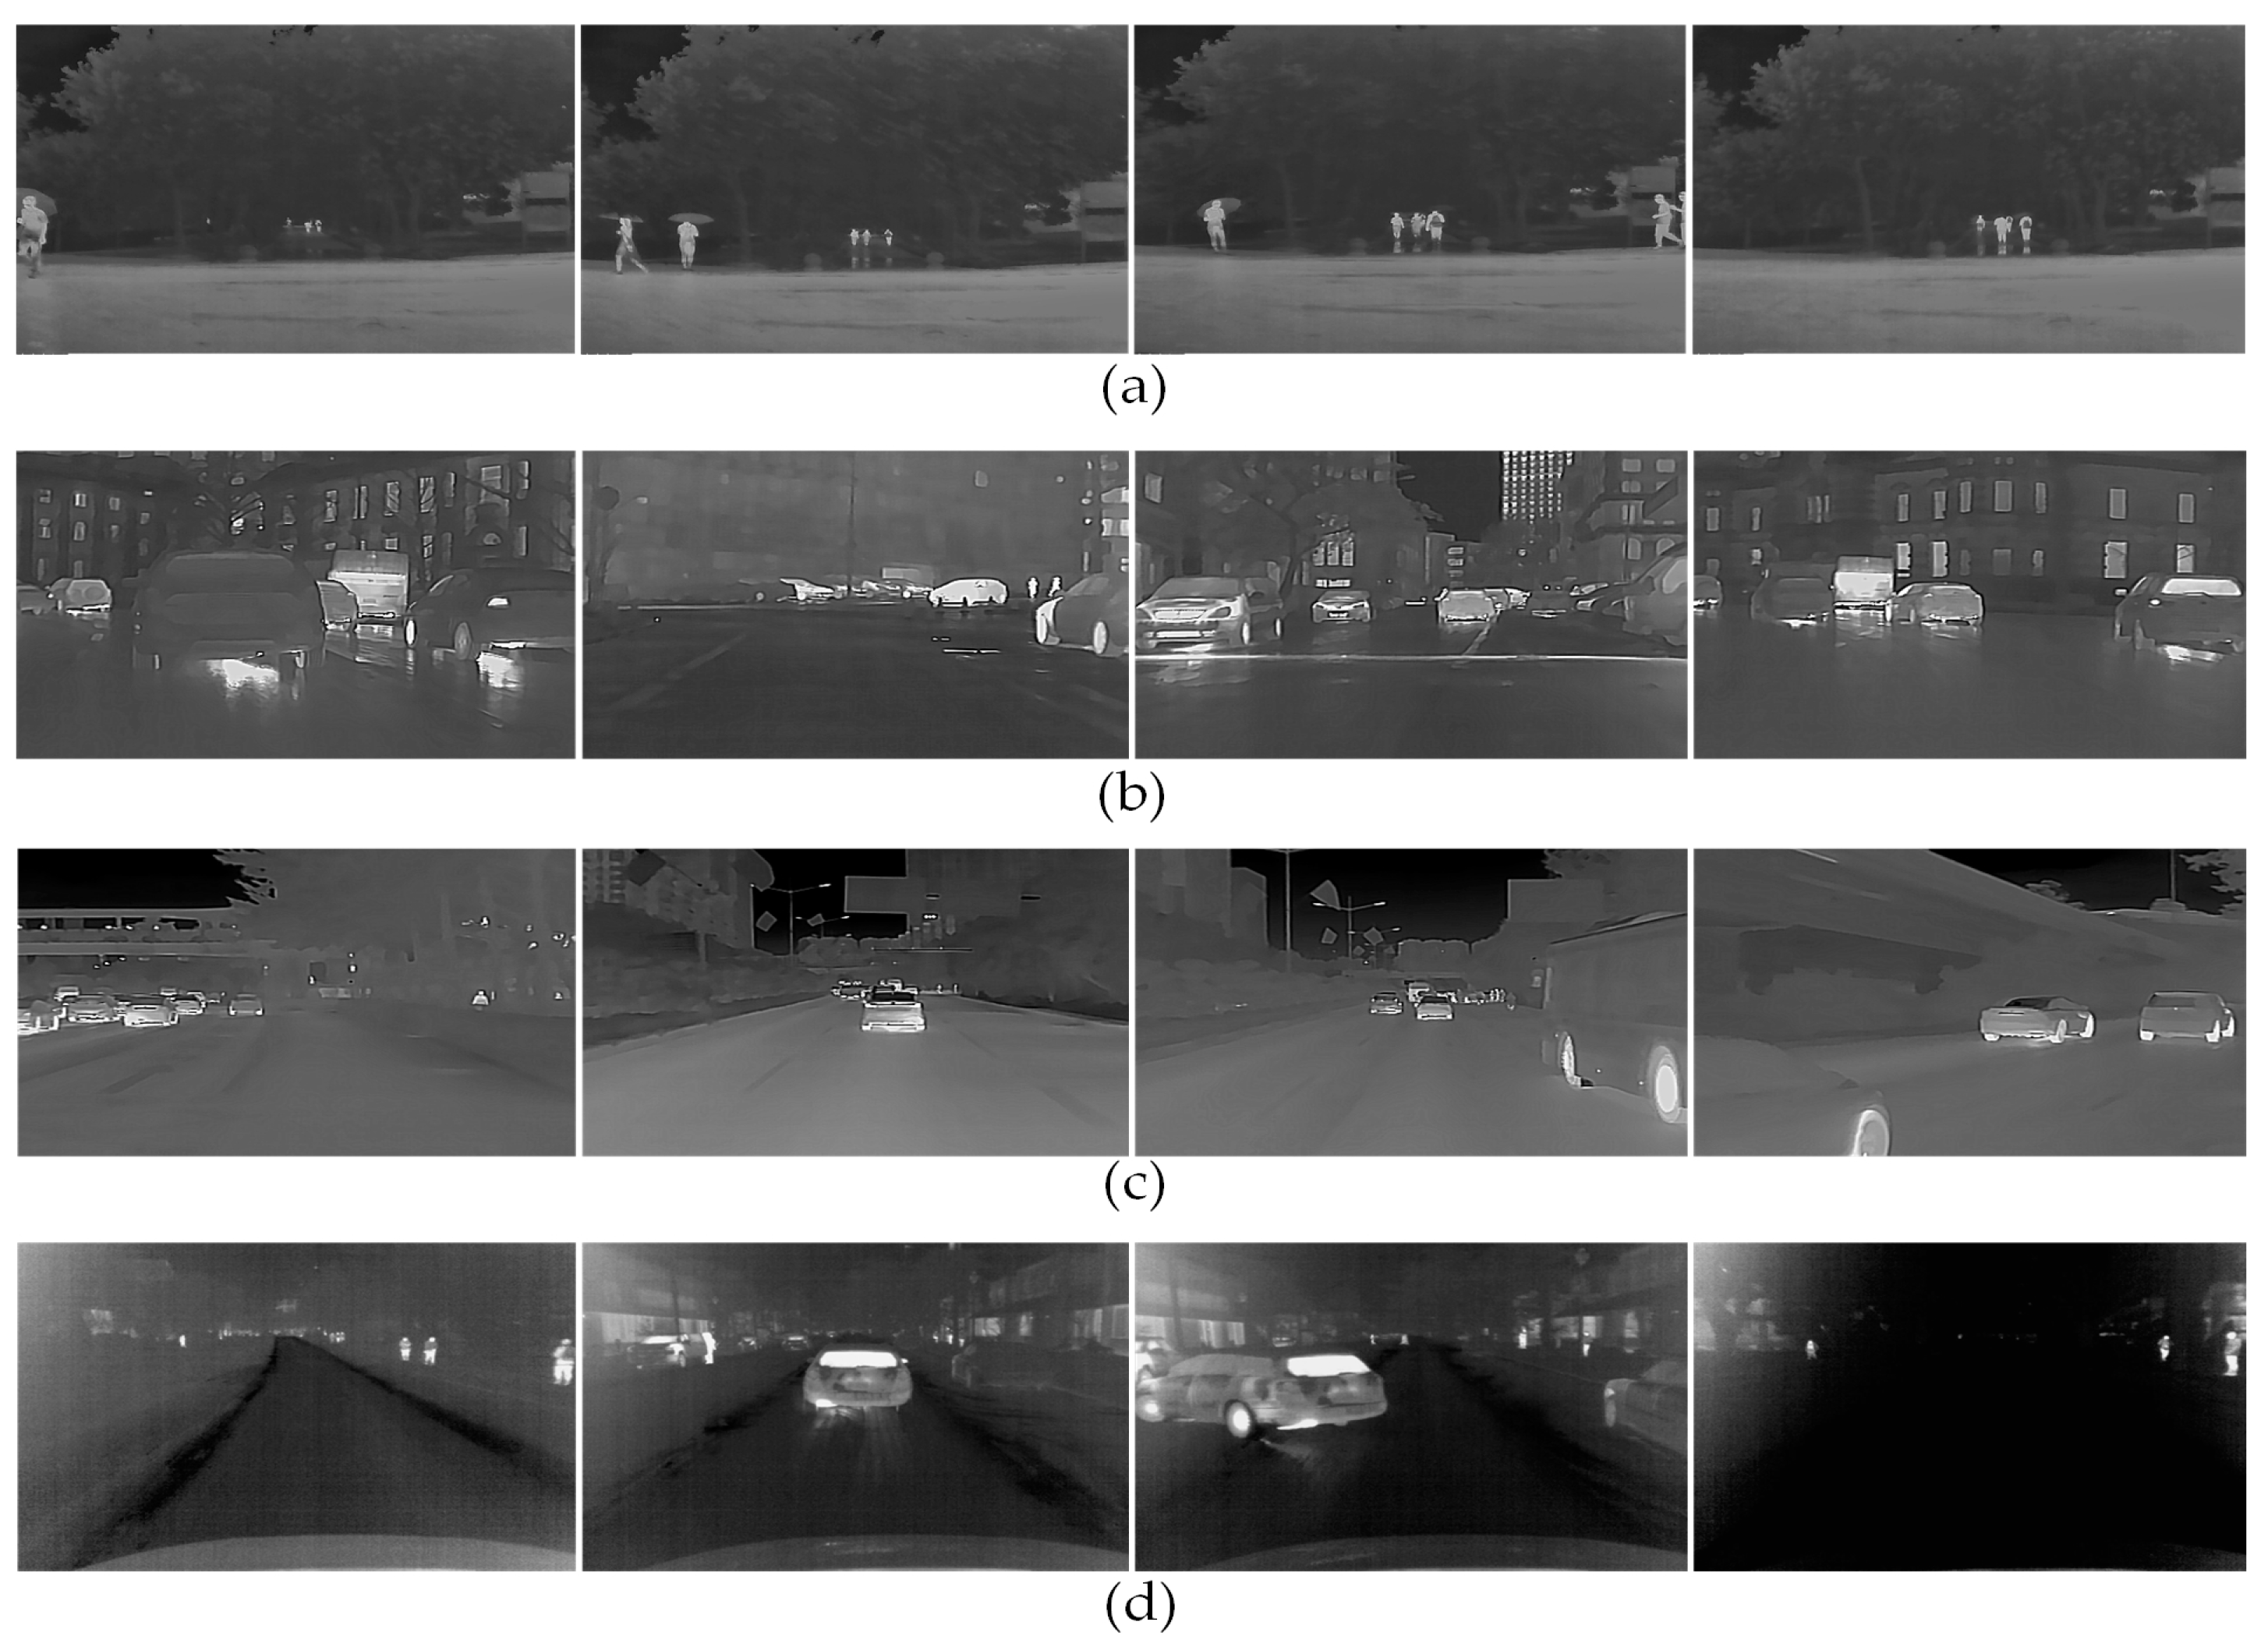
4.1. Low-Visibility Infrared Datasets
- Datasets collected in heavy rain in this paper, a total of 209 infrared images of rainy environments;
- Open-source datasets proposed by Miethig et al. [6], a total of 625 infrared images of snowy environments are used in this paper due to the hardly accessible snowy scenes;
- Open-source datasets introduced from GUIDE SENSING INFRARED database, a total of 215 infrared images each for nighttime and foggy weather. All the detailed information of each dataset and their uses in this paper are detailed in Table 2.
4.2. Performances of Improved Enhancement Methods
4.3. Evaluation Indicators
4.3.1. Peak Signal-to-Noise Ratio
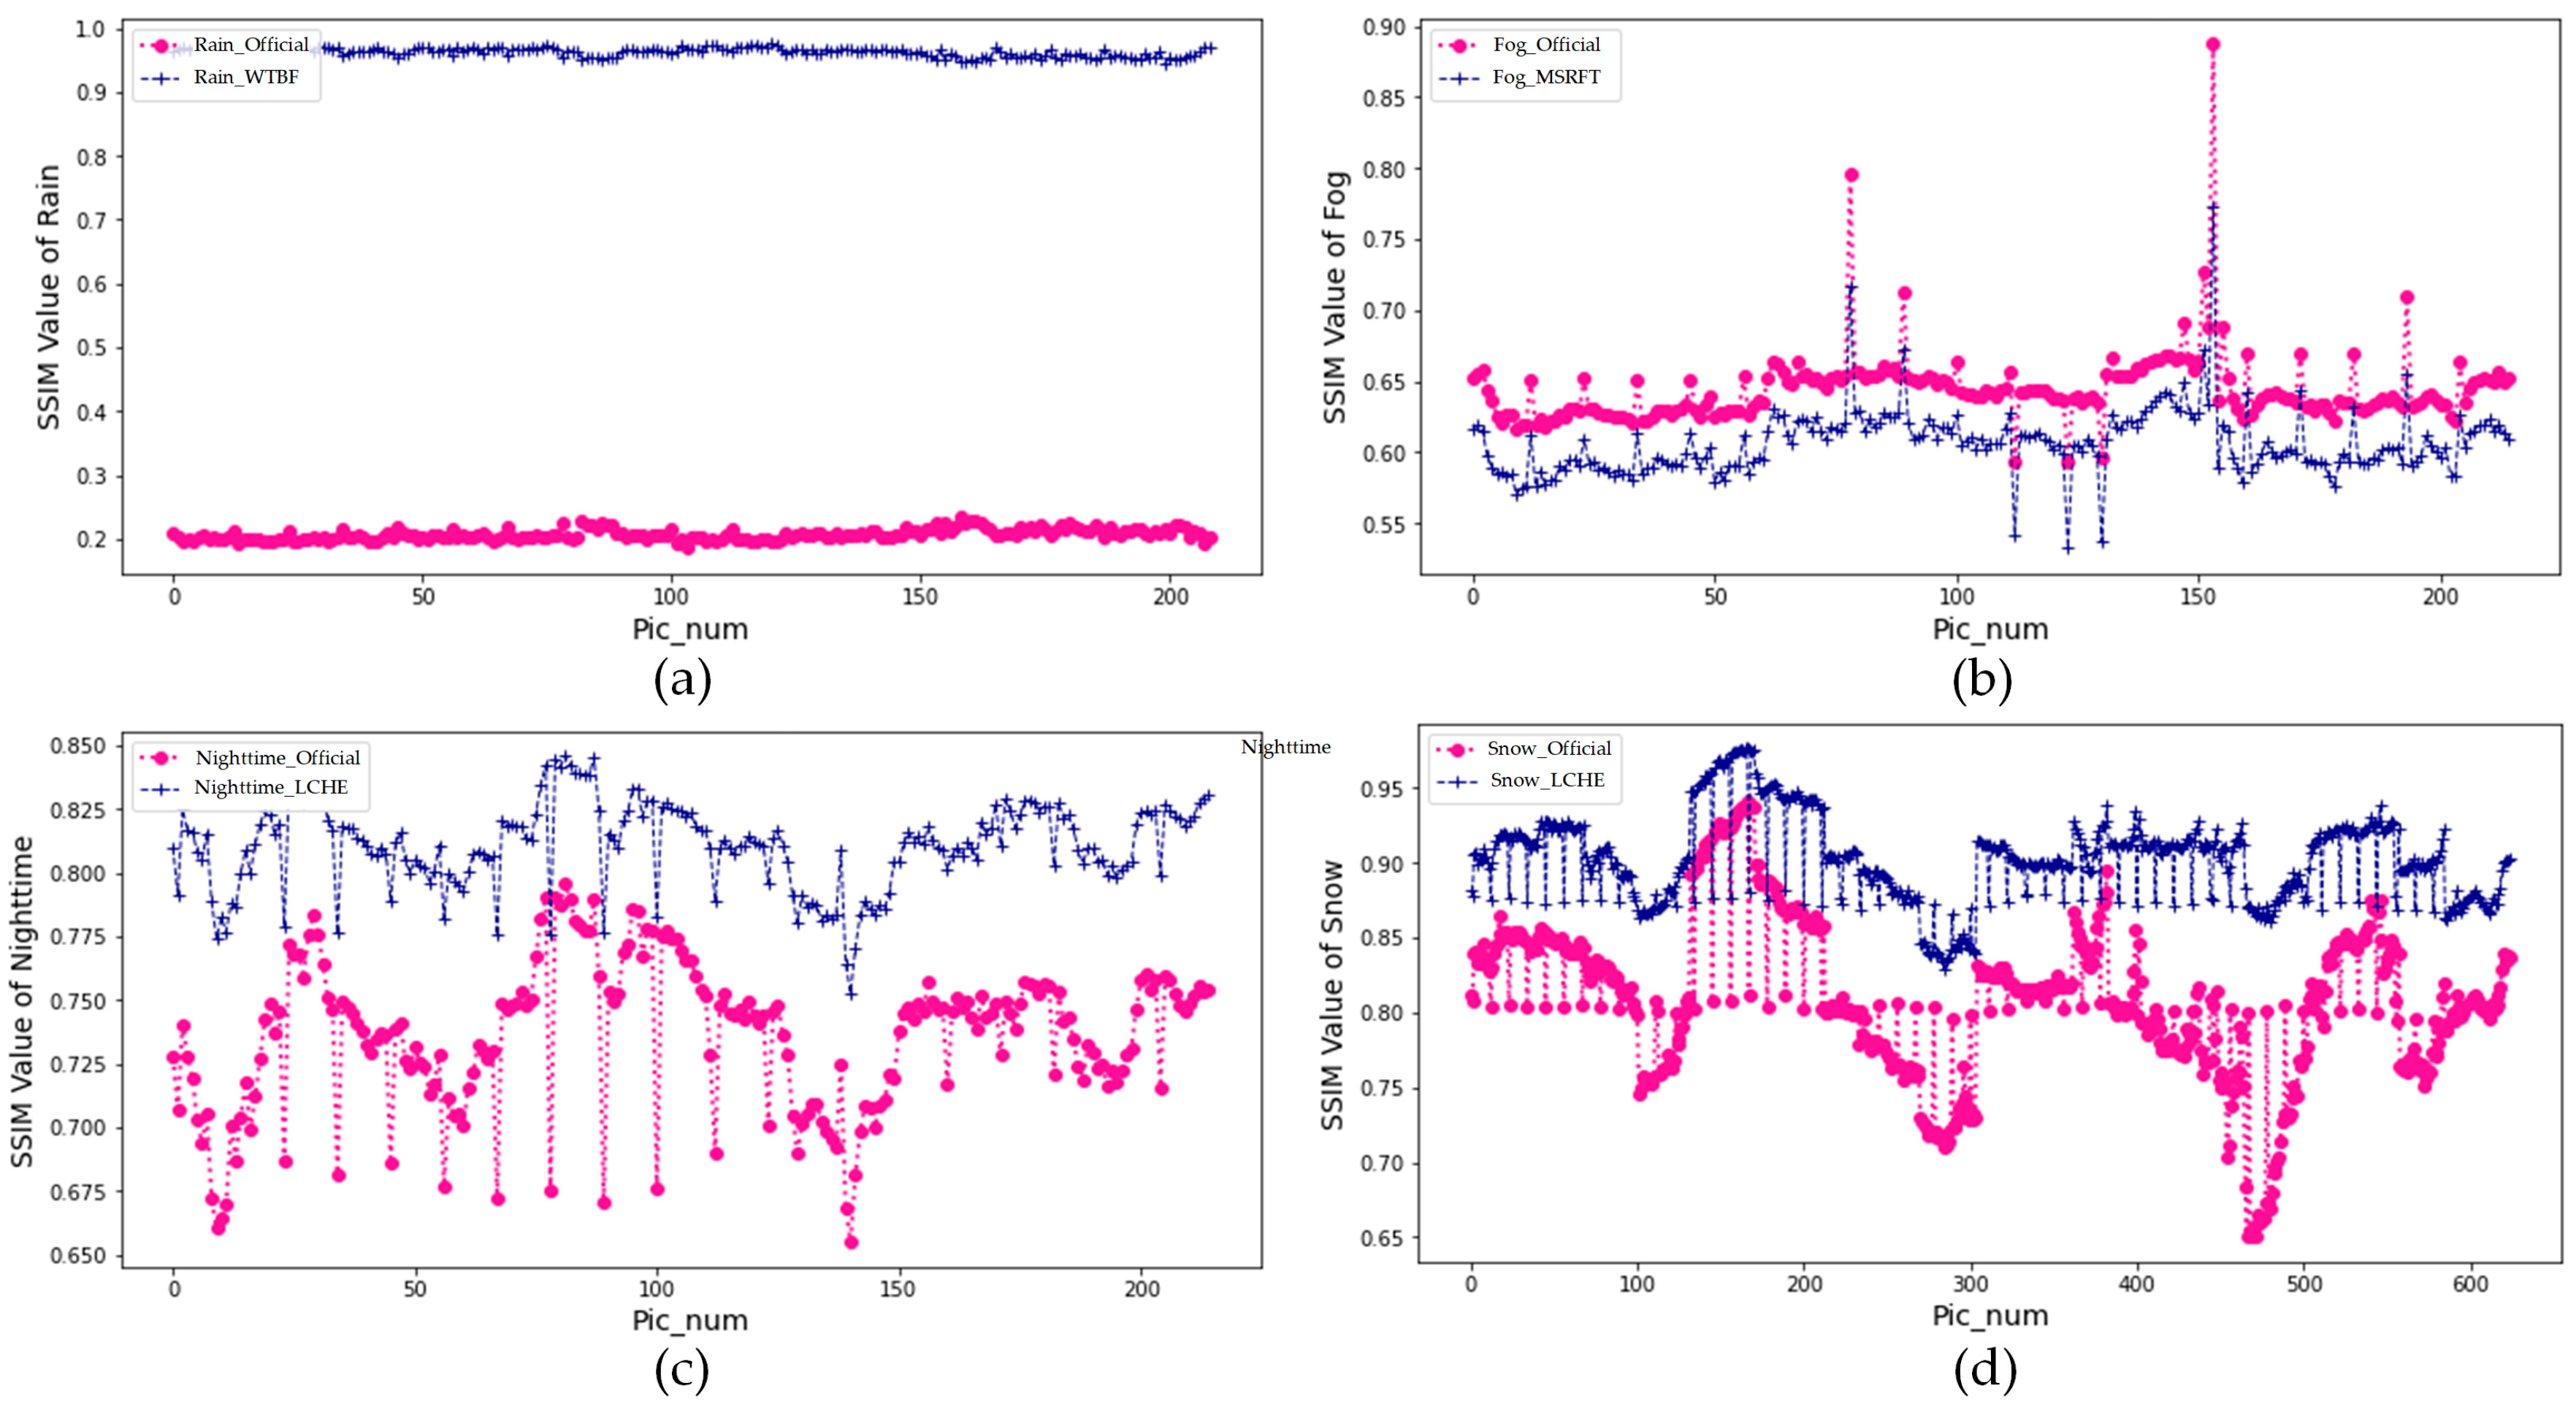
4.3.2. Structural Similarity Index
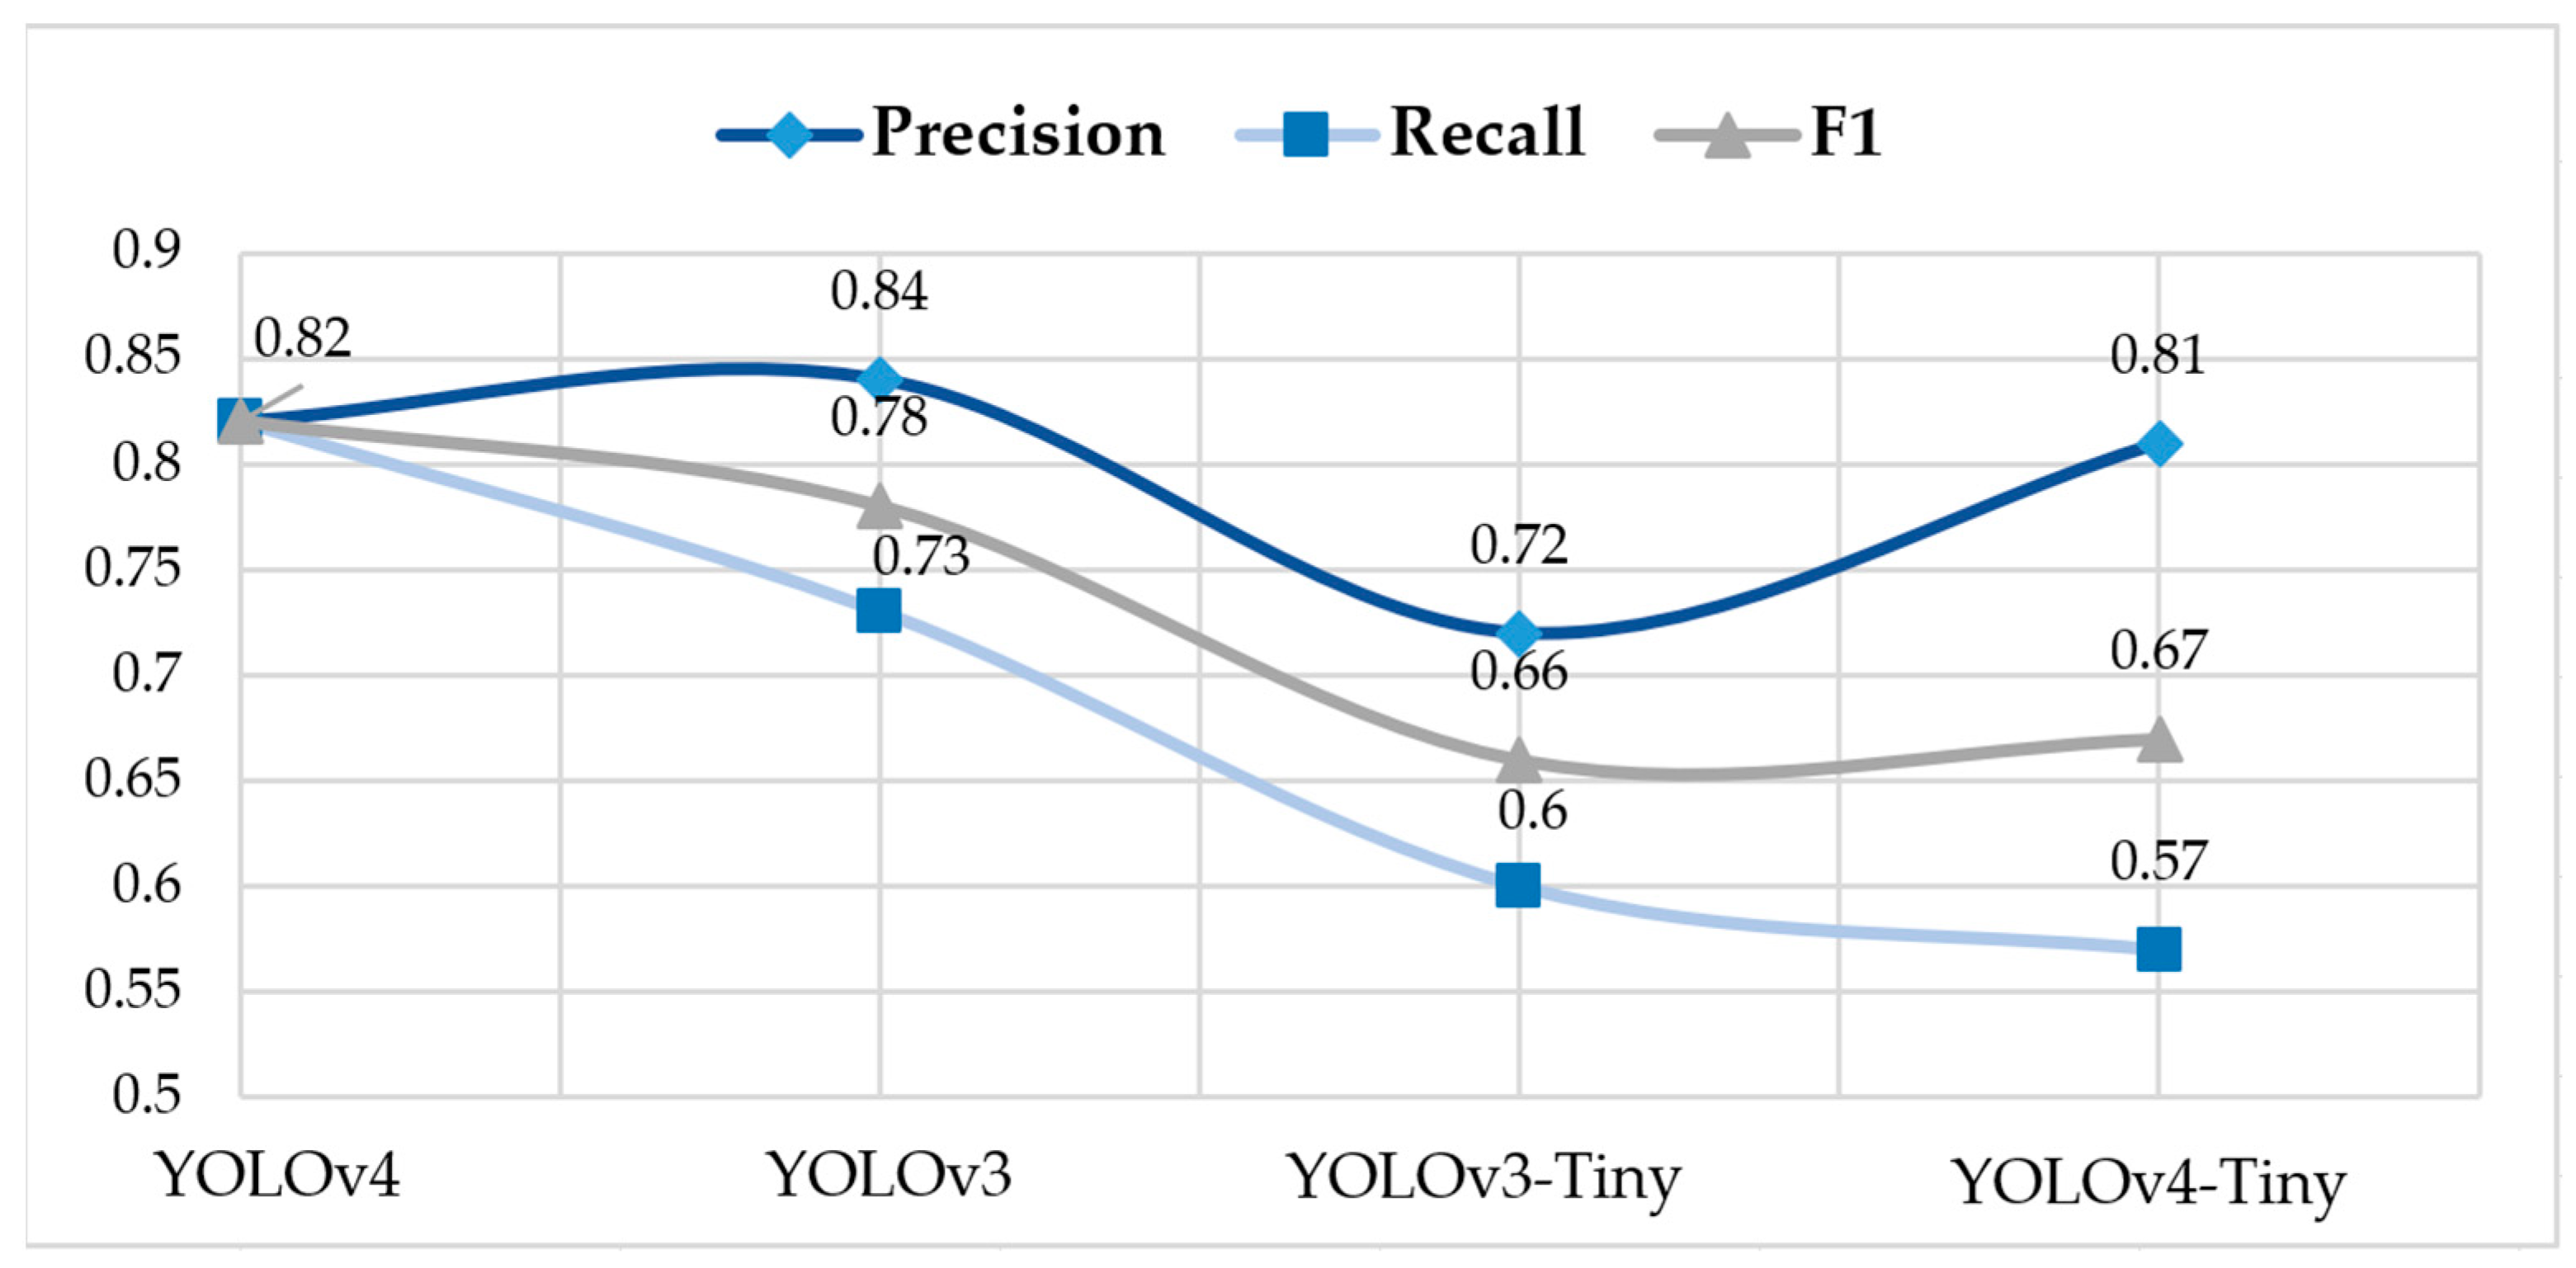
4.3.3. Target Detection Performance
5. Conclusions
Author Contributions
Funding
Institutional Review Board Statement
Informed Consent Statement
Data Availability Statement
Conflicts of Interest
References
- Wu, J.; Xu, H.; Zheng, J.; Zhao, J. Automatic Vehicle Detection with Roadside LiDAR Data under Rainy and Snowy Conditions. In IEEE Intelligent Transportation Systems Magazine; IEEE: Piscataway, NJ, USA, 2020; pp. 197–209. [Google Scholar]
- Brummelen, J.V.; O’Brien, M.; Gruyer, D.; Najjaran, H. Autonomous vehicle perception: The technology of today and tomorrow. Transp. Res. Part C Emerg. Technol. 2018, 89, 384–406. [Google Scholar] [CrossRef]
- Heinzler, R.; Schindler, P.; Seekircher, J.; Ritter, W.; Stork, W. Weather influence and classification with automotive lidar sensors. In Proceedings of the 2019 IEEE Intelligent Vehicles Symposium (IV), Paris, France, 9–12 June 2019; pp. 1527–1534. [Google Scholar]
- Andrey, J.; Mills, B.; Leahy, M.; Suggett, J. Weather as a Chronic Hazard for Road Transportation in Canadian Cities. Nat. Hazards 2003, 28, 319–343. [Google Scholar] [CrossRef]
- Dannheim, C.; Icking, C.; Mäder, M.; Sallis, P. Weather detection in vehicles by means of camera and LIDAR systems. In Proceedings of the 2014 Sixth International Conference on Computational Intelligence, Communication Systems and Networks, Tetova, Macedonia, 27–29 May 2014; pp. 186–191. [Google Scholar]
- Miethig, B.; Liu, A.; Habibi, S.; Mohrenschildt, M.V. Leveraging Thermal Imaging for Autonomous Driving. In Proceedings of the 2019 IEEE Transportation Electrification Conference and Expo (ITEC), Detroit, MI, USA, 19–21 June 2019; pp. 1–5. [Google Scholar]
- Kidangan, R.T.; Krishnamurthy, C.V.; Balasubramaniam, K. Detection of dis-bond between honeycomb and composite facesheet of an Inner Fixed Structure bond panel of a jet engine nacelle using infrared thermographic techniques. Quant. InfraRed Thermogr. J. 2022, 19, 12–26. [Google Scholar] [CrossRef]
- Pérez-Buitrago, S.; Tobón-Pareja, S.; Gómez-Gaviria, Y.; Guerrero-Peña, A.; Díaz-Londoño, G. Methodology to evaluate temperature changes in multiple sclerosis patients by calculating texture features from infrared thermography images. Quant. InfraRed Thermogr. J. 2022, 19, 1–11. [Google Scholar] [CrossRef]
- Tao, N.; Wang, C.; Zhang, C.; Sun, J. Quantitative measurement of cast metal relics by pulsed thermal imaging. Quant. InfraRed Thermogr. J. 2022, 19, 27–40. [Google Scholar] [CrossRef]
- Koroteeva, E.Y.; Bashkatov, A.A. Thermal signatures of liquid droplets on a skin induced by emotional sweating. Quant. InfraRed Thermogr. J. 2021, 19, 115–125. [Google Scholar] [CrossRef]
- Gabbi, A.M.; Kolling, G.J.; Fischer, V.; Pereira, L.G.R.; Tomich, T.R.; Machado, F.S.; Campos, M.M.; Silva, M.V.G.B.d.; Cunha, C.S.; Santos, M.K.R.; et al. Use of infrared thermography to estimate enteric methane production in dairy heifers. Quant. InfraRed Thermogr. J. 2021, 19, 187–195. [Google Scholar] [CrossRef]
- Larbi Youcef, M.H.A.; Feuillet, V.; Ibos, L.; Candau, Y. In situ quantitative diagnosis of insulated building walls using passive infrared thermography. Quant. InfraRed Thermogr. J. 2020, 19, 41–69. [Google Scholar] [CrossRef]
- Baek, J.; Hong, S.; Kim, J.; Kim, E. Efficient Pedestrian Detection at Nighttime Using a Thermal Camera. Sensors 2017, 17, 1850. [Google Scholar] [CrossRef] [Green Version]
- Xiao, J.; Ying, D.; Wu, Z.; Fang, Z. A Simultaneous Localization And Mapping Technology Based On Fusion of Radar and Camera. J. Phys. Conf. Ser. 2022, 2264, 012029. [Google Scholar] [CrossRef]
- Rasshofer, R.H.; Spies, M.; Spies, H. Influences of weather phenomena on automotive laser radar systems. Adv. Radio Sci. 2011, 9, 49–60. [Google Scholar] [CrossRef] [Green Version]
- Cord, A.; Gimonet, N. Detecting Unfocused Raindrops: In-Vehicle Multipurpose Cameras. Robot. Autom. Mag. 2014, 21, 49–56. [Google Scholar] [CrossRef]
- Dong, X.; Huang, X.; Zheng, Y.; Shen, L.; Bai, S. Infrared dim and small target detecting and tracking method inspired by Human Visual System. Infrared Phys. Technol. 2014, 62, 100–109. [Google Scholar] [CrossRef]
- Li, S.; Li, C.; Yang, X.; Zhang, K.; Yin, J. Infrared Dim Target Detection Method Inspired by Human Vision System. Optik 2020, 206, 164167. [Google Scholar] [CrossRef]
- Wang, X.; Lv, G.; Xu, L. Infrared dim target detection based on visual attention. Infrared Phys. Technol. 2012, 55, 513–521. [Google Scholar] [CrossRef]
- Peng, L.; Yan, B.; Ye, R.; Sun, G.H. An infrared dim and small target detection method based on fractional differential. In Proceedings of the The 30th Chinese Control and Decision Conference, Shenyang, China, 9–11 June 2018. [Google Scholar]
- Li, J.; Yang, P.; Cui, W.; Zhang, T. A Cascade Method for Infrared Dim Target Detection. Infrared Phys. Technol. 2021, 117, 103768. [Google Scholar] [CrossRef]
- Zhang, T.; Zhang, X. A novel algorithm for infrared image contrast enhancement based on neutrosophic sets. Quant. InfraRed Thermogr. J. 2021, 18, 344–356. [Google Scholar] [CrossRef]
- Saxena, A.; Raman, V.; Ng, E.Y.K. Study on methods to extract high contrast image in active dynamic thermography. Quant. InfraRed Thermogr. J. 2019, 16, 243–259. [Google Scholar] [CrossRef]
- Fidali, M.; Jamrozik, W. Method of classification of global machine conditions based on spectral features of infrared images and classifiers fusion. Quant. InfraRed Thermogr. J. 2019, 16, 129–145. [Google Scholar] [CrossRef]
- Krišto, M.; Ivasic-Kos, M.; Pobar, M. Thermal Object Detection in Difficult Weather Conditions Using YOLO. IEEE Access 2020, 8, 125459–125476. [Google Scholar] [CrossRef]
- Umehara, Y.; Tsukada, Y.; Nakamura, K.; Tanaka, S.; Nakahata, K. Research on Identification of Road Features from Point Cloud Data Using Deep Learning. Int. J. Autom. Technol. 2021, 15, 274–289. [Google Scholar] [CrossRef]
- Hassaballah, M.; Kenk, M.A.; Muhammad, K.; Mina Ee, S. Vehicle Detection and Tracking in Adverse Weather Using a Deep Learning Framework. IEEE Trans. Intell. Transp. Syst. 2020, 22, 4230–4242. [Google Scholar] [CrossRef]
- Ren, S.; He, K.; Girshick, R.; Sun, J. Faster R-CNN: Towards Real-Time Object Detection with Region Proposal Networks. IEEE Trans. Pattern Anal. Mach. Intell. 2017, 39, 1137–1149. [Google Scholar] [CrossRef] [PubMed] [Green Version]
- Liu, W.; Anguelov, D.; Erhan, D.; Szegedy, C.; Reed, S.; Fu, C.Y.; Berg, A.C. SSD: Single Shot MultiBox Detector; Springer: Berlin/Heidelberg, Germany, 2015. [Google Scholar]
- Cai, Z.; Vasconcelos, N. Cascade R-CNN: Delving into High Quality Object Detection. In Proceedings of the IEEE Conference on Computer Vision and Pattern Recognition, Salt Lake City, UT, USA, 18–22 June 2018; pp. 6154–6162. [Google Scholar] [CrossRef] [Green Version]
- Ghose, D.; Desai, S.M.; Bhattacharya, S.; Chakraborty, D.; Fiterau, M.; Rahman, T. Pedestrian Detection in Thermal Images using Saliency Maps. In Proceedings of the IEEE/CVF Conference on Computer Vision and Pattern Recognition Workshops, Long Beach, CA, USA, 16–20 June 2019. [Google Scholar]
- Munir, F.; Azam, S.; Jeon, M. SSTN: Self-Supervised Domain Adaptation Thermal Object Detection for Autonomous Driving. In Proceedings of the 2021 IEEE/RSJ International Conference on Intelligent Robots and Systems (IROS), Prague, Czech Republic, 27 September–1 October 2021. [Google Scholar]
- Chen, C. Application of improved single-scale Retinex algorithm in image enhancement. Comput. Appl. Softw. 2013, 30, 4. [Google Scholar]
- Wang, J.; Li, H.; Fu, W.; Chen, Y.; Li, L.; Lyu, Q.; Han, T.; Chai, X. Image Processing Strategies Based on a Visual Saliency Model for Object Recognition Under Simulated Prosthetic Vision. Artif. Organs 2016, 40, 94–100. [Google Scholar] [CrossRef]
- Bochkovskiy, A.; Wang, C.Y.; Liao, H. YOLOv4: Optimal Speed and Accuracy of Object Detection. arXiv 2020. [Google Scholar] [CrossRef]


| Version | Backbone | Precision | Recall | F1 |
|---|---|---|---|---|
| YOLOv4 | CSPDarknet53 | 0.82 | 0.82 | 0.82 |
| YOLOv3 | Darknet-53 | 0.84 | 0.73 | 0.78 |
| YOLOv3-Tiny | Darknet-53 | 0.72 | 0.60 | 0.66 |
| YOLOv4-Tiny | CSPDarknet53 | 0.81 | 0.57 | 0.67 |
| Data Source | Ambient Temperature | Weather Condition | Resolution | Enhancement Phase | Detection Phase |
|---|---|---|---|---|---|
| This paper | 15 °C | Heavy rain | 640 × 512 | 209 | 100 |
| Open source | 13 °C | Heavy fog | 384 × 288 | 215 | 100 |
| Open source | 17 °C | Nighttime | 384 × 288 | 215 | 100 |
| Open source | 0 °C | Heavy snow | 875 × 700 | 625 | 100 |
| PSNR | Value (dB) | Evaluation |
| ≥40 | Excellent | |
| 30–40 | Good | |
| 20–30 | Worse | |
| ≤20 | Unacceptable |
| Variables | Definition |
|---|---|
| The mean of x | |
| The mean of y | |
| The variance of x | |
| The variance of y | |
| The covariance of x and y | |
| , | = (k2L)2 |
| L | The scale of the pixel, L = 255.0 |
| k1, k2 | k1 = 0.01, k2 = 0.03 |
| Low-Visibility Scenes | SSIM | |
|---|---|---|
| Mean | Standard Deviation | |
| Rain_Official | 0.21 | 0.008 |
| Rain_WTBF | 0.96 | 0.007 |
| Fog_Official | 0.64 | 0.026 |
| Fog_MSRFT | 0.61 | 0.024 |
| Nighttime_Official | 0.74 | 0.029 |
| Nighttime_LCHE | 0.81 | 0.017 |
| Snow_Official | 0.81 | 0.053 |
| Snow_LCHE | 0.90 | 0.029 |
| Low-Visibility Scenes | Object Detector (Backbone) | Accuracy | |
|---|---|---|---|
| Car | People | ||
| Rain_Official | YOLOv4 Network (CSPDarknet53) | 0.360 | 0.850 |
| Rain_WTBF | 0.480 | 0.860 | |
| Fog_Official | 0.87 | 0.46 | |
| Fog_MSRFT | / | / | |
| Nighttime_Official | 0.844 | / | |
| Nighttime_LCHE | 0.856 | / | |
| Snow_Official | 0.870 | 0.760 | |
| Snow_LCHE | 0.90 | 0.740 | |
Publisher’s Note: MDPI stays neutral with regard to jurisdictional claims in published maps and institutional affiliations. |
© 2022 by the authors. Licensee MDPI, Basel, Switzerland. This article is an open access article distributed under the terms and conditions of the Creative Commons Attribution (CC BY) license (https://creativecommons.org/licenses/by/4.0/).
Share and Cite
Tan, H.; Ou, D.; Zhang, L.; Shen, G.; Li, X.; Ji, Y. Infrared Sensation-Based Salient Targets Enhancement Methods in Low-Visibility Scenes. Sensors 2022, 22, 5835. https://doi.org/10.3390/s22155835
Tan H, Ou D, Zhang L, Shen G, Li X, Ji Y. Infrared Sensation-Based Salient Targets Enhancement Methods in Low-Visibility Scenes. Sensors. 2022; 22(15):5835. https://doi.org/10.3390/s22155835
Chicago/Turabian StyleTan, Hongjun, Dongxiu Ou, Lei Zhang, Guochen Shen, Xinghua Li, and Yuqing Ji. 2022. "Infrared Sensation-Based Salient Targets Enhancement Methods in Low-Visibility Scenes" Sensors 22, no. 15: 5835. https://doi.org/10.3390/s22155835
APA StyleTan, H., Ou, D., Zhang, L., Shen, G., Li, X., & Ji, Y. (2022). Infrared Sensation-Based Salient Targets Enhancement Methods in Low-Visibility Scenes. Sensors, 22(15), 5835. https://doi.org/10.3390/s22155835