
Cost-Effective Open-Ended Coaxial Technique for Liquid Food Characterization by Using the Reflection Method for Industrial Applications


Abstract
:1. Introduction

| Sample | Range | Goodness of Estimation | Error | Device and Probe | Frequency | Cost of the Device | Author |
|---|---|---|---|---|---|---|---|
| Baijiu (chinese liquor) | 40–56% alcohol by volume | R2 higher than 0.985 | 0.60% | Semi-rigid RG402 coaxial cable terminated with a female-type SMA (SubMiniature version A) connected to a FieldFox N9951A portable microwave analyzer (Keysight Technologies, Penang, Malaysia) | 2–20 GHz | Probe: low cost Network analyzer: high cost | [1] |
| chickpea flour | 7.9–20.9% moisture content | R2 0.984–0.995 | N.R. | An open-ended coaxial line probe connected to an impedance analyzer (HP4291B, Hewlett Packard Corp., Santa Clara, CA, USA) | 10–1800 MHz | High cost (but N.R.) | [7] |
| Vidalia onions | 8–91% moisture content | up to R2 0.99 | up to 1.3% | Agilent 85070E open-ended coaxial line probe connected to a 5230C PNA-L Network Analyzer | 200 MHz–20 GHz | High cost (but N.R.) | [8] |
| Vegetable olis | Adulteration of olive oil with different percentages of sunflower oil 10–40% | PCA classification of the different samples | N.R. | Digital serial analyzer oscilloscope (Tetronix DSA 8200), equipped with a TDR module (Tektronix TDR 80E04) | 20 Hz–1 MHz and 0–1.5 GHz | High cost (but N.R.) | [19] |
| Meat pork | Quality classes (Pale, Soft and Exudative (PSE), Dark, Firm and Dry (DFD) and Red, Firm and Non-exudative (RFN) | Classification with multifactorial ANOVA | 95% confidence | Agilent 85070E Open-ended Coaxial Probe connected to an Agilent E8362B Vector Network Analyzer | 500 MHz–20 GHz | High cost (but N.R.) | [12] |
| Meat pork after salting process | Samples were dipped in 25% NaCl solution for 0, 5, 10, 15, 25, 30, 40, 50, 60, and 90 min; 2, 2.5, 3, 4, 5, 8, and 12 h. | R2 0.98 | N.R. | Agilent 85070E Open-ended Coaxial Probe connected to an Agilent E8362B Vector Network Analyzer | 500 MHz–20 GHz | High cost (but N.R.) | [14] |
| Rum Havana Club Anejo 3 Anos ~ | Mixtures with methanol, ethanol, and deionized water | N.R. | 3.3–6.3% range deviation values | PNA-X series Vector Network Analyzer (VNA) and the 85070-E model coaxial probe | 500 MHz to 15 GHz | High cost (but N.R.) | [11] |
| Apple (Granny Smith) maturity | Maturity Index (MIdielectric) as a function of the Thiault Index (TI) | up to R2 0.84 | N.R. | Agilent 85070E Open-ended Coaxial Probe connected to an Agilent E8362B Vector Network Analyzer | 500 MHz–20 GHz | High cost (but N.R.) | [26] |
| Milk | UHT whole, low fat and skim milk | N.R. | N.R. | Hewlett Packard 8510C Network Analyzer coupled to an 83651B Synthesized Sweeper, Agilent coaxial probe | 1–20 GHz | High cost (but N.R.) | [18] |
| Butter | 17–19% moisture content | up to R2 0.97 | N.R. | A vector network analyzer (Model: Agilent 8722ES, Agilent Technology, Palo Alto, Santa Clara, CA, USA) with an open-ended coaxial cable (#8120-6192, Hewlett Packard) connected to a probe (85070C, Agilent Technology, Palo Alto, Santa Clara, CA, USA) | 500–3000 MHz | High cost (but N.R.) | [9] |
| Hen eggs | white albumin and yolk of eggs up to 15 days | up to R2 0.999 | N.R. | Hewlett–Packard 85070B open-ended coaxial probe connected to an Agilent 4291B Impedance Analyzer (Agilent technologies, Inc., Palo Alto, Santa Clara, CA, USA). | 0.02–1.8 GHz | High cost (but N.R.) | [20] |
| Acetic acid | 0–10% | R2 > 0.99 | N.R. | A Hewlett–Packard 8510C network analyzer, coupled to an 83651B synthesized sweeper, and an 8517B S-parameter and Agilent 85070C coaxial probe | 1–20 GHz | High cost (but N.R.) | [17] |
| Mexican sauces | permittivity as a function of moisture content, specific heat, viscosity, water activity, density, and electrical conductivity | N.R. | N.R. | Coaxial probe (Keysight Technologies, Santa Rosa, CA, USA) attached to a vector network analyzer (Keysight Technologies) | 500 MHz–6 GHz | High cost (but N.R.) | [10] |
| pulque (Mexican traditional drink) | permittivity of different juice mixtures (natural, strawberry, and pineapple/coconut pulque) | N.R. | N.R. | A vector network analyzer, VNA (Keysight Technologies, N9918A FieldFox) and an 85070E open-ended coaxial probe kit | 100 MHz–25 GHz | High cost (but N.R.) | [16] |
2. Materials and Methods
2.1. Materials
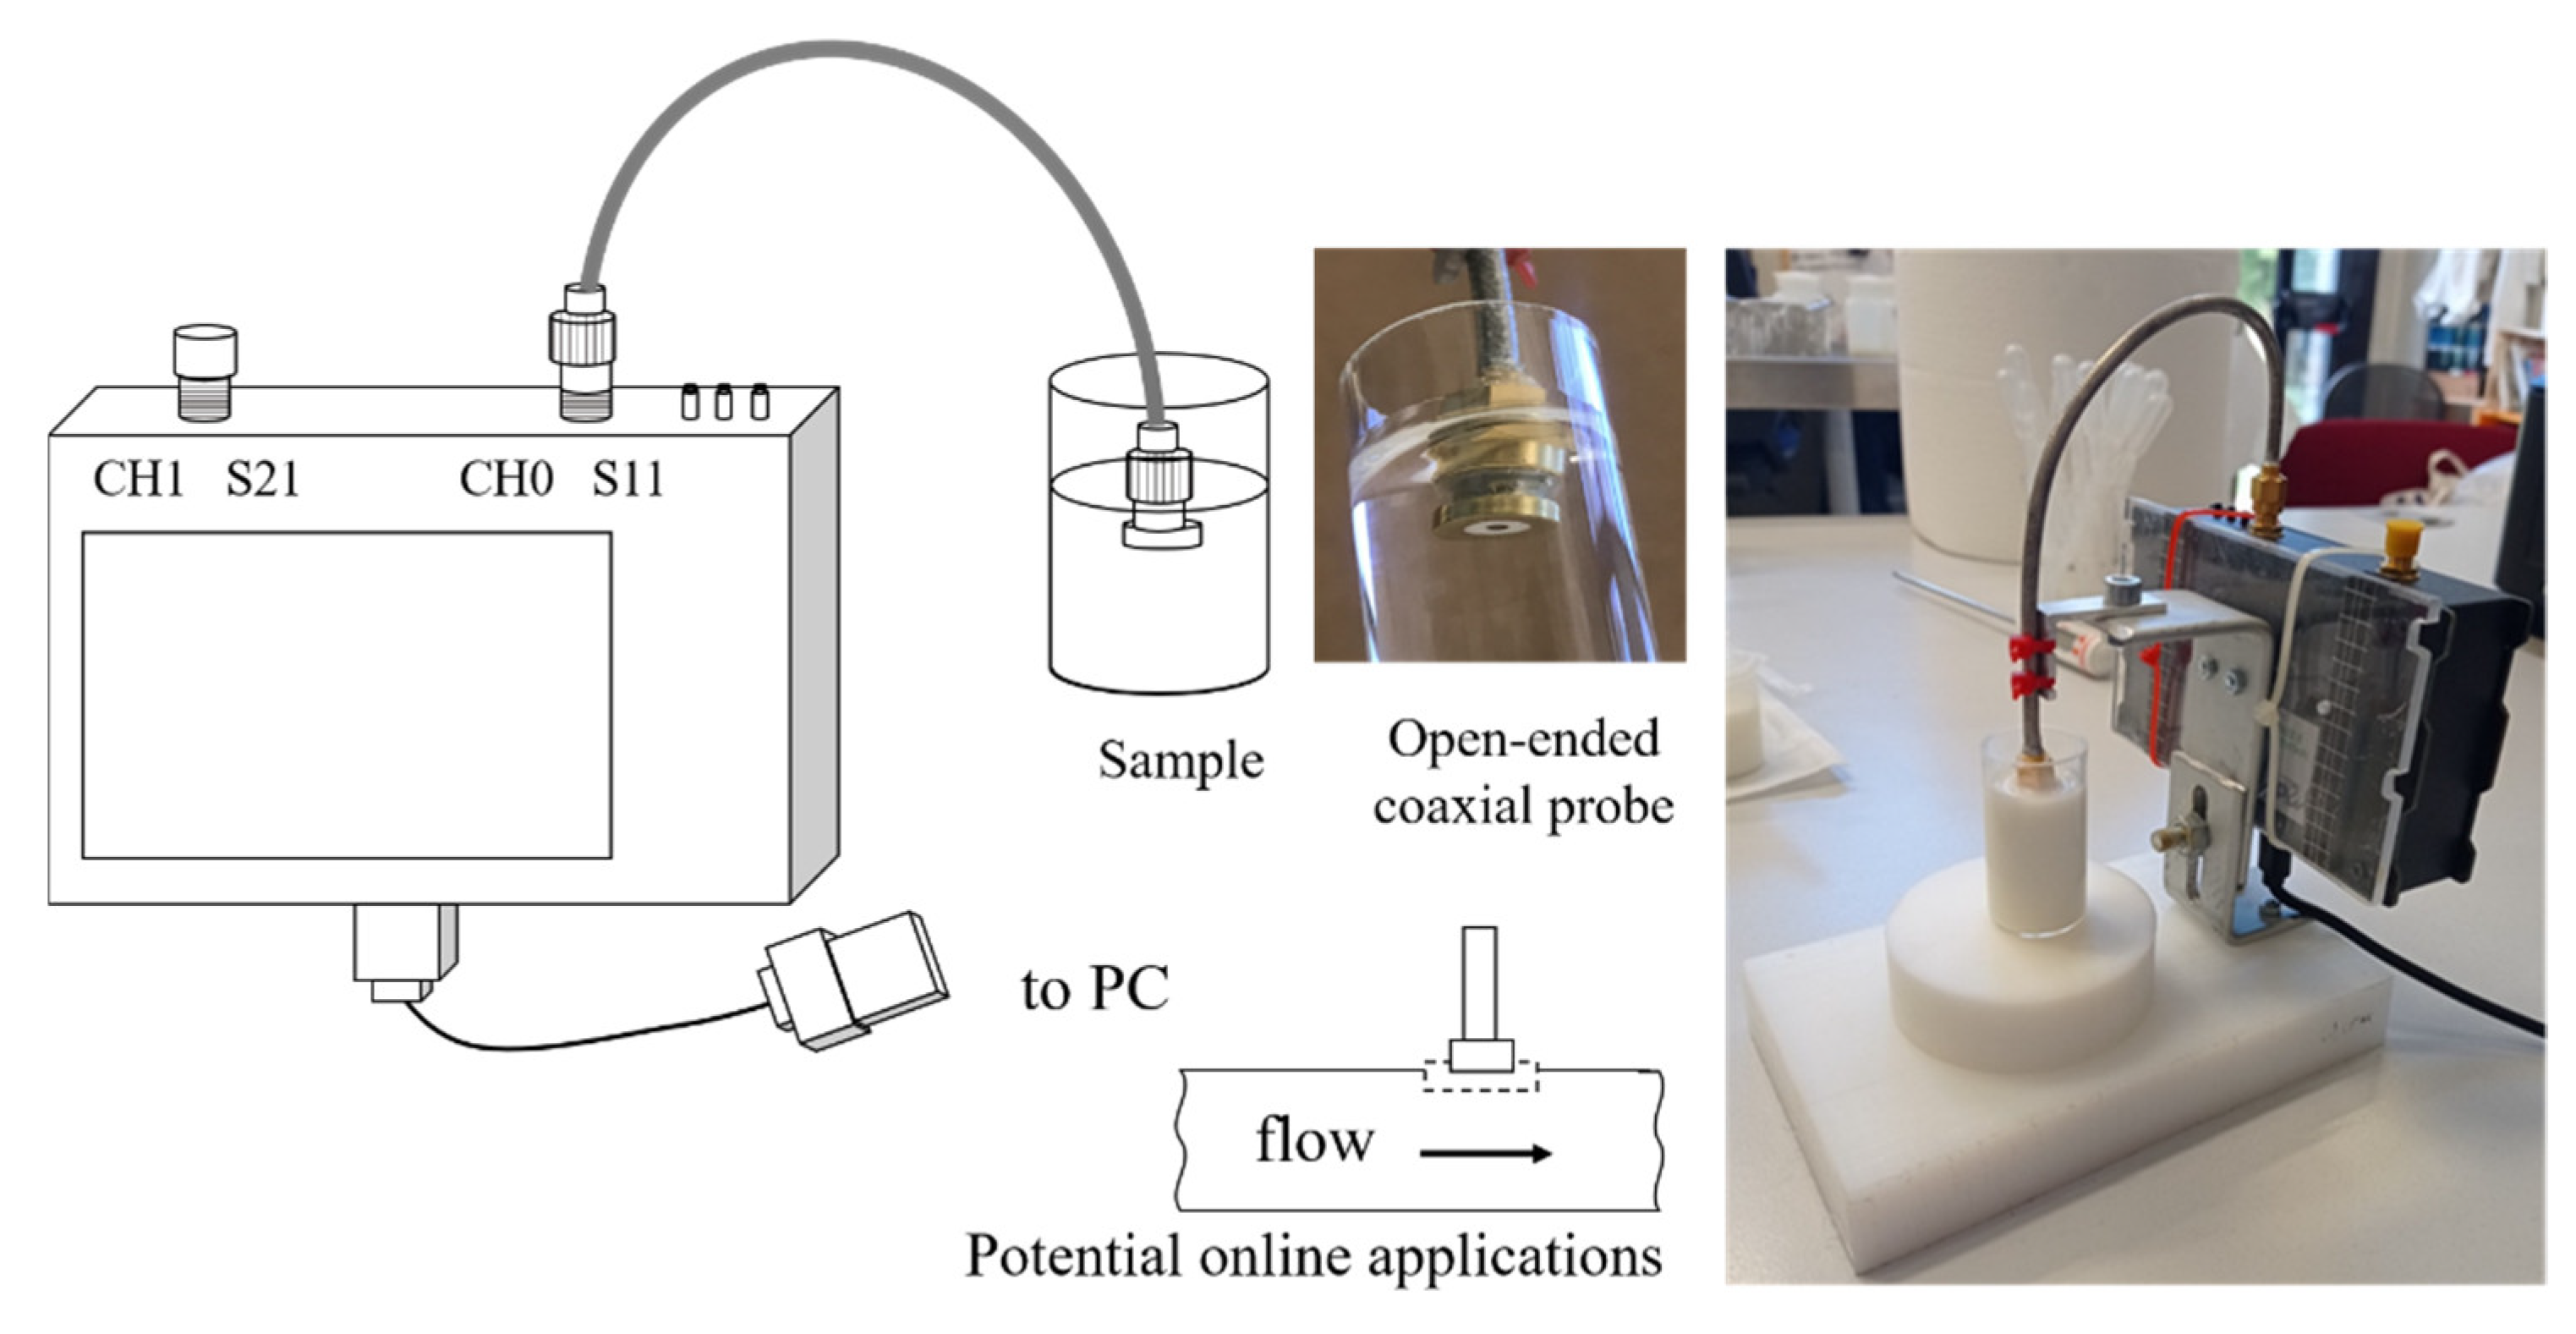
2.2. Setup of the Device
2.3. Data Analysis
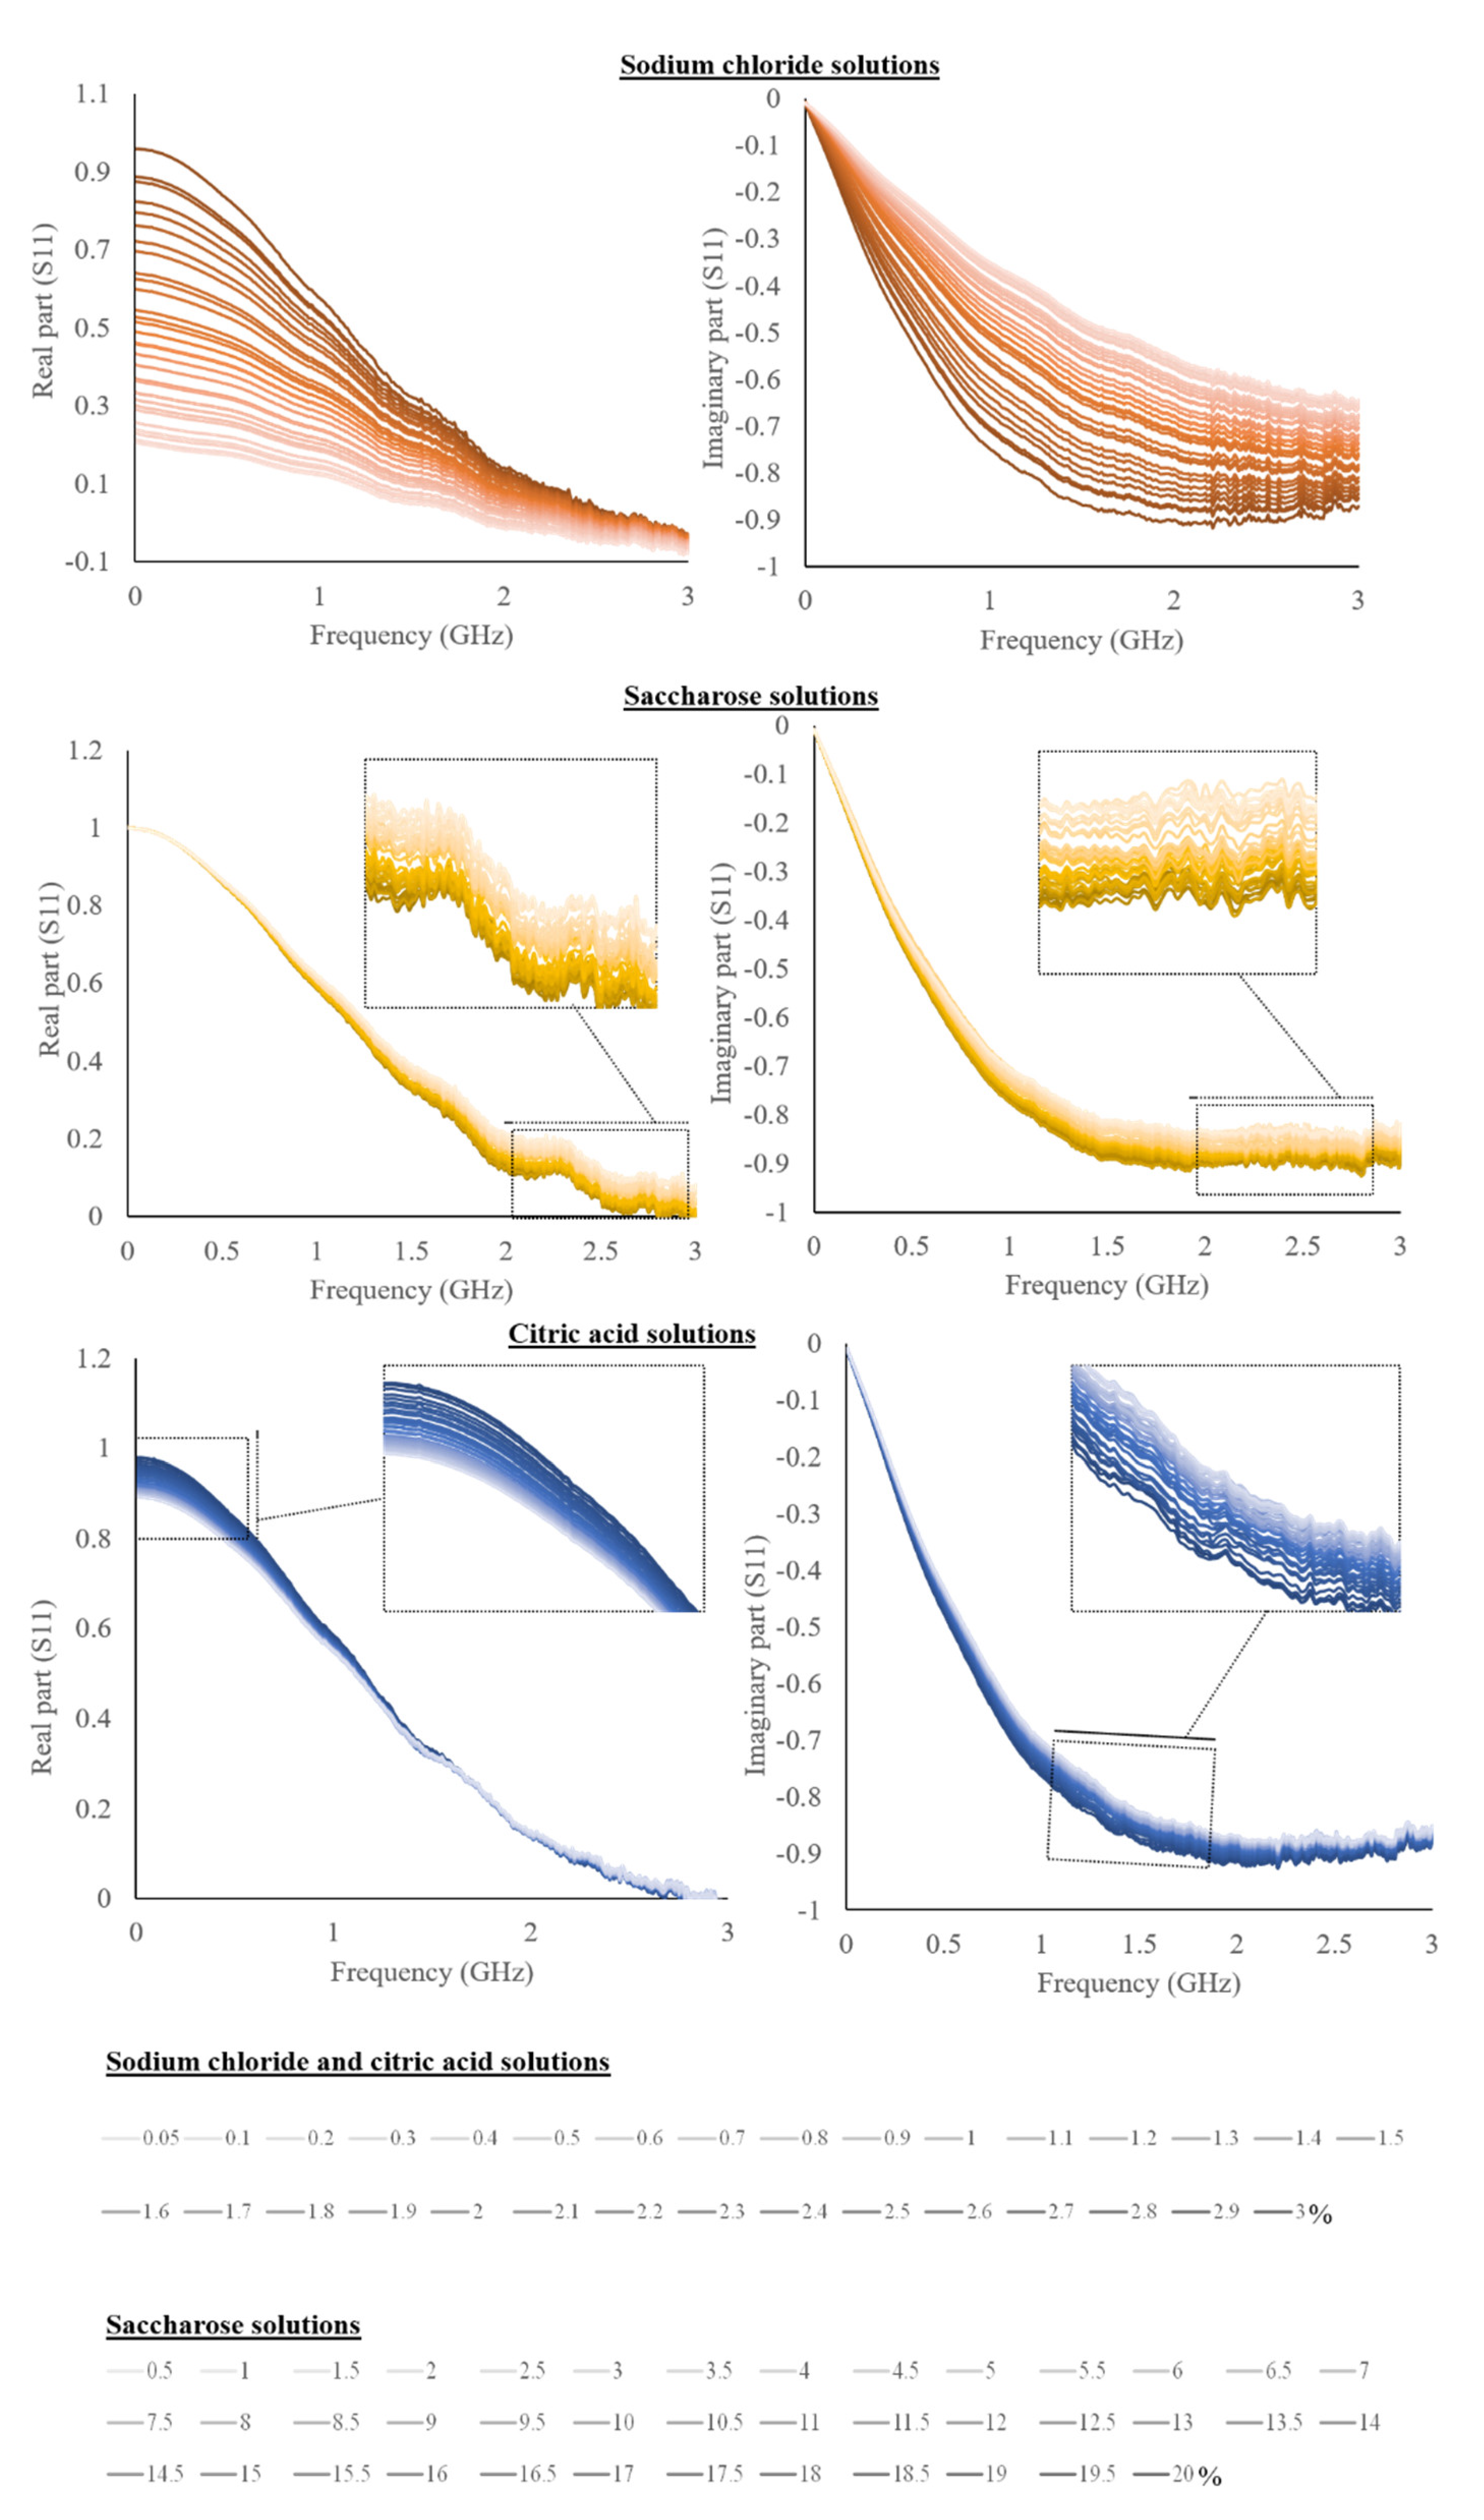
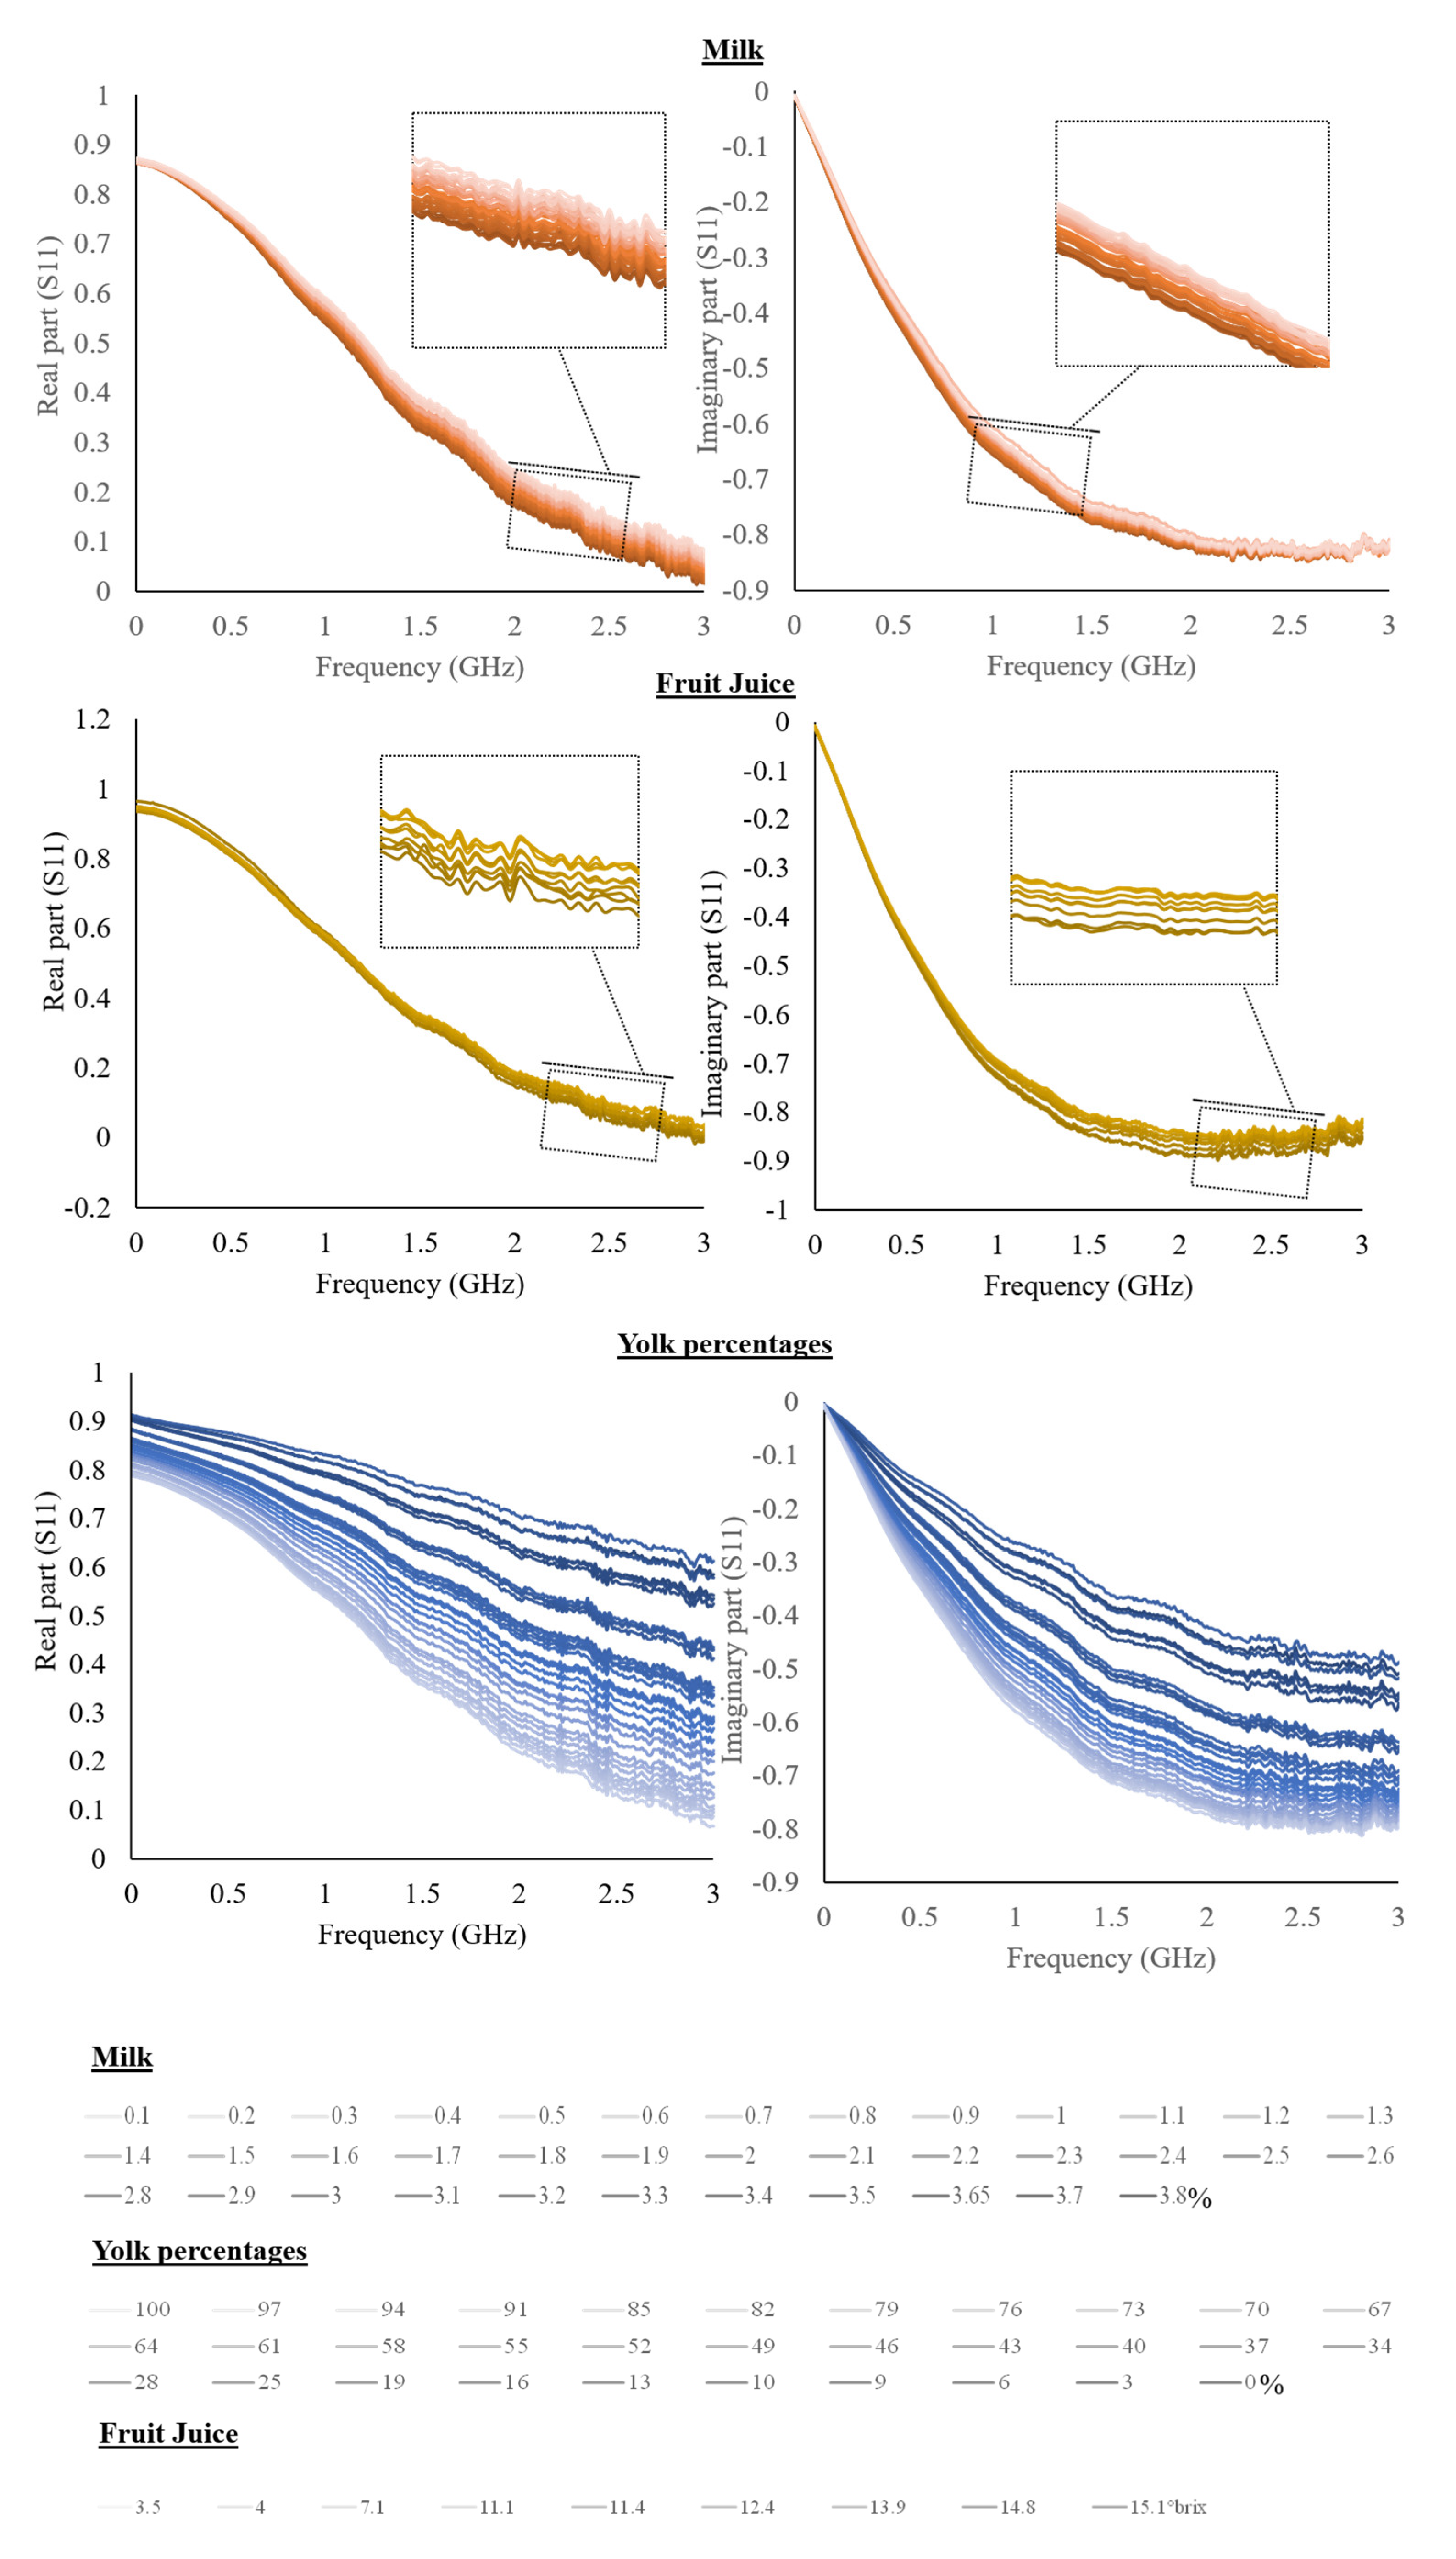
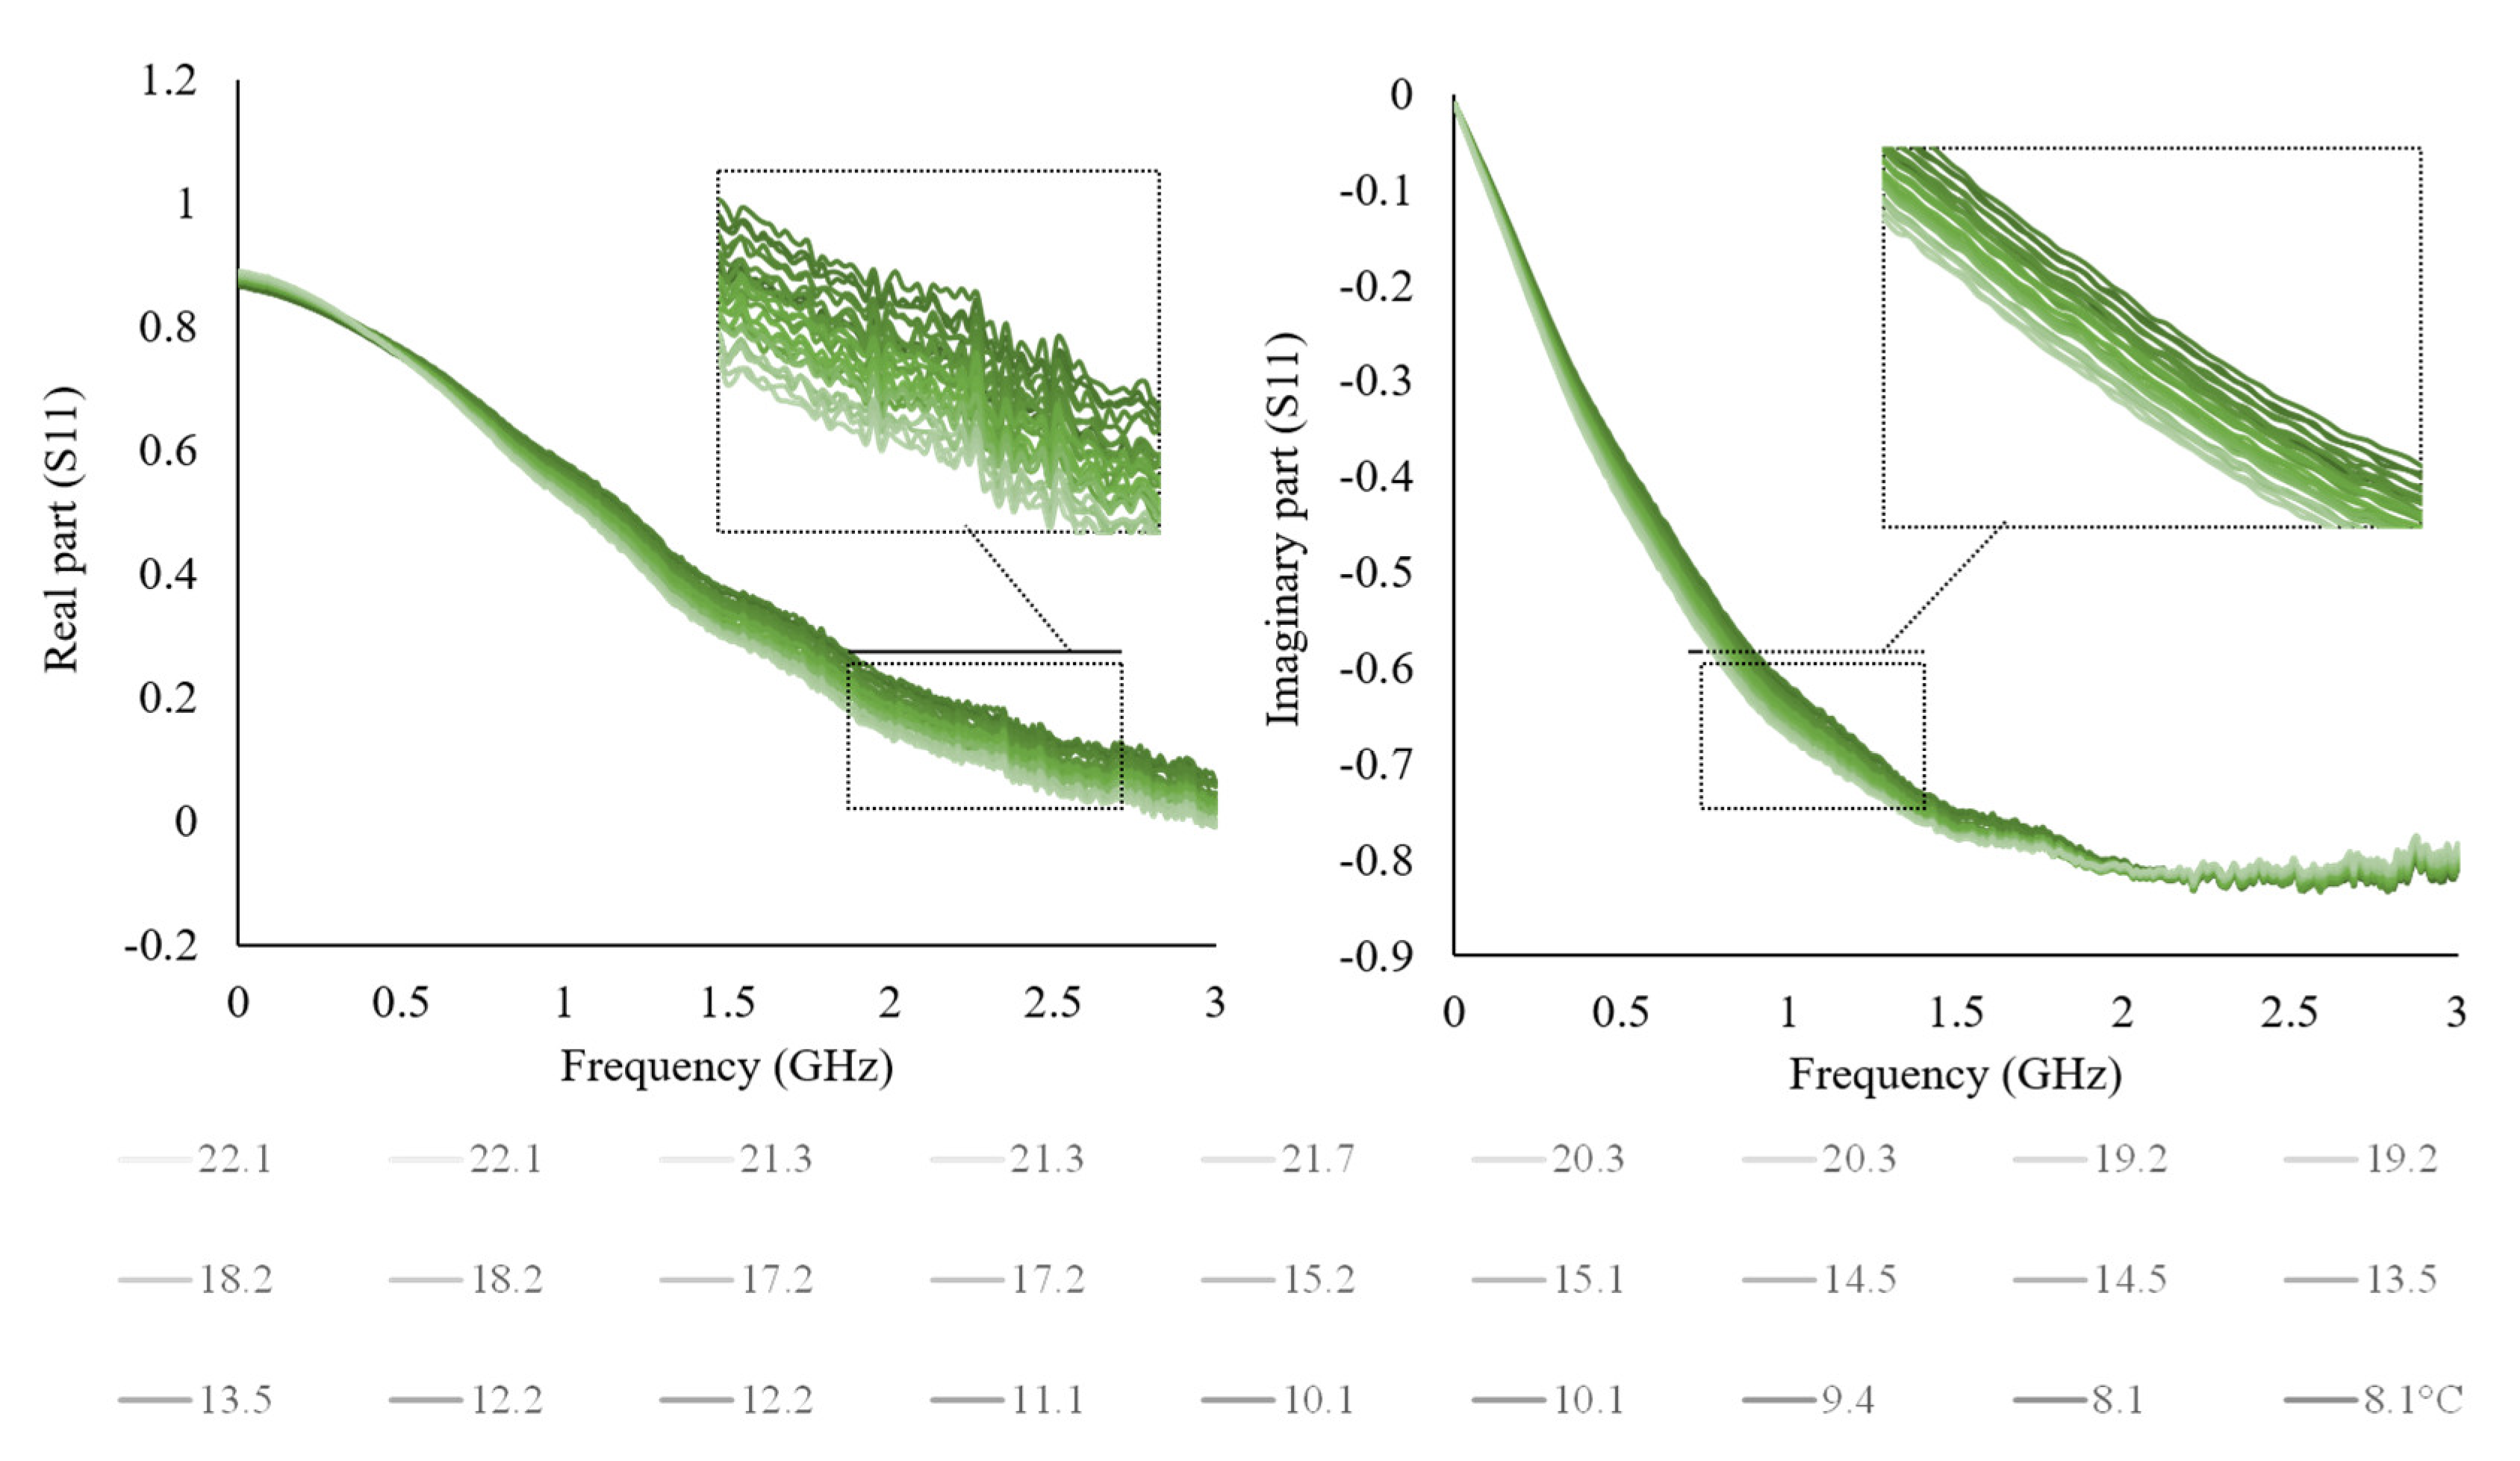
3. Results
4. Conclusions
Author Contributions
Funding
Conflicts of Interest
References
- Li, Z.; Haigh, A.; Wang, P.; Soutis, C.; Gibson, A. Dielectric spectroscopy of Baijiu over 2–20 GHz using an open-ended coaxial probe. J. Food Sci. 2021, 86, 2513–2524. [Google Scholar] [CrossRef]
- Ruvio, G.; Vaselli, M.; Lopresto, V.; Pinto, R.; Farina, L.; Cavagnaro, M. Comparison of different methods for dielectric properties measurements in liquid sample media. Int. J. RF Microw. Comput. Eng. 2018, 28, e21215. [Google Scholar] [CrossRef]
- Grossi, M.; Riccò, B. Electrical impedance spectroscopy (EIS) for biological analysis and food characterization: A review. J. Sens. Sens. Syst. 2017, 6, 303–325. [Google Scholar] [CrossRef] [Green Version]
- Berardinelli, A.; Iaccheri, E.; Franceschelli, L.; Tartagni, M.; Ragni, L. Non-Destructive Assessment of Kiwifruit Flesh Firmness by a Contactless Waveguide Device and Multivariate Regression Analyses. IEEE J. Emerg. Sel. Top. Circuits Syst. 2021, 11, 515–522. [Google Scholar] [CrossRef]
- Cataldo, A.; de Benedetto, E.; Cannazza, G.; Piuzzi, E.; Pittella, E. TDR-based measurements of water content in construction materials for in-the-field use and calibration. IEEE Trans. Instrum. Meas. 2018, 67, 1230–1237. [Google Scholar] [CrossRef]
- Iaccheri, E.; Berardinelli, A.; Maggio, G.; Toschi, T.G.; Ragni, L. Affordable Time-Domain Reflectometry System for Rapid Food Analysis. IEEE Trans. Instrum. Meas. 2021, 70, 1–7. [Google Scholar] [CrossRef]
- Maughan, T.; Allen, L.N.; Drost, D. Soil Moisture Measurement and Sensors for Irrigation Management Soil Water. Ext. UtaShtate Univ. 2015, 1, 124–130. [Google Scholar]
- Wang, J.; Lim, E.G.; Leach, M.P.; Wang, Z.; Man, K.L. Open-ended coaxial cable selection for measurement of liquid dielectric properties via the reflection method. Math. Probl. Eng. 2020, 2020, 8942096. [Google Scholar] [CrossRef]
- Vergnano, A.; Godio, A.; Raffa, C.M.; Chiampo, F.; Vasquez, J.A.T.; Vipiana, F. Open-ended coaxial probe measurements of complex dielectric permittivity in diesel-contaminated soil during bioremediation. Sensors 2020, 20, 6677. [Google Scholar] [CrossRef]
- Chen, L.F.; Ong, C.K.; Neo, C.P.; Varadan, V.V.; Varadan, V.K. Microwave Electronics; John Wiley & Sons: Hoboken, NJ, USA, 2004. [Google Scholar]
- Aydinalp, C.; Joof, S.; Dilman, I.; Akduman, I.; Yilmaz, T. Characterization of Open-Ended Coaxial Probe Sensing Depth with Respect to Aperture Size for Dielectric Property Measurement of Heterogeneous Tissues. Sensors 2022, 22, 760. [Google Scholar]
- Guo, W.; Tiwari, G.; Tang, J.; Wang, S. Frequency, moisture and temperature-dependent dielectric properties of chickpea flour. Biosyst. Eng. 2008, 101, 217–224. [Google Scholar] [CrossRef]
- McKeown, M.S.; Trabelsi, S.; Tollner, E.W.; Nelson, S.O. Dielectric spectroscopy measurements for moisture prediction in Vidalia onions. J. Food Eng. 2012, 111, 505–510. [Google Scholar] [CrossRef]
- Ahmed, J.; Ramaswamy, H.S.; Raghavan, V.G.S. Dielectric properties of butter in the MW frequency range as affected by salt and temperature. J. Food Eng. 2007, 82, 351–358. [Google Scholar] [CrossRef]
- Hernandez-Gomez, E.S.; Olvera-Cervantes, J.L.; Sosa-Morales, M.E.; Corona-Vazquez, B.; Corona-Chavez, A.; Lujan-Hidalgo, M.C.; Kataria, T.K. Dielectric properties of Mexican sauces for microwave-assisted pasteurization process. J. Food Sci. 2021, 86, 112–119. [Google Scholar] [CrossRef]
- Rodríguez-Moré, Z.O.; Lobato-Morales, H.; Chávez-Pérez, R.A.; Medina-Monroy, J.L. Complex dielectric permittivity of rum and its mixtures with methanol, ethanol, and water at frequencies up to 15 GHz. J. Microw. Power Electromagn. Energy 2018, 52, 16–30. [Google Scholar] [CrossRef]
- Castro-Giráldez, M.; Aristoy, M.C.; Toldrá, F.; Fito, P. Microwave dielectric spectroscopy for the determination of pork meat quality. Food Res. Int. 2010, 43, 2369–2377. [Google Scholar] [CrossRef]
- Traffano-Schiffo, M.V.; Castro-Giraldez, M.; Colom, R.J.; Fito, P.J. Development of a spectrophotometric system to detect white striping physiopathy in whole chicken carcasses. Sensors 2017, 17, 1024. [Google Scholar] [CrossRef] [Green Version]
- Castro-Giráldez, M.; Fito, P.J.; Fito, P. Application of microwaves dielectric spectroscopy for controlling pork meat (Longissimus dorsi) salting process. J. Food Eng. 2010, 97, 484–490. [Google Scholar] [CrossRef]
- Iaccheri, E. Study of a control methodology of orange juice evaporation by dielectric spectroscopy. In Proceedings of the InsideFood Symposium, Leuven, Belgium, 9–12 April 2013; pp. 9–12. [Google Scholar]
- Kataria, T.K.; Sosa-Morales, M.E.; Olvera-Cervantes, J.L.; Rojas-Laguna, R.; Corona-Chavez, A. Dielectric properties of pulque at different temperatures from 0.1 to 25 GHz. J. Microw. Power Electromagn. Energy 2019, 53, 215–224. [Google Scholar] [CrossRef]
- Bohigas, X.; Tejada, J. Dielectric properties of acetic acid and vinegar in the microwave frequencies range 1–20 GHz. J. Food Eng. 2009, 94, 46–51. [Google Scholar] [CrossRef]
- Nunes, A.C.; Bohigas, X.; Tejada, J. Dielectric study of milk for frequencies between 1 and 20 GHz. J. Food Eng. 2006, 76, 250–255. [Google Scholar] [CrossRef]
- Cataldo, A.; Piuzzi, E.; Cannazza, G.; de Benedetto, E.; Tarricone, L. Quality and anti-adulteration control of vegetable oils through microwave dielectric spectroscopy. Meas. J. Int. Meas. Confed. 2010, 43, 1031–1039. [Google Scholar] [CrossRef]
- Ragni, L.; Al-Shami, A.; Mikhaylenko, G.; Tang, J. Dielectric characterization of hen eggs during storage. J. Food Eng. 2007, 82, 450–459. [Google Scholar] [CrossRef]
- Costa, F.; Borgese, M.; Degiorgi, M.; Monorchio, A. Electromagnetic characterisation of materials by using transmission/reflection (T/R) devices. Electronics 2017, 6, 95. [Google Scholar] [CrossRef] [Green Version]
- Gutiérrez-Cano, J.D.; Catalá-Civera, J.M.; Penaranda-Foix, F.L.; Plaza-González, P.J. Improved open-ended coaxial probe for temperature-dependent permittivity measurements of foodstuff at radio frequencies. J. Food Eng. 2022, 316, 110823. [Google Scholar] [CrossRef]
- Nuan-On, A.; Angkawisittpan, N.; Piladaeng, N.; Soemphol, C. Design and fabrication of modified sma-connector sensor for detecting water adulteration in honey and natural latex. Appl. Syst. Innov. 2022, 5, 4. [Google Scholar] [CrossRef]
- Datta, M.A.; Rizvi, A.K.; Rao, S.S.H. Engineering Properties of Foods, 3rd ed.; Taylor & Francis: Abingdon, UK, 2005. [Google Scholar]
- Kudra, T.; Raghavan, V.; Akyel, C.; Bosisio, R.; van de Voort, F. Electromagnetic properties of milk and its constituents at 2.45 GHz. J. Microw. Power Electromagn. Energy 1992, 27, 199–204. [Google Scholar] [CrossRef]
- Fito, P.; Castro-Giráldez, M.; Fito, P.J.; Chenoll, C. Development of a dielectric spectroscopy technique for the determination of apple (Granny Smith) maturity. Innov. Food Sci. Emerg. Technol. 2010, 11, 749–754. [Google Scholar]
- Nengsih, T.A.; Bertrand, F.; Maumy-Bertrand, M.; Meyer, N. Determining the number of components in PLS regression on incomplete data set. Stat. Appl. Genet. Mol. Biol. 2019, 28, 20180059. [Google Scholar] [CrossRef]

| Samples | Range of Variation | S11 | Function | R2 | R2 adj. | RMSE | Frequency (GHz) | Intercept Significance | Angular Coefficient Significance |
|---|---|---|---|---|---|---|---|---|---|
| Sodium chloride solutions | 0.05–3% | R | y = −13.322x + 3.4228 | 0.997 | 0.997 | 0.05 | 1.70 | <0.0000 | <0.0000 |
| I | y = 12.86x + 11.092 | 0.991 | 0.991 | 0.08 | 3.00 | <0.0000 | <0.0000 | ||
| Saccharose solutions | 0.5–20% | R | y = 199.86x + 3.621 | 0.955 | 0.954 | 1.33 | 2.98 | <0.0000 | <0.0000 |
| I | y = 1.0137x +227.63 | 0.981 | 0.980 | 0.82 | 1.77 | <0.0000 | <0.0000 | ||
| Citric acid solutions | 0.05–3% | R | y = 267.93 × 2 − 530.83x + 262.99 | 0.994 | 0.994 | 0.07 | 0.90 | <0.0000 | (x2; x) <0.0000 |
| I | y = 600.33x2 + 1122.1x + 524.04 | 0.994 | 0.994 | 0.07 | 1.87 | <0.0000 | (x2; x) <0.0000 | ||
| Milk (fat) | 0.1–3.8% | R | y = 52.948x − 3.0812 | 0.987 | 0.986 | 0.13 | 2.61 | <0.0000 | <0.0000 |
| I | y = 122.34x + 46.584 | 0.984 | 0.983 | 0.14 | 4.60 | <0.0000 | <0.0000 | ||
| Egg products (yolk) | 0–100% | R | y = 274.47x − 106.16 | 0.988 | 0.988 | 3.29 | 1.39 | <0.0000 | <0.0000 |
| I | y = 679.4x + 207.72 | 0.982 | 0.982 | 3.97 | 0.42 | <0.0000 | <0.0000 | ||
| Fruit juices (°Brix) | 3.5–15.1° | R | y = 247.91x + 6.7011 | 0.969 | 0.965 | 0.71 | 3.00 | <0.0000 | <0.0000 |
| I | y = 305.04x + 267.56 | 0.965 | 0.960 | 0.75 | 2.99 | <0.0000 | <0.0000 | ||
| Milk (temperature) | 8.1–22.8 °C | R | y = −650.88x + 585.04 | 0.983 | 0.981 | 0.60 | 0.30 | <0.0000 | <0.0000 |
| I | y = −732.16x − 582.21 | 0.987 | 0.985 | 0.53 | 2.75 | <0.0000 | <0.0000 |
| Sample | R2 Calibration | RMSE Calibration | R2 Validation | RMSE Validation | PCs | |
|---|---|---|---|---|---|---|
| Sodium chloride | R | 0.997 | 0.05 | 0.996 | 0.05 | 2 |
| 0.997 | 0.05 | 0.996 | 0.05 | 2 | ||
| 0.997 | 0.05 | 0.998 | 0.03 | 2 | ||
| I | 0.996 | 0.05 | 0.997 | 0.05 | 2 | |
| 0.996 | 0.05 | 0.996 | 0.07 | 2 | ||
| 0.996 | 0.05 | 0.997 | 0.05 | 2 | ||
| Saccharose | R | 0.978 | 0.76 | 0.989 | 0.70 | 3 |
| 0.973 | 0.91 | 0.967 | 1.20 | 2 | ||
| 0.983 | 0.76 | 0.982 | 1.09 | 3 | ||
| I | 0.955 | 1.18 | 0.975 | 0.99 | 1 | |
| 0.957 | 1.22 | 0.975 | 0.82 | 1 | ||
| 0.982 | 0.82 | 0.976 | 0.73 | 2 | ||
| Citric acid | R | 0.978 | 0.13 | 0.976 | 0.15 | 2 |
| 0.987 | 0.10 | 0.948 | 0.23 | 2 | ||
| 0.974 | 0.15 | 0.982 | 0.10 | 2 | ||
| I | 0.968 | 0.16 | 0.966 | 0.15 | 2 | |
| 0.969 | 0.15 | 0.967 | 0.16 | 1 | ||
| 0.969 | 0.16 | 0.968 | 0.16 | 3 | ||
| Milk | R | 0.981 | 0.14 | 0.990 | 0.12 | 1 |
| 0.958 | 0.20 | 0.987 | 0.13 | 1 | ||
| 0.986 | 0.14 | 0.952 | 0.17 | 1 | ||
| I | 0.945 | 0.24 | 0.986 | 0.15 | 3 | |
| 0.979 | 0.15 | 0.954 | 0.27 | 4 | ||
| 0.970 | 0.18 | 0.981 | 0.17 | 4 | ||
| Yolk | R | 0.958 | 5.90 | 0.984 | 4.12 | 3 |
| 0.967 | 5.24 | 0.982 | 4.43 | 3 | ||
| 0.965 | 5.52 | 0.978 | 4.76 | 3 | ||
| I | 0.981 | 2.95 | 0.989 | 2.73 | 4 | |
| 0.988 | 3.21 | 0.972 | 3.32 | 3 | ||
| 0.983 | 3.73 | 0.979 | 4.78 | 3 | ||
| Fruit Juice | R | 0.953 | 0.80 | 0.933 | 1.18 | 2 |
| 0.996 | 0.20 | 0.974 | 0.86 | 4 | ||
| 0.997 | 0.22 | 0.970 | 0.75 | 4 | ||
| I | 0.969 | 0.40 | 0.960 | 1.35 | 3 | |
| 0.971 | 0.64 | 0.950 | 1.03 | 2 | ||
| 0.891 | 1.21 | 0.991 | 0.51 | 1 | ||
Publisher’s Note: MDPI stays neutral with regard to jurisdictional claims in published maps and institutional affiliations. |
© 2022 by the authors. Licensee MDPI, Basel, Switzerland. This article is an open access article distributed under the terms and conditions of the Creative Commons Attribution (CC BY) license (https://creativecommons.org/licenses/by/4.0/).
Share and Cite
Iaccheri, E.; Varani, M.; Ragni, L. Cost-Effective Open-Ended Coaxial Technique for Liquid Food Characterization by Using the Reflection Method for Industrial Applications. Sensors 2022, 22, 5277. https://doi.org/10.3390/s22145277
Iaccheri E, Varani M, Ragni L. Cost-Effective Open-Ended Coaxial Technique for Liquid Food Characterization by Using the Reflection Method for Industrial Applications. Sensors. 2022; 22(14):5277. https://doi.org/10.3390/s22145277
Chicago/Turabian StyleIaccheri, Eleonora, Massimiliano Varani, and Luigi Ragni. 2022. "Cost-Effective Open-Ended Coaxial Technique for Liquid Food Characterization by Using the Reflection Method for Industrial Applications" Sensors 22, no. 14: 5277. https://doi.org/10.3390/s22145277
APA StyleIaccheri, E., Varani, M., & Ragni, L. (2022). Cost-Effective Open-Ended Coaxial Technique for Liquid Food Characterization by Using the Reflection Method for Industrial Applications. Sensors, 22(14), 5277. https://doi.org/10.3390/s22145277