
WYSIWYG: IoT Device Identification Based on WebUI Login Pages


Abstract
:1. Introduction
- (1)
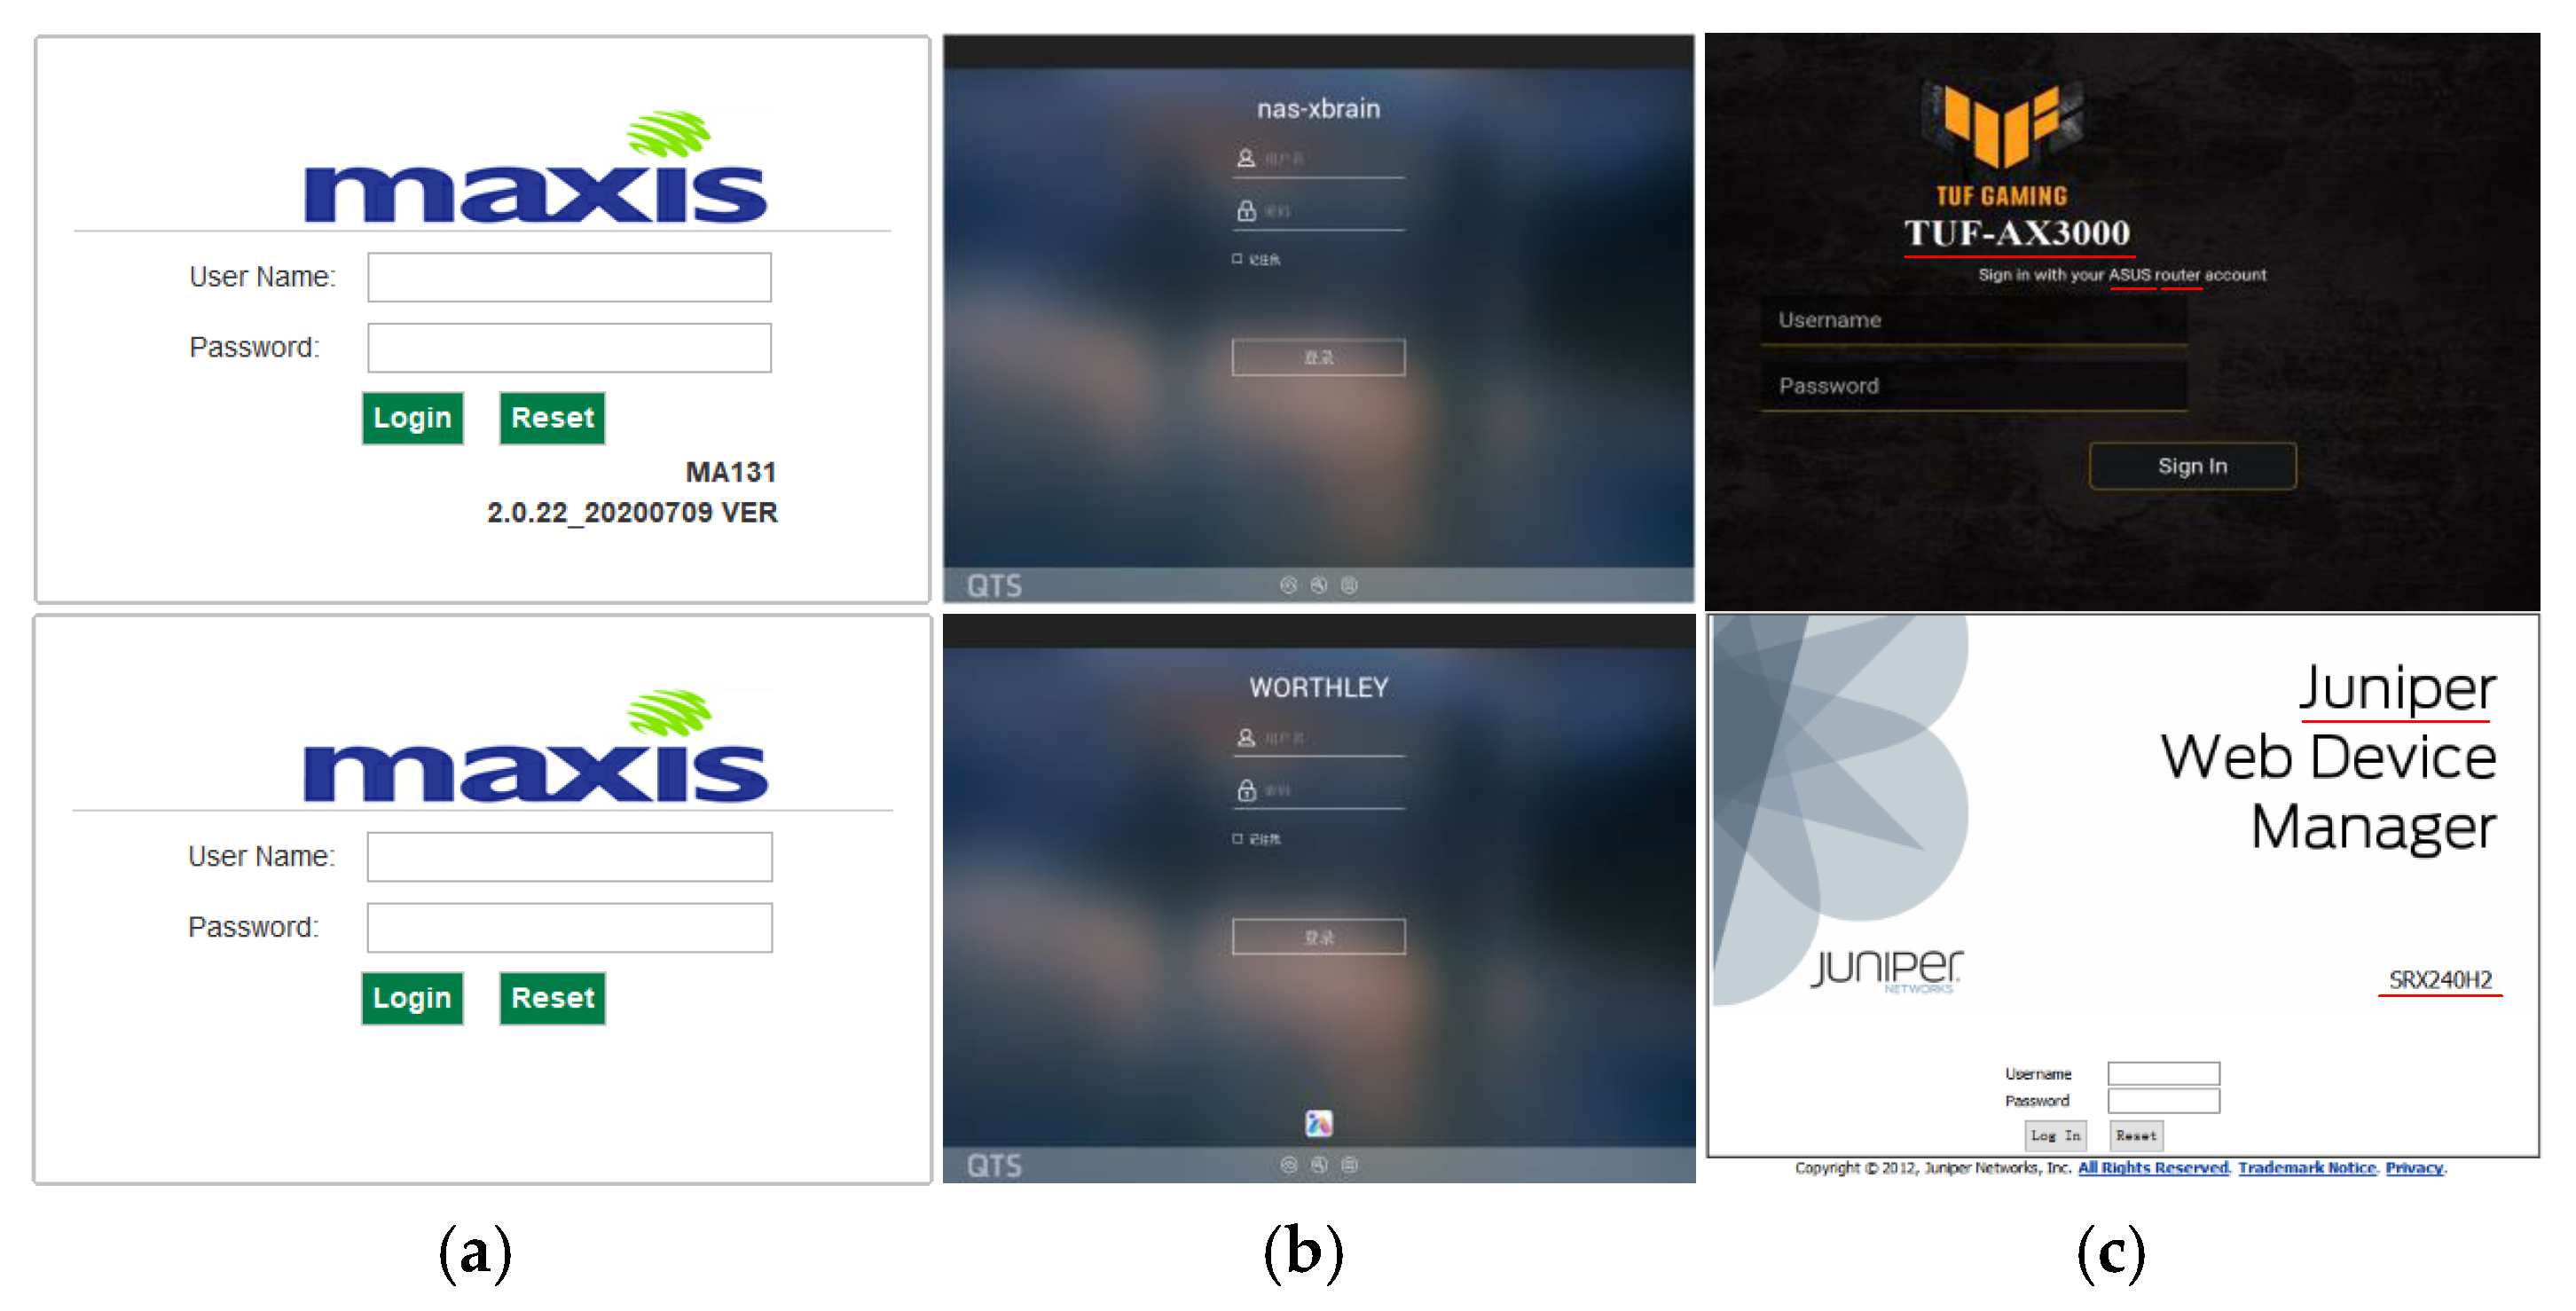
- We propose a novel method for IoT device identification, which uses commonly available login pages with distinctive characteristics specific to vendors as the data source and transforms the device identification into an image classification problem and can be used as an alternative measure for device identification.
- (2)
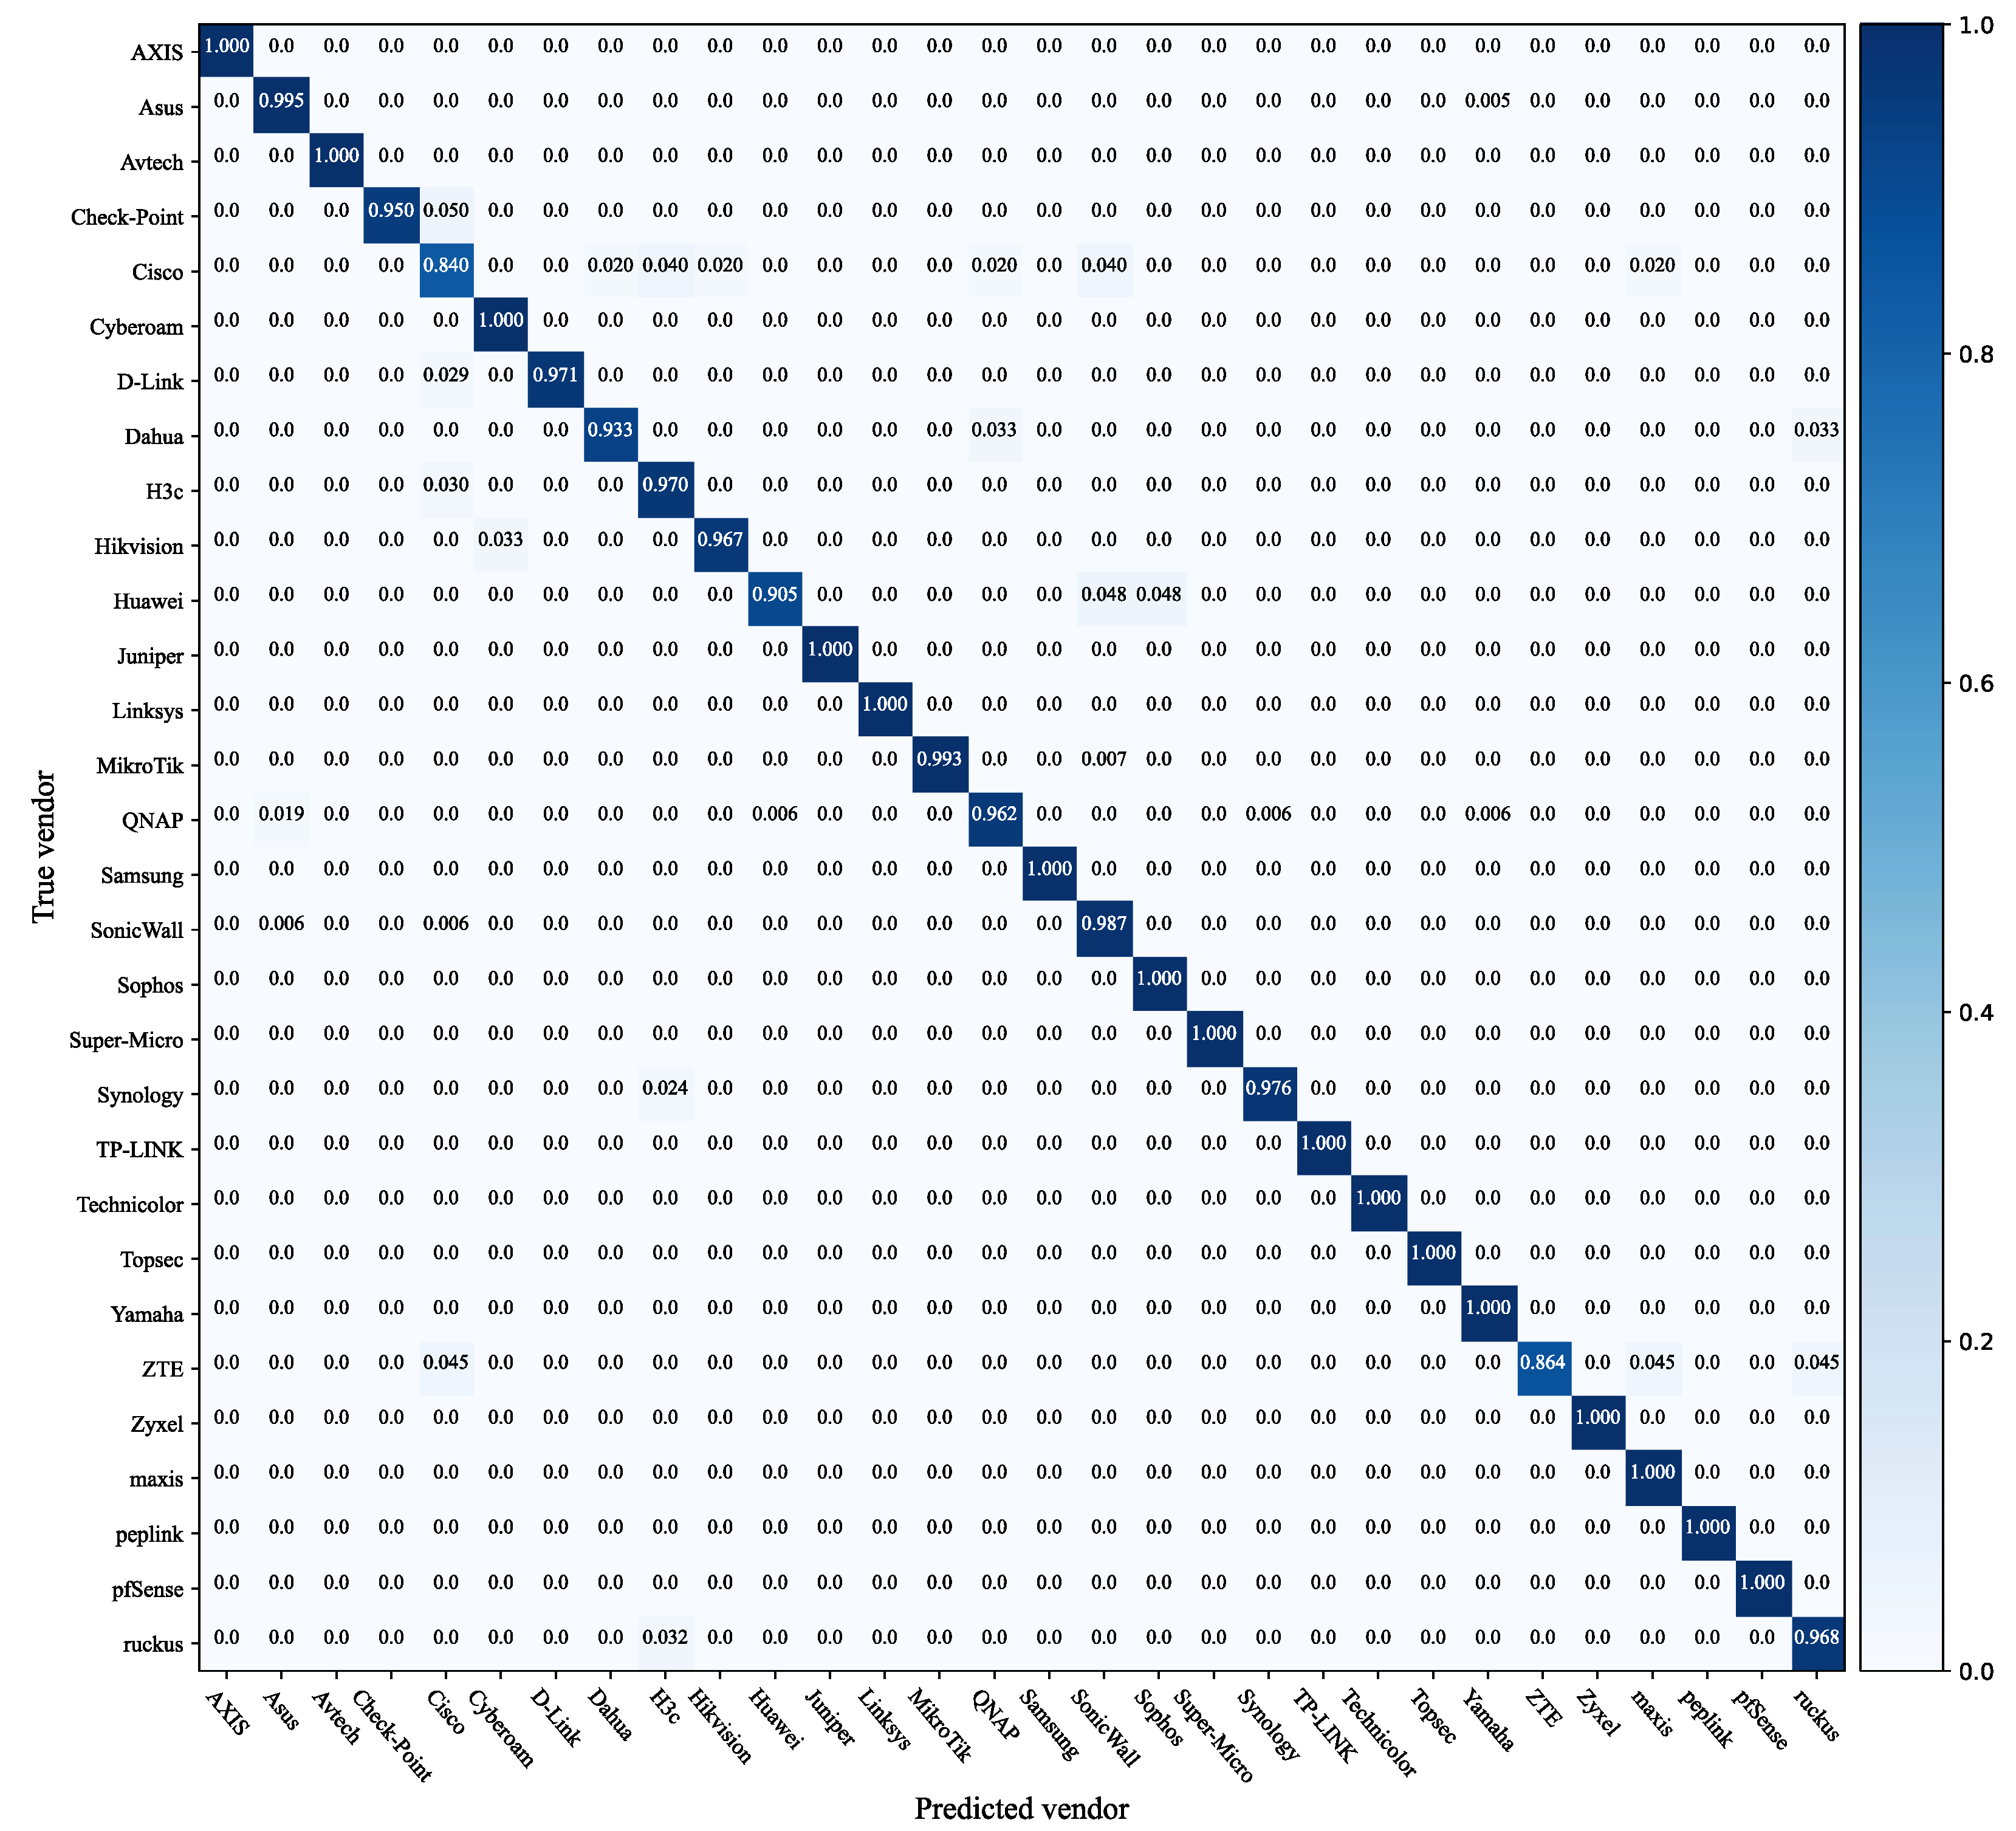
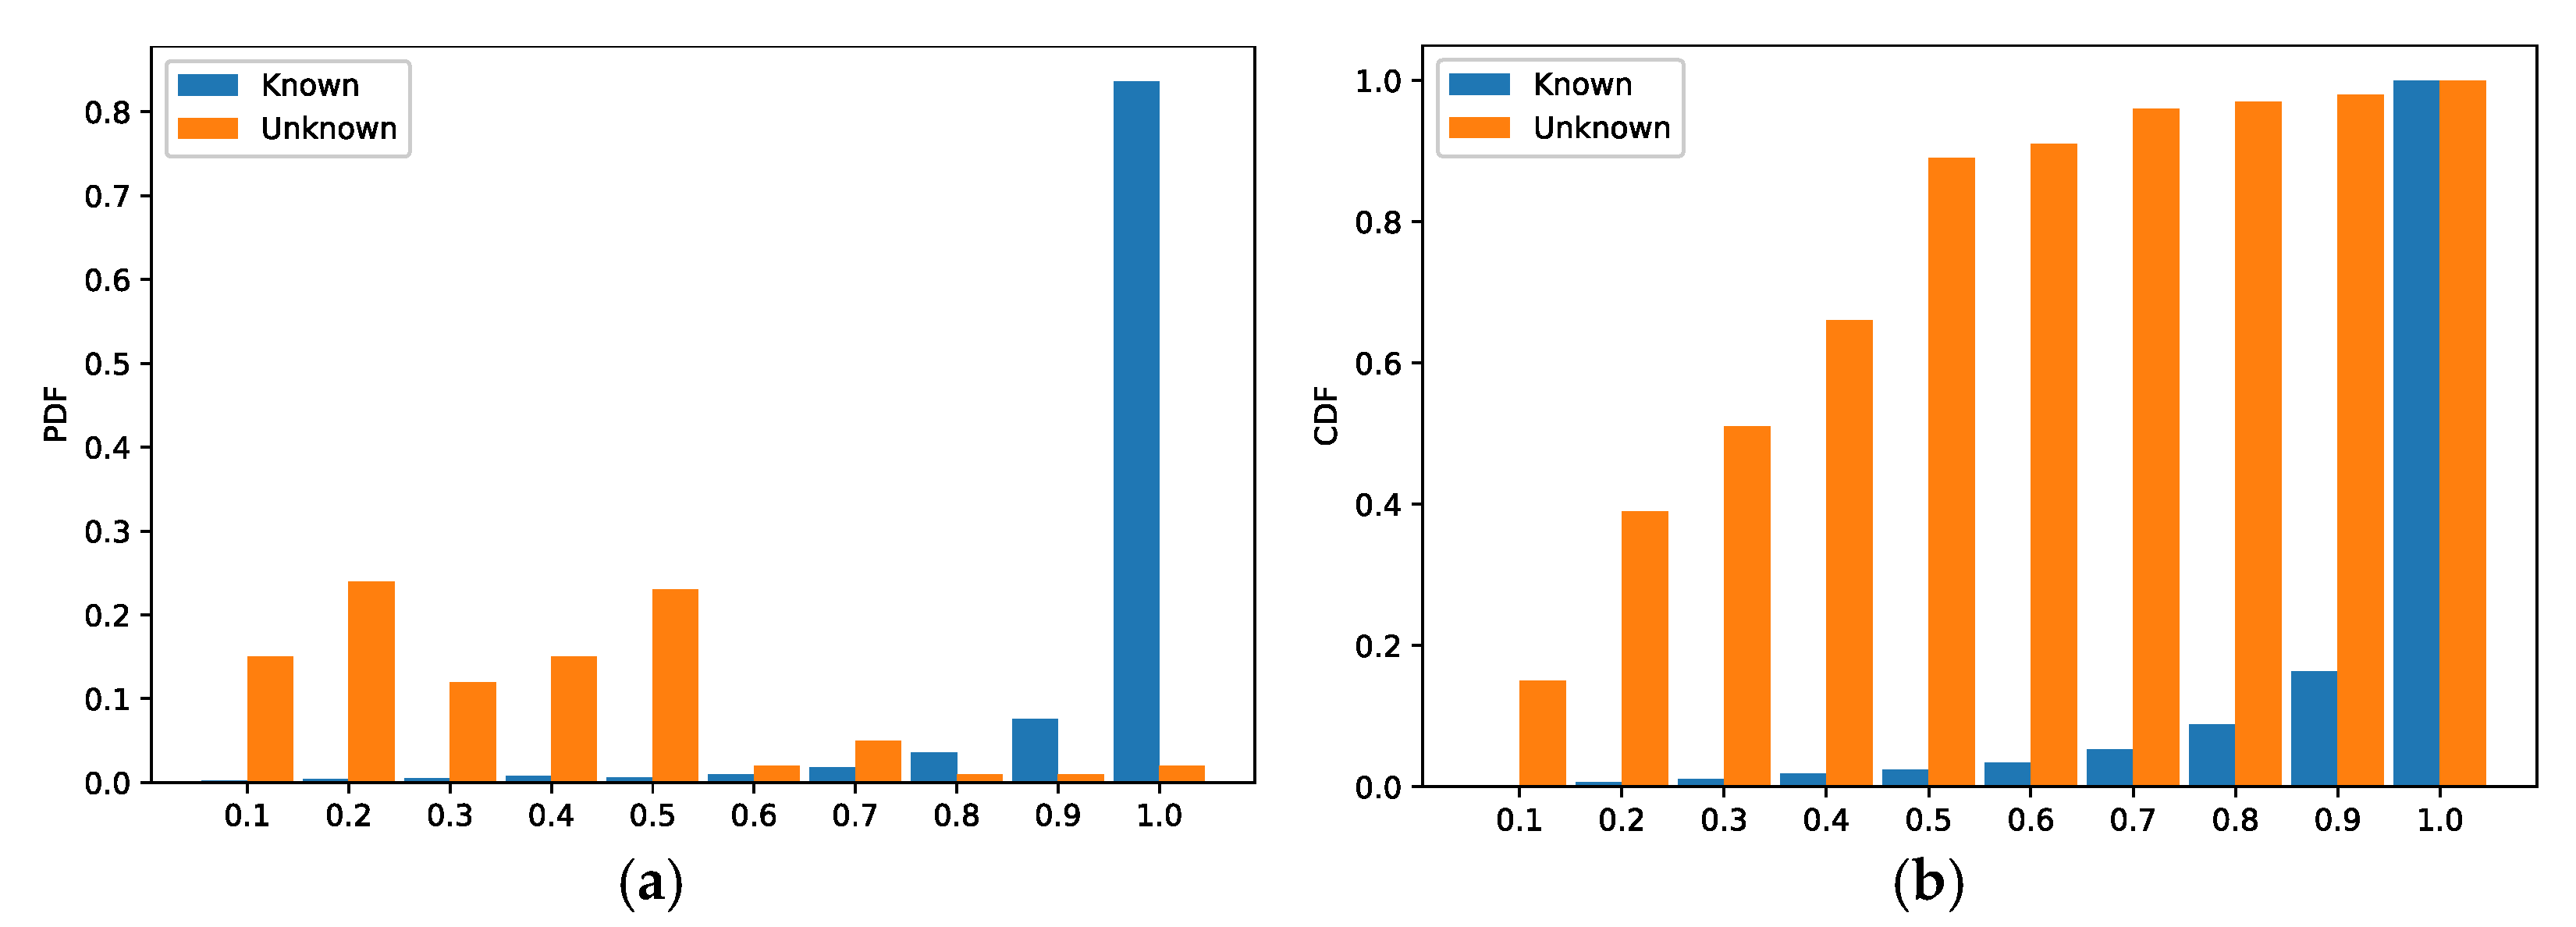
- We present an ensemble learning model for device identification. Given a device, the model can firstly judge it from a vendor that appeared in the training dataset, with an accuracy of 99.1%, and if the answer is positive, then identify which vendor it is from, with an accuracy of 98%.
- (3)
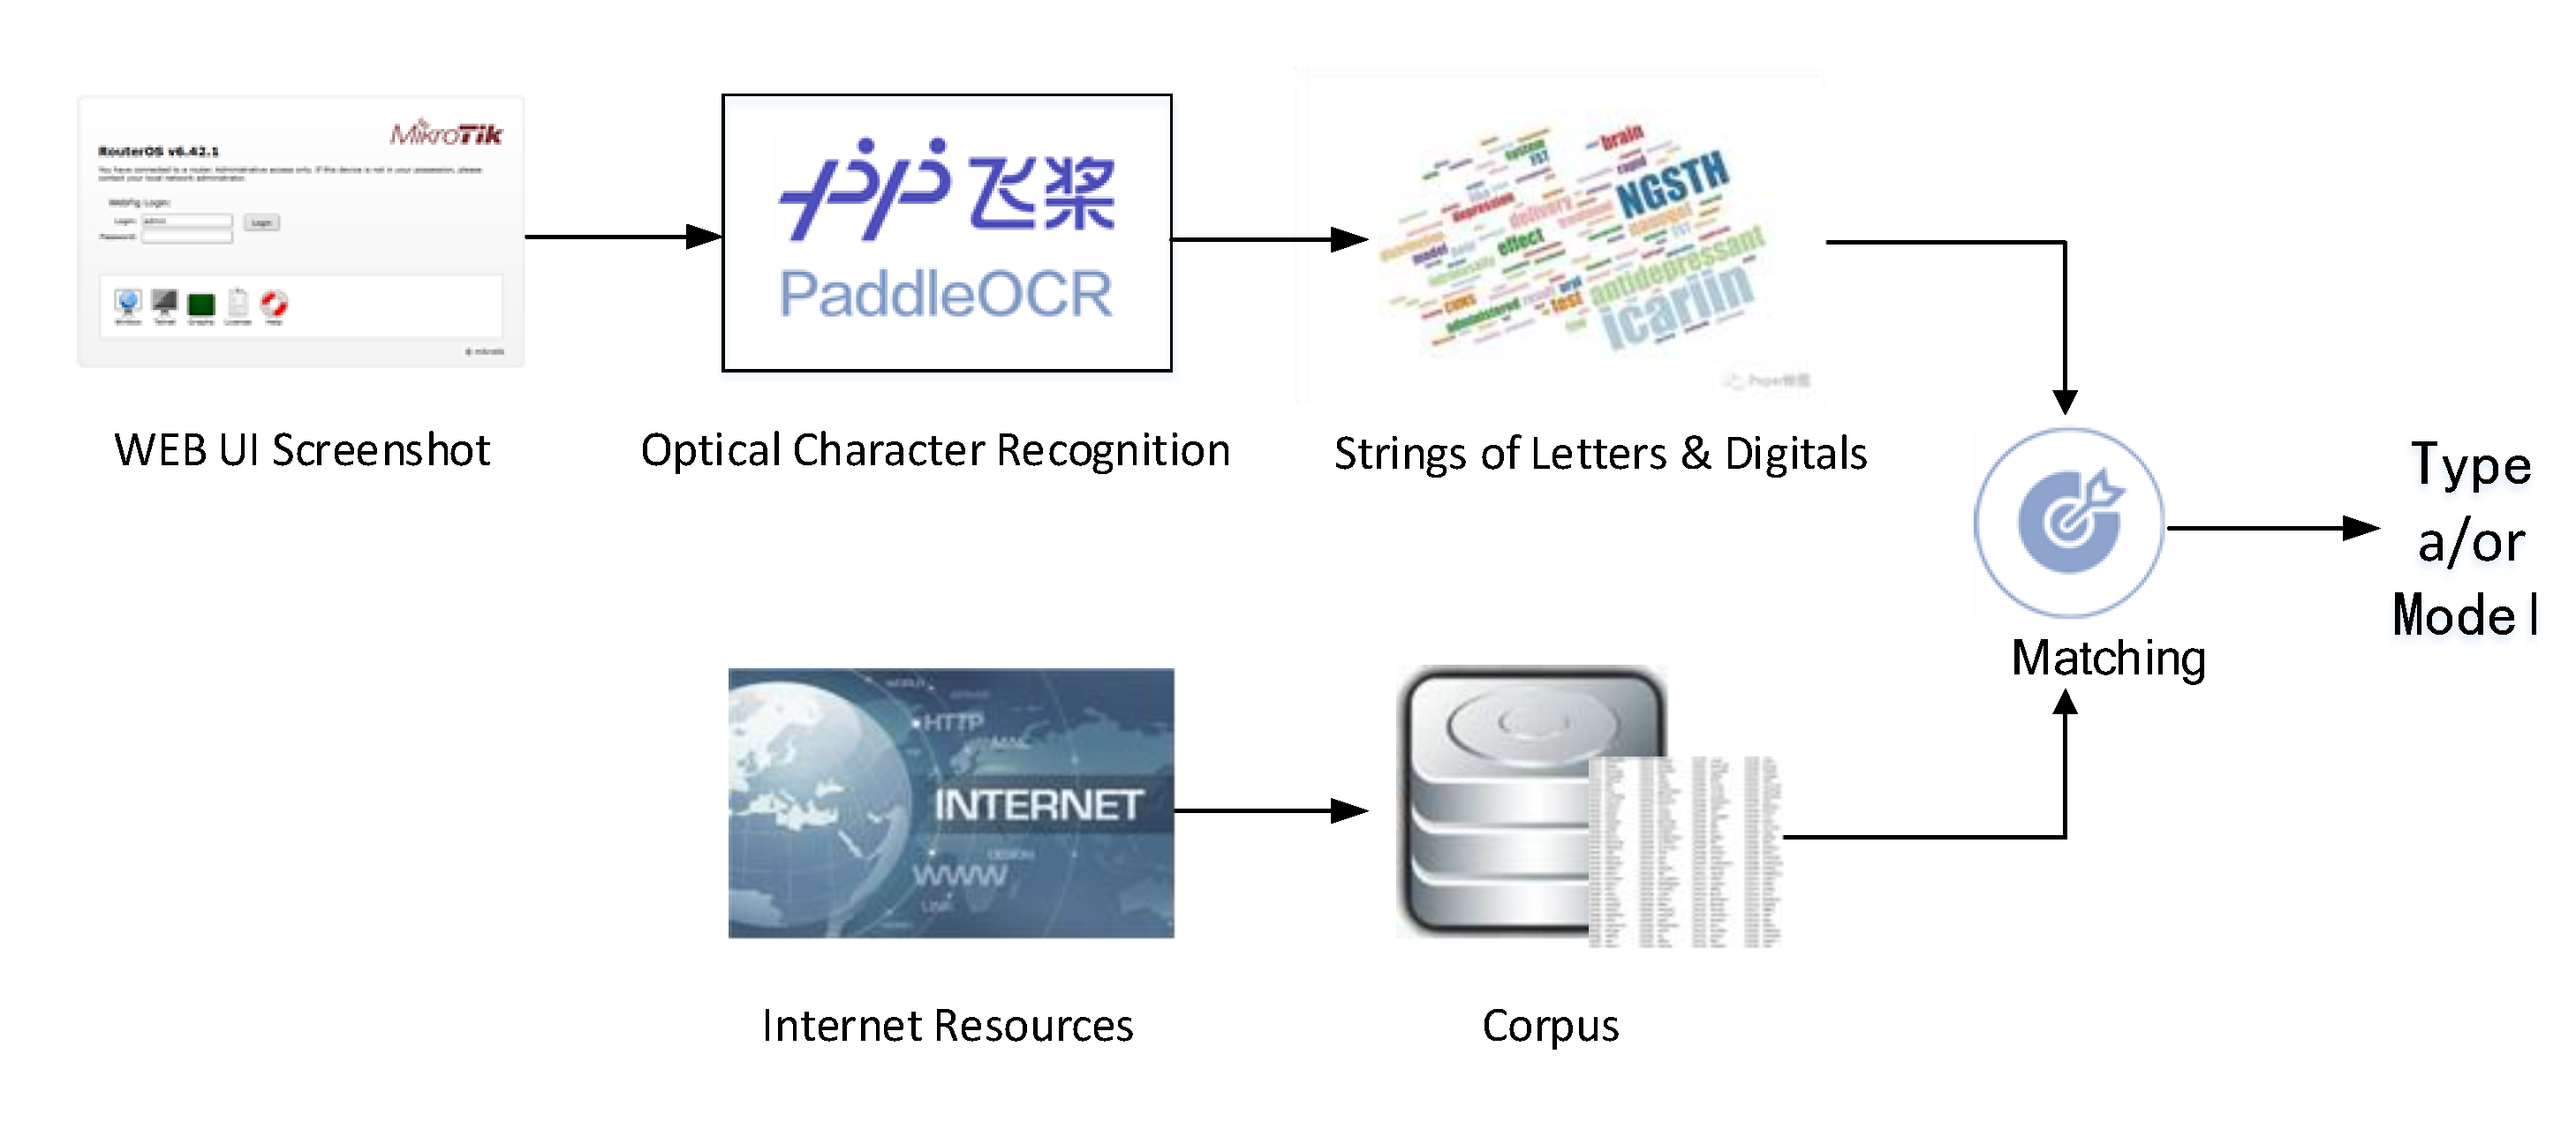
- We develop an OCR-based method for extracting and identifying type/model attributes from login page screenshots, with an accuracy of 99.46% in device model identification, which overcomes the shortcoming of the traditional method in the difficulty of obtaining device model information from protocol responses or network traffic.
2. Related Works
2.1. Webpage-Based Device Identification
2.2. Unknown Class Identification
2.3. Granularity of Device Identification
3. Motivation
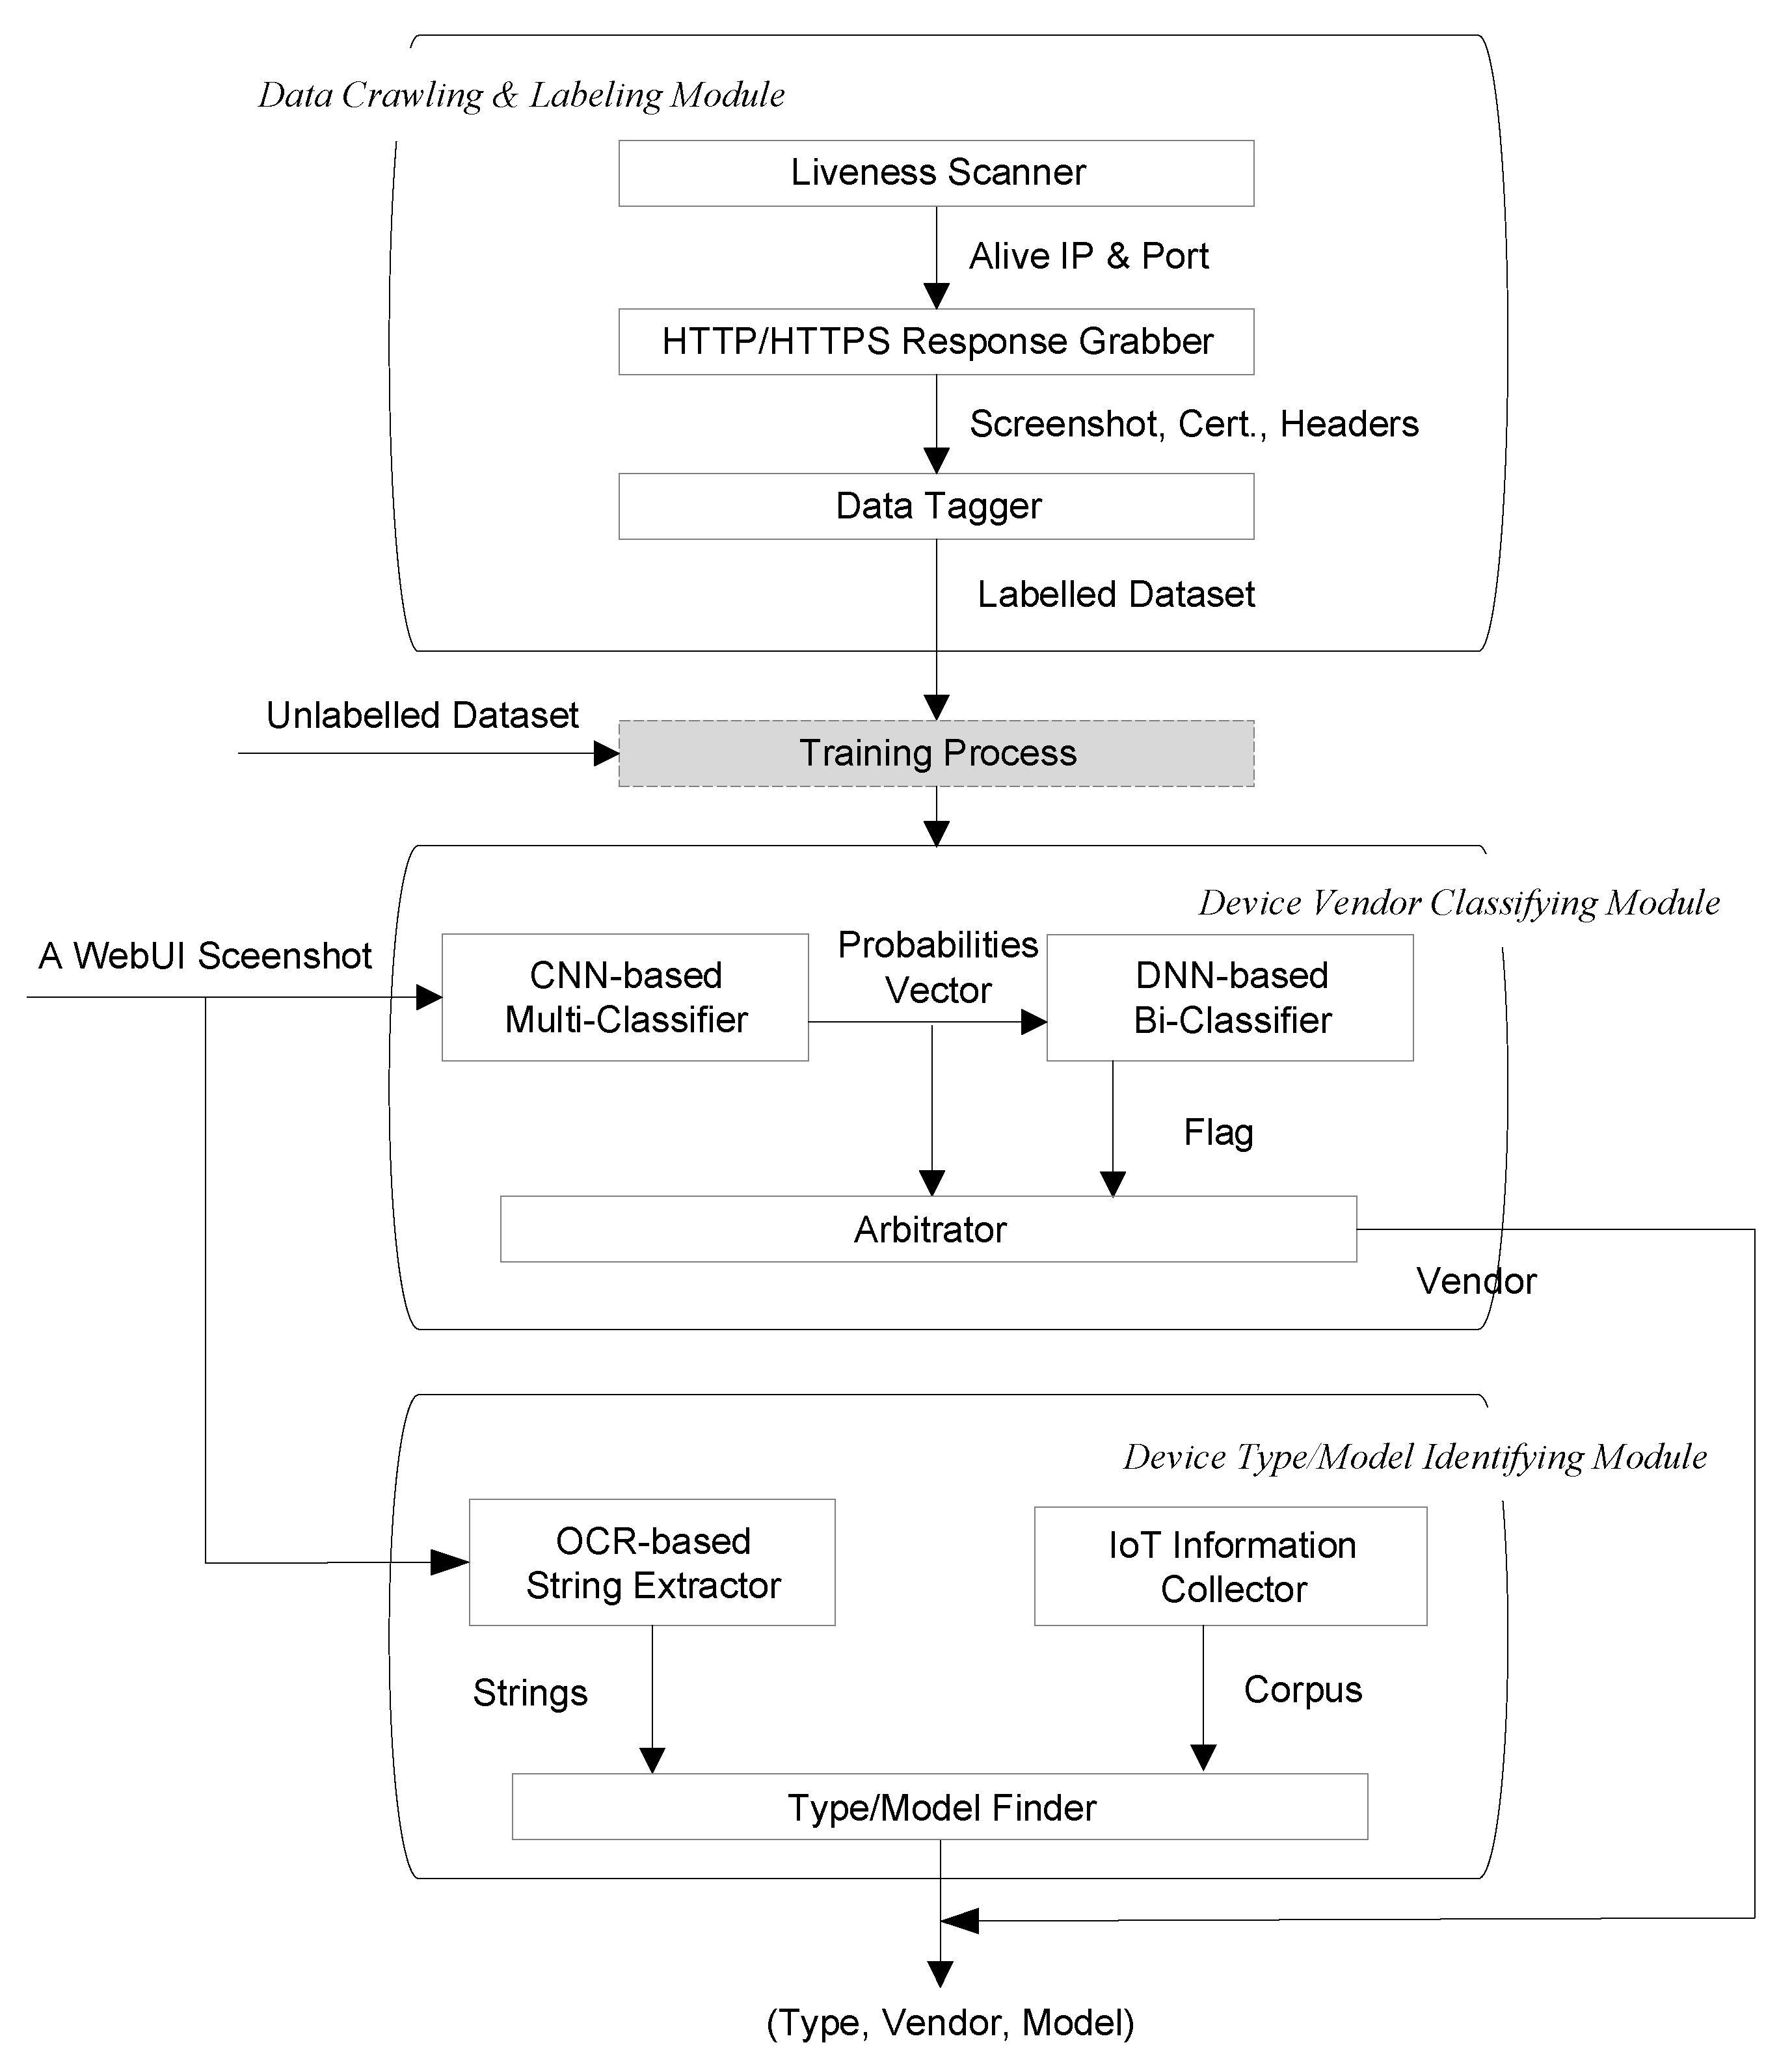
4. Framework
4.1. Data Crawling and Labeling
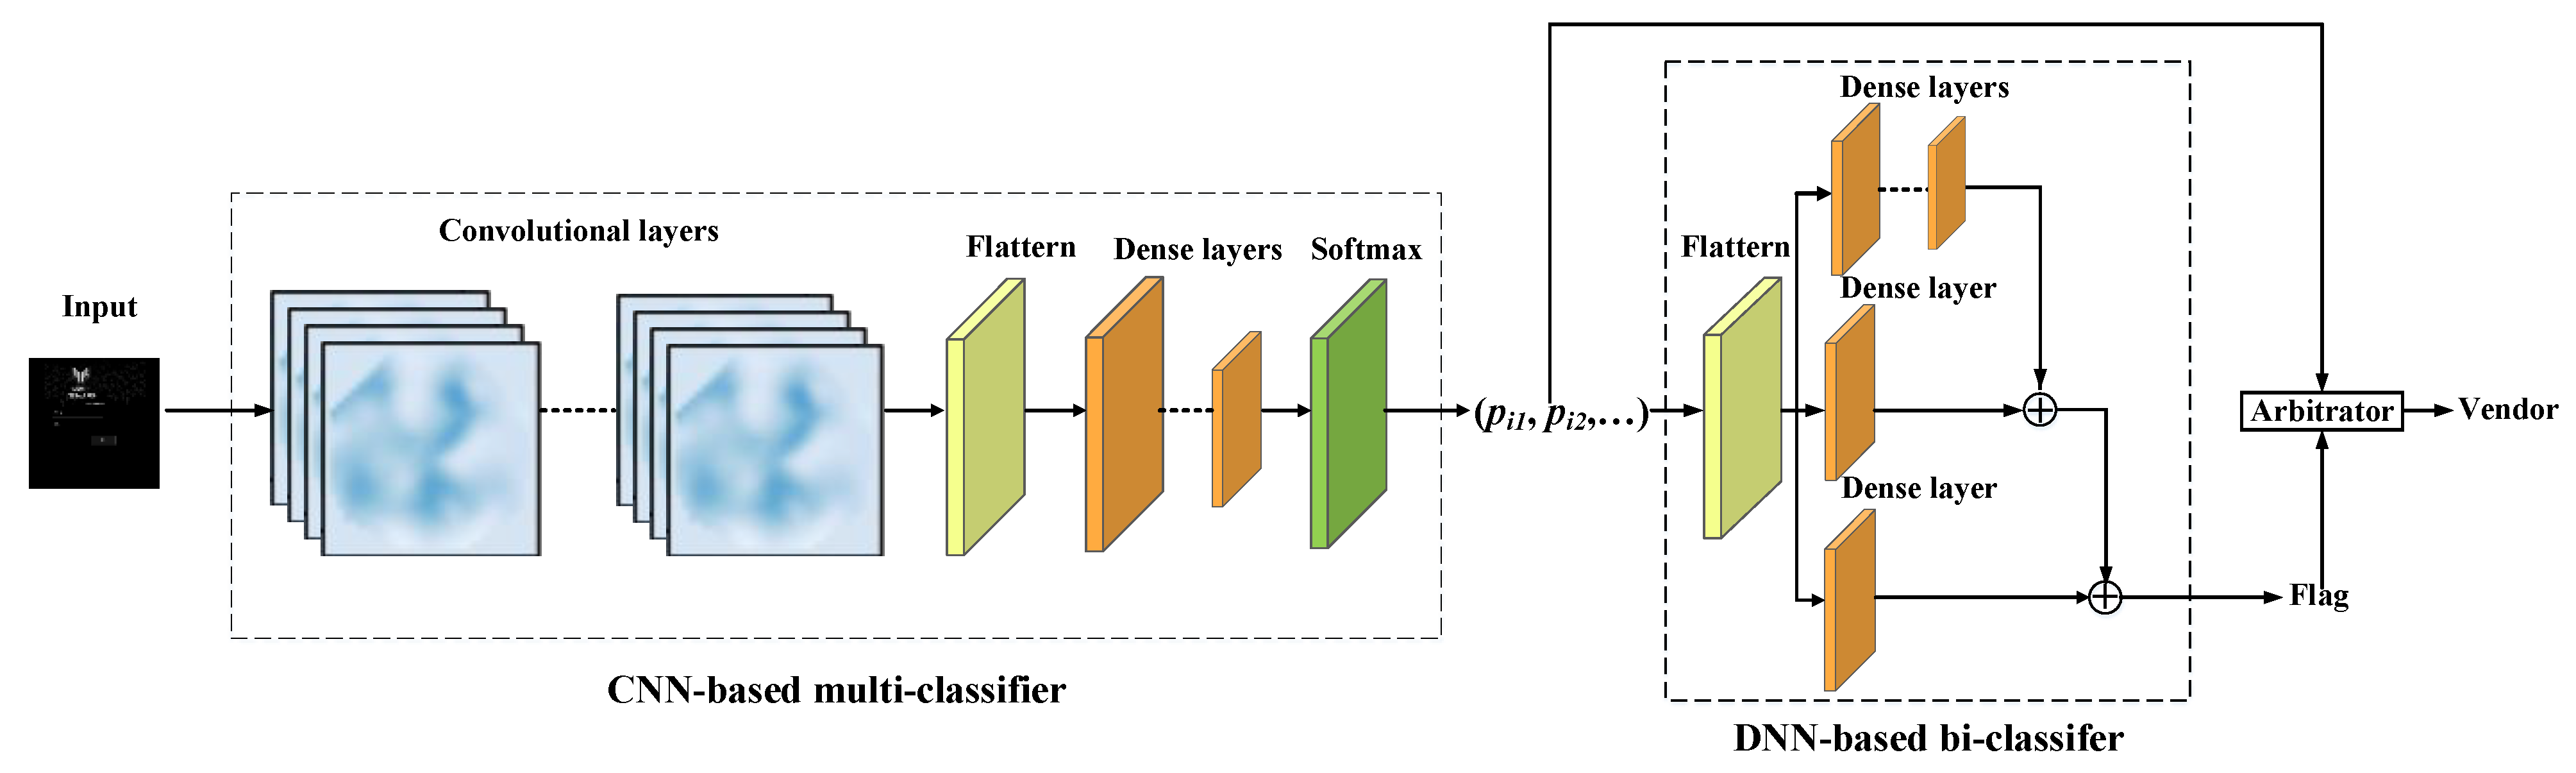
4.2. Device Vendor Classifying
4.3. Device Type/Model Identifying
5. Experiments and Evaluation
5.1. Data Preparation and Parameter Setting
5.2. Effects of Vendor Identification
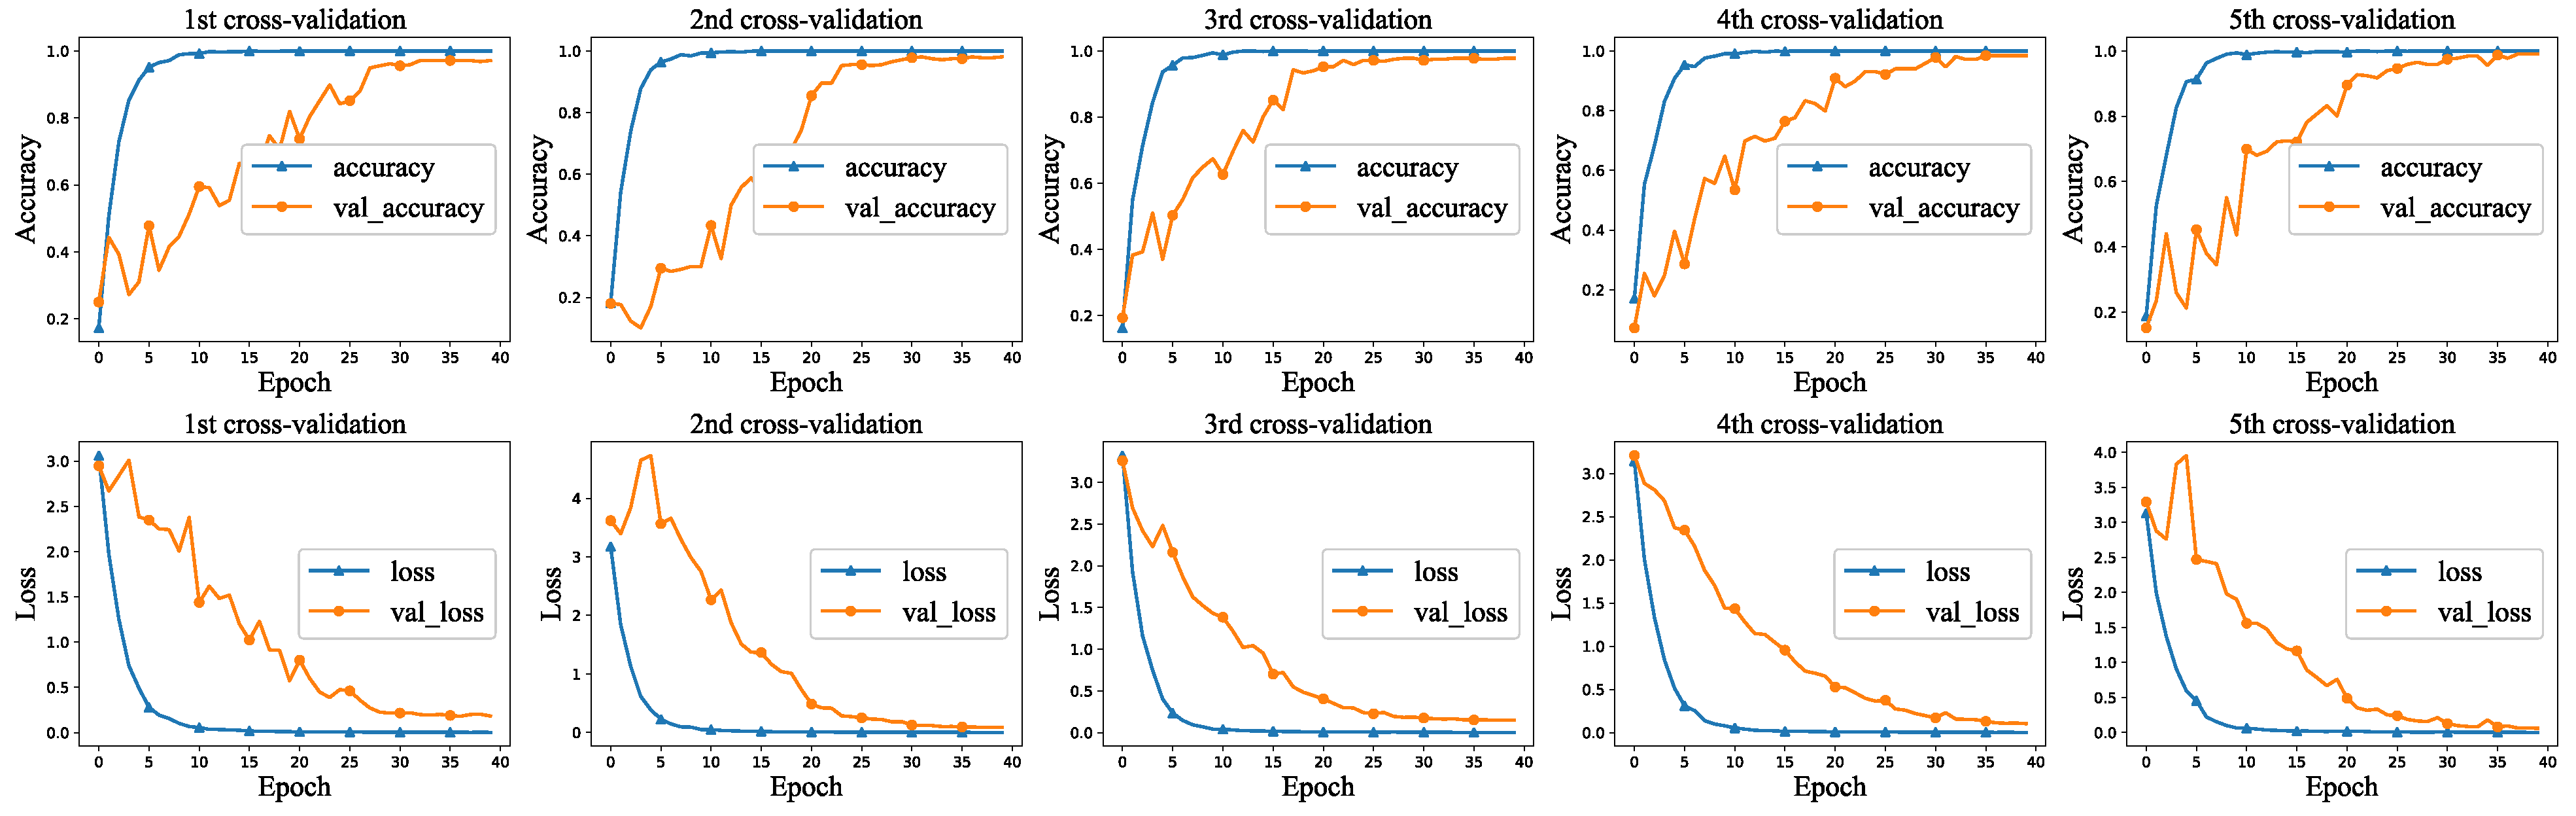
5.2.1. Multi-Classifier
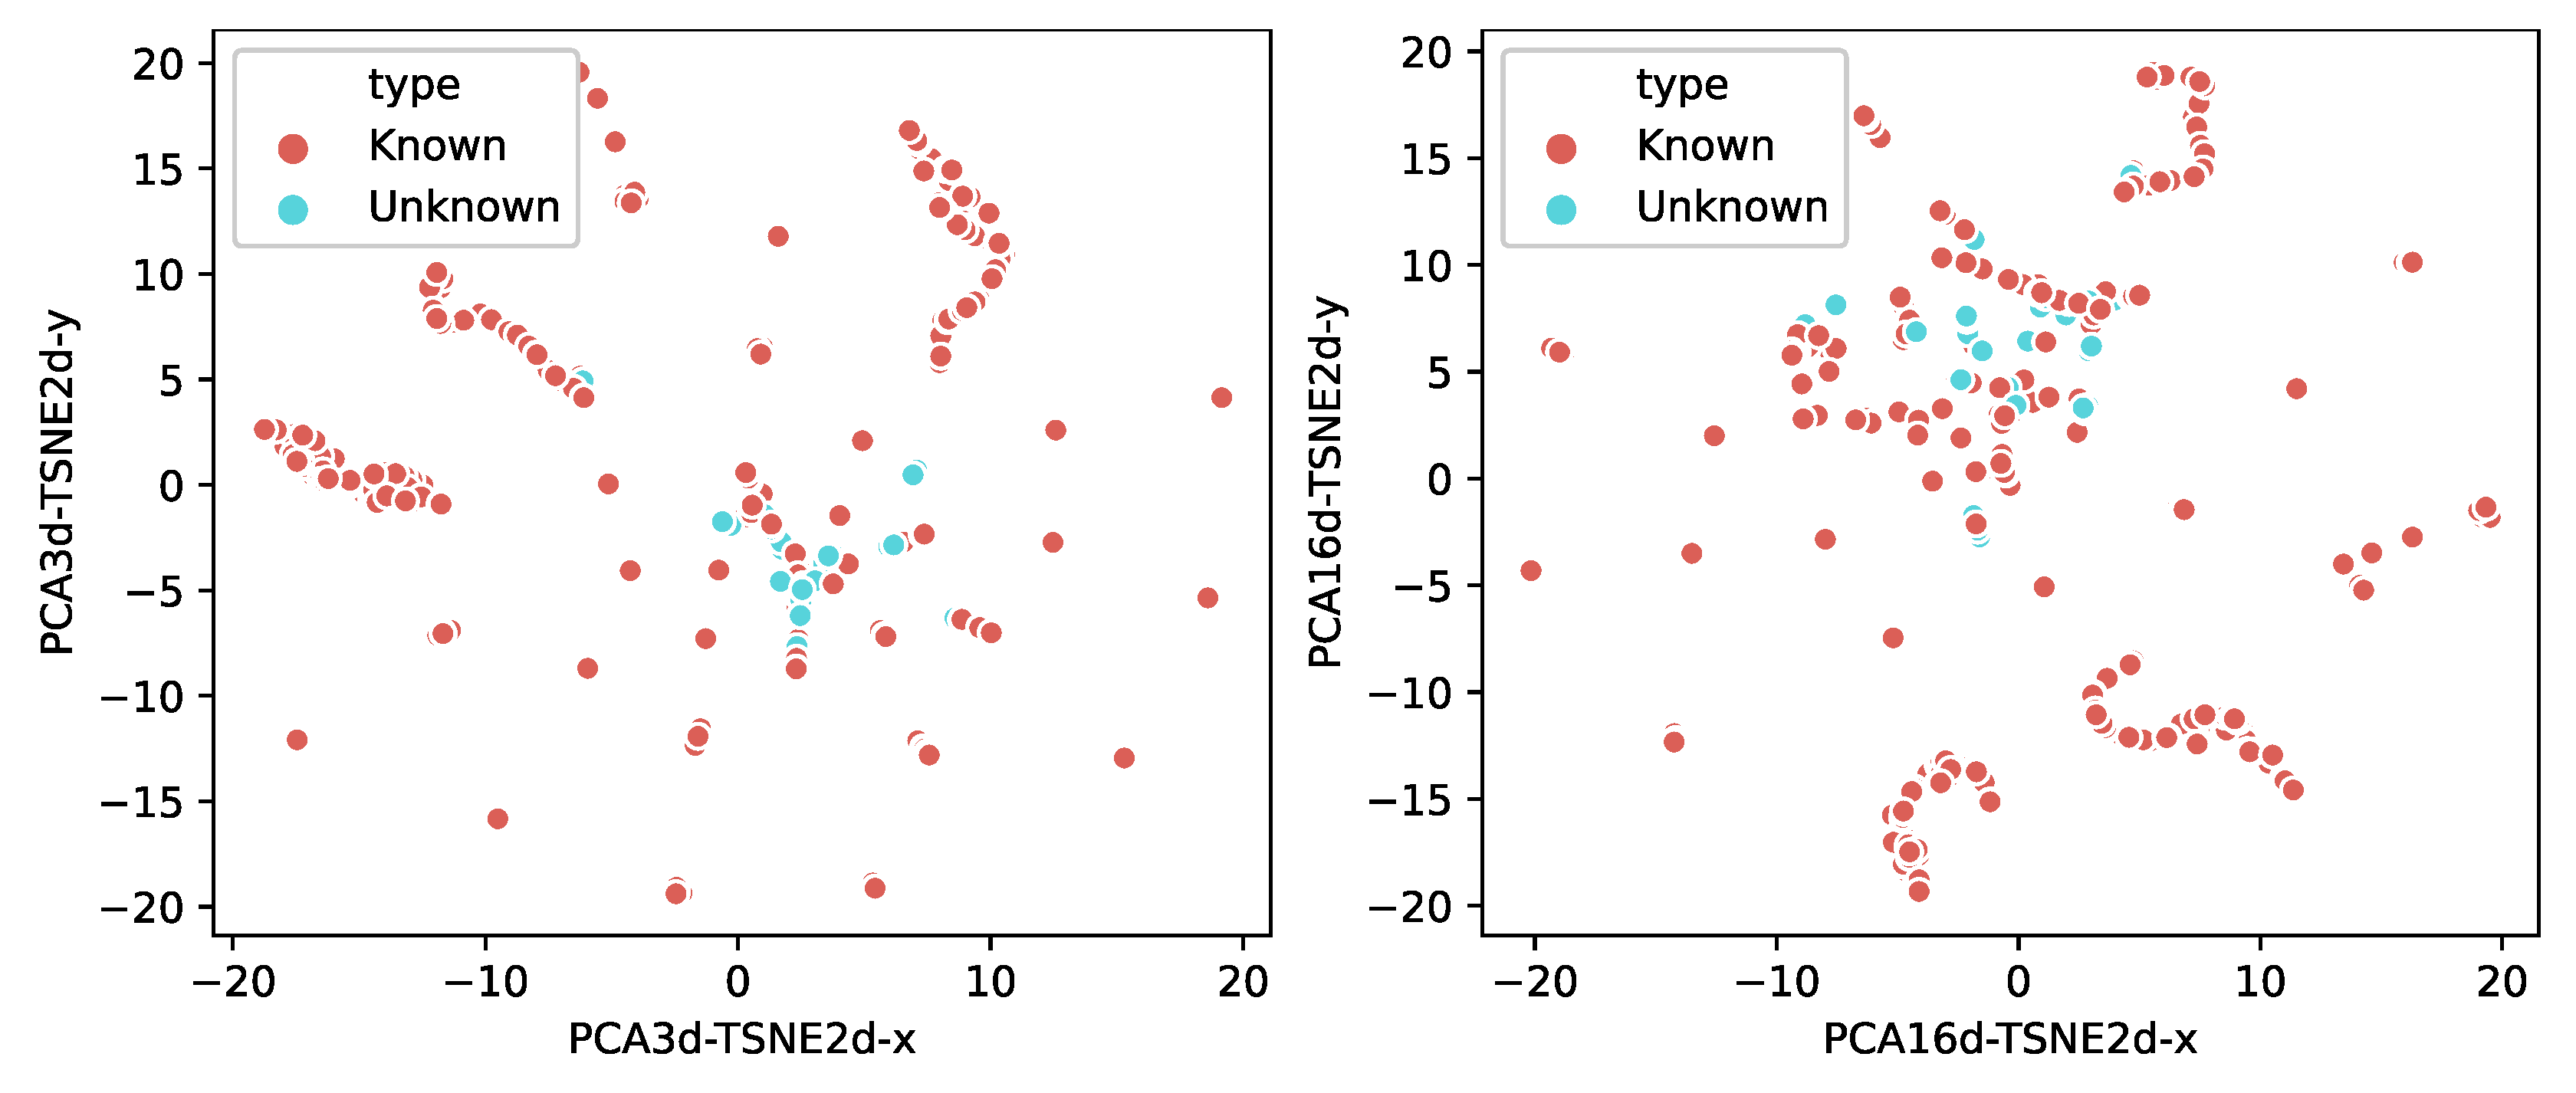
5.2.2. Bi-Classifier
5.3. Effects of Fine-Grained Identification
6. Conclusions
Author Contributions
Funding
Institutional Review Board Statement
Informed Consent Statement
Data Availability Statement
Acknowledgments
Conflicts of Interest
References
- Hariri, A.Y.; Giannelos, N.; Arief, B. Selective Forwarding Attack on IoT Home Security Kits. In Computer Security. CyberICPS/SECPRE/SPOSE/ADIoT@ESORICS; Springer: Cham, Switzerland, 2019; pp. 360–373. [Google Scholar]
- Antonakakis, M.; April, T.; Bailey, M.; Bernhard, M.; Bursztein, E.; Cochran, J.; Durumeric, Z.; Halderman, J.A.; Invernizzi, L.; Kallitsis, M.; et al. Understanding the Mirai Botnet. In Proceedings of the 26th USENIX Security Symposium, Vancouver, BC, Canada, 16–18 August 2017; pp. 1093–1110. [Google Scholar]
- Lyon, G.F. Nmap Network Scanning: The Official Nmap Project Guide to Network Discovery and Security Scanning; Nmap Project; Insecure.Com LLC: Milaca, MN, USA, 2009; pp. 5–12. [Google Scholar]
- Durumeric, Z.; Wustrow, E.; Halderman, J.A. ZMap: Fast Internet-wide scanning and its security applications. In Proceedings of the 22nd USENIX Security Symposiu, Washington, DC, USA, 14–16 August 2013; pp. 605–620. [Google Scholar]
- Auffret, P. SinFP, unification of active and passive operating system fingerprinting. J. Comput. Virol. 2010, 6, 197–205. [Google Scholar] [CrossRef]
- Goldman, D. Shodan: The Scariest Search Engine on the Internet. 2013. Available online: https://money.cnn.com/2013/04/08/technology/security/shodan/ (accessed on 22 June 2022).
- Durumeric, Z.; Adrian, D.; Mirian, A.; Bailey, M.; Halderman, J.A. A search engine backed by internet-wide scanning. In Proceedings of the 22nd ACM SIGSAC Conference on Computer and Communications Security, New York, NY, USA, 12–16 October 2015; pp. 542–553. [Google Scholar]
- Li, R.G.; Shen, M.; Yu, H.; Li, C.; Duan, P.Y.; Zhu, L.H. A Survey on Cyberspace Search Engines. In Communications in Computer and Information Science (CCIS); Springer: Singapore, 2020; Volume 1299, pp. 206–214. [Google Scholar]
- Feng, X.; Li, Q.; Wang, H.; Sun, L.M. Acquisitional Rule-based Engine for Discovering Internet-of-Things Devices. In Proceedings of the 27th USENIX Security Symposium, Baltimore, MD, USA, 15–17 August 2020; pp. 327–341. [Google Scholar]
- Kohno, T.; Broido, A.; Claffy, K. Remote physical device fingerprinting. In Proceedings of the IEEE Symposium on Security and Privacy (S&P’05), Oakland, CA, USA, 8–11 May 2005; pp. 211–225. [Google Scholar]
- Radhakrishnan, S.V.; Uluagac, A.S.; Beyah, R. GTID: A Technique for Physical Device and Device Type Fingerprinting. IEEE Trans. Dependable Secur. Comput. 2015, 12, 519–532. [Google Scholar] [CrossRef]
- Jafari, H.; Omotere, O.; Adesina, D.; Wu, H.H.; Qian, L.J. IoT Devices Fingerprinting Using Deep Learning. In Proceedings of the IEEE Military Communications Conference, Los Angeles, CA, USA, 29–31 October 2018; pp. 1–9. [Google Scholar]
- Bassey, J.; Adesina, D.; Li, X.F.; Qian, L.J.; Aved, A. Intrusion Detection for IoT Devices based on RF Fingerprinting using Deep Learning. In Proceedings of the Fourth International Conference on Fog and Mobile Edge Computing (FMEC), Rome, Italy, 10–13 June 2019; pp. 98–104. [Google Scholar]
- Meidan, Y.; Bohadana, M.; Shabtai, A.; Guarnizo, J. ProfilIoT: A machine learning approach for IoT device identification based on network traffic analysis. In Proceedings of the 32nd ACM Symposium on Applied Computing, New York, NY, USA, 3–7 April 2017; pp. 506–509. [Google Scholar]
- Jordan, H.; Ross, T.; Paul, S.; Kevin, B.; Jennifer, R. Classifying network vendors at internet scale. arXiv 2020, arXiv:2006.13086. [Google Scholar]
- Cheng, H.; Dong, W.Y.; Zheng, Y.; Lv, B. Identify IoT Devices through Web Interface Characteristics. In Proceedings of the IEEE 6th International Conference on Computer and Communication Systems (ICCCS), Chengdu, China, 23–26 April 2021; pp. 405–410. [Google Scholar]
- Miettinen, M.; Marchal, S.; Hafeez, I.; Asokan, N.; Sadeghi, A.R. IoT Sentinel: Automated Device-Type Identification for Security Enforcement in IoT. In Proceedings of the 37th IEEE International Conference on Distributed Computing Systems, Atlanta, GA, USA, 5–8 June 2017; pp. 2177–2184. [Google Scholar]
- Babun, L.; Aksu, H.; Ryan, L.; Akkaya, K.; Bentley, E.S. Z-IoT: Passive Device-class Fingerprinting of ZigBee and Z-Wave IoT Devices. In Proceedings of the IEEE International Conference on Communications (ICC), Dublin, Ireland, 7–11 June 2020; pp. 7–11. [Google Scholar]
- Marchal, S.; Miettinen, M.; Nguyen, T.D.; Sadeghi, A.R.; Asokan, N. AuDI: Toward Autonomous IoT Device-Type Identification Using Periodic Communication. IEEE J. Sel. Areas Commun. 2019, 37, 1402–1412. [Google Scholar] [CrossRef] [Green Version]
- Li, Q.; Feng, X.; Li, Z.; Wang, H.N.; Sun, L.M. GUIDE: Graphical User Interface Fingerprints Physical Devices. In Proceedings of the IEEE 24th International Conference on Network Protocols (ICNP), Singapore, 8–11 November 2016; pp. 1–2. [Google Scholar]
- Li, Q.; Feng, X.; Wang, H.; Sun, L. Automatically Discovering Surveillance Devices in the Cyberspace. In Proceedings of the 8th ACM on Multimedia Systems Conference (MMSys), Taipei, Taiwan, 20–23 June 2017; pp. 331–342. [Google Scholar]
- Yousefnezhad, N.; Malhi, A.; Främling, K. Automated IoT Device Identification Based on Full Packet Information Using Real-Time Network Traffic. Sensors 2021, 21, 2660. [Google Scholar] [CrossRef] [PubMed]
- Bezawada, B.; Bachani, M.; Peterson, J.; Shirazi, H.; Ray, I. Behavioral Fingerprinting of IoT Devices. In Proceedings of the 2018 Workshop on Attacks and Solutions in Hardware Security (ASHES), Toronto, ON, Canada, 19 October 2018; pp. 41–50. [Google Scholar]
- Formby, D.; Srinivasan, P.; Leonard, A.; Rogers, J.; Beyah, R. Who’s in Control of Your Control System? Device Fingerprinting for Cyber-Physical Systems. In Proceedings of the Network and Distributed System Security Symposium (NDSS), San Diego, CA, USA, 21–24 February 2016; pp. 23142–23156. [Google Scholar]
- Lavrenovs, A.; Graf, R. Explainable AI for Classifying Devices on the Internet. In Proceedings of the 13th International Conference on Cyber Conflict (CyCon), Tallinn, Estonia, 25–28 May 2021; pp. 291–308. [Google Scholar]
- Chowdhury, R.R.; Aneja, S.; Aneja, N.; Abas, E. Network Traffic Analysis based IoT Device Identification. In Proceedings of the 4th International Conference on Big Data and Internet of Things, Singapore, 22–24 August 2020; pp. 79–89. [Google Scholar]
- Agarwal, S.; Oser, P.; Lueders, S. Detecting IoT Devices and How They Put Large Heterogeneous Networks at Security Risk. Sensors 2019, 19, 4107. [Google Scholar] [CrossRef] [PubMed] [Green Version]
- Wang, X.; Wang, Y.C.; Feng, X.; Zhu, H.S.; Sun, L.M. IoTTracker: An Enhanced Engine for Discovering Internet-of-Thing Devices. In Proceedings of the 2019 IEEE 20th International Symposium on “A World of Wireless, Mobile and Multimedia Networks” (WoWMoM), Arlington, TX, USA, 10–12 June 2019; pp. 1–9. [Google Scholar]
- Trimananda, R.; Varmarken, J.; Markopoulou, A.; Demsky, B. For Smart Home Device Events. In Proceedings of the Network and Distributed Systems Security (NDSS) Symposium 2020, San Diego, CA, USA, 23–26 February 2020; pp. 24097–24121. [Google Scholar]
- Thangavelu, V.; Divakaran, D.M.; Sairam, R.; Bhunia, S.S.; Gurusamy, M. DEFT: A Distributed IoT Fingerprinting Technique. IEEE Internet Things J. 2019, 6, 940–952. [Google Scholar] [CrossRef]
- Sivanathan, A.; Sherratt, D.; Gharakheili, H.H.; Radford, A.; Wijenayake, C. Characterizing and Classifying IoT Traffic in Smart Cities and Campuses. In Proceedings of the 2017 IEEE Conference on Computer Communications Workshops (INFOCOM WKSHPS), Atlanta, GA, USA, 1–4 May 2017; pp. 559–564. [Google Scholar]
- Sivanathan, A.; Gharakheili, H.H.; Loi, F.; Radford, A.; Wijenayake, C.; Vishwanath, A. Classifying IoT Devices in Smart Environments Using Network Traffic Characteristics. IEEE Trans. Mob. Comput. 2019, 18, 1745–1759. [Google Scholar] [CrossRef]
- Ortiz, J.; Crawford, C.; Le, F. DeviceMien: Network device behavior modeling for identifying unknown IoT devices. In Proceedings of the International Conference on Internet-of-Things Design and Implementation (IoTDI), Montreal, QC, Canada, 15–18 April 2019; pp. 106–117. [Google Scholar]
- Qaddoura, R.; Al-Zoubi, A.M.; Faris, H.; Almomani, I. A Multi-Layer Classification Approach for Intrusion Detection in IoT Networks Based on Deep Learning. Sensors 2021, 21, 2987. [Google Scholar] [CrossRef] [PubMed]
- Yang, K.; Li, Q.; Sun, L.M. Towards automatic fingerprinting of IoT devices in the cyberspace. Comput. Netw. 2019, 148, 318–327. [Google Scholar] [CrossRef]
- Lavrenovs, A.; Graf, R.; Heinaaro, K. Towards Classifying Devices on the Internet Using Artificial Intelligence. In Proceedings of the 12th International Conference on Cyber Conflict (CyCon), Tallinn, Estonia, 26–29 May 2020; pp. 309–325. [Google Scholar]
- Chen, Z.T.; He, K.; Li, J.; Chen, Y.H. Seq2Img: A sequence-to-image based approach towards IP traffic classification using convolutional neural networks. In Proceedings of the IEEE International Conference on Big Data (Big Data), Boston, MA, USA, 11–14 December 2017; pp. 1271–1276. [Google Scholar]
- Aneja, S.; Aneja, N.; Islam, M.S. IoT Device Fingerprint using Deep Learning. In Proceedings of the 2018 IEEE International Conference on Internet of Things and Intelligence System (IOTAIS), Bali, Indonesia, 1–3 November 2018; pp. 174–179. [Google Scholar]
- Jahanbakhshi, A.; Momeny, M.; Mahmoudi, M.; Zhang, Y.D. Classification of Sour Lemons Based on Apparent Defects Using Stochastic Pooling Mechanism in Deep Convolutional Neural Networks. Sci. Hortic. 2020, 263, 109–133. [Google Scholar] [CrossRef]
- Pathmaperuma, M.H.; Rahulamathavan, Y.; Dogan, S.; Kondoz, A. CNN for User Activity Detection Using Encrypted In-App Mobile Data. Future Internet 2022, 14, 67. [Google Scholar] [CrossRef]
- Rokach, L. Ensemble-Based Classifiers. Artif. Intell. Rev. 2009, 33, 1–39. [Google Scholar] [CrossRef]
- Galicia, A.; Talavera-Llames, R.L.; Lora, A.T.; Koprinska, I.; Martínez-Álvarez, F. Multi-step forecasting for big data time series based on ensemble learning. Knowl.-Based Syst. 2018, 163, 830–841. [Google Scholar] [CrossRef]
- Khurana, M.; Saxena, V. Green cover change detection using a modified adaptive ensemble of extreme learning machines for North-Western India. J. King Saud Univ.—Comput. Inf. Sci. 2021, 33, 1265–1273. [Google Scholar] [CrossRef]
- Dhalaria, M.; Gandotra, E.; Saha, S. Comparative Analysis of Ensemble Methods for Classification of Android Malicious Applications. Adv. Comput. Data Sci. 2019, 1045, 370–380. [Google Scholar]
- Radhakrishnan, P.; Ramaiyan, K.; Vinayagam, A.; Veerasamy, V. A stacking ensemble classification model for detection and classification of power quality disturbances in PV integrated power network. Measurement 2021, 175, 109025. [Google Scholar] [CrossRef]
- Sathyanarayanan, A.; Srivatsan, M.; Meenakshi, K. Smart Web Dictionary using OCR. In Proceedings of the 2022 International Conference on Computer Communication and Informatics (ICCCI), Coimbatore, India, 1–3 July 2022; pp. 1–5. [Google Scholar]
- Goyal, A.; Rathore, L.; Kumar, S. A Survey on Solution of Imbalanced Data Classification Problem Using SMOTE and Extreme Learning Machine. In Communication and Intelligent Systems; Sharma, H., Ed.; Springer: Singapore, 2021; pp. 31–44. [Google Scholar]
- Maaten, L.; Hinton, G. Visualizing data using t-SNE. J. Mach. Learn. Res. 2008, 9, 2579–2605. [Google Scholar]
- Wold, S.; Esbensen, K.; Geladi, P. Principal component analysis. Chemom. Intell. Lab. Syst. 1987, 2, 37–52. [Google Scholar] [CrossRef]


| Vendor | Type | Quantity | Vendor | Type | Quantity |
|---|---|---|---|---|---|
| AXIS | Camera, etc. | 1769 | Samsung | Camera | 1597 |
| Asus | Router | 1431 | SonicWall | Firewall | 1286 |
| Avtech | Camera | 1301 | Sophos | Firewall | 2541 |
| Check-Point | Firewall, etc. | 1523 | Super-Micro | Gateway | 1862 |
| Cisco | Router, etc. | 1409 | Synology | NAS | 1131 |
| Cyberoam | VPN | 354 | TP-LINK | Router, etc. | 1747 |
| D-Link | Router, etc. | 678 | Technicolor | Gateway | 1032 |
| Dahua | DVR, etc. | 635 | Topsec | Firewall | 1428 |
| H3c | Firewall | 685 | Yamaha | Network switch | 527 |
| Hikvision | Camera, etc. | 871 | ZTE | Router, etc. | 2086 |
| Huawei | Switch, etc. | 2378 | Zyxel | Router, etc. | 740 |
| Juniper | Firewall | 1023 | maxis | Router | 462 |
| Linksys | Router, etc. | 856 | peplink | Router | 791 |
| MikroTik | Router | 385 | pfSense | Firewall | 692 |
| QNAP | NAS | 2863 | ruckus | Access Controller | 563 |
| Classifier Model | CNN | Res-DNN |
|---|---|---|
| Input size | 224 × 224 × 3 | 16 × 16 |
| Convolutional kernel number | 16, 32, 64 | - |
| Convolutional kernel size | 7 × 7, 3 × 3, 3 × 3 | - |
| Pooling type | Max pooling | - |
| pool_size | (22) | - |
| Optimizer | SGD | Adam |
| Sizes of dense layers | 1000, 256, 128, 64, 30 | L1: 1000, 500, 150, 10, 2; L2: 30, 2; L3: 60,2 |
| Bach_size | 128 | 128 |
| Momentum | 0.9 | - |
| Learning Rate | 0.005 | 0.002 |
| Activation function | ReLU, SoftMax | ReLU |
| Loss function | Cross entropy | Cross entropy |
| Times | Accuracy | Precision | Recall | F1-Score |
|---|---|---|---|---|
| 1st cross-validation | 0.978 | 0.987 | 0.980 | 0.983 |
| 2nd cross-validation | 0.984 | 0.986 | 0.990 | 0.988 |
| 3rd cross-validation | 0.978 | 0.984 | 0.983 | 0.983 |
| 4th cross-validation | 0.981 | 0.980 | 0.987 | 0.983 |
| 5th cross-validation | 0.978 | 0.977 | 0.980 | 0.978 |
| average | 0.98 | 0.983 | 0.984 | 0.983 |
| Model | Accuracy | Precision | Recall | F1-Score |
|---|---|---|---|---|
| Logistic Regression | 0.957 | 0.956 | 1 | 0.9786 |
| Decision Tree | 0.969 | 0.990 | 0.8977 | 0.984 |
| KNN | 0.976 | 0.992 | 0.983 | 0.987 |
| SVM | 0.980 | 0.996 | 0.983 | 0.989 |
| TCN | 0.985 | 0.996 | 0.989 | 0.992 |
| RF | 0.987 | 0.991 | 0.994 | 0.993 |
| WideResNet | 0.989 | 0.990 | 0.996 | 0.994 |
| Res-DNN | 0.991 | 0.992 | 0.998 | 0.995 |
| Attributes | # by Our Method | Accuracy of Our Method | # by Shodan | Accuracy of Shodan |
|---|---|---|---|---|
| Vendor | 7010 | 99.9% | 6411 | 91.36% |
| Type | 6990 | 99.62% | 6830 | 97.34% |
| Model | 6978 | 99.46% | 6786 | 88.07% |
Publisher’s Note: MDPI stays neutral with regard to jurisdictional claims in published maps and institutional affiliations. |
© 2022 by the authors. Licensee MDPI, Basel, Switzerland. This article is an open access article distributed under the terms and conditions of the Creative Commons Attribution (CC BY) license (https://creativecommons.org/licenses/by/4.0/).
Share and Cite
Wang, R.; Li, H.; Jing, J.; Jiang, L.; Dong, W. WYSIWYG: IoT Device Identification Based on WebUI Login Pages. Sensors 2022, 22, 4892. https://doi.org/10.3390/s22134892
Wang R, Li H, Jing J, Jiang L, Dong W. WYSIWYG: IoT Device Identification Based on WebUI Login Pages. Sensors. 2022; 22(13):4892. https://doi.org/10.3390/s22134892
Chicago/Turabian StyleWang, Ruimin, Haitao Li, Jing Jing, Liehui Jiang, and Weiyu Dong. 2022. "WYSIWYG: IoT Device Identification Based on WebUI Login Pages" Sensors 22, no. 13: 4892. https://doi.org/10.3390/s22134892
APA StyleWang, R., Li, H., Jing, J., Jiang, L., & Dong, W. (2022). WYSIWYG: IoT Device Identification Based on WebUI Login Pages. Sensors, 22(13), 4892. https://doi.org/10.3390/s22134892