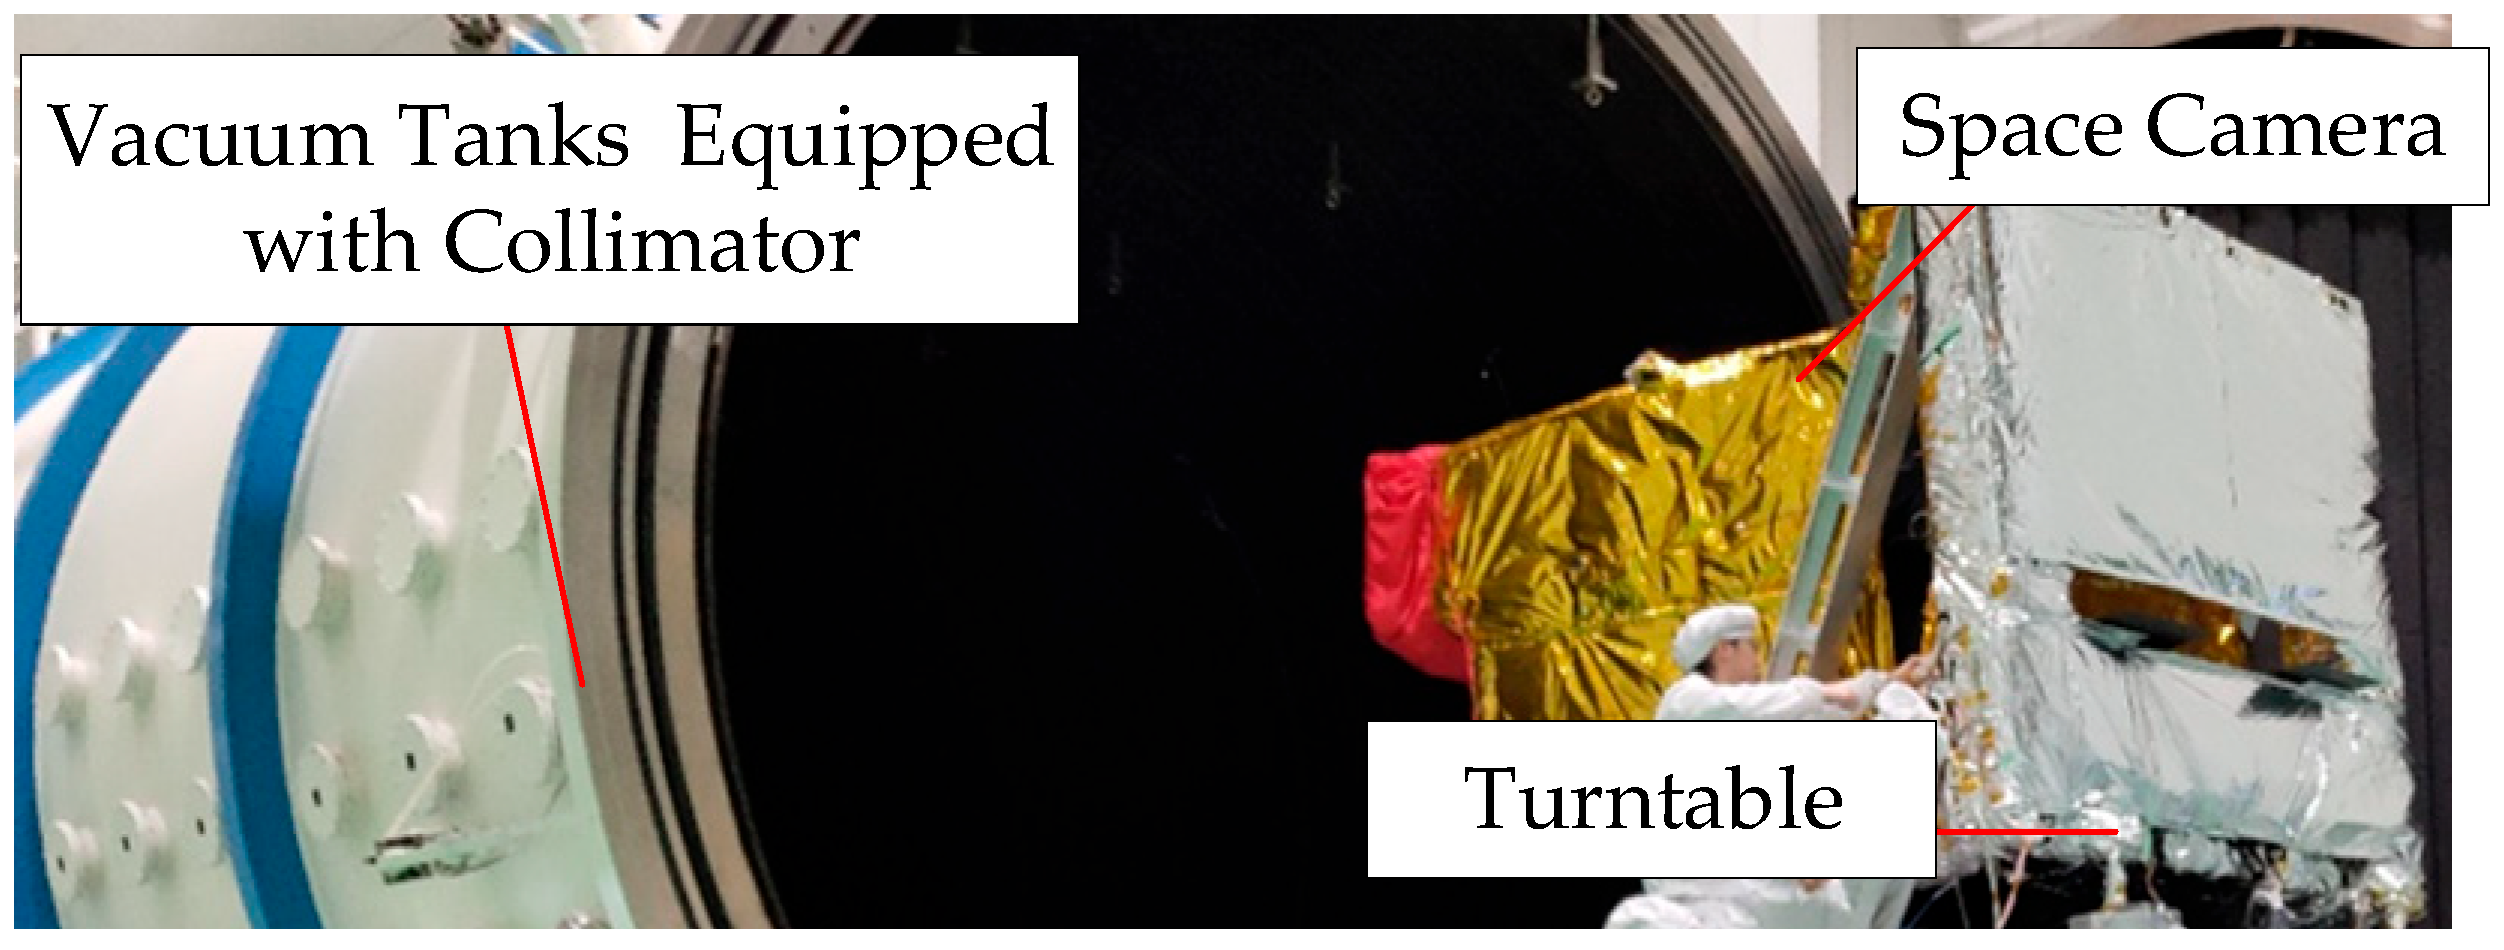
3.2.1. Establishment of Torrance–Sparrow Analysis Model with Wide Adaptability
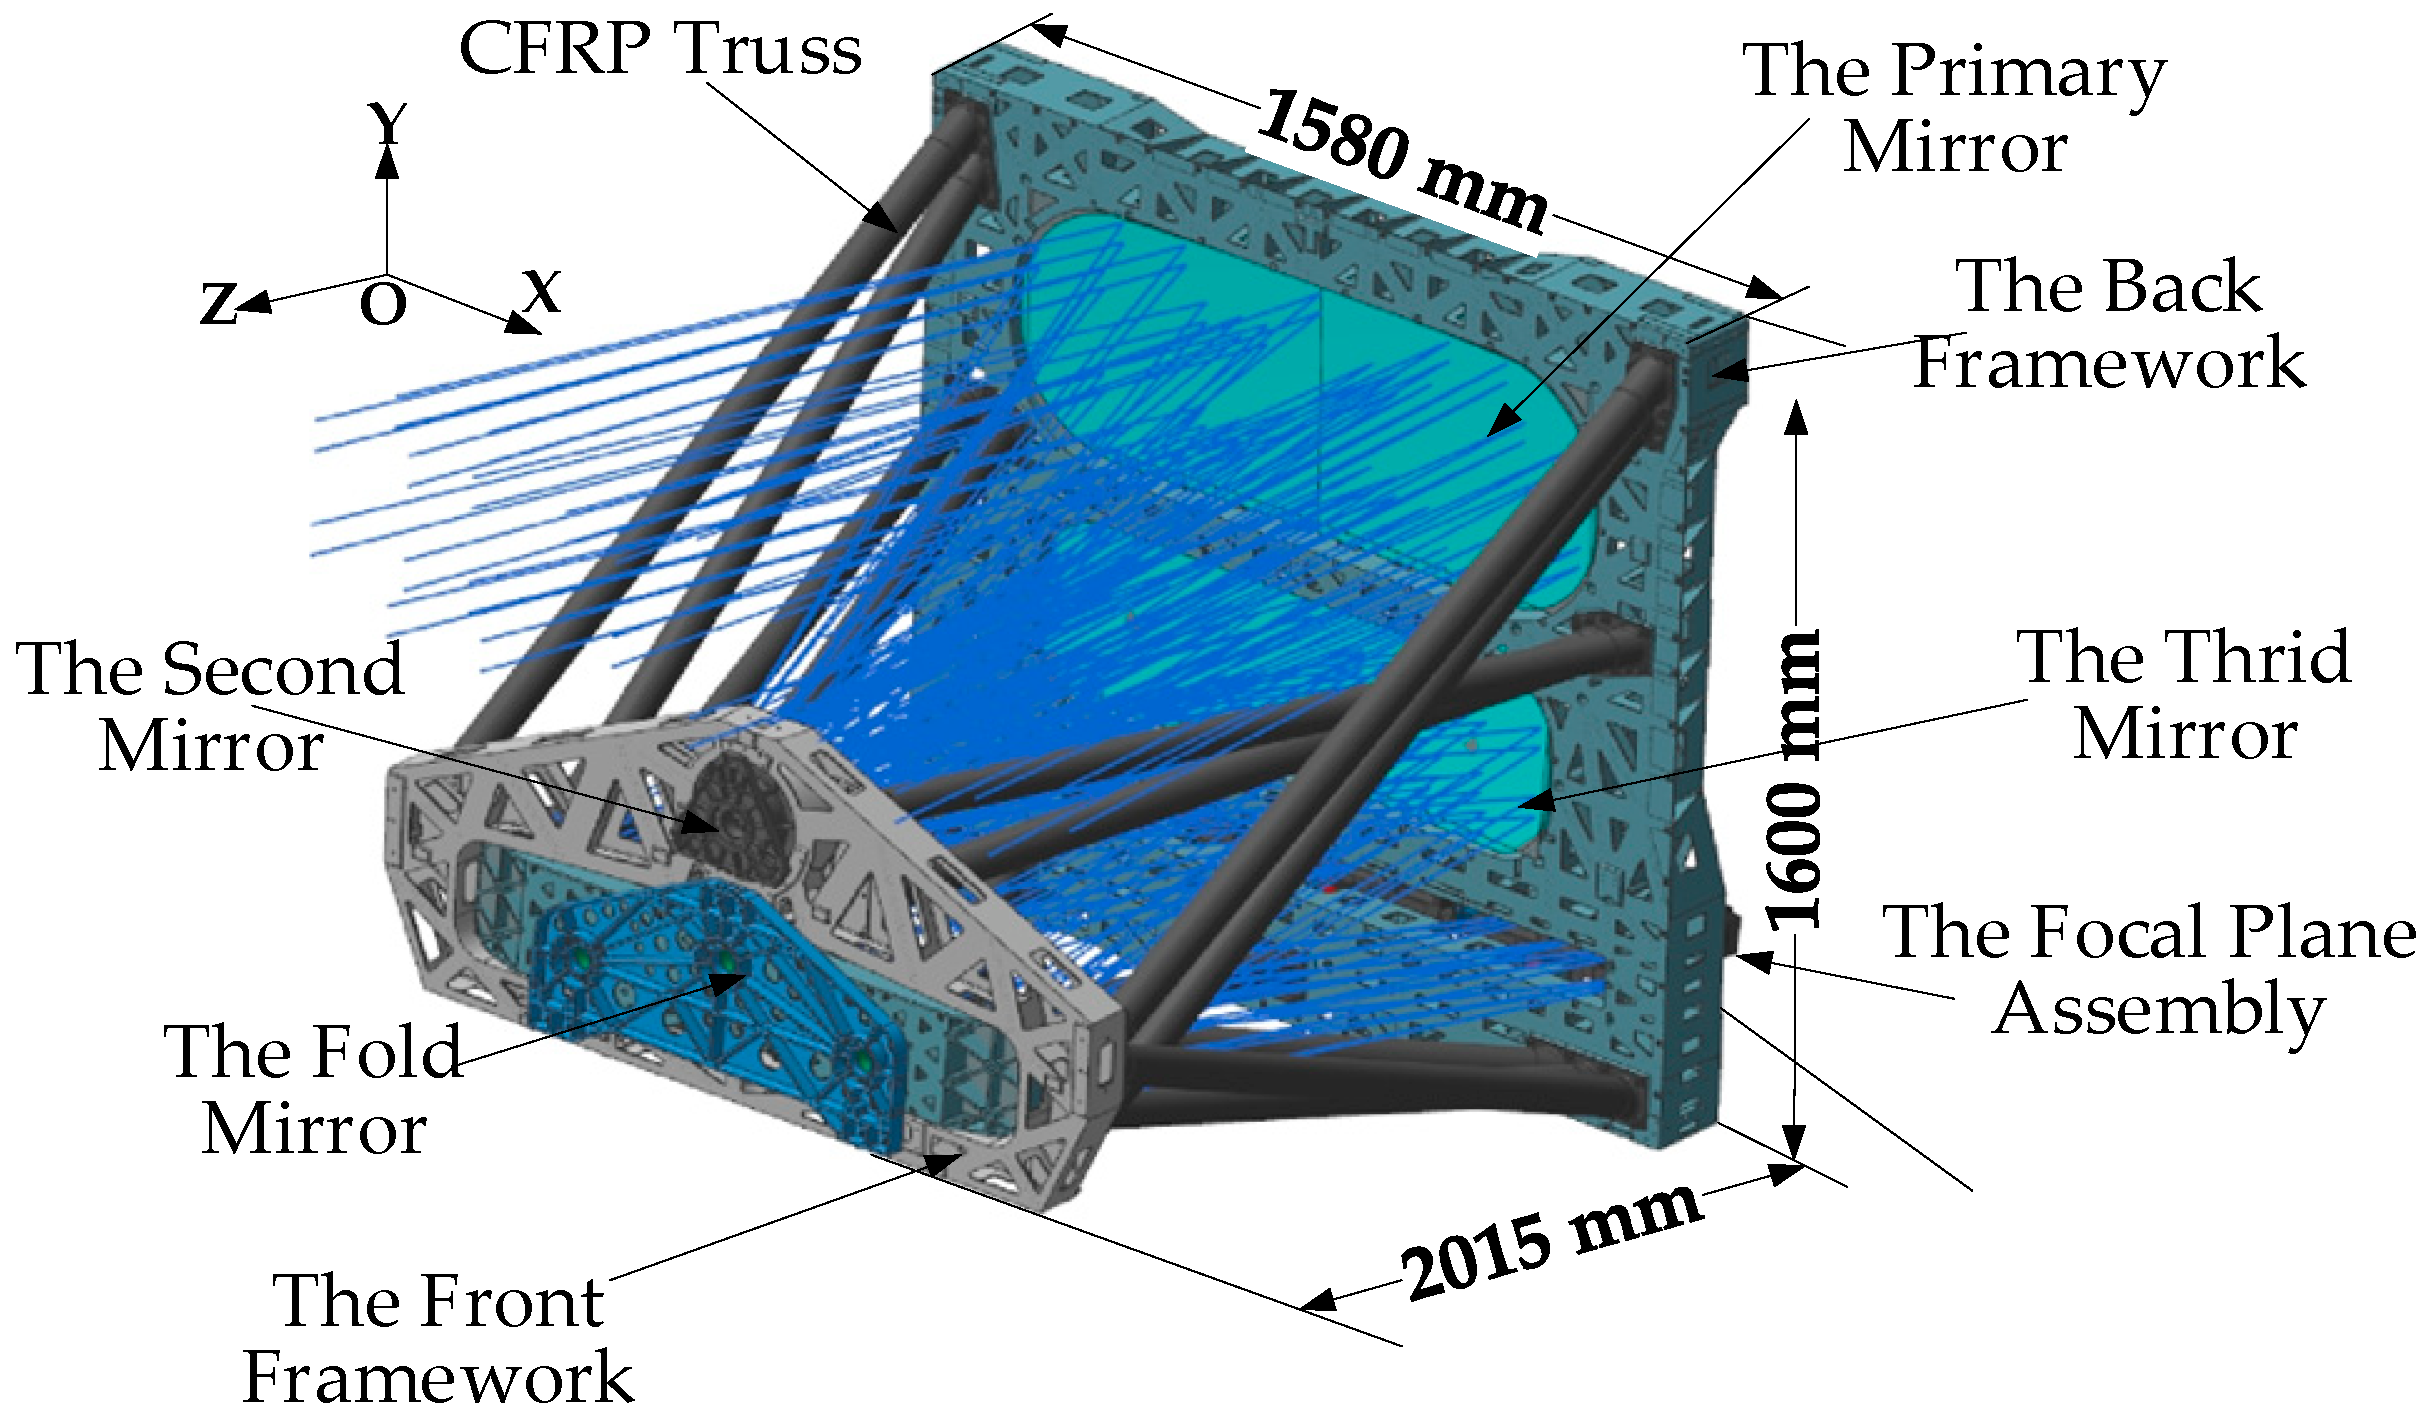
Most of the stray light of the large off-axis TMA space camera is caused by the scattering of the surfaces of the mirrors and mechanical structures. The stray-light suppression level of the system is closely related to the properties of the mirrors and the mechanical structure. The stray-light suppression level of the optical system can be accurately evaluated by modeling the key surface-scattering attributes.
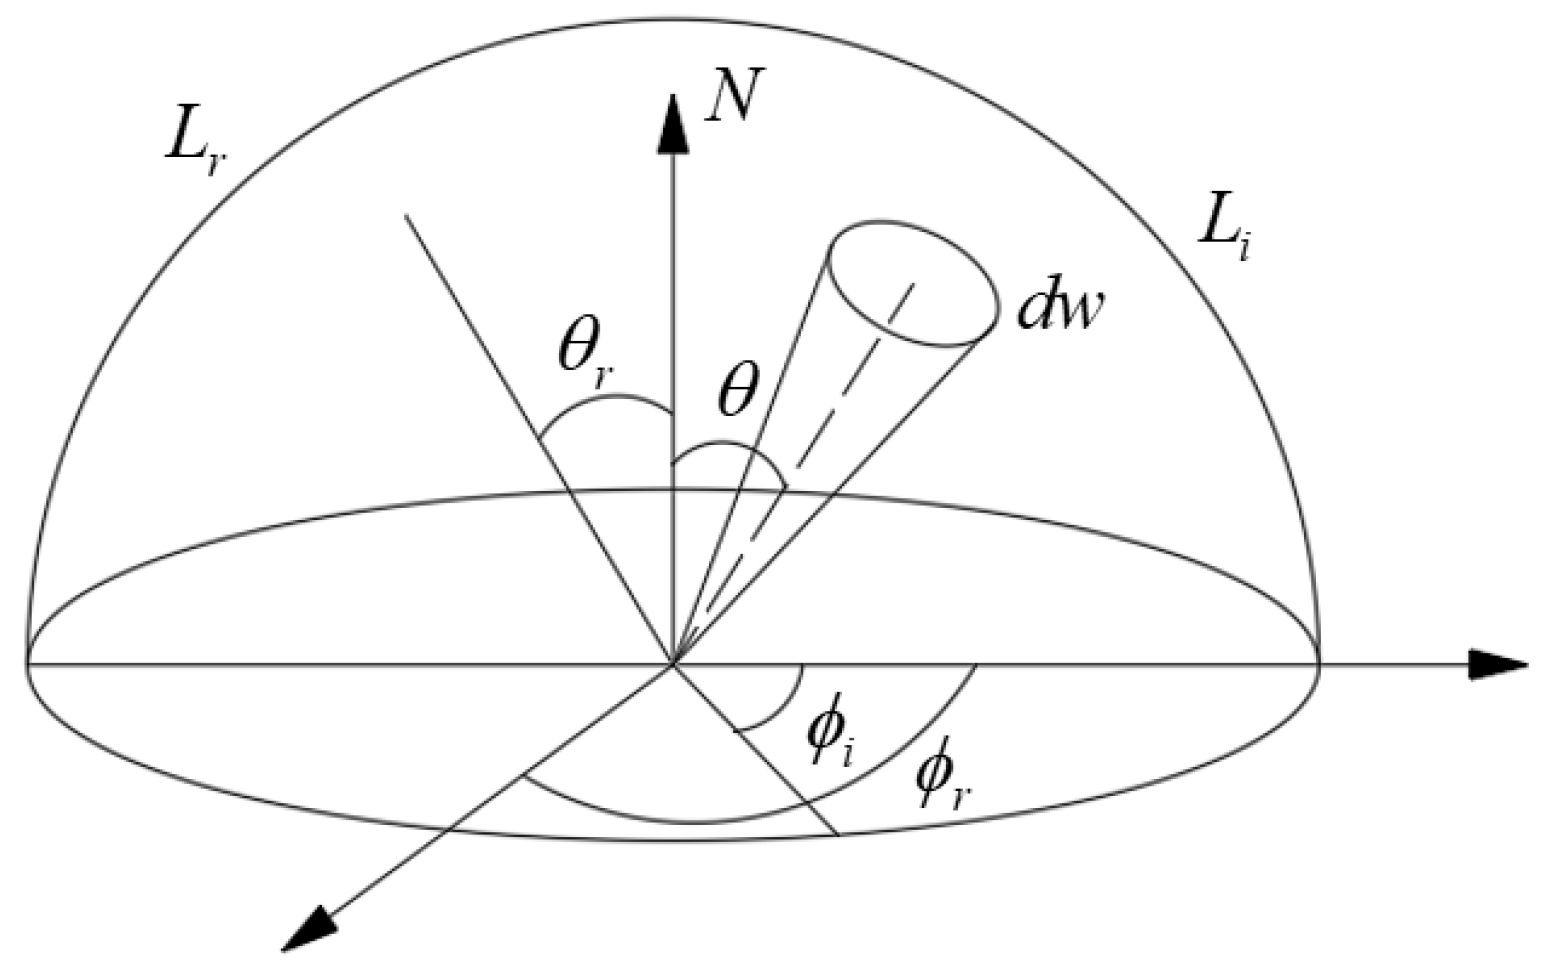
The scattering attribute of each light is characterized by bidirectional scattering distribution function (
BSDF) [
20] (see
Figure 4). The physical meaning of
BSDF is the ratio of the irradiance of the light emitted from the material surface along a certain direction to the irradiance of the incident light, which can be expressed as [
21,
22]:
where
and
represent the pitch angle and azimuth angle of the incident light, respectively;
and
represent the pitch angle and azimuth angle of the scattered light, respectively.
The BSDF consists of a bidirectional reflectance distribution function (BRDF), bidirectional transmittance distribution function (BTDF), and bidirectional diffraction distribution function (BDDF). The BRDF is mainly used to describe the diffuse reflection characteristics of the surface, BTDF is used to describe the scattering characteristics of the transparent medium, and BDDF is used to describe the scattering characteristics caused by aperture diffraction. For large off-axis TMA space cameras, only the scattered stray light generated by the BRDF on the surfaces of the mirrors can be considered in the stray-light analysis, whereas the influence of BTDF and BDDF on the stray light can be ignored.
When calculating the stray light of an optical system in combination with engineering applications, it is necessary to perform mathematical fitting of the BSDF function. Commonly used mathematical models include the Harvey–Shack, ABg, and Torrance–Sparrow models.
The Harvey–Shack model [
12] has some limitations. Firstly, the Harvey–Shack model is based on scalar theory and cannot explain the polarization effect of scattered light. Secondly, when the incident angle and scattering angle are large, the analysis results are not accurate. Finally, only when the surface of the medium is smooth, the scattering characteristics are more accurate. The mirror of the large off-axis TMA space camera in this paper adopts the RB-SiC molding process, which is prone to mirror defects and low mirror roughness. Therefore, the Harvey–Shack model is not applicable to the modeling and analysis of scattering characteristics of the large TMA space camera in this paper.
The ABg model is another common scattering light analysis model, but it also has some limitations. Firstly, the ABg model is only applicable to the analysis of the back-scattering characteristics, and the analysis of the forward-scattering characteristics of the surface of optical materials is not obvious, especially when the incident light is irradiated at a large angle. Secondly, the ABg model is not accurate enough to model the surface of mechanical structure materials, which leads to a decrease in the accuracy of the analysis results. Finally, like the Harvey–Shack model, the ABg model is only suitable for smooth surfaces, not for modeling and analysis of the rough material surface. Therefore, it is not applicable to modeling and analysis of scattering characteristics of the large off-axis TMA space camera in this paper.
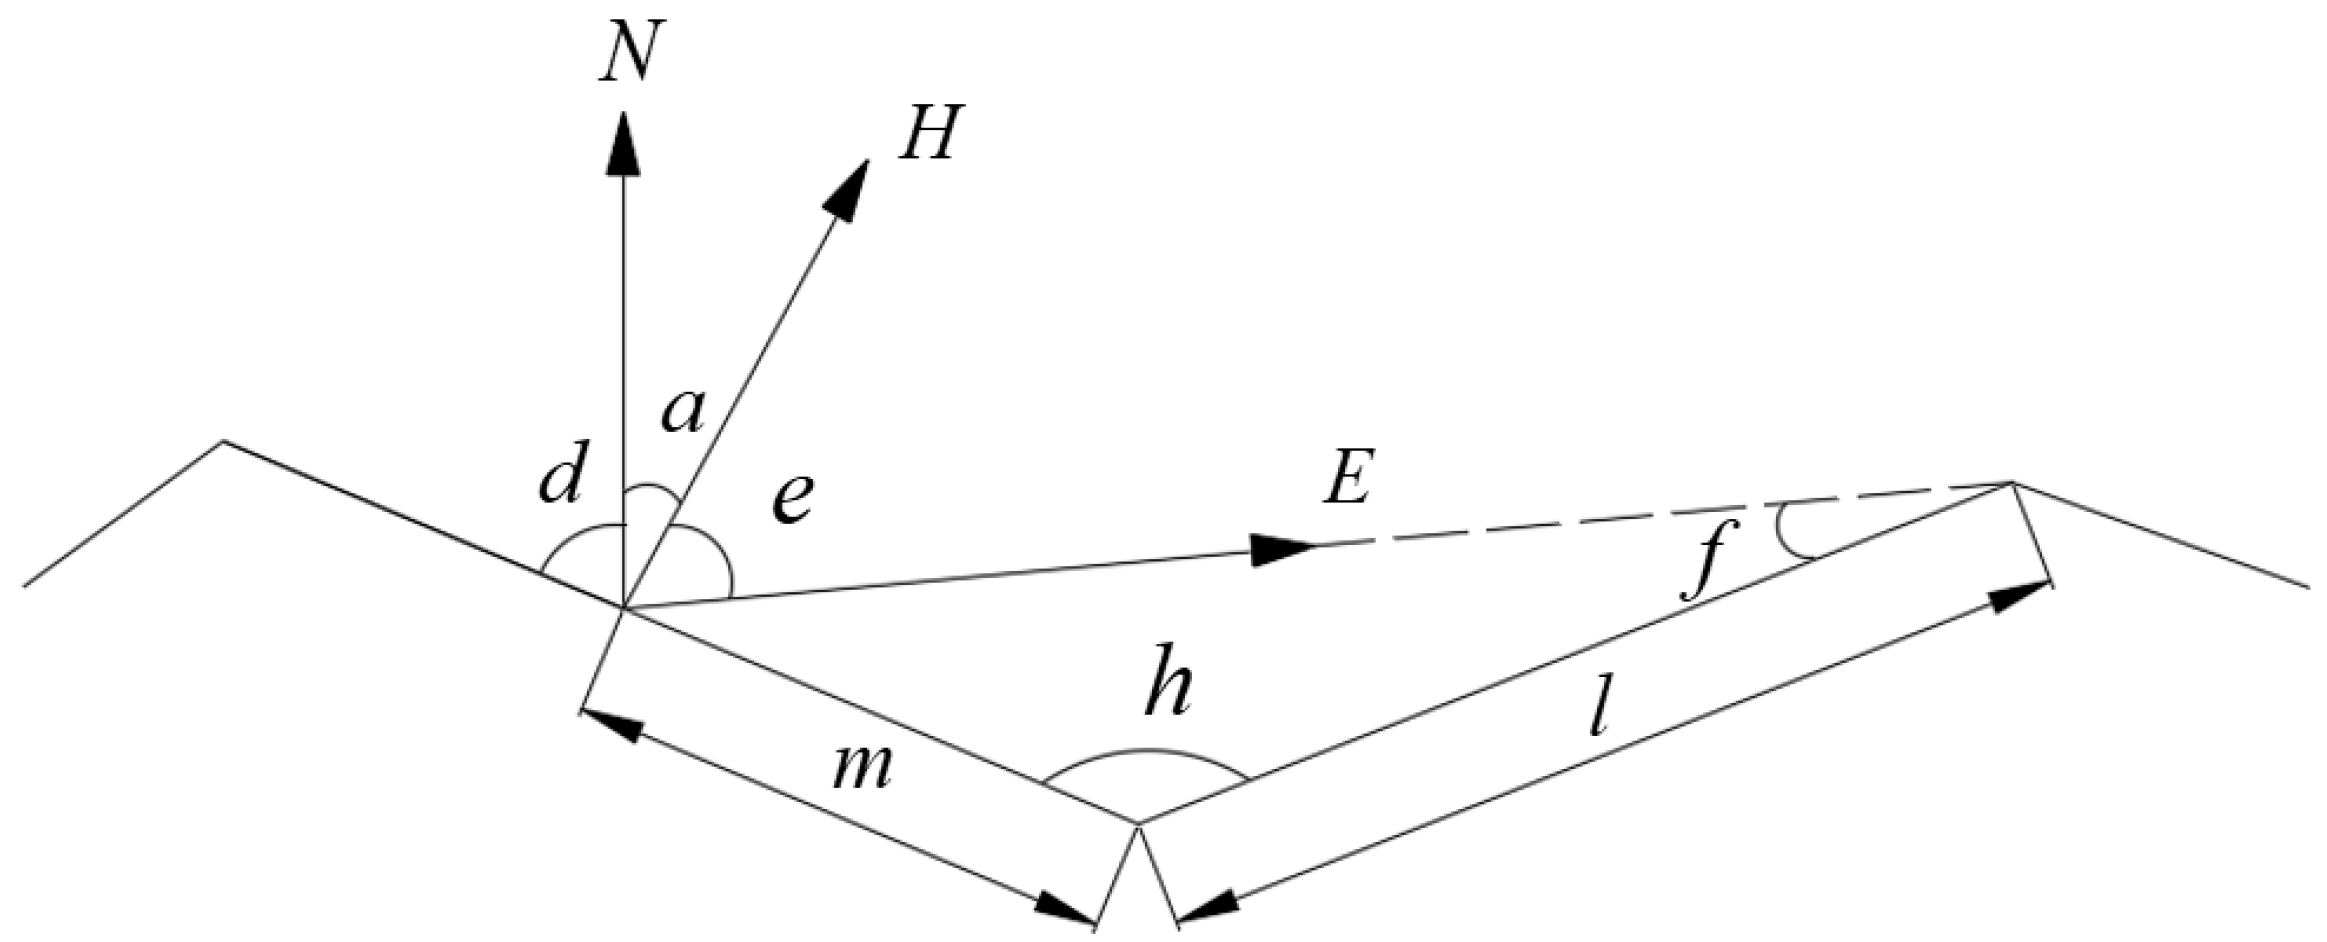
The Torrance–Sparrow model is a rough surface reflection model based on radiometry and microsurface theory. The microsurface theory believes that a point on the rough surface is composed of many V-shaped concave microsurfaces with different orientations, and countless microplane reflectors are formed with the light incident [
13]. The microsurface normal distribution function is expressed as:
where
H,
N, and
m are the half-angle vector, the normal vector, and the smoothing factor, respectively.
When the Torrance–Sparrow model is used to simulate the microsurface, as shown in
Figure 5, it is necessary to model three cases: incident light and outgoing light are not blocked; outgoing light is blocked and incident light is blocked through geometric attenuation factors, and the geometric attenuation factors of the three cases are
,
, and
, respectively.
The BRDF formula of the Torrance–Sparrow model is:
In the formula, the first term corresponds to specular reflection of small surface elements, and the second term corresponds to diffuse reflection. represents the total reflection ratio, represents the outgoing light vector, , represents the Fresnel factor, and g represents the scaling correction factor.
The geometric spreading function can be expressed as:
When the Torrance–Sparrow model is used to simulate the microsurface, it is necessary to model three cases: incident light and outgoing light are not blocked, outgoing light is blocked and the incident light is blocked through geometric attenuation factors, and the geometric attenuation factors of the three cases are , and , respectively.
Although the Torrance–Sparrow model is suitable for the modeling and analysis of optical and mechanical systems with high roughness, it assumes that only one reflection is considered for specular reflection. As shown in
Figure 6, when a small angle incident occurs, the light is reflected by the two sides of the V-shaped concave in different directions, but the incident angle is small, and the reflection spectrum still shows a peak. When the incident angle increases, the reflected light on the two sides of the V-shaped concave gradually separates, and the reflection spectrum should appear as two peaks, which are nonmirror peaks corresponding to the incident angle of the light source. When the incident angle continues to increase, the two nonmirror peaks gradually approach and tend to combine into one peak.
Therefore, although the traditional Torrance–Sparrow model is suitable for surfaces with high roughness, the accuracy of the stray-light analysis results is reduced when the sample surface size is large and the surface roughness distribution is complex. To accurately model large complex rough surfaces, this study proposes a model with wider adaptability based on the Torrance–Sparrow model.
According to the shadowing effect, nonmirror peaks of medium and large angles are caused by the mirror reflection of the V-shaped concave surface with a slope greater than 1. It should appear at
, where
and
correspond to the incident and reflection angles, respectively.
and
correspond to the positive and negative critical angles of the shadowing effect, respectively. In the Torrance–Sparrow model, the nonmirrored peaks produced by the V-shaped concave surface are approximated by a Gaussian distribution. The geometric spreading function is expressed as follows:
where
corresponds to the position of the nonmirror peak, which is a function of the incident angle; a and b are constants.
The geometric spreading function of the wide adaptability Torrance–Sparrow model is presented in
Table 4.
The wide-adaptability Torrance–Sparrow model proposed in this study is suitable for the stray-light modeling analysis of large-scale surfaces with poor roughness; thus, it can be applied to stray-light analysis of mirrors in this study. Based on the established Torrance–Sparrow model with wide adaptability, TracePro software was used to analyze the stray light of the large off-axis TMA space camera to determine the VGI and PST.
3.2.2. Simulation Analysis
- (1)
Stray-light analysis parameter settings
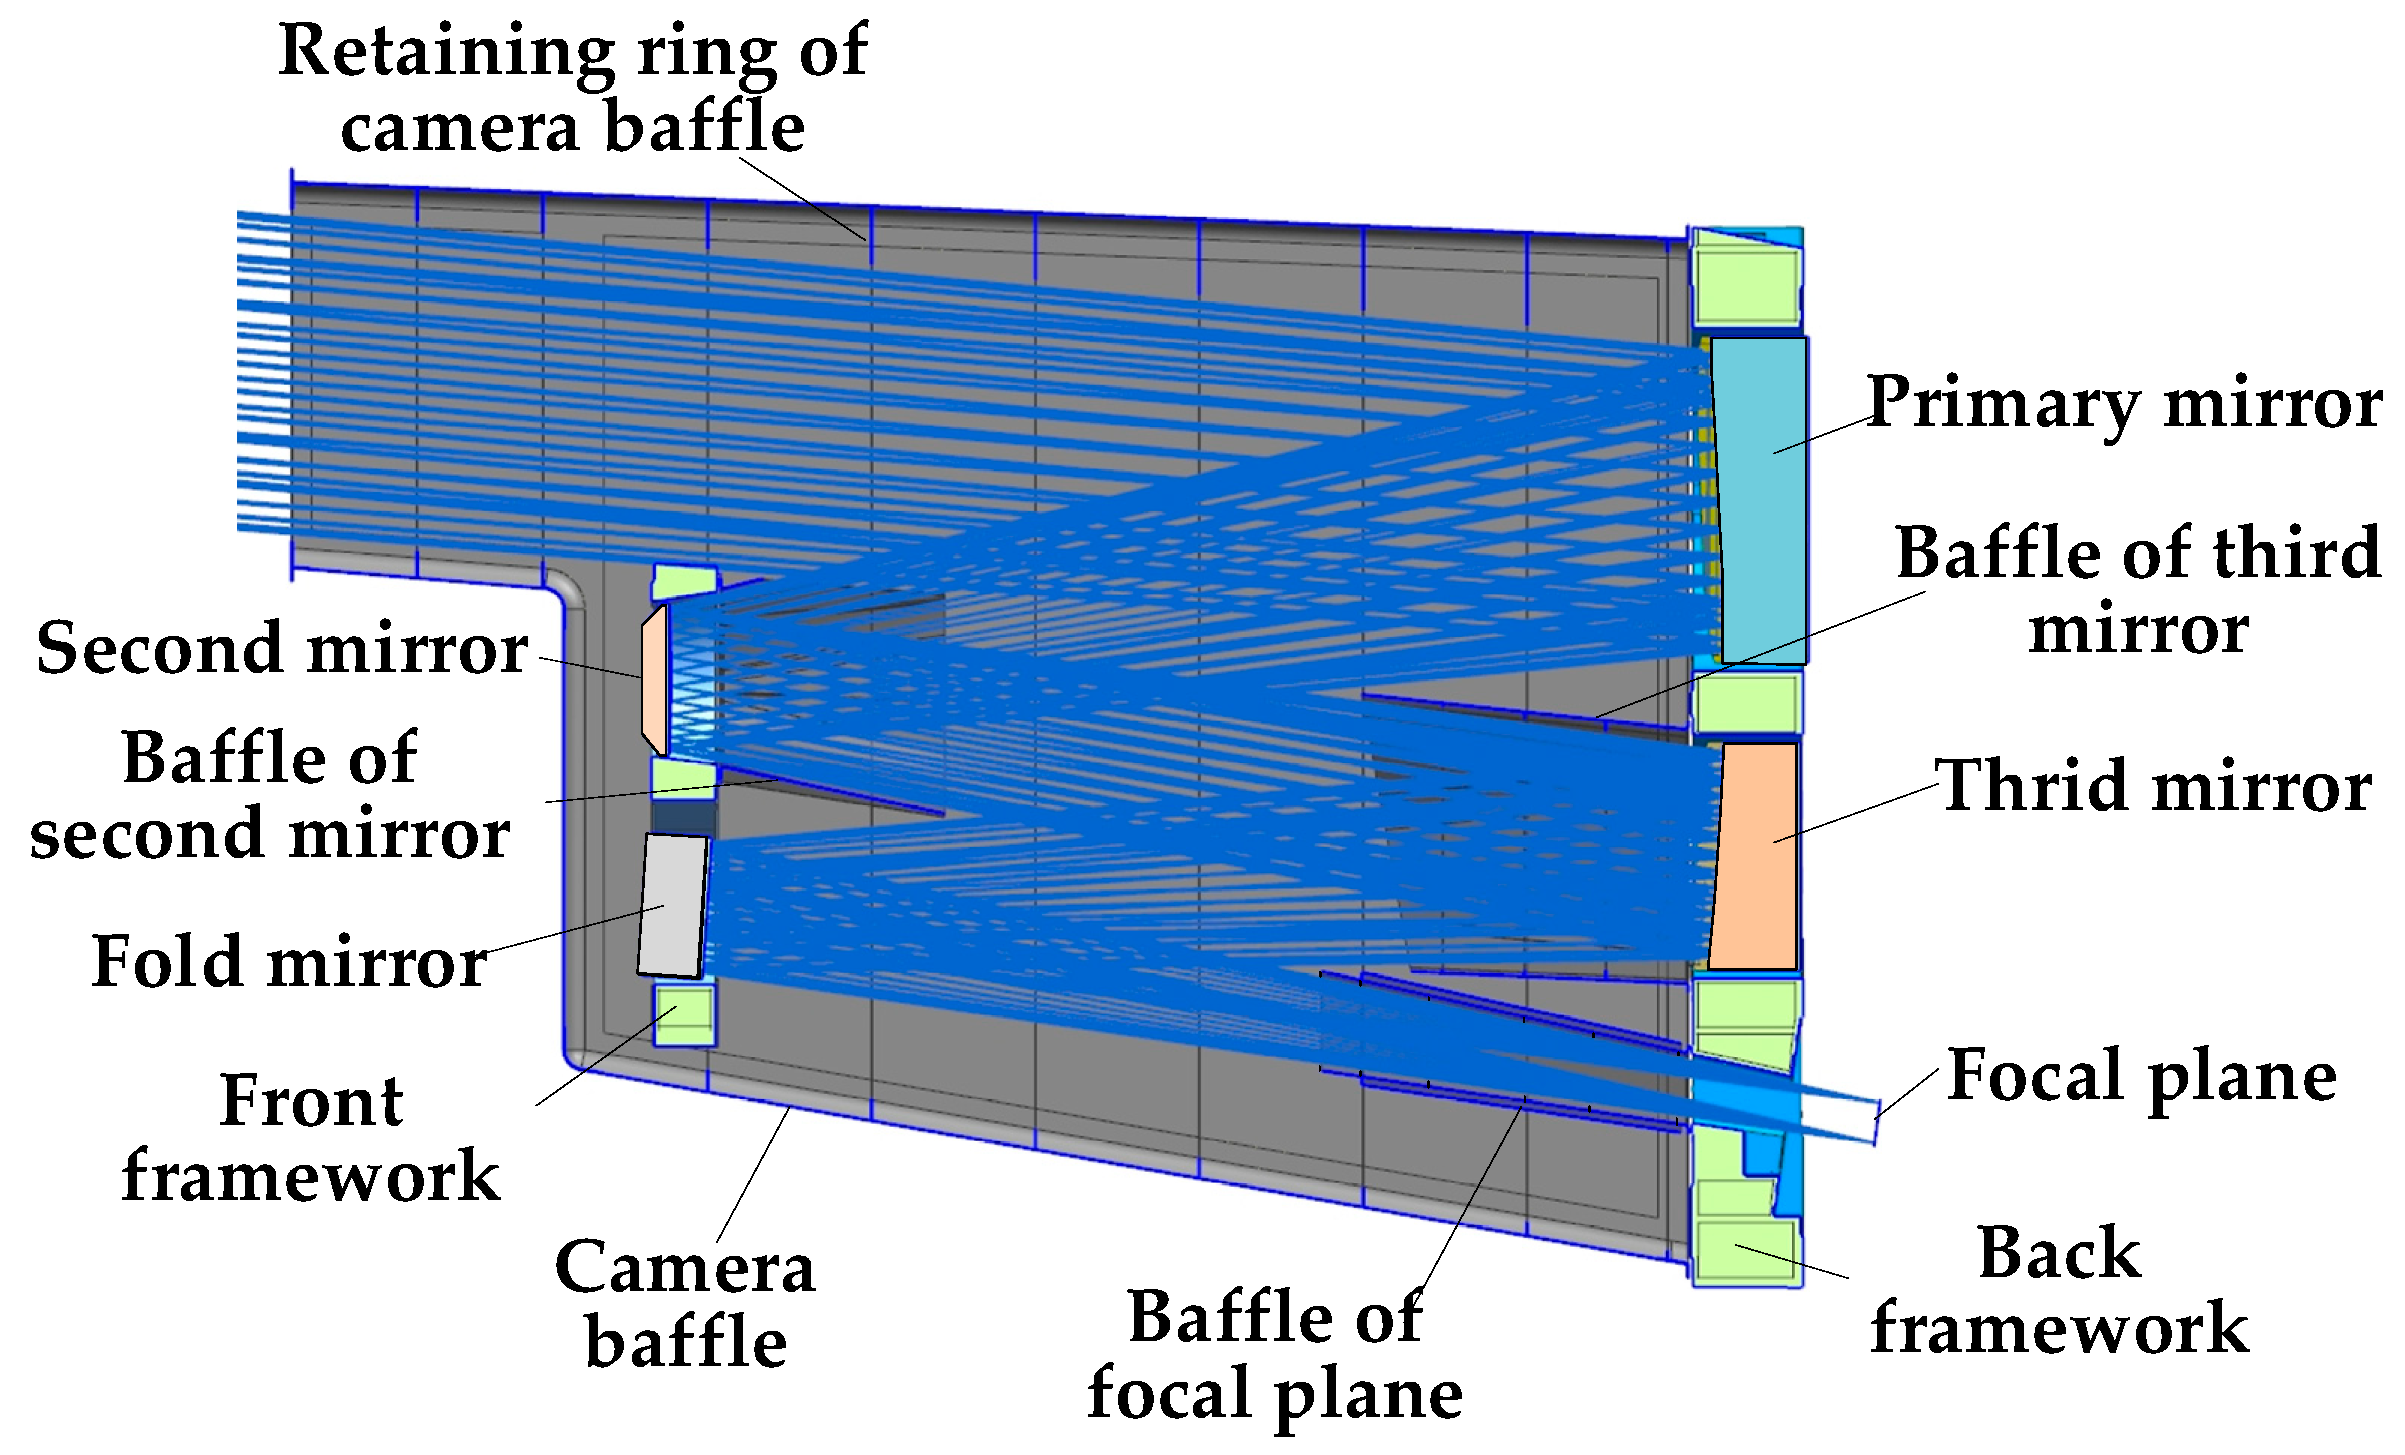
The optical camera is composed of optical (primary mirror, second mirror, third mirror, and fold mirror) and mechanical components. According to the role of the different components in the optical system, the corresponding attributes are assigned to TracePro. The roughness of each reflection surface was set to 5 nm, and the absorption rate of the stray-light elimination structure was set to 0.96. The stray-light analysis properties of the other mirrors are listed in
Table 5, and the other structural parts were set to black paint. The reflectance and scattering rate of each component are listed in
Table 3.
- (2)
Point Source Transmittance (PST) and Veiling Glare Index (VGI) analysis.
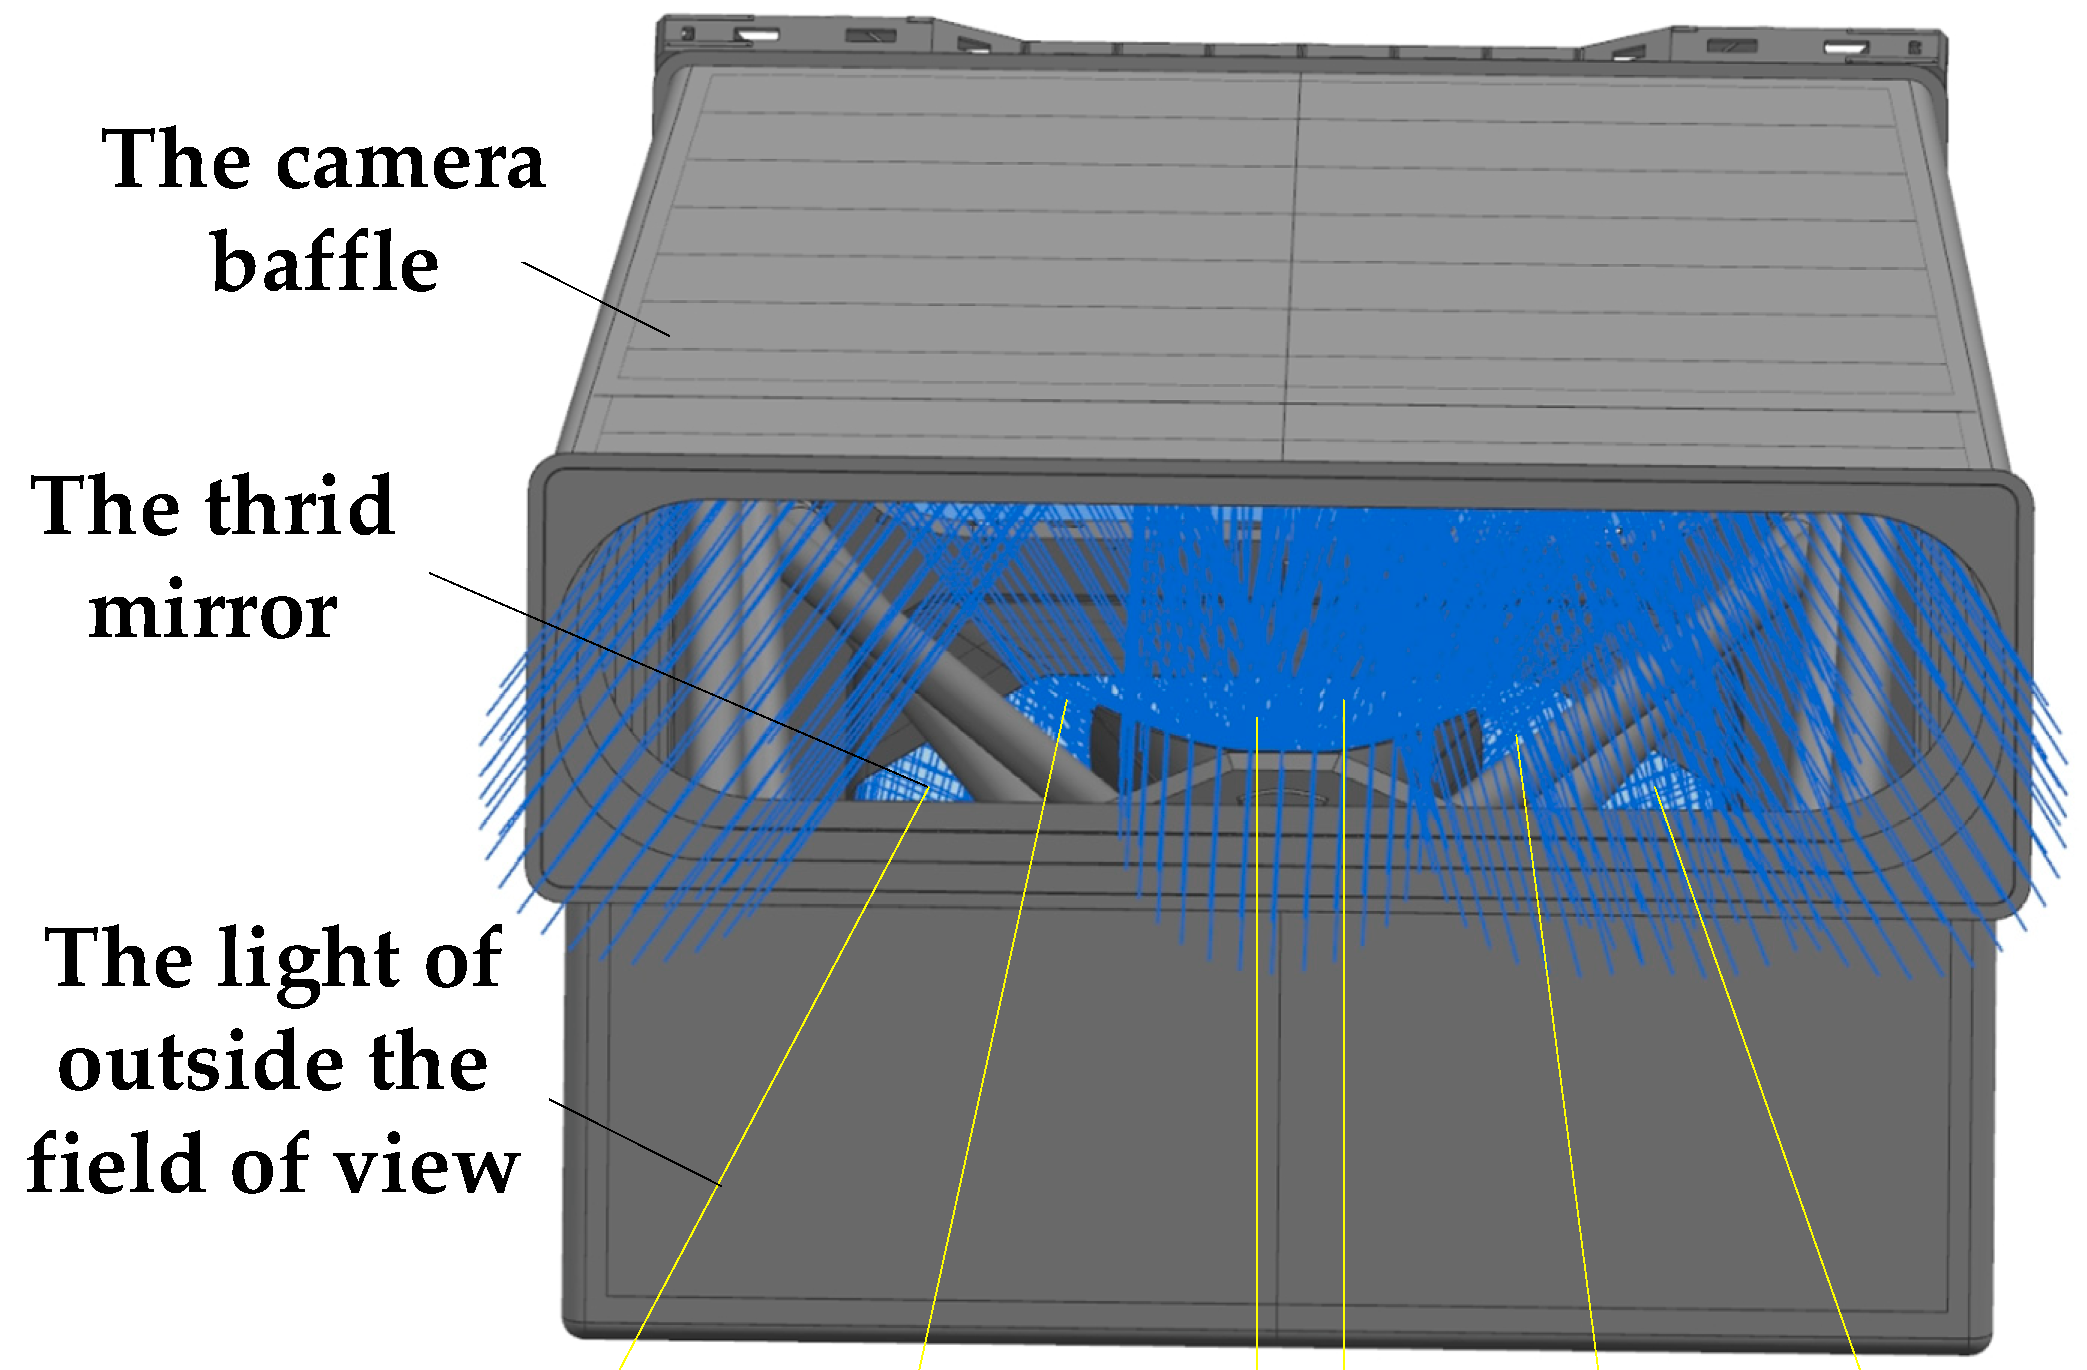
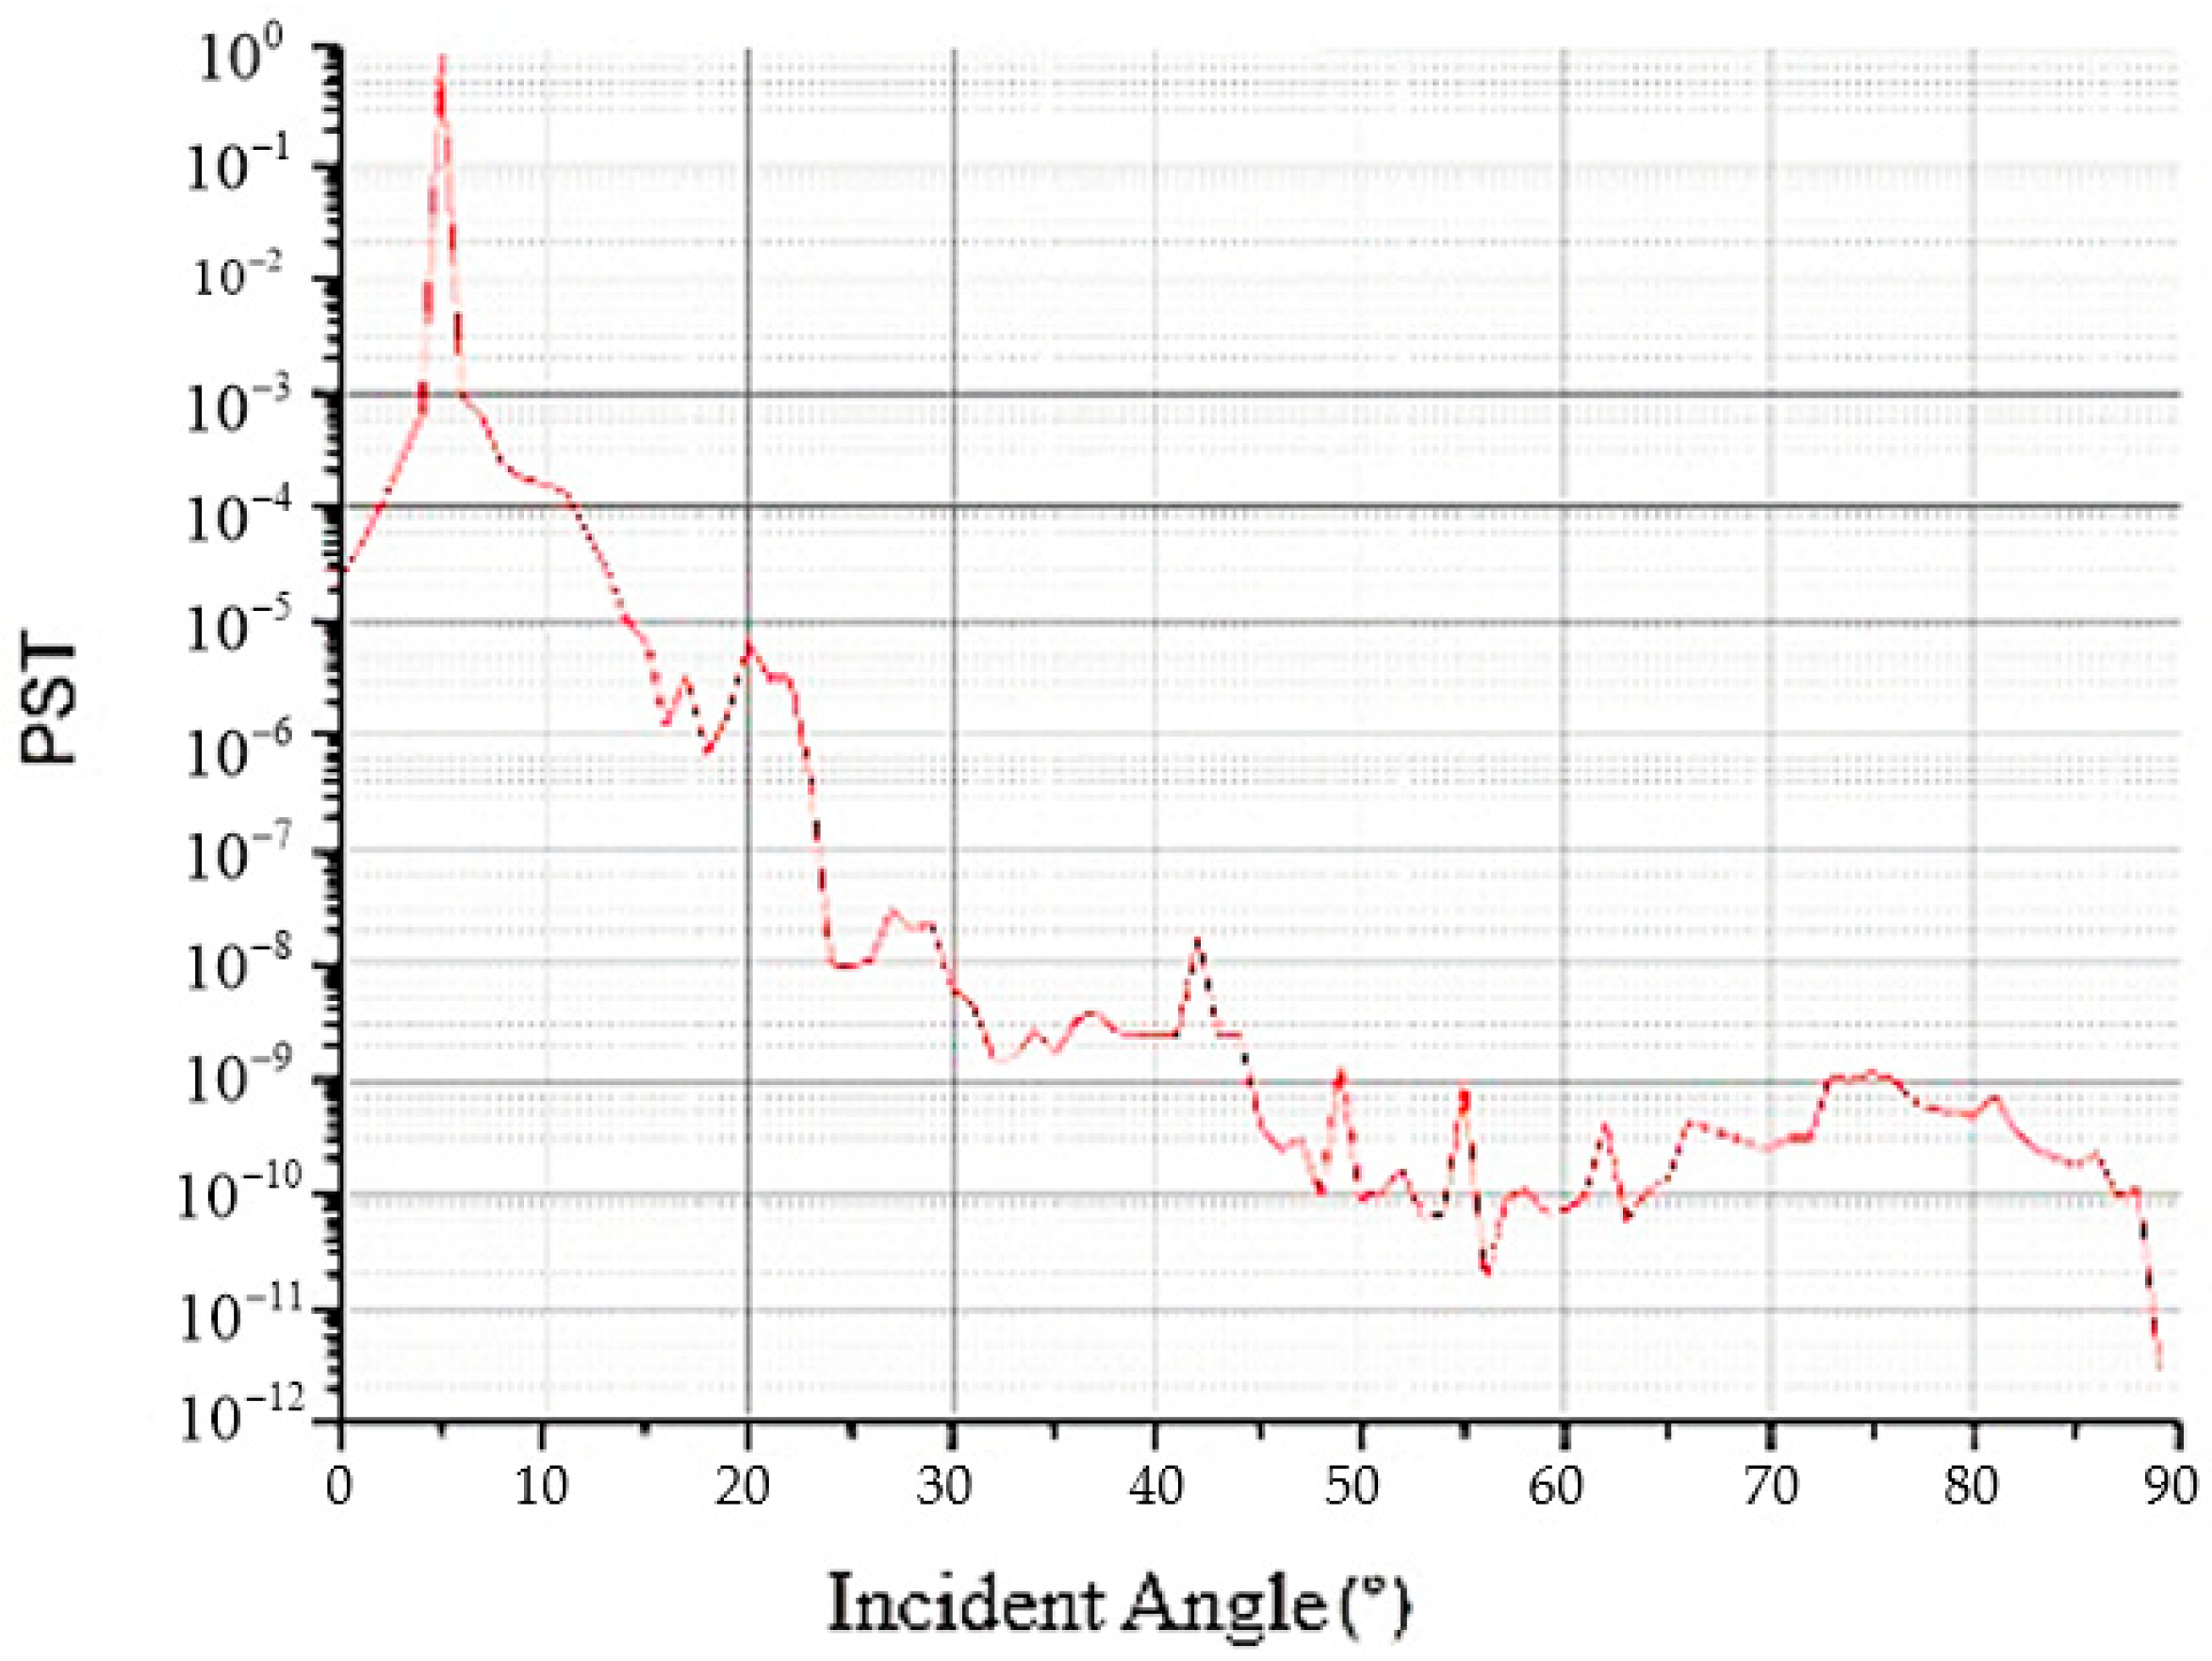
In the simulation model, the light source was set as a grid light source located at the exit of the primary mirror baffle, and the light source boundary was a rectangle. The number of tracing rays of the system was 400 million, and the threshold of the trace rays was 10
−8. By changing the direction of the light beam emitted from the light source surface, the light transmission conditions of different fields of view were simulated. The analysis diagram of TracePro based on the Torrance–Sparrow model is shown in
Figure 7.
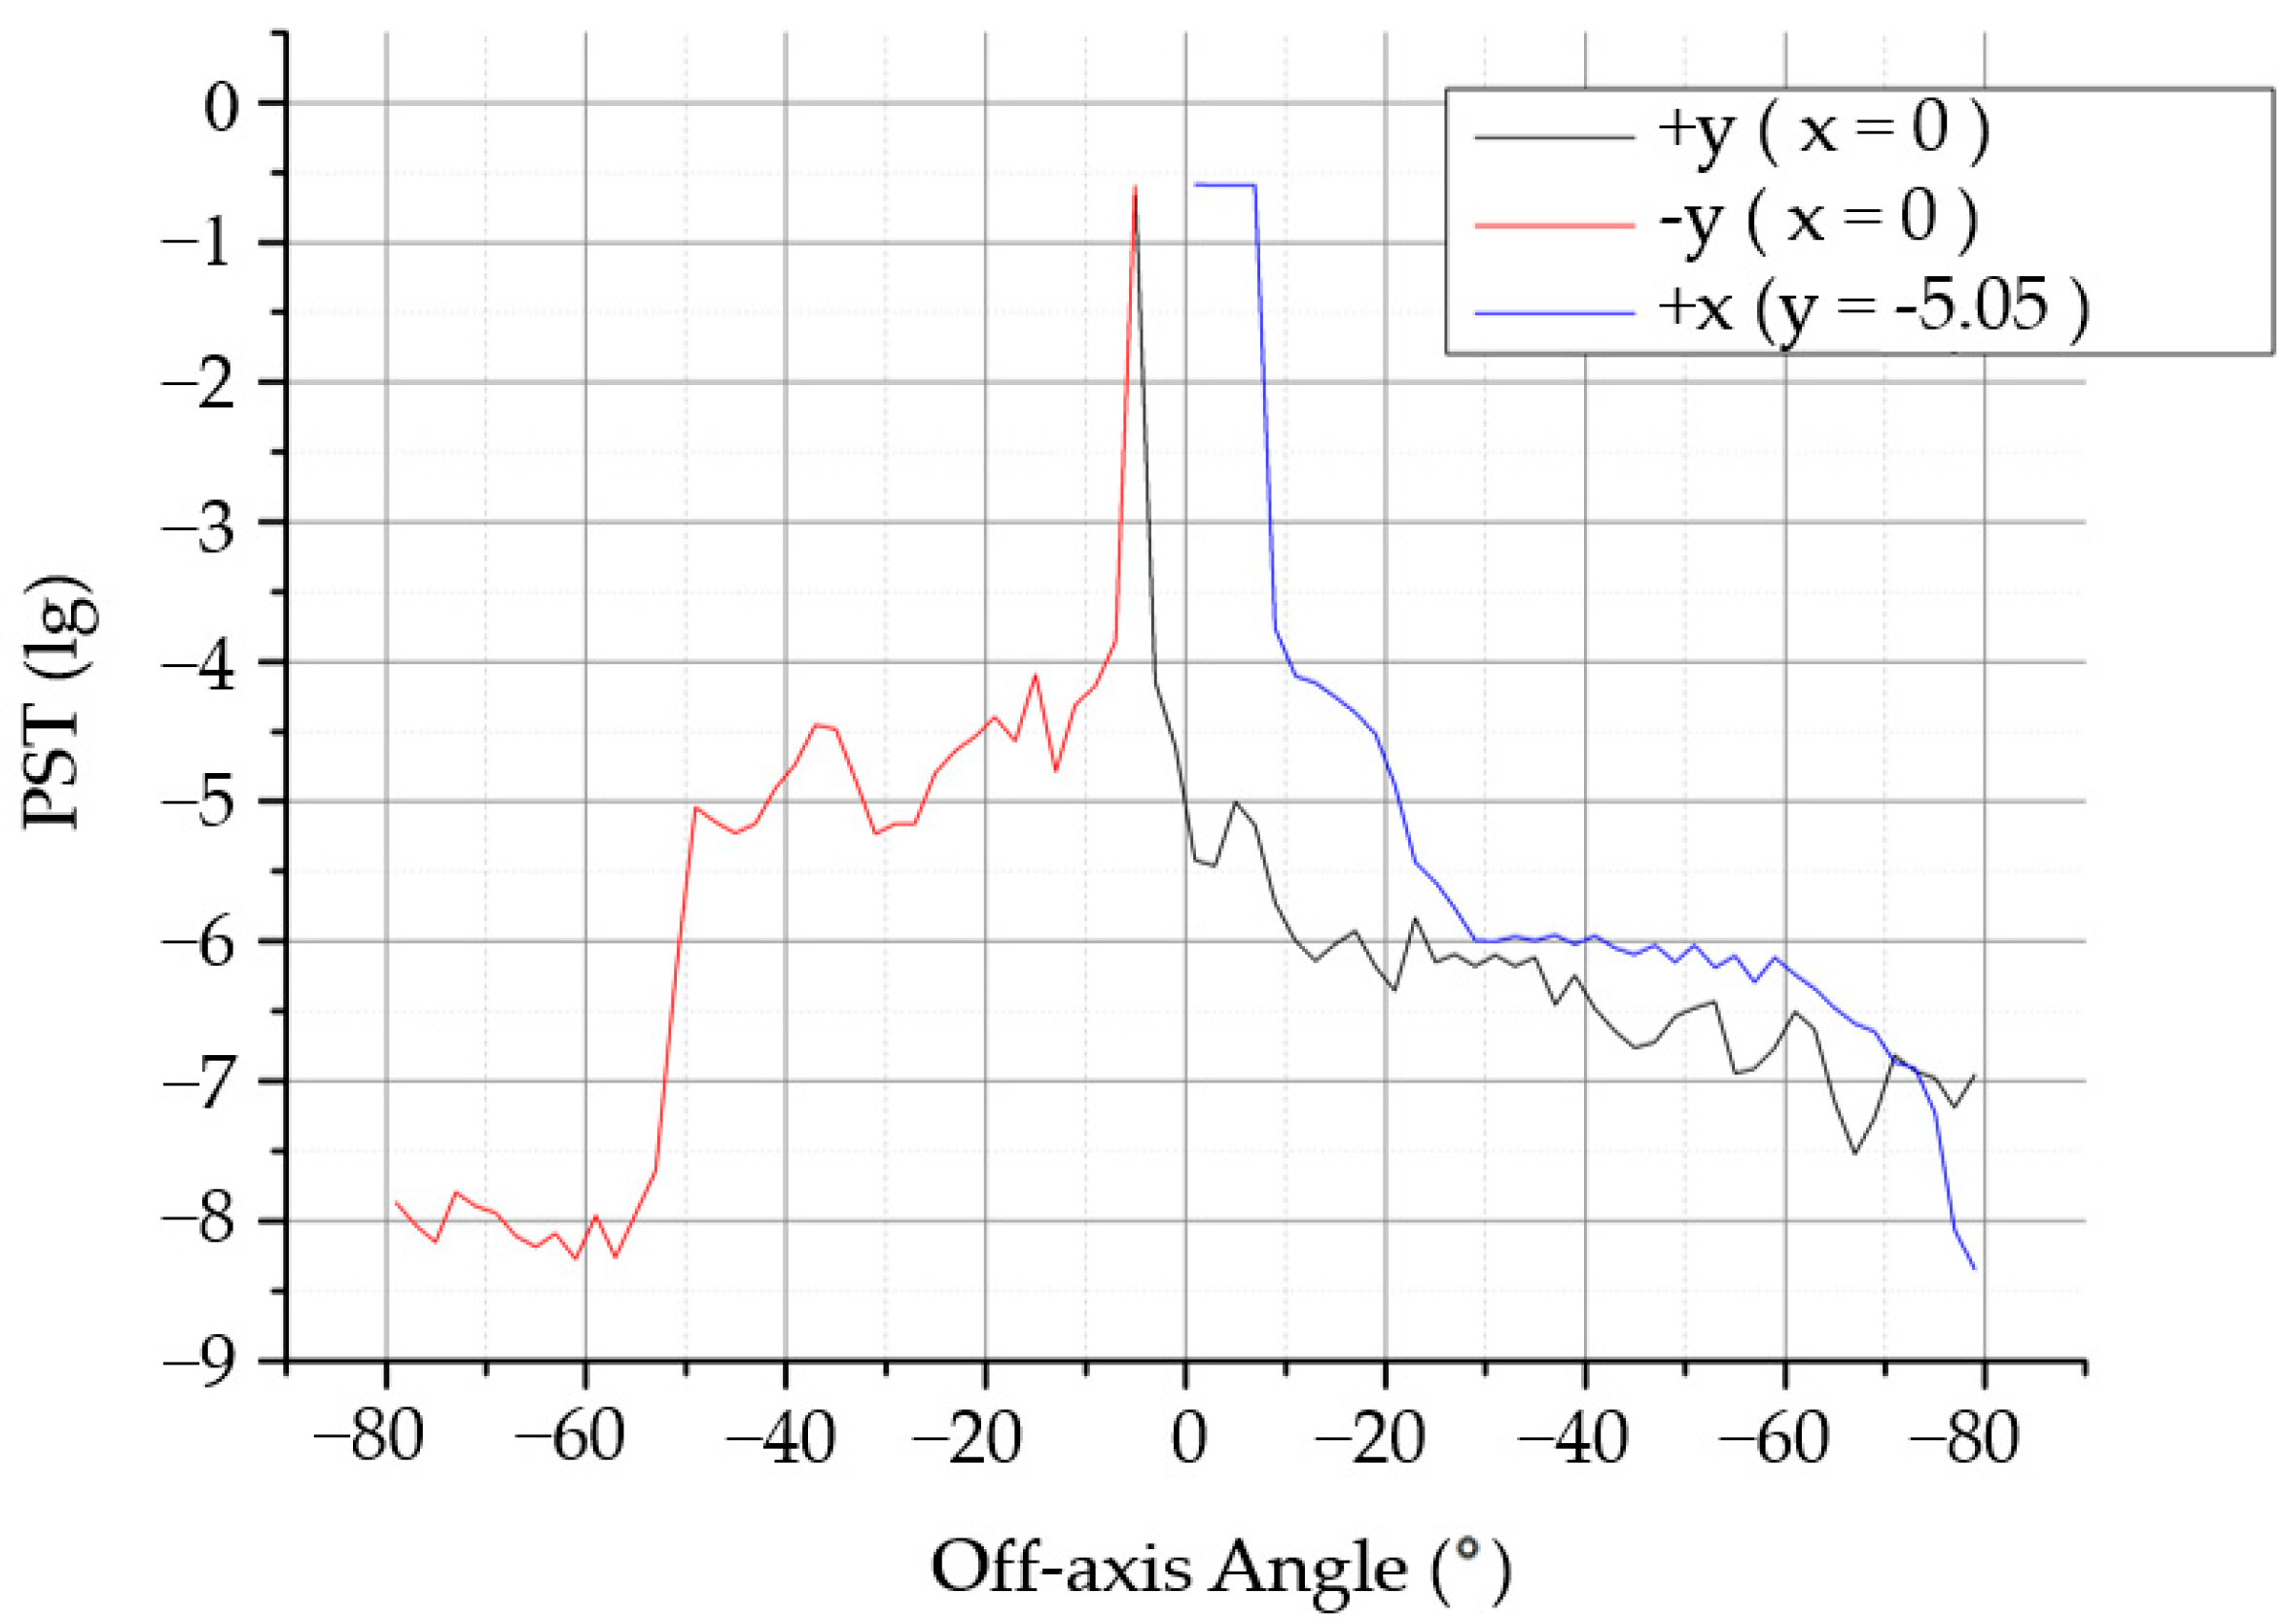
The distribution of the stray light in the image plane outside the field of view was analyzed. When the field of view in the X direction is 0°, the stray light in the Y direction is −5.05~80°, and when the field of view in the Y direction is 5.05°, the stray light in the X direction is 0°–80°. The obtained PST curves are shown in
Figure 8. According to the simulation results, when the off-axis angle was 10°–30°, the PST reached an order of 10
−4, and when the off-axis angle was greater than 30°, the PST reached an order of 10
−5.
The suppression effect of the composite stray-light suppression strategy was evaluated by calculating the stray-light coefficient. The specific method is to establish a certain size of the area of the light source at different positions of the camera’s focal plane. The area light source was a diffuse light source with an exit half angle of 90°. Using the ray tracing method, a receiving surface covering the entire entrance is set at the entrance of the system to receive the total energy that can reach the image surface. This part of the light includes the effective imaging light and stray light incident on the image plane. Receiving surface 2 is set away from the system, and its field of view is the same as that of the corresponding focal plane small pixel to ensure that the received light is effective in imaging light. The number of rays was set to 4 million and the threshold was 10
−8. To comprehensively evaluate the stray-light suppression level in the entire field of view, four different positions on the focal plane were selected for the stray light coefficient calculation. The specific positions and parameter settings are listed in
Table 6.
The analysis and calculation results of VGI at different field positions are listed in
Table 7. In
Table 7, the total light energy refers to the total energy obtained by the detector, while the effective light energy refers to the energy remaining except stray light. As shown in
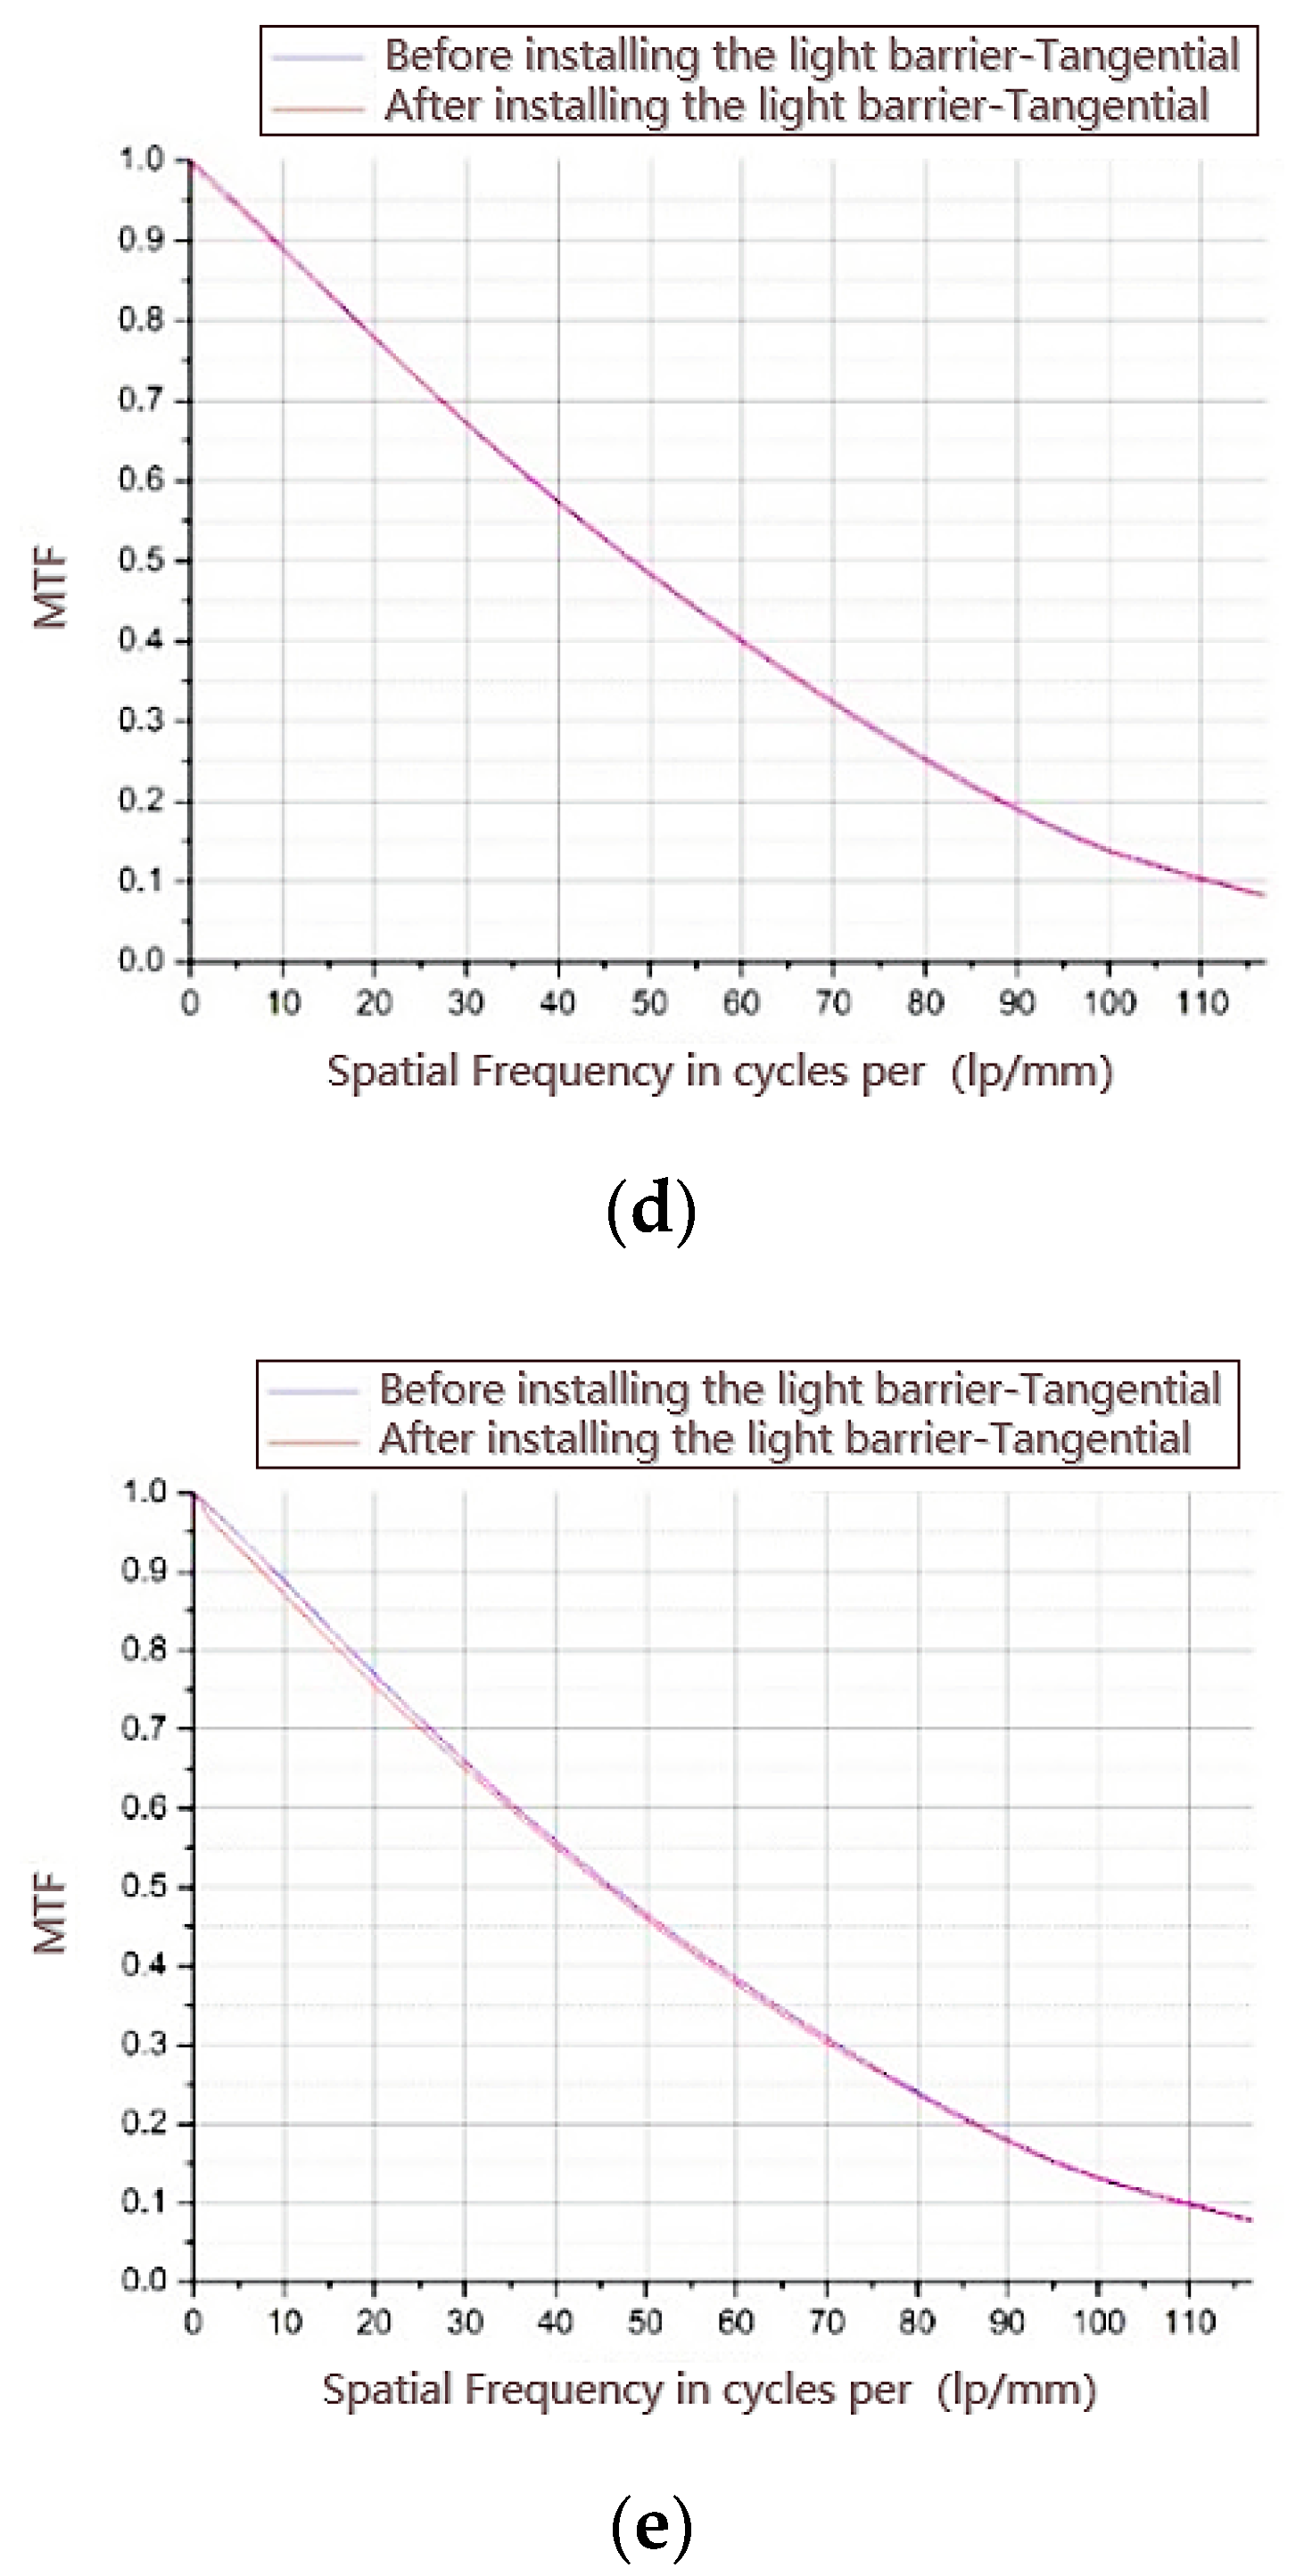
Table 7, the VGI of the system is greater than 4%, and the edge field of view is close to 6%, which effectively suppresses the stray light to a certain extent. The calculation results of the VGI prove that the stray-light suppression strategy proposed in this paper is reliable. To further suppress the stray light, based on the wide adaptability Torrance–Sparrow model, the light barrier of the third mirror was designed to further optimize the composite stray-light suppression strategy proposed in this paper.


