
Measuring Heart Rate Variability Using Facial Video

 ,
,
Abstract
:1. Introduction
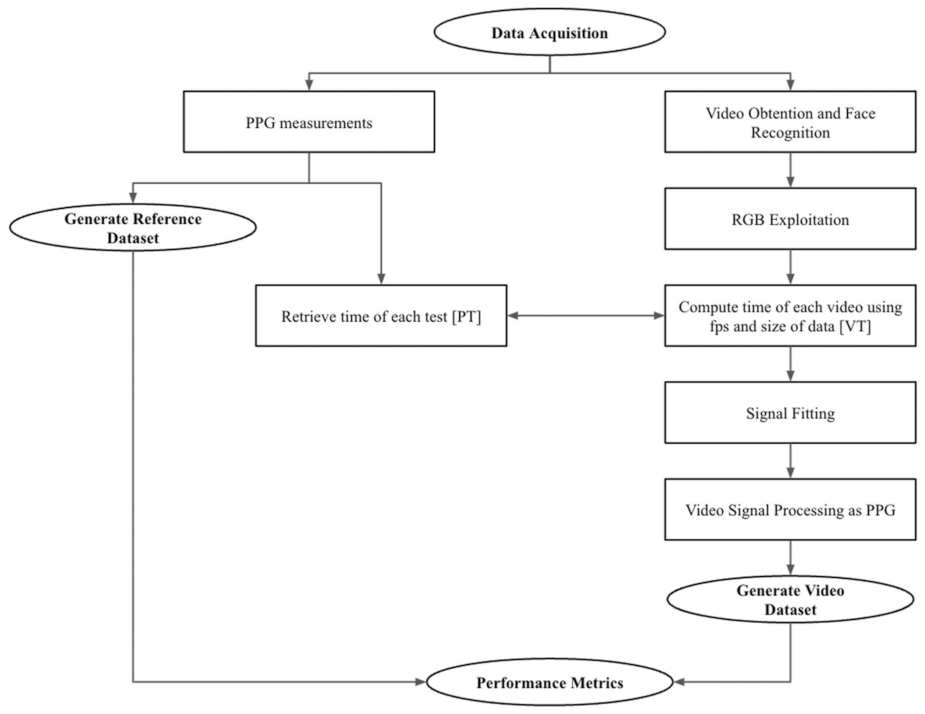
2. Materials and Methods
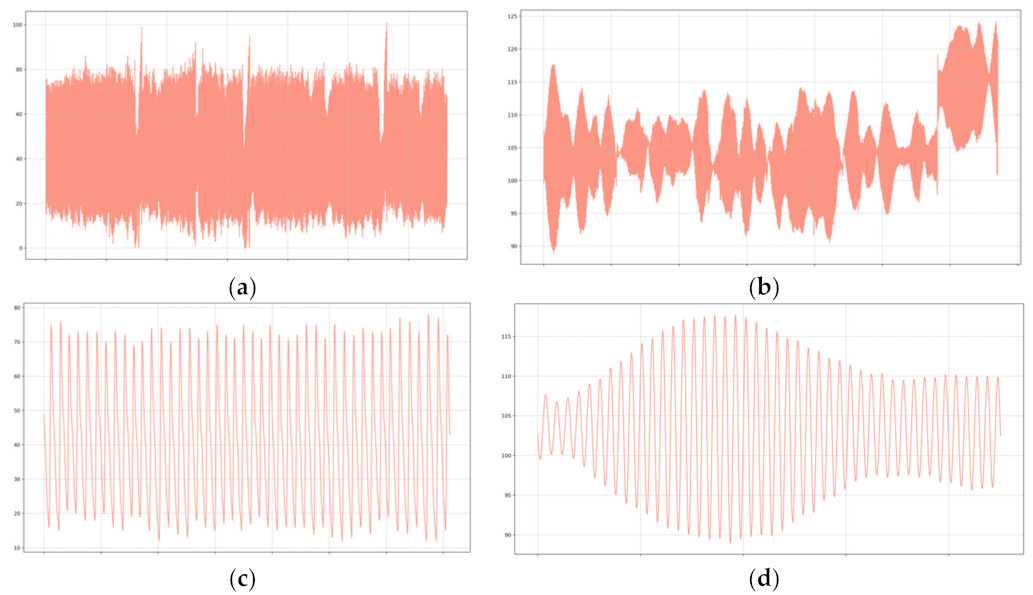
3. Results
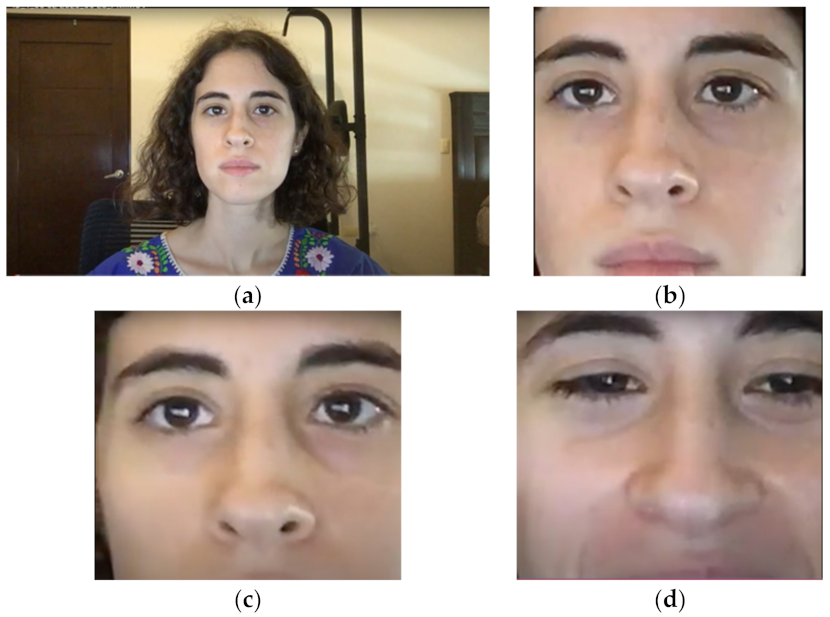
3.1. Face Detection
3.2. Color Augmentation
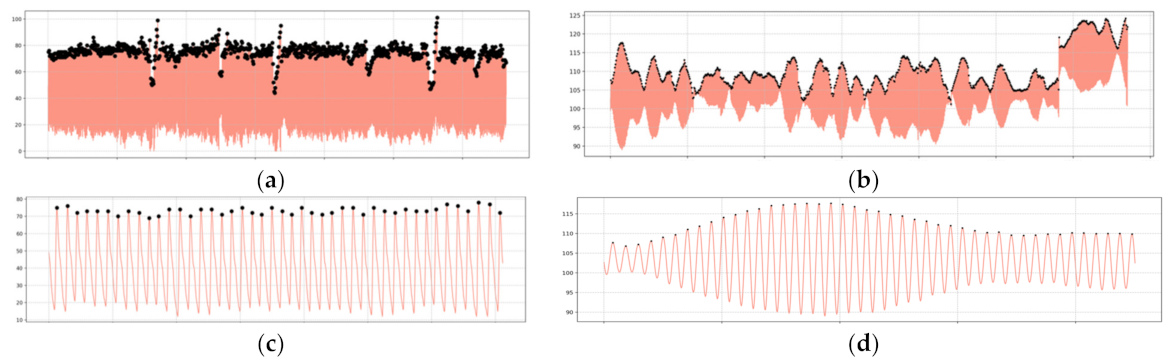
3.3. Peak Detection
3.4. Correlation Analysis
4. Discussion
5. Conclusions
Author Contributions
Funding
Institutional Review Board Statement
Informed Consent Statement
Data Availability Statement
Conflicts of Interest
References
- Thayer, J.F.; Yamamoto, S.S.; Brosschot, J.F. The relationship of autonomic imbalance, heart rate variability and cardiovascular disease risk factors. Int. J. Cardiol. 2010, 141, 122–131. [Google Scholar] [CrossRef] [PubMed]
- Bigger, J.T.; Steinman, R.C.; Rolnitzky, L.M.; Fleiss, J.L.; Albrecht, P.; Cohen, R.J. Power Law Behavior of RR-Interval Variability in Healthy Middle-Aged Persons, Patients With Recent Acute Myocardial Infarction, and Patients With Heart Transplants. Circulation 1996, 93, 2142–2151. [Google Scholar] [CrossRef] [PubMed]
- Malik, M. Task Force of the European Society of Cardiology and the North American Society of Pacing and Electrophysiology, Heart Rate Variability. Circulation 1996, 93, 1043–1065. [Google Scholar] [CrossRef] [Green Version]
- Billman, G.E. Heart Rate Variability? A Historical Perspective. Front. Physiol. 2011, 2, 86. [Google Scholar] [CrossRef] [Green Version]
- Schwartz, M.S.; Andrasik, F. Biofeedback: A Practitioner’s Guide; Guilford Publications: New York, NY, USA, 2017. [Google Scholar]
- Malik, M.; Bigger, J.T.; Camm, A.J.; Kleiger, R.E.; Malliani, A.; Moss, A.J.; Schwartz, P.J. Heart rate variability: Standards of measurement, physiological interpretation, and clinical use. Eur. Heart J. 1996, 17, 354–381. [Google Scholar] [CrossRef] [Green Version]
- Solhjoo, S.; Haigney, M.C.; McBee, E.; Van Merrienboer, J.J.G.; Schuwirth, L.; Artino, A.R., Jr.; Battista, A.; Ratcliffe, T.A.; Lee, H.D.; Durning, S.J. Heart Rate and Heart Rate Variability Correlate with Clinical Reasoning Performance and Self-Reported Measures of Cognitive Load. Sci. Rep. 2019, 9, 14668. [Google Scholar] [CrossRef]
- Yeragani, V.K.; Sobolewski, E.; Kay, J.; Jampala, V.C.; Igel, G. Effect of age on long-term heart rate variability. Cardiovasc. Res. 1997, 35, 35–42. [Google Scholar] [CrossRef] [Green Version]
- Kanters, J.K.; Hojgaard, M.V.; Agner, E.; Holstein-Rathlou, N.-H. Short- and long-term variations in non-linear dynamics of heart rate variability. Cardiovasc. Res. 1996, 31, 400–409. [Google Scholar] [CrossRef]
- Kleiger, R.E.; Miller, J.P.; Bigger, J.T.; Moss, A.J. Decreased heart rate variability and its association with increased mortality after acute myocardial infarction. Am. J. Cardiol. 1987, 59, 256–262. [Google Scholar] [CrossRef]
- Kazmi, S.Z.H.; Zhang, H.; Aziz, W.; Monfredi, O.; Abbas, S.A.; Shah, S.A.; Kazmi, S.S.H.; Butt, W.H. Inverse Correlation between Heart Rate Variability and Heart Rate Demonstrated by Linear and Nonlinear Analysis. PLoS ONE 2016, 11, e0157557. [Google Scholar] [CrossRef] [Green Version]
- Moco, A.V.; Stuijk, S.; de Haan, G. Ballistocardiographic Artifacts in PPG Imaging. IEEE Trans. Biomed. Eng. 2016, 63, 1804–1811. [Google Scholar] [CrossRef] [PubMed] [Green Version]
- Kumar, M.; Veeraraghavan, A.; Sabharwal, A. DistancePPG: Robust non-contact vital signs monitoring using a camera. Biomed. Opt. Express 2015, 6, 1565. [Google Scholar] [CrossRef] [PubMed] [Green Version]
- Poh, M.-Z.; McDuff, D.J.; Picard, R.W. Non-contact, automated cardiac pulse measurements using video imaging and blind source separation. Opt. Express 2010, 18, 10762. [Google Scholar] [CrossRef] [PubMed]
- Lewandowska, M.; Rumiński, J.; Kocejko, T.; Nowak, J. Measuring pulse rate with a webcam—A non-contact method for evaluating cardiac activity. In Proceedings of the 2011 Federated Conference on Computer Science and Information Systems (FedCSIS), Szczecin, Poland, 18–21 September 2011; pp. 405–410. [Google Scholar]
- Poh, M.-Z.; McDuff, D.J.; Picard, R.W. Advancements in Noncontact, Multiparameter Physiological Measurements Using a Webcam. IEEE Trans. Biomed. Eng. 2011, 58, 7–11. [Google Scholar] [CrossRef] [PubMed] [Green Version]
- de Haan, G.; van Leest, A. Improved motion robustness of remote-PPG by using the blood volume pulse signature. Physiol. Meas. 2014, 35, 1913–1926. [Google Scholar] [CrossRef] [PubMed]
- Haque, M.A.; Irani, R.; Nasrollahi, K.; Moeslund, T.B. Heartbeat Rate Measurement from Facial Video. IEEE Intell. Syst. 2016, 31, 40–48. [Google Scholar] [CrossRef] [Green Version]
- Tran, B.X.; Latkin, C.A.; Vu, G.T.; Nguyen, H.L.T.; Nghiem, S.; Tan, M.-X.; Lim, Z.-K.; Ho, C.S.; Ho, R.C. The Current Research Landscape of the Application of Artificial Intelligence in Managing Cerebrovascular and Heart Diseases: A Bibliometric and Content Analysis. Int. J. Environ. Res. Public Health 2019, 16, 2699. [Google Scholar] [CrossRef] [Green Version]
- Ahsan, M.M.; Luna, S.A.; Siddique, Z. Machine-Learning-Based Disease Diagnosis: A Comprehensive Review. Healthcare 2022, 10, 541. [Google Scholar] [CrossRef]
- Balogh, E.P.; Miller, B.T.; Ball, J.R. Improving Diagnosis in Health Care; The National Academies Press: Washington, DC, USA, 2015. [Google Scholar] [CrossRef]
- Umer, M.; Sadiq, S.; Karamti, H.; Karamti, W.; Majeed, R.; Nappi, M. IoT Based Smart Monitoring of Patients’ with Acute Heart Failure. Sensors 2022, 22, 2431. [Google Scholar] [CrossRef]
- Guzman, L.; Cazares, A.M.G.; Martinez-Torteya, A. Model for Glycemic Level Detection using Heart Rate Variability in a Mexican Sample. In Proceedings of the 2020 IEEE-EMBS Conference on Biomedical Engineering and Sciences (IECBES), Langkawi Island, Malaysia, 1–3 March 2021; pp. 505–510. [Google Scholar] [CrossRef]
- Shaffer, F.; Ginsberg, J.P. An Overview of Heart Rate Variability Metrics and Norms. Front. Public Health 2017, 5, 258. [Google Scholar] [CrossRef] [Green Version]
- Verkruysse, W.; Svaasand, L.O.; Nelson, J.S. Remote plethysmographic imaging using ambient light. Opt. Express 2008, 16, 21434. [Google Scholar] [CrossRef] [Green Version]
- Gomes, P.; Margaritoff, P.; Silva, H. pyHRV: Development and evaluation of an open-source python toolbox for heart rate variability (HRV). In Proceedings of the International Conference on Electrical, Electronic and Computing Engineering (Icetran), Veliko Gradište, Serbia, 3–6 June 2019; pp. 822–828. [Google Scholar]
- Padilla, R.; Filho, C.F.F.C.; Costa, M.G.F. Evaluation of haar cascade classifiers designed for face detection. World Acad. Sci. Eng. Technol. 2012, 64, 362–365. [Google Scholar]
- Wu, H.-Y.; Rubinstein, M.; Shih, E.; Guttag, J.; Durand, F.; Freeman, W. Eulerian video magnification for revealing subtle changes in the world. ACM Trans. Graph. 2012, 31, 1–8. [Google Scholar] [CrossRef]
- Feng, L.; Po, L.; Xu, X.; Li, Y.; Ma, R. Motion-Resistant Remote Imaging Photoplethysmography Based on the Optical Properties of Skin. IEEE Trans. Circuits Syst. Video Technol. 2015, 25, 879–891. [Google Scholar] [CrossRef]
- Hassan, M.; Malik, A.; Fofi, D.; Saad, N.; Karasfi, B.; Ali, Y.; Meriaudeau, F. Heart rate estimation using facial video: A review. Biomed. Signal Processing Control 2017, 38, 346–360. [Google Scholar] [CrossRef]
- Hsu, G.-S.J.; Xie, R.-C.; Ambikapathi, A.; Chou, K.-J. A deep learning framework for heart rate estimation from facial videos. Neurocomputing 2020, 417, 155–166. [Google Scholar] [CrossRef]
- Song, R.; Zhang, S.; Li, C.; Zhang, Y.; Cheng, J.; Chen, X. Heart Rate Estimation From Facial Videos Using a Spatiotemporal Representation With Convolutional Neural Networks. IEEE Trans. Instrum. Meas. 2020, 69, 7411–7421. [Google Scholar] [CrossRef]
- Pagano, T.P.; Ortega, L.L.; Santos, V.R.; Bonfim, Y.d.; Paranhos, J.V.D.; Sá, P.H.M.; Nascimento, L.F.S.; Winkler, I.; Nascimento, E.G.S. Machine Learning Models and Videos of Facial Regions for Estimating Heart Rate: A Review on Patents, Datasets, and Literature. Electronics 2022, 11, 1473. [Google Scholar] [CrossRef]
- Li, X.; Chen, J.; Zhao, G.; Pietikainen, M. Remote Heart Rate Measurement from Face Videos under Realistic Situations. In Proceedings of the 2014 IEEE Conference on Computer Vision and Pattern Recognition, Columbus, OH, USA, 23–28 June 2014; pp. 4264–4271. [Google Scholar] [CrossRef]
- Lam, A.; Kuno, Y. Robust Heart Rate Measurement from Video Using Select Random Patches. In Proceedings of the 2015 IEEE International Conference on Computer Vision (ICCV), Santiago, Chile, 7–13 December 2015; pp. 3640–3648. [Google Scholar] [CrossRef]
- Same, M.H.; Gandubert, G.; Gleeton, G.; Ivanov, P.; Landry, R. Simplified welch algorithm for spectrum monitoring. Appl. Sci. 2021, 11, 86. [Google Scholar] [CrossRef]
- Krafty, R.T.; Zhao, M.; Buysse, D.J.; Thayer, J.F.; Hall, M. Nonparametric spectral analysis of heart rate variability through penalized sum of squares. Stat. Med. 2014, 33, 1383–1394. [Google Scholar] [CrossRef] [Green Version]
- Fukunishi, M.; Mcduff, D.; Tsumura, N. Improvements in remote video based estimation of heart rate variability using the Welch FFT method. Artif. Life Robot. 2018, 23, 15–22. [Google Scholar] [CrossRef]
- Boardman, A.; Schlindwein, F.S.; Rocha, A.P. A study on the optimum order of autoregressive models for heart rate variability. Physiol. Meas. 2002, 23, 325. [Google Scholar] [CrossRef] [PubMed]
- Merri, M.; Farden, D.C.; Mottley, J.G.; Titlebaum, E.L. Sampling frequency of the electrocardiogram for spectral analysis of the heart rate variability. IEEE Trans. Biomed. Eng. 1990, 37, 99–106. [Google Scholar] [CrossRef] [PubMed]
- Brennan, M.; Palaniswami, M.; Kamen, P. Poincare plot interpretation using a physiological model of HRV based on a network of oscillators. Am. J. Physiol.-Heart Circ. Physiol. 2002, 283, H1873–H1886. [Google Scholar] [CrossRef] [PubMed] [Green Version]
- Tayel, M.B.; AlSaba, E.I. Poincaré plot for heart rate variability. Int. J. Biomed. Biol. Eng. 2015, 9, 708–711. [Google Scholar]
- Sacha, J.; Pluta, W. Alterations of an average heart rate change heart rate variability due to mathematical reasons. Int. J. Cardiol. 2008, 128, 444–447. [Google Scholar] [CrossRef]
- Kazmi, S.A.; Shah, M.H.; Khan, S.; Khalifa, O.O.; Muzammil, M. Poincare based PPG signal analysis for varying physiological states. In Proceedings of the 2016 International Conference on Intelligent Systems Engineering (ICISE), Islamabad, Pakistan, 15–17 January 2016; pp. 105–110. [Google Scholar] [CrossRef]
- Dendi, S.V.R.; Channappayya, S.S. No-Reference Video Quality Assessment Using Natural Spatiotemporal Scene Statistics. IEEE Trans. Image Processing 2020, 29, 5612–5624. [Google Scholar] [CrossRef]
- Zhou, W.; Chen, Z. Deep Local and Global Spatiotemporal Feature Aggregation for Blind Video Quality Assessment. In Proceedings of the 2020 IEEE International Conference on Visual Communications and Image Processing (VCIP), Macau, China, 1–4 December 2020; pp. 338–341. [Google Scholar] [CrossRef]


| Me (bpm) | SD (bpm) | RMSE (bpm) |
|---|---|---|
| 0.8084 | 7.7758 | 1.0971 |
| Minute Interval | Me in bpm (SD) |
|---|---|
| 0:00–0:59 | 2.5308 (3.5017) |
| 1:00–1:59 | 2.0444 (2.2049) |
| 2:00–2:59 | 1.7841 (1.7617) |
| 3:00–3:59 | 1.9370 (2.1008) |
| 4:00–4:59 | 1.6222 (1.4815) |
| 5:00–5:59 | 1.6500 (1.4966) |
| 6:00–6:59 | 1.6667 (1.7965) |
| 7:00–7:59 | 1.5333 (1.8165) |
| 8:00–8:59 | 1.8667 (1.5609) |
| 9:00–9:59 | 1.9333 (2.0158) |
| Feature | Method | r | q-Value |
|---|---|---|---|
| Heart Rate | Time-domain | 0.991 | 2.71 × 10⁻³⁴ |
| Mean NN Interval | Time-domain | 0.990 | 1.85 × 10⁻³³ |
| NN Interval Count | Time-domain | 0.955 | 4.44 × 10⁻²¹ |
| Logarithmic VL Frequency Power | Frequency-domain (autoregressive) | 0.653 | 3.57 × 10⁻⁵ |
| Absolute VL Frequency Power | Frequency-domain (autoregressive) | 0.652 | 3.57 × 10⁻⁵ |
| Feature | Method | r | q-Value |
|---|---|---|---|
| Heart Rate | Time-domain | 0.934 | 5.09 × 10⁻¹⁶ |
| Mean NN Interval | Time-domain | 0.919 | 8.18 × 10⁻¹⁶ |
| NN Interval Count | Time-domain | 0.879 | 1.44 × 10⁻¹⁴ |
| Logarithmic VL Frequency Power | Frequency-domain (autoregressive) | 0.507 | 3.93 × 10⁻⁵ |
| Absolute VL Frequency Power | Frequency-domain (autoregressive) | 0.507 | 3.93 × 10⁻⁵ |
| Feature | Method | r | q-Value |
|---|---|---|---|
| Heart Rate | Time-domain | 0.990 | 8.27 × 10⁻³⁴ |
| Mean NN Interval | Time-domain | 0.987 | 2.55 × 10⁻³¹ |
| NN Interval Count | Time-domain | 0.962 | 1.43 × 10⁻²² |
| Logarithmic VL Frequency Power | Frequency-domain (autoregressive) | 0.624 | 1.21 × 10⁻⁴ |
| Absolute VL Frequency Power | Frequency-domain (autoregressive) | 0.624 | 1.21 × 10⁻⁴ |
| # of Feature | Feature |
|---|---|
| 1 | Heart Rate |
| 2 | Root Mean Square of Successive NN Interval Differences |
| 3 | SD of NN intervals |
| 4 | Percentage of Successive NN Intervals that differ by more than 20 ms |
| 5 | Successive NN Intervals that differ by more than 50 ms |
| 6 | NN interval count |
| 7 | Minimum NN interval |
| 8 | Mean NN interval |
| 9 | Mean Difference of Successive NN intervals |
| # of Feature | Feature |
|---|---|
| 1 | Peak VL Frequency Power |
| 2 | Absolute VL Frequency Power |
| 3 | Relative VL Frequency Power |
| 4 | Logarithmic VL Frequency Power |
| 5 | Absolute L Frequency Power |
| 6 | Logarithmic L Frequency Power |
| 7 | Logarithmic H Frequency Power |
| # of Feature | Feature |
|---|---|
| 1 | Absolute VL Frequency Power |
| 2 | Relative VL Frequency Power |
| 3 | Logarithmic VL Frequency Power |
| 4 | Logarithmic L Frequency Power |
| 5 | Absolute L Frequency Power |
| 6 | Absolute H Frequency Power |
| 7 | Relative H Frequency Power |
| 8 | Logarithmic H Frequency Power |
| # of Feature | Feature |
|---|---|
| 1 | Peak VL Frequency Power |
| 2 | Absolute VL Frequency Power |
| 3 | Relative VL Frequency Power |
| 4 | Logarithmic L Frequency Power |
| 5 | Absolute L Frequency Power |
| 6 | Absolute H Frequency Power |
| 7 | Relative H Frequency Power |
| 8 | Logarithmic H Frequency Power |
| 9 | Peak H Frequency Power |
| # of Feature | Feature |
|---|---|
| 1 | SD perpendicular to the line of identity (SD1) |
| 2 | SD along the line of identity (SD2) |
| 3 | SD1 to SD2 ratio |
| Citation | Me in bpm (SD) | RMSE (bpm) |
|---|---|---|
| Li et al., 2014 [34] | 7.14 (9.53) | 12.47 |
| Lam et al., 2015 [35] | 6.49 (8.54) | 10.34 |
| Feng et al., 2015 [29] | 6.64 (8.01) | 10.12 |
| Haque et al., 2016 [18] | 4.69 (3.43) | 5.96 |
| Song et al., 2020 [32] | 5.98 (7.31) | 7.45 |
| Hsu et al., 2020 [31] | −2.07 (4.23) | 3.08 |
| Proposed | 0.81 (7.77) | 1.10 |
Publisher’s Note: MDPI stays neutral with regard to jurisdictional claims in published maps and institutional affiliations. |
© 2022 by the authors. Licensee MDPI, Basel, Switzerland. This article is an open access article distributed under the terms and conditions of the Creative Commons Attribution (CC BY) license (https://creativecommons.org/licenses/by/4.0/).
Share and Cite
Martinez-Delgado, G.H.; Correa-Balan, A.J.; May-Chan, J.A.; Parra-Elizondo, C.E.; Guzman-Rangel, L.A.; Martinez-Torteya, A. Measuring Heart Rate Variability Using Facial Video. Sensors 2022, 22, 4690. https://doi.org/10.3390/s22134690
Martinez-Delgado GH, Correa-Balan AJ, May-Chan JA, Parra-Elizondo CE, Guzman-Rangel LA, Martinez-Torteya A. Measuring Heart Rate Variability Using Facial Video. Sensors. 2022; 22(13):4690. https://doi.org/10.3390/s22134690
Chicago/Turabian StyleMartinez-Delgado, Gerardo H., Alfredo J. Correa-Balan, José A. May-Chan, Carlos E. Parra-Elizondo, Luis A. Guzman-Rangel, and Antonio Martinez-Torteya. 2022. "Measuring Heart Rate Variability Using Facial Video" Sensors 22, no. 13: 4690. https://doi.org/10.3390/s22134690
APA StyleMartinez-Delgado, G. H., Correa-Balan, A. J., May-Chan, J. A., Parra-Elizondo, C. E., Guzman-Rangel, L. A., & Martinez-Torteya, A. (2022). Measuring Heart Rate Variability Using Facial Video. Sensors, 22(13), 4690. https://doi.org/10.3390/s22134690