1. Introduction
The convergence services in the actual market increase the demand for more frequent resources of the radioelectric spectrum due to emerging new technologies. The methods for spectrum allocation lead us to inefficient use of the spectrum, and the frequency bands are assigned to a specific application to primary licensed users [
1]. The mobile cognitive radio network (MCRN) seems to be an alternative solution for better spectrum utilization by using the spectrum holes to transmit the secondary signals, making better use of the spectrum [
2].
The first process in the MCRN is to sense the spectrum to guarantee that the spectrum will be used for the secondary user (SU) just in the case that the primary user (PU) is not using it [
3]. Spectrum sensing techniques send the sensing information to the detection algorithm to obtain a decision about the PU presence. One of the most used techniques is energy detection, a faster method to detect signals damaged by Gaussian noise [
4] that does not need previous knowledge of the signal; this is important because modulation techniques are changing constantly in MCRN [
5].
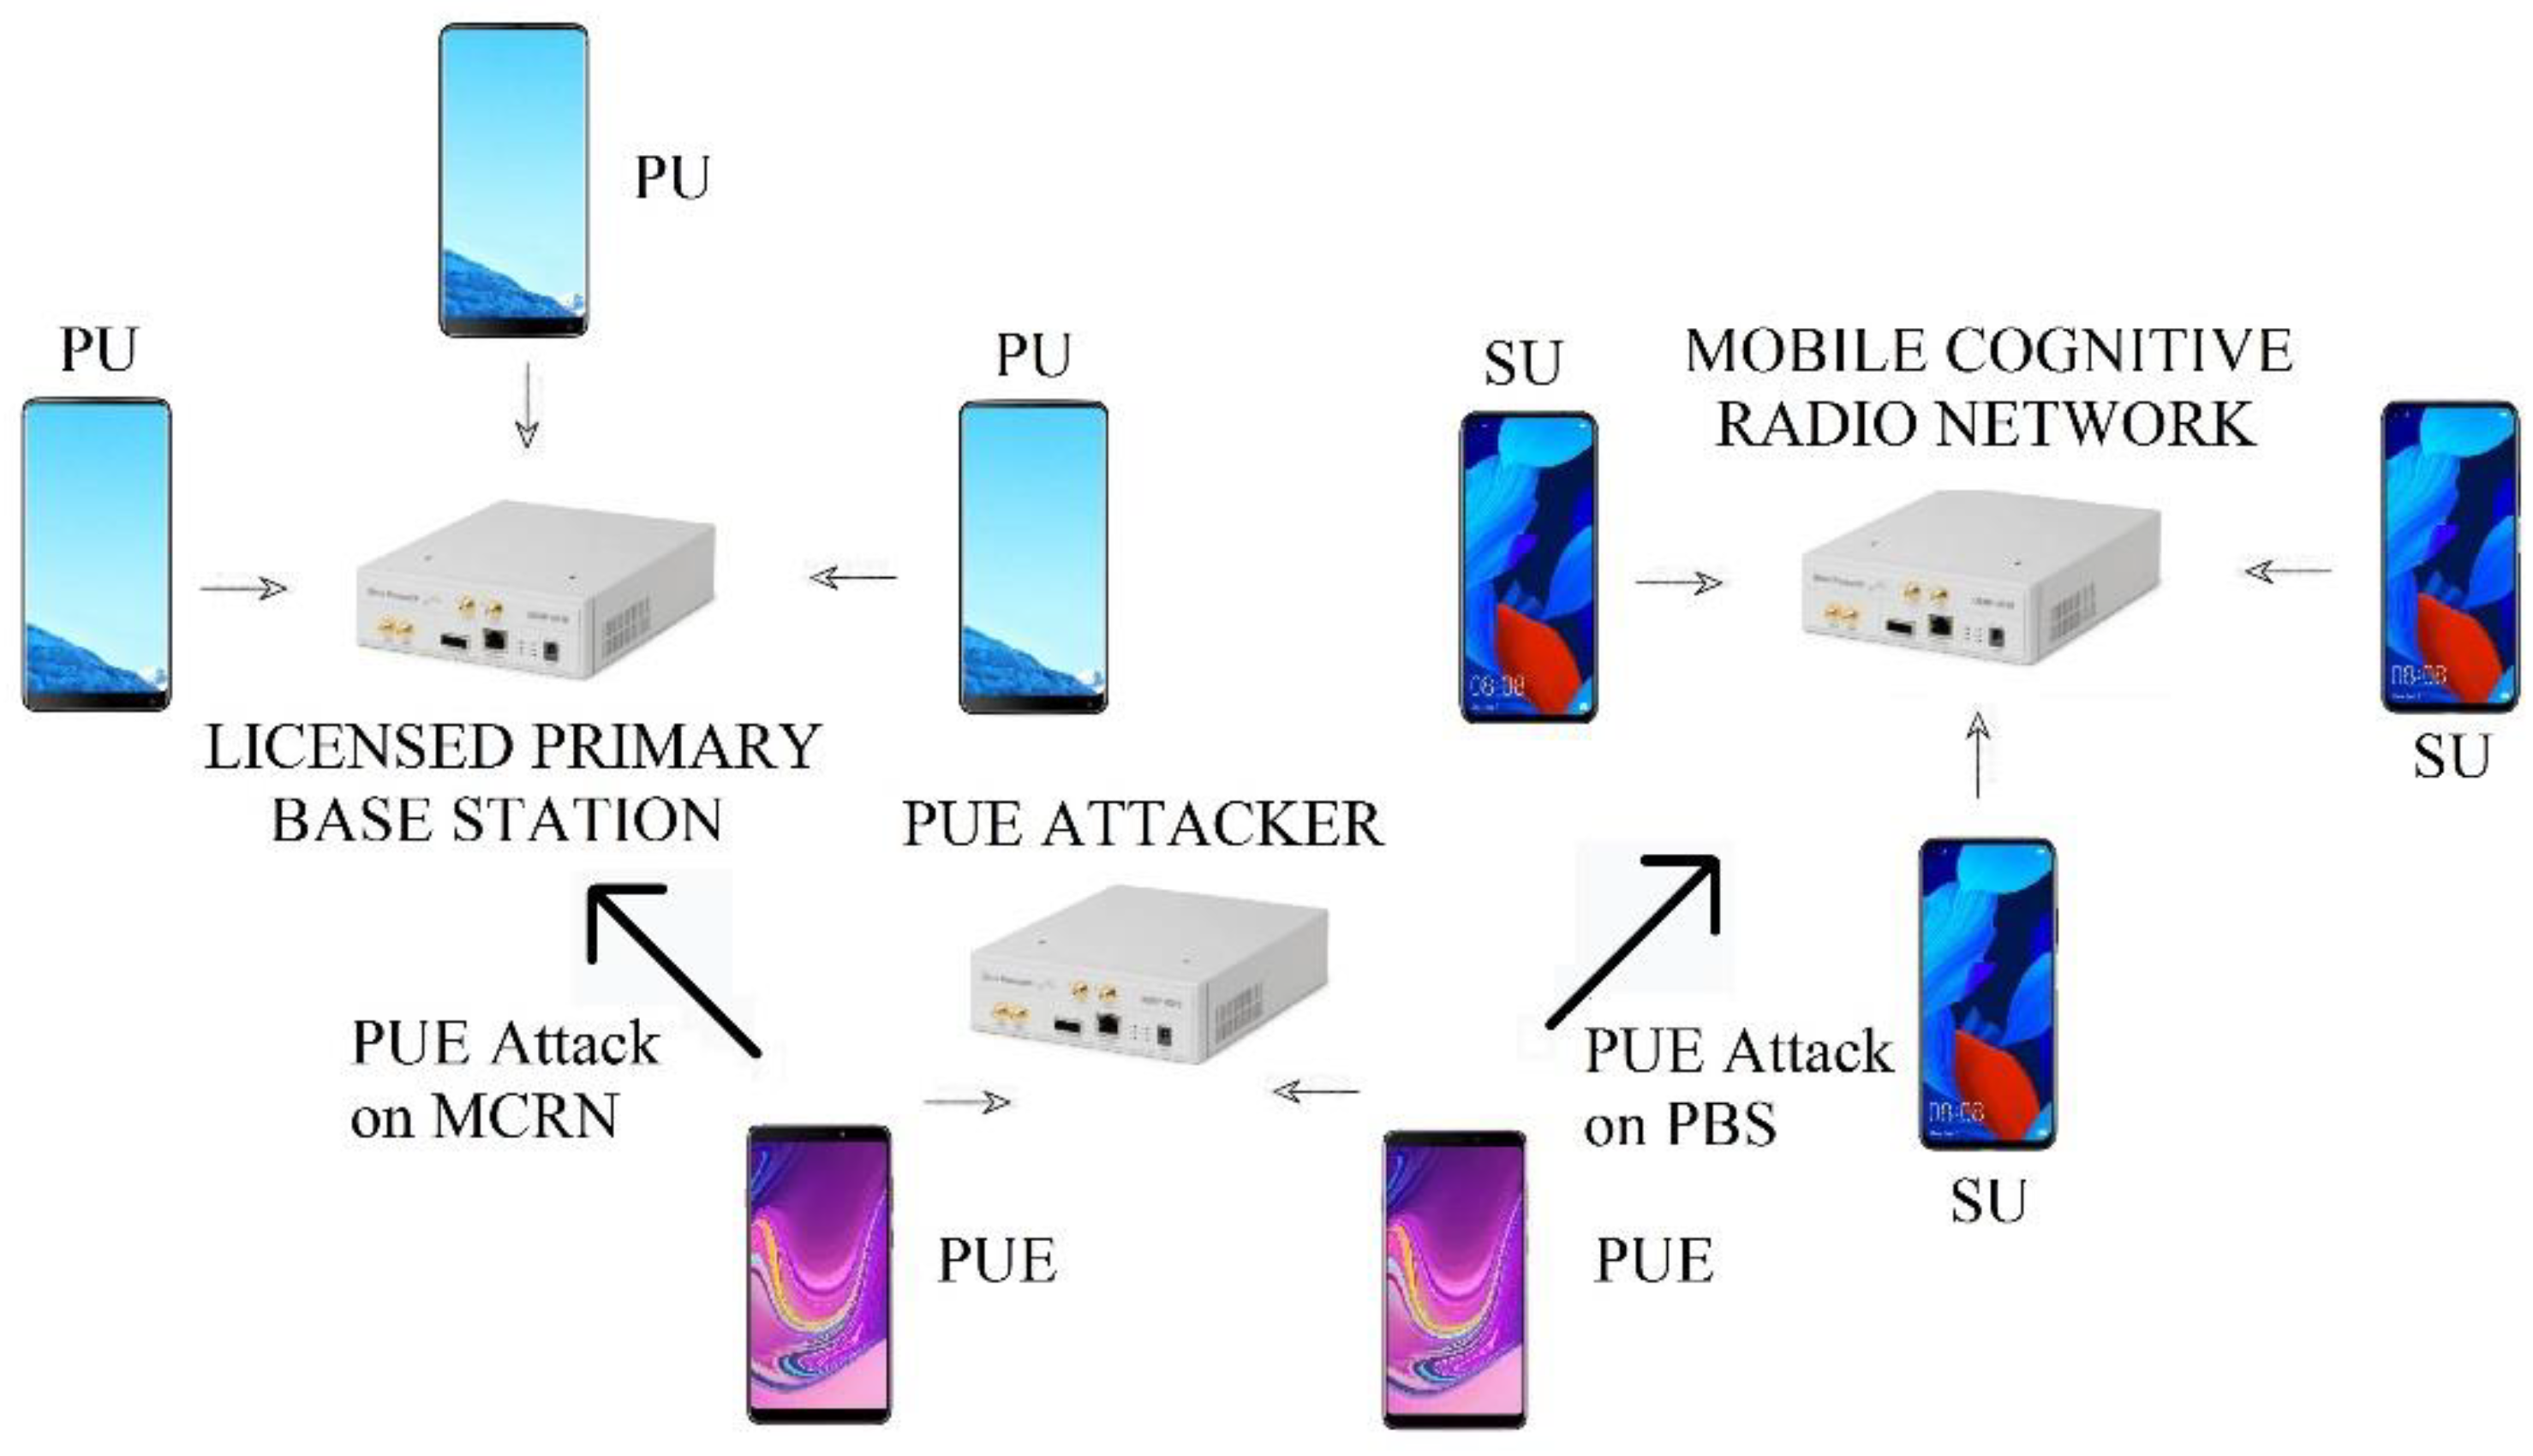
In this spectrum sensing process, a common type of attack that affects the performance of the MCRN is the primary user emulation (PUE). In this attack, a PUE attempts to mimic a PU transmission to obtain access to a specific frequency band by injecting a false PU signal in the specific frequency selected to make other SUs release their spectrum frequency [
6]. The impact of PUE is high because it causes interference to the primary and cognitive network, underutilization of the spectrum, denial of service, and user disconnection secondary, among other factors [
7].
In MCRN, the PU is the licensed user of the 4G/5G network, and the operator must secure the PU connection when it is needed. The essence of the MCRN is not interfering with the PU signal, which is why the cognitive system detects the presence of the PU to avoid the use of its frequency [
3]. On the other hand, the PUE attacker is a malicious SU that imitates the PU signal and characteristics so that the MCRN recognizes it as a PU and obtains access to the frequency channel and prevents other SU from using the channel. PUE detection takes relevance to avoid PU interference and to identify a real SU of the MCRN [
8].
One way used to detect the PUE is to estimate the modulation type of the received signal. The system throws a learning process to classify a PU as a signal that has some modulation type, for example, binary phase shift keying (BPSK). If the modulation is different, the signal is marked as PUE [
9]. If the signal is based on 4G and 5G networks, several modulation schemes can be used, such as time division multiple access (TDMA) or orthogonal frequency division multiple access (OFDMA), and with the knowledge of its patterns, detection systems can recognize them. However, in an MCRN, the signals are random variables that change over time, which is why detection systems based on prior information, such as modulation type, can increase the probability of false alarm probability and decrease the probability of PUE detection [
10].
Some authors translate the signals and analyze them in the frequency domain. With these changes, the entropy can be used to detect PU. Another advantage is that the detectors are less sensitive to noise, and the probability of detection increases. Some authors have used Shannon entropy to detect these signals, and it shows better results in terms of lower SNR signals [
10,
11].
In the literature, several PUE detection techniques have been proposed that are based on localization, position, statistical analysis, and physical layer variables. In techniques that try to find the localization or the position of the users, the transmission properties are used to identify them, for example, by using the received signal strength (RSS) indicator that shows us the received power. Another statistical approach is used to find patterns in the signal characteristics. The received signal can be used to extract some characteristics as an input for the system, including the RSS, time of the spectrum occupancy, and the interframe time, among others [
6].
As a complement, machine learning techniques have been used for telecommunication applications in areas such as security, data classification, and outlier detection. In [
12], the authors use a decision tree and SVM to detect an attack called denial of service in emergent networks such as the software-defined network (SDN). In [
13], the authors show the potential of machine learning to increase the performance of the intrusion detection system by using a classification method based on judgment feedback. In [
14], machine learning was used to detect outliers in the Internet of Things and wireless sensor networks, showing the possibilities and versatility of these techniques.
In this paper, we propose using machine learning techniques such as random forest, SVM, and KNN to detect PUEs in MCRNs by using a previous learning process that allows us to establish a database of parameters such as the SNR and Shannon entropy of the received power signal. In this method, there is no need to recognize the modulation type or any RF characteristics a priori. We also implemented the system in SDR devices, allowing us to obtain experimental results of the MCRN with real phones connected to the network, and a PUE implemented in another SDR, allowing us to contrast the theory and simulations of the network environment. The combination of energy and entropy detectors increases the probability of detection of the PUE in a lower SNR with a low increase in the computational complexity and detection time.
The implemented machine learning techniques are used to classify and detect whether the received signal at a specific frequency comes from a PU or an SU identifying the PUE with a high probability of detection above 90%. This solution increases the probability of detection of a single energy or entropy detection system and shows us the results of the three methods for MCRN signals in theory, simulation, and the SDR environment.
The paper is organized as follows.
Section 2 illustrates the previous work and contributions;
Section 3, the machine learning detection scheme;
Section 4 focuses on experiments in SDR;
Section 5 shows the results and discussions; and
Section 6 shows the conclusions.
2. Previous Work
Spectrum sensing is the main feature of the MCRN, and it helps to avoid interference between the PU and SU [
15]. It is found in the literature that the most commonly used technique for spectrum sensing in cognitive radio networks (CRNs) is energy detection because its computational requirements are low. The power signal of the sensor center at a specific frequency is measured, and then the energy is calculated. Due to the noise of the environment and several SNR values, it is important to define or calculate a threshold that allows the detector to decide if a signal is noise or PU [
16].
If we analyze that the PU is in movement in the MCRN, the SU power is changing according to its relative position from the PU. One way is to use dynamic-matching-based spectrum detection (DMBSD), which works better with a dynamic threshold and can sense data and make final sensing results, allowing an increase in the probability of detection while decreasing the false alarm probability by using a dynamic threshold and dynamic matching correlation-based sensing [
17].
Another technique is cyclostationary feature detection (CFD), where the primary signal is filtered by finding the periodicity in the power signal. Signals such as sine waves are the carriers in the modulated signals, and the noise signal is not periodic, so it can be distinguished from the PU signal. The spectral and cyclic correlation functions are used instead of the power spectral density for finding PU. It is also compared with a fixed threshold to detect the PU presence but requires previous information on the transmitted signals [
18].
Matched filter detection (MFD) is also used to find the PU presence in an additive white Gaussian noise (AWGN) channel, where it previously knows the parameters of a transmitted signal. The PU signal is passed through a filter, and a throw coherent method correlates the signal with the response of the matched filter. It requires knowing the modulation type and other information for the measurement [
18].
In general, the spectrum sensing techniques used for PUE detection, can be divided in centralized and distributed, depending on the number of sensors available and the MCRN architecture [
19]. Distributed schemes do not need a central entity; each node sends its sensing information to the sensors around it to make a decision based on the information received and its detection. It only needs to send information to its neighbors, and the energy consumption of the network is decreased in comparison to the centralized methods, which use a fusion center to make the decision [
16]. As an example, the improvement of the performance in energy detection for a multiantenna scheme in a cognitive radio network has been explored with low SNR values and sensor-based cooperative spectrum sensing (CSS) in fading channels [
4].
Techniques such as hard and soft fusion have been used for energy-efficient CSSs [
20], and energy resources are very important if the SU in the MCRN is powered by a battery and needs to manage the energy efficiently. In these techniques, we can use AND, OR, and majority rules, and depending on the sensors, majority fusion shows better results [
20].
In a CRN based on the infrastructure, a centralized scheme can be used with a central controller that connects all the SU, which is called the fusion center (FC). MCRN works in this scheme because the base station works like the FC by enabling SU communication. A dynamic spectrum allocation is proposed in [
21]. An adaptive threshold works with the energy detector using methods for multiple attribute decisions, which maintains the QoS of the service even after handoff and performs better than the conventional fixed threshold [
21].
Several approaches have been developed for detecting PUE. Conventional approaches include algorithms based on cryptography but then need to use key management, and the key distribution is not easy in a wireless environment. To solve this problem, an energy detection (ED) algorithm is proposed. Another solution uses a Markov random field combined with belief propagation for PUE detection, but its dependence on the ED increases the levels of false alarm. The physical layer is also exploited in some techniques, but it is open the research to find robust and intelligent algorithms to implement in these networks [
22].
Currently, machine learning (ML) techniques are used to detect PUE attacks. The process is divided into two stages. The first stage is to train a machine with the data available, and once it is trained, it can classify the variables on the basis of the received signals. SVM is an option and has been used as a classification process [
22]. In [
23], the authors implement an SVM technique based on the SNR and the calculated Rényi entropy of the energy signal, and the results show that there is an improvement in the detection compared with ED for low SNR values. It starts with signal conditioning and filtering; this information is recorded for the learning process, which recognizes a PU in some modulations for several SNR values. After this, the classification process is made in real time to find the PUE.
Deep learning is also an option that uses artificial neural networks with an input such as an ED or cyclostationary signal. ED is used to recognize the PU presence, and after that, the cyclostationary is used to classify if there is an attack in the network. Another approach is to use the radiofrequency fingerprint by creating a profile for each transmitter that allows separation of the attack from a PU. Patterns of sparse coding have been used for the classification process in ML techniques [
22]. The results show a high probability of detection, but it has a high computational complexity for the calculation of the neural network [
22].
Another approach uses a secure sensing algorithm, which incorporates unsupervised machine learning to separate the PU signal from the PUE signal. It starts by identifying the licensed PU, and it is saved in the FC report that is shared with all the users connected to it. However, the false sensing reports caused by the PU have been identified thanks to the sensing history recorded in its database. Each user in the network uses a value to identify it in the FC. The reliability is then calculated, and the attackers can be classified and marked in the FC and shared with all the users. The problem of this solution is that a central unit is needed and its coverage is fixed, but in an MCRN, users are in movement, which leads to a hidden node problem in PUE attack detection [
24].
Another implementation of ML for PUE identification is found in [
6], which uses the Pattern-Described Link-Signature (PDLS) method to identify the features of the signals to classify the PU or SU in modulations such as Orthogonal Frequency Division Multiplexing (OFDM), but it depends on the modulation type than in an MCRN is difficult to predict due to its random nature [
6].
In [
25], the authors use machine learning in a wireless channel by using the locally weighted linear regression algorithm (LWLR) and predicting the available channels in a cycle and estimating the error distribution. With this information, a PUE attacker probability is estimated with an error threshold. This work can be used to estimate the probability of a PUE attack with a CRN, but it does not analyze a mobile user or a mobile network and is not implemented in an SDR device.
In [
8], a time-distance with signal strength evaluation (TDSE) using an algorithm called extreme machine learning (EML) is used to prevent PUE attacks, and there are results with a variable number of PUE attackers and using some location-based techniques. This solution can be achieved by an MCRN, but in practice, the received values of the received signal strength are not stable and must be averaged; it also needs a fixed location PU and some devices to measure the power at different distances to identify the PUE attacker. In a real MCRN scenario, the PU, SU, and PUE are in movement, and there is not always a possibility of communication between them because of the limited coverage.
Another approach is to use a deep learning convolution network considering a fourth-order cyclic cumulant vector (CRM) in the frequency domain to detect the modulation patterns in a convolutional deep learning method. It uses an ideal PUE attacker with a limited functionality, and its analysis is for a fixed network using simulations and is not implemented in a real scenario with motional users [
26].
Finally, to work with lower SNR values, the author in [
11] proposes the analysis of the signals in the frequency domain with Gaussian minimum shift keying (GMSK) and OFDM, using the Rényi–Entropy method to classify whether the signal received is noise or the PU signal, which does not require previous knowledge of the signal patterns or modulation. It uses an SDR, and the results show that this technique has a better performance than the ED [
11].
3. Machine Learning Techniques for PUE Detection in MCRN
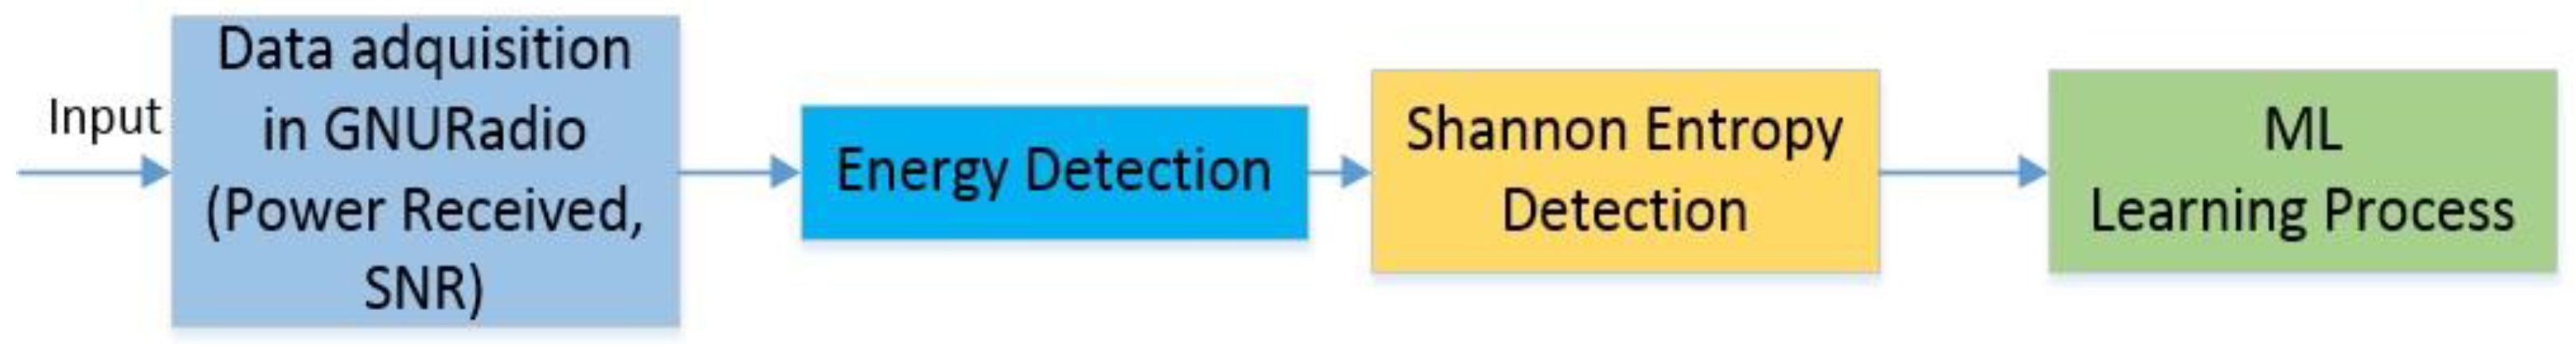
The proposed model starts by acquiring some data in GNURadio, such as the power received and the SNR value in a specific frequency for testing, by using the SDR testbed that is described in
Section 4. These values are used as inputs for the whole machine learning system, as shown in
Figure 1. For each SNR value, 400 samples are taken to create a dataset for the learning and testing process.
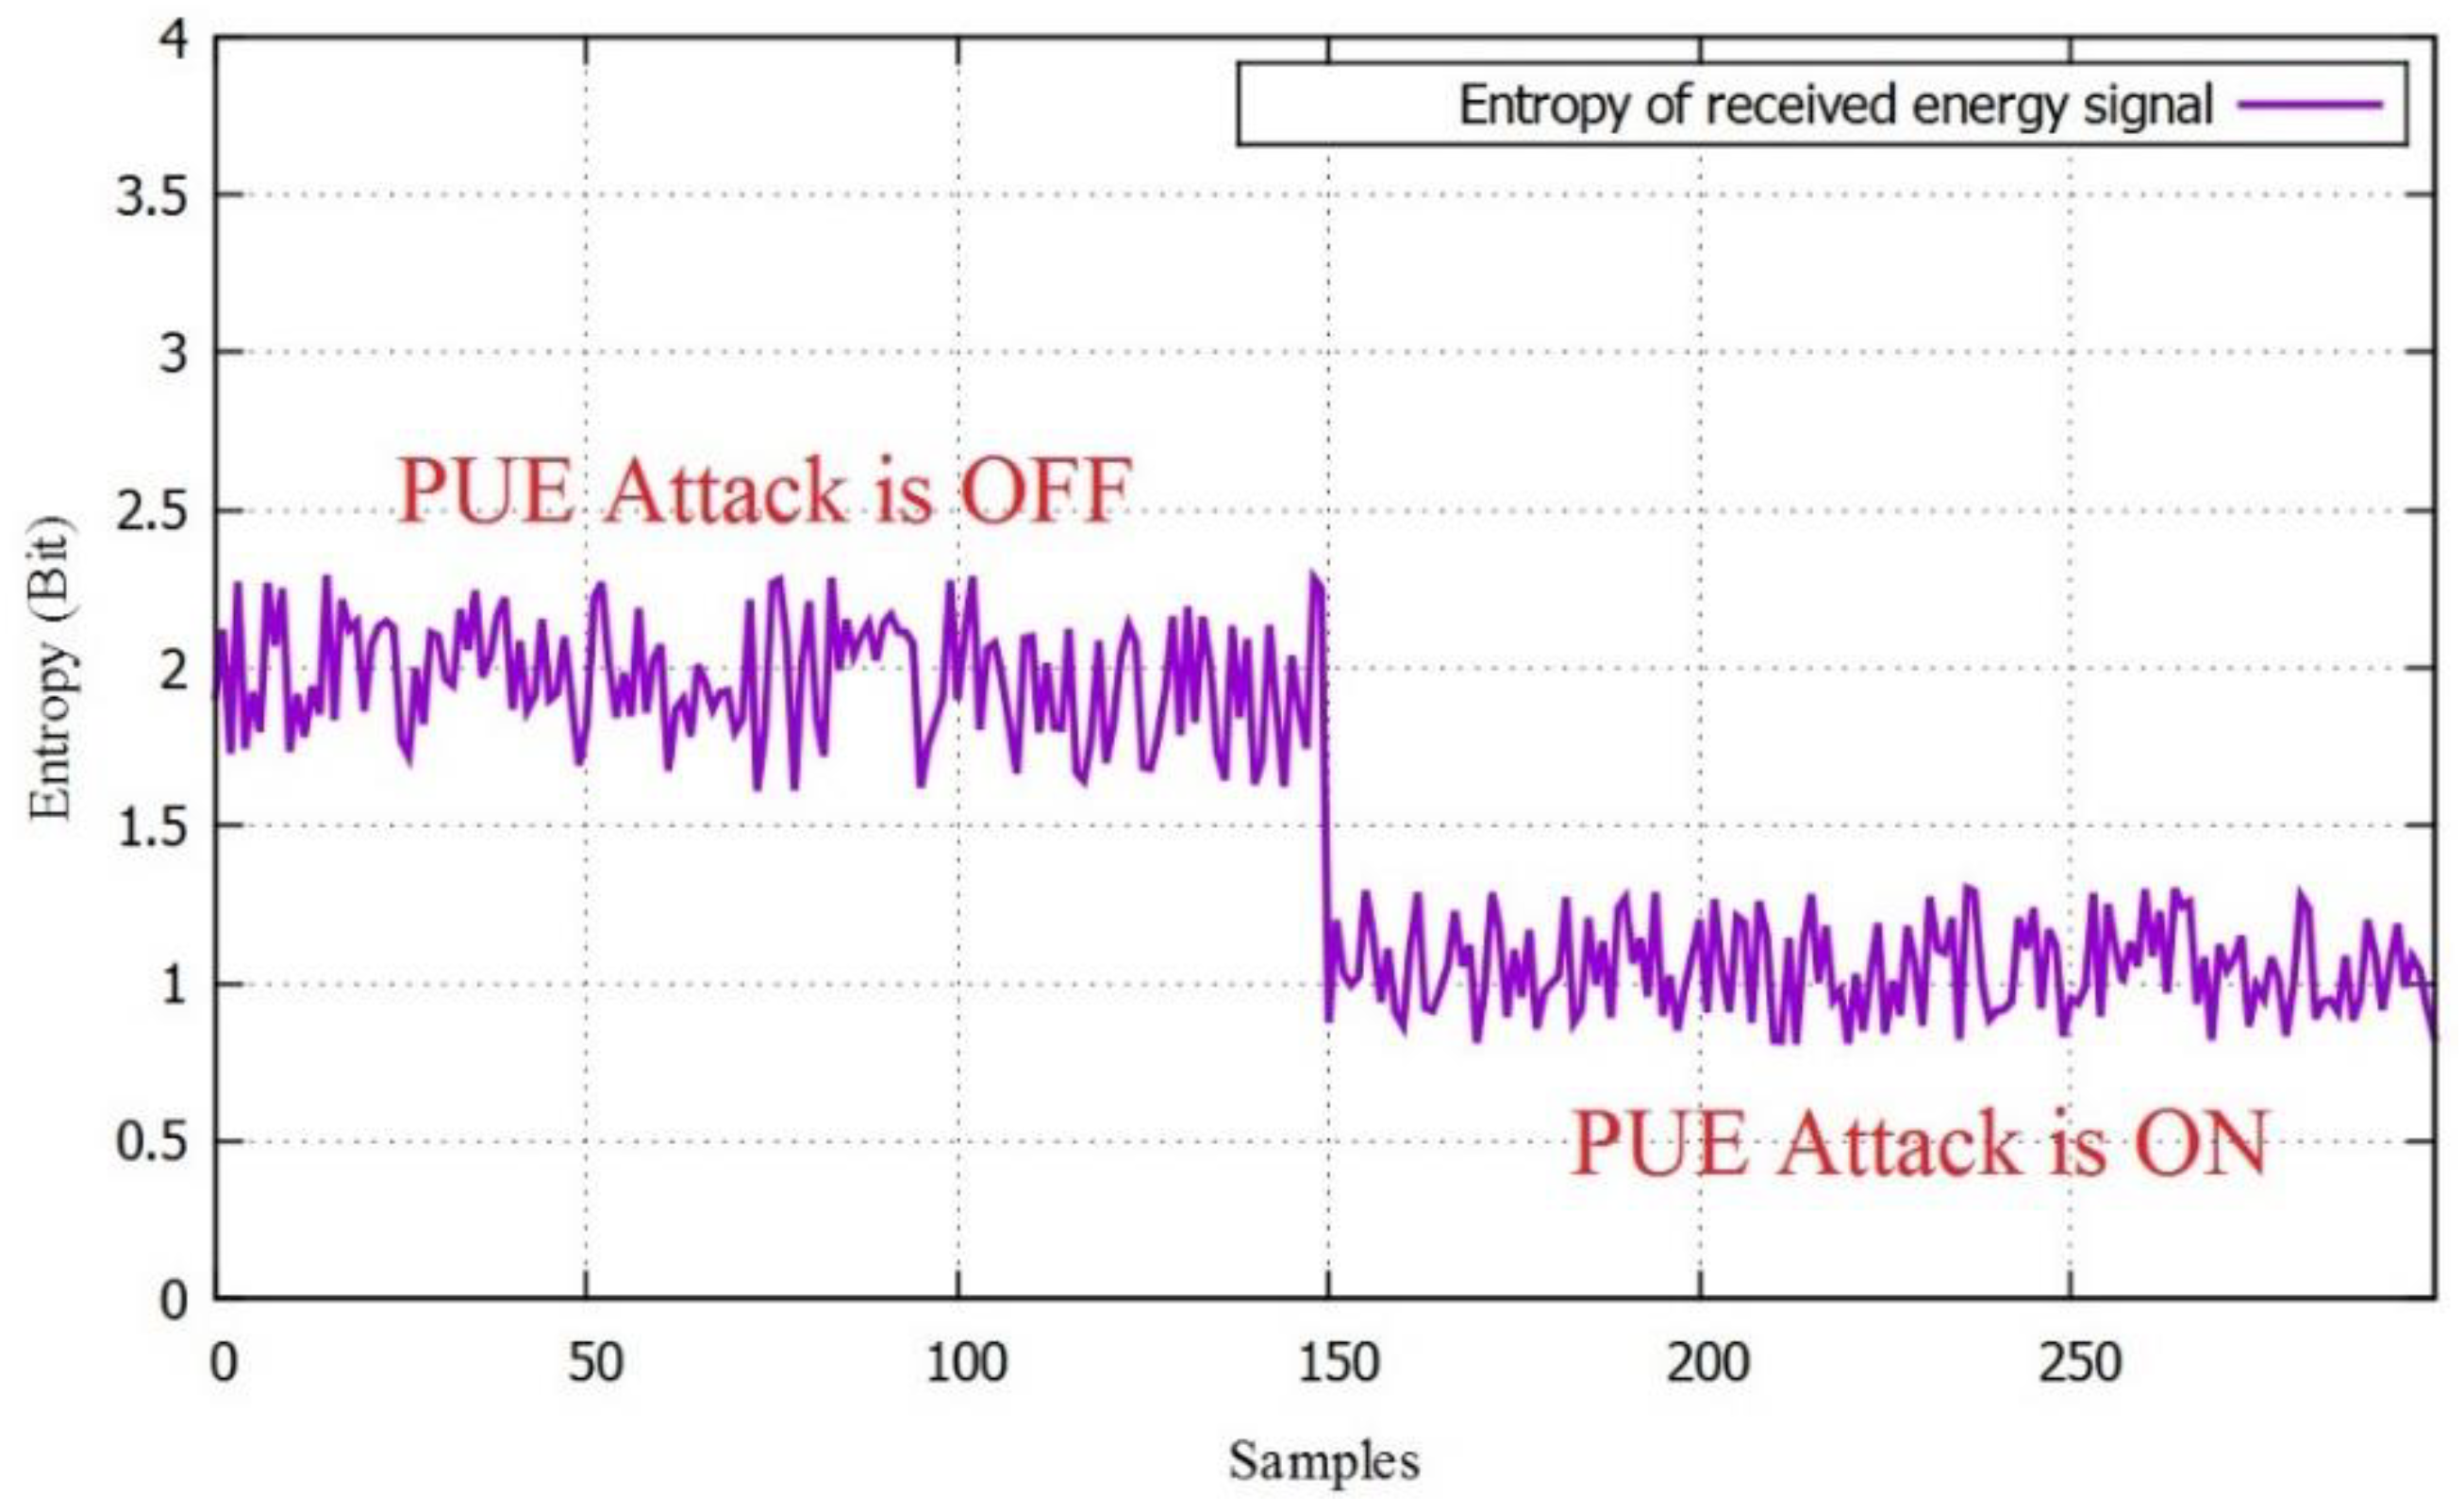
The next step is to use energy and entropy detection algorithms with the previously collected data to generate a final entropy calculation for each SNR value, which will be used as the input for the learning process of the machine learning algorithms. The decisions are based on three inputs, the SNR value and entropy of the signal, and if there is an active PUE. As we activate the PUE in the SDR, the third value is known and recorded in the database.
The ML learning process starts by taking the three variable samples and splitting 75% for the training process and 25% for the testing process. The energy and the Shannon entropy are calculated, and with these values, the system is trained and ready to be probed.
After that process, we probe the results of the classification algorithms by calculating the PUE detection with the remaining values (25%) and comparing them with the real results for several SNR values, obtaining the probability of detection as the number of correct PUE detections over the number of testing samples.
It is important to define that in our solution, if the detectors decide that there is a PU/PUE present, the system changes its frequency to another one, preventing that PU from being affected. The first part of the general scheme can be seen in
Figure 1, and the detectors and ML algorithms are defined below.
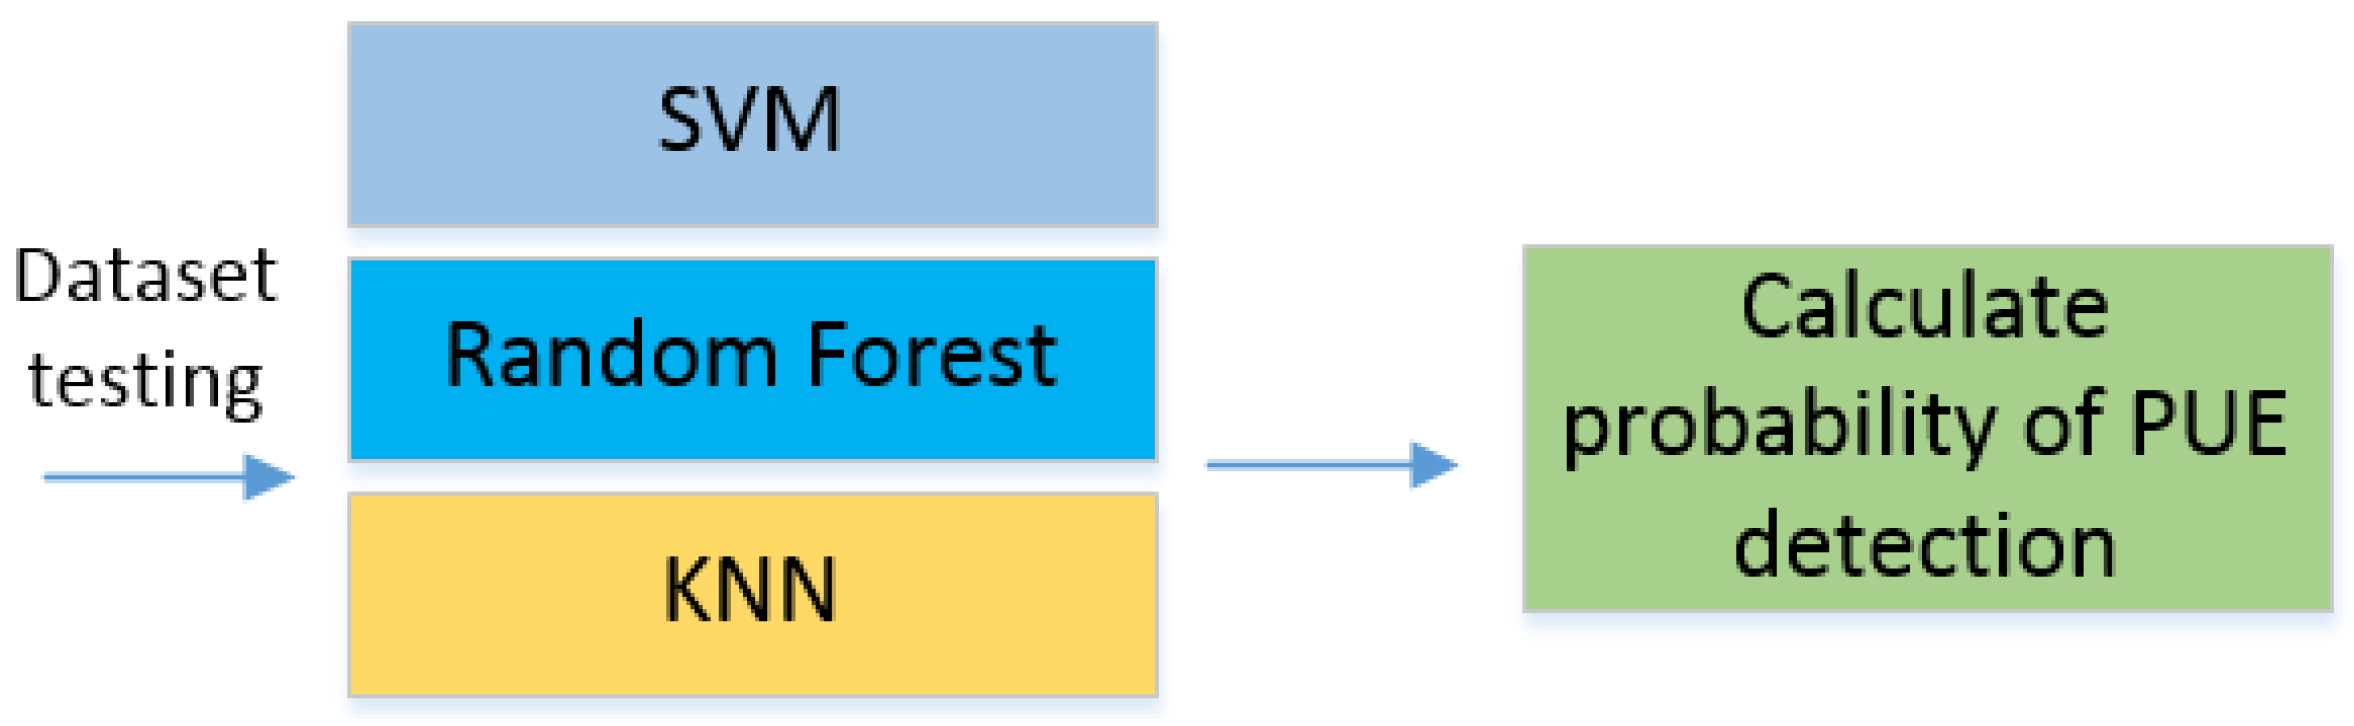
Once the learning and testing process are finished, we start to implement the different ML algorithms. For this paper, we used the SVM, random forest, and K-nearest neighbors (KNN). Finally, we probed the algorithms with the implementation in SDR and measured the probability of detection for PUE in MCRN as the number of correctly classified PUEs over the whole samples. This process can be seen in
Figure 2. We selected a technique and measure the probability of detection using the dataset for testing with new data.
3.1. Energy Detection
The signal is measured by using GNURadio [
27] connected to an SDR (USRP NI-2922). This signal is passed for a bandpass filter and compared with a threshold; for this case, the threshold is defined after a learning process to decide its value. An FFT is calculated, and the results are averaged. Then, the energy of the input is compared with the estimated threshold. If the measures are above the threshold, PU/PUE is present. The input signal is a PU that is generated by a cellular phone transmitting in the absolute radio frequency channel number (ARFCN) 226, which is centered at 888.8 MHz in DL [
23].
A hypothesis test allows us to estimate the existence of a signal different from noise. By itself, it cannot distinguish a PU from a PUE signal, but it helps us to separate it from noise. In this binary test,
H0 is identified as noise, and
H1 represents that a PU/PUE signal is present with noise [
15]:
where
x(n) represents the input signal samples taken at time
n,
q(n) is the noise, and
r(n) is the PU/PUE signal [
15]. An energy detector of the received signal is represented by
Z, and the threshold (
λ) is calculated as in [
15], and they are compared. The probability of detection (
Pd) is where the received signal is over the threshold and indicates that a PU or PUE signal is present in the environment. The probability of false alarm (
Pfa) is where the received signal is over the threshold, but there is no PU/PUE active, and it is represented in (2) [
15].
3.2. Shannon Entropy Detection
The received signal is changed to analyze it in the frequency domain by using the Fourier transform for discrete values (DFT) according to Equation (3) [
28], obtaining
where
X(
k),
R(
k), and
Q(
k) represent the complex spectrum, the PU/PUE signal, and the noise, respectively. As in energy detection, a hypothesis test such as in ED is also used;
H0 indicates that there is not a PU/PUE signal present and
H1 indicates that there is a PU/PUE signal as in [
29]. The entropy is then calculated by using the histogram technique, and the probabilities are calculated in (4) for a specific quantity of bins called
L.
where
pi is the probability of occurrence in the
i-th bin. To probe this hypothesis, a test statistic is used for
L, and the Shannon entropy is then estimated in (5).
The threshold, in this case, is calculated by a specific
Pfa [
28];
ki denotes the total number of events in the
i-th bin, and a value of
L = 15 is as in [
30].
3.3. Machine Learning Techniques
In this section, we define each of the techniques used for PUE detection, support vector machine (SVM), random forest, and KNN.
3.3.1. Support Vector Machine
An SVM identifies the optimal hyperplane to separate two signals in the dataset. Traditional SVM has been used in several problems of engineering, such as network security, data classification, and bioinformatics [
31].
A linear kernel is used when the function tends to be linearly separable and uses small samples and the training process is short. Another kernel, such as a polynomial, can be used when the function is not linearly separable and uses variables such as the polynomial degree that can affect the computational time and results [
31].
The SVM is a classification model that takes an input into a high-dimensional feature space, and depending on the data type, it uses kernel functions to separate it into two or three dimensions. The data points in the margin limits are the support vectors and help to calculate the optimized hyperplane; this process is shown in
Figure 3 [
32].
In
Figure 3,
H is the separating hyperplane. The separation margin is optimized to be the maximum distance of the support vectors of each category. The first objective is to separate the two parts of the data in this case linearly [
33]. The second is to find the margin as in (6) [
32], where
x is the argument,
w is the weight of the margin, and
b is a constant.
To solve this optimization problem, a Lagrange dual method is implemented as applied in [
33]. The functions are represented in (7).
where
xi represents the support vectors, a is the Lagrange vector, and the symbolic function is
sgn(
x) [
33].
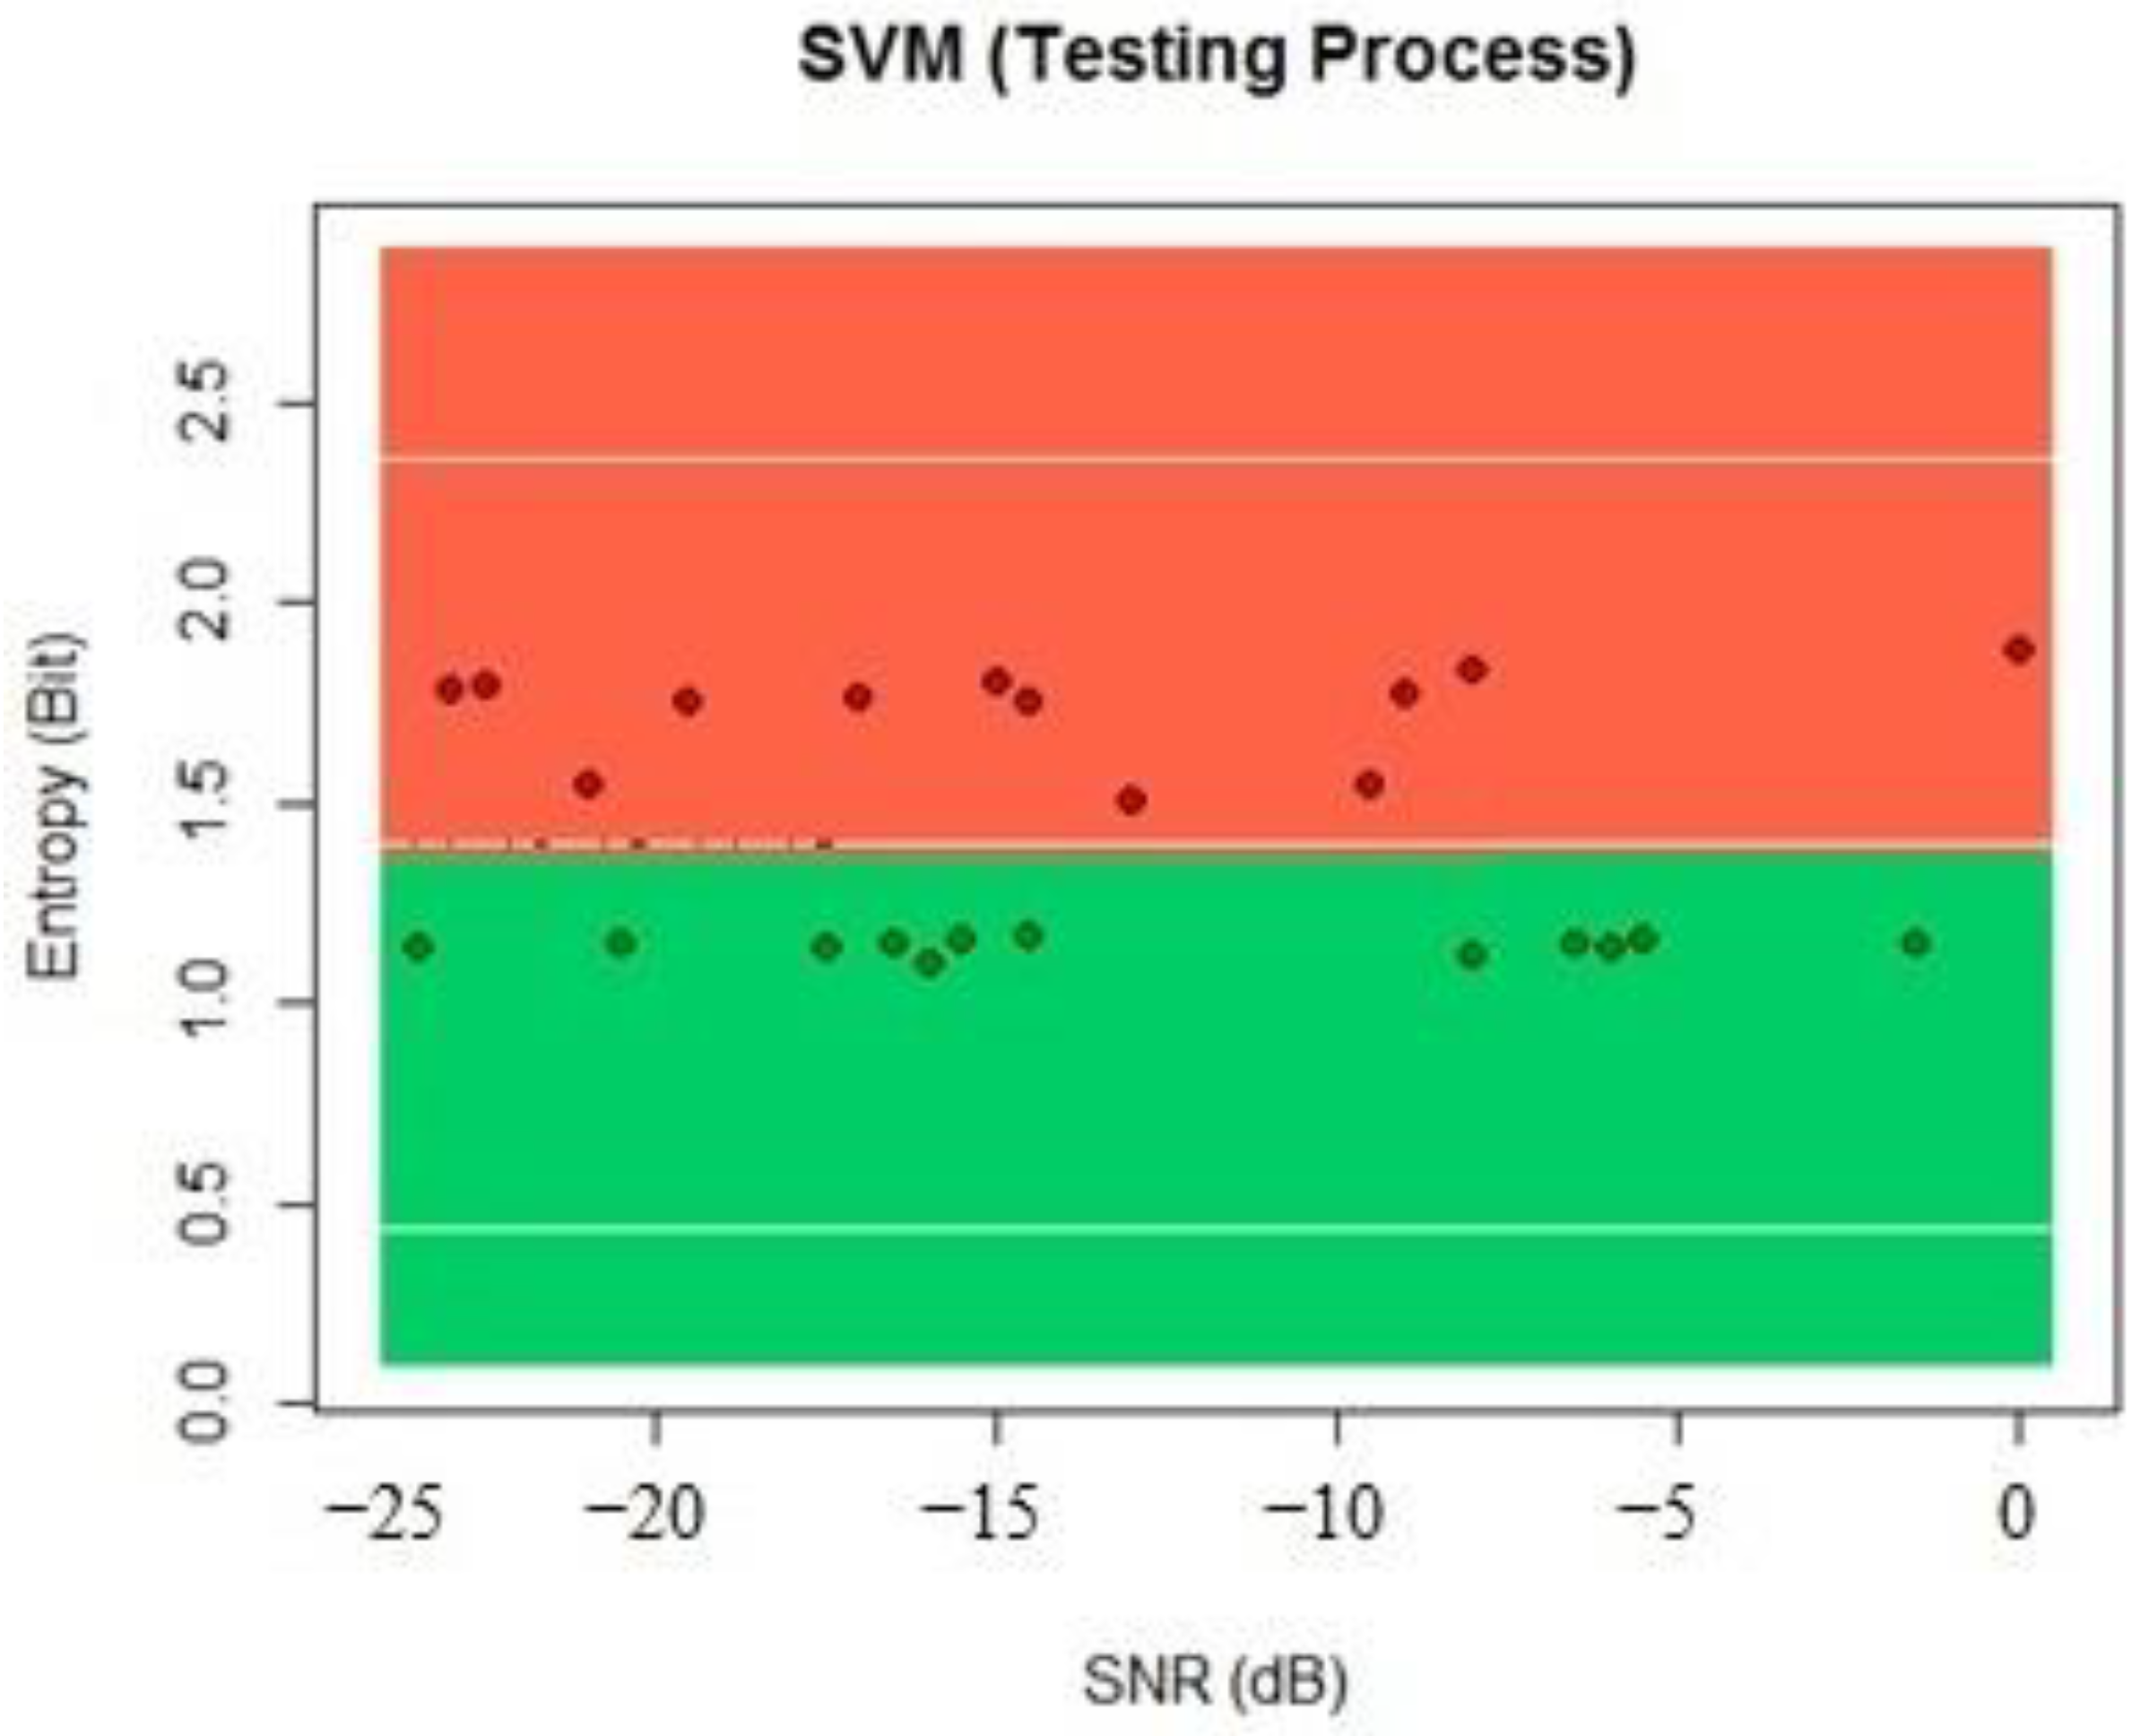
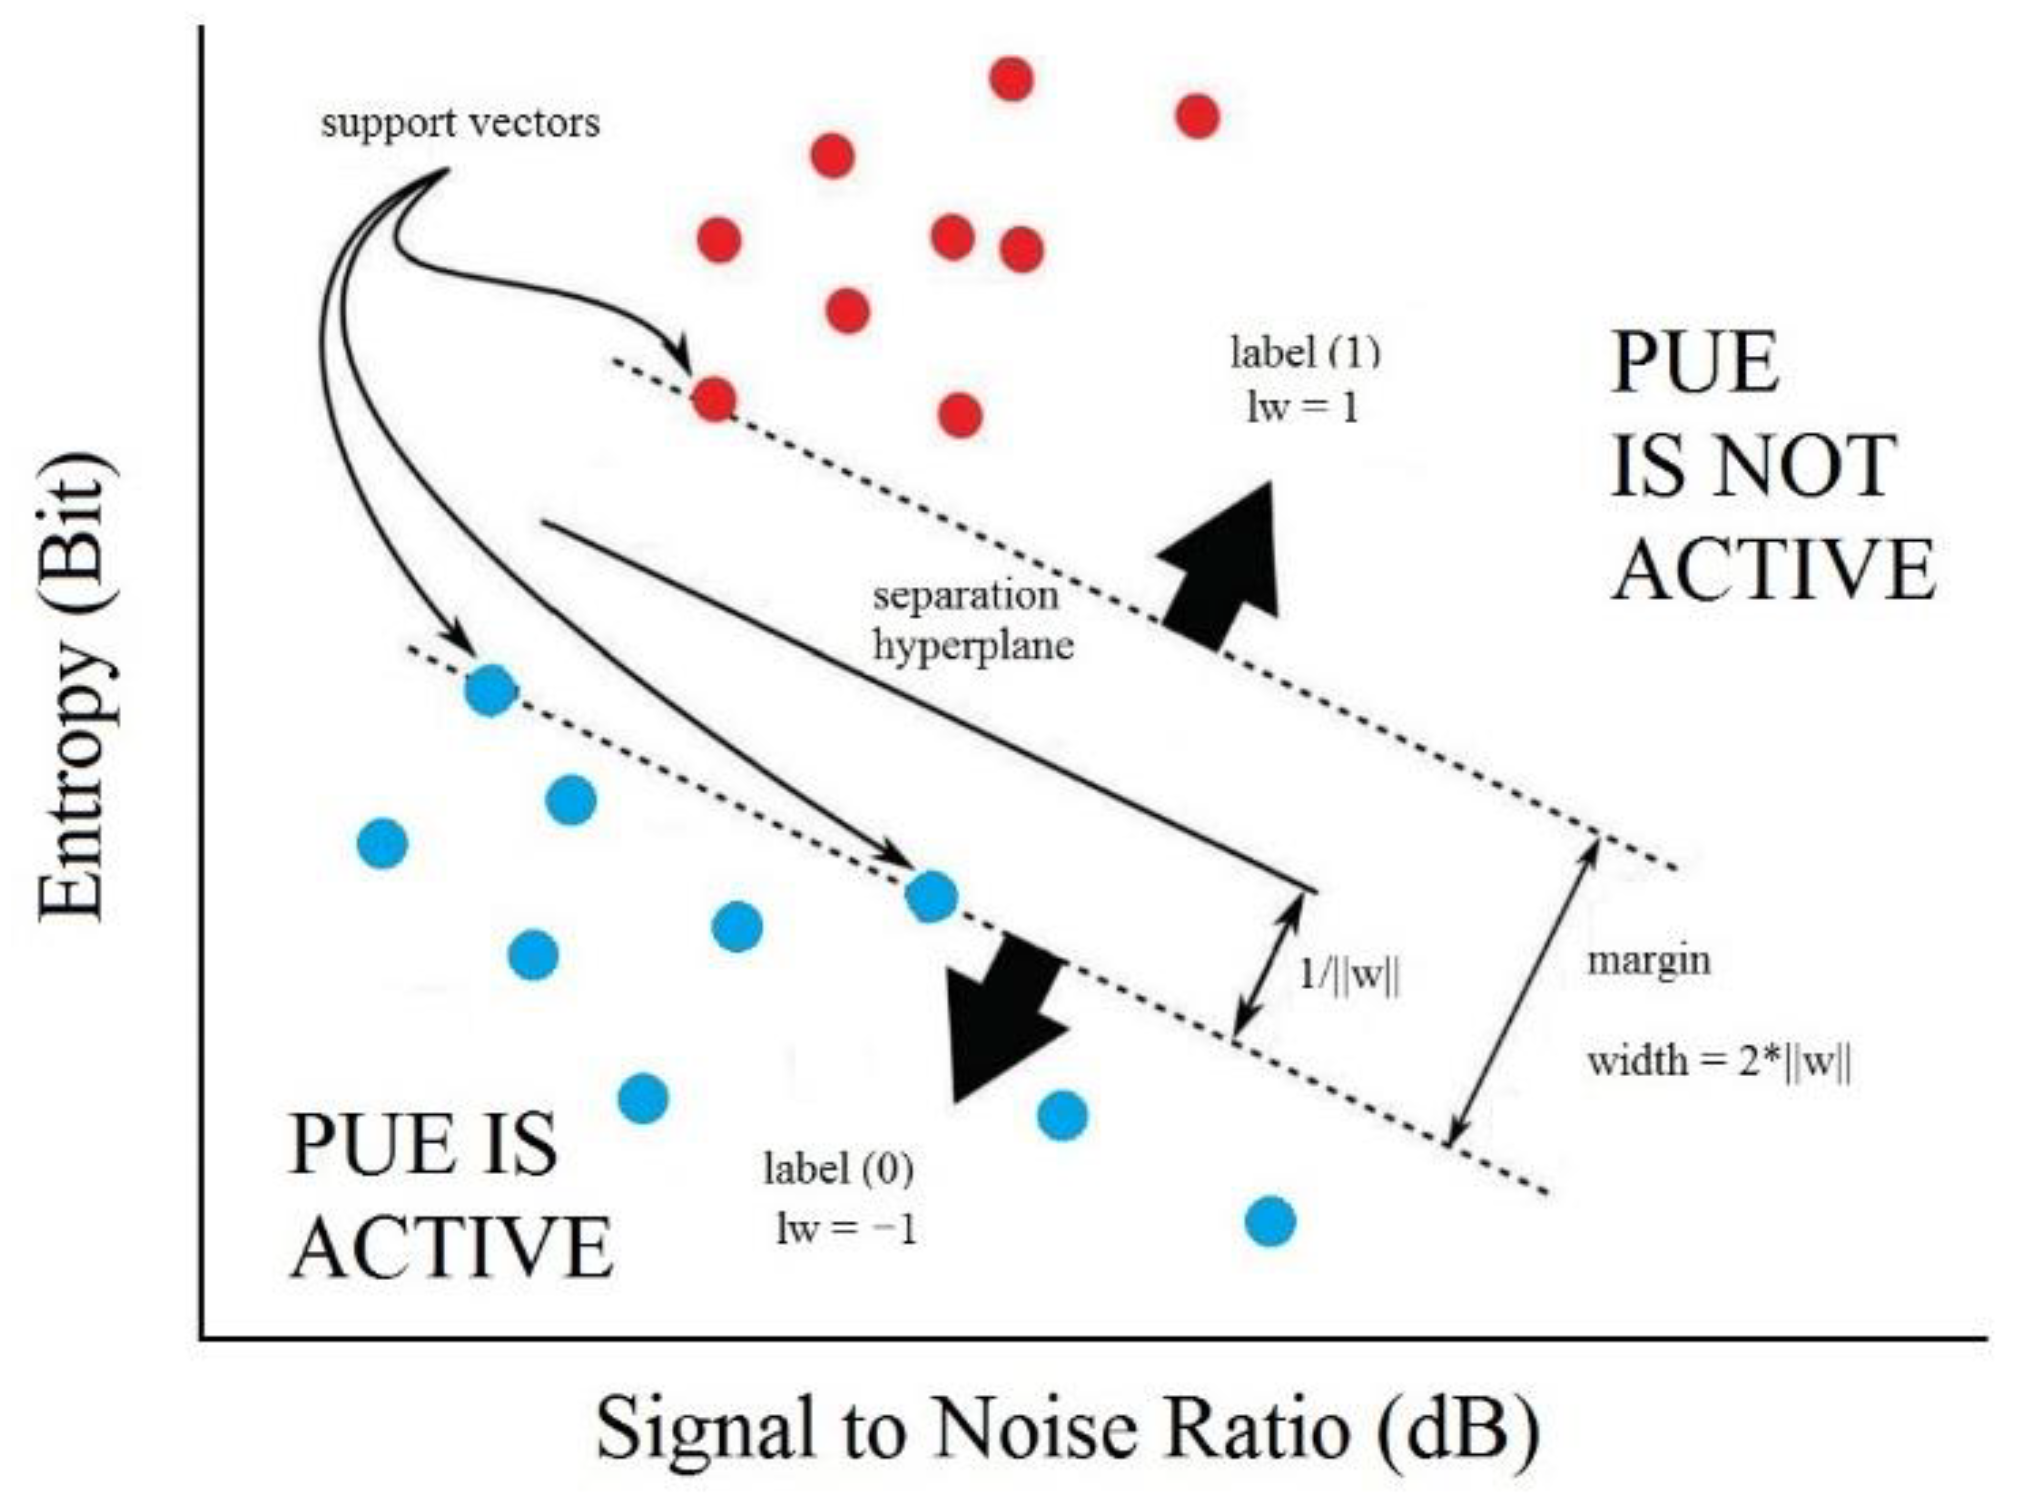
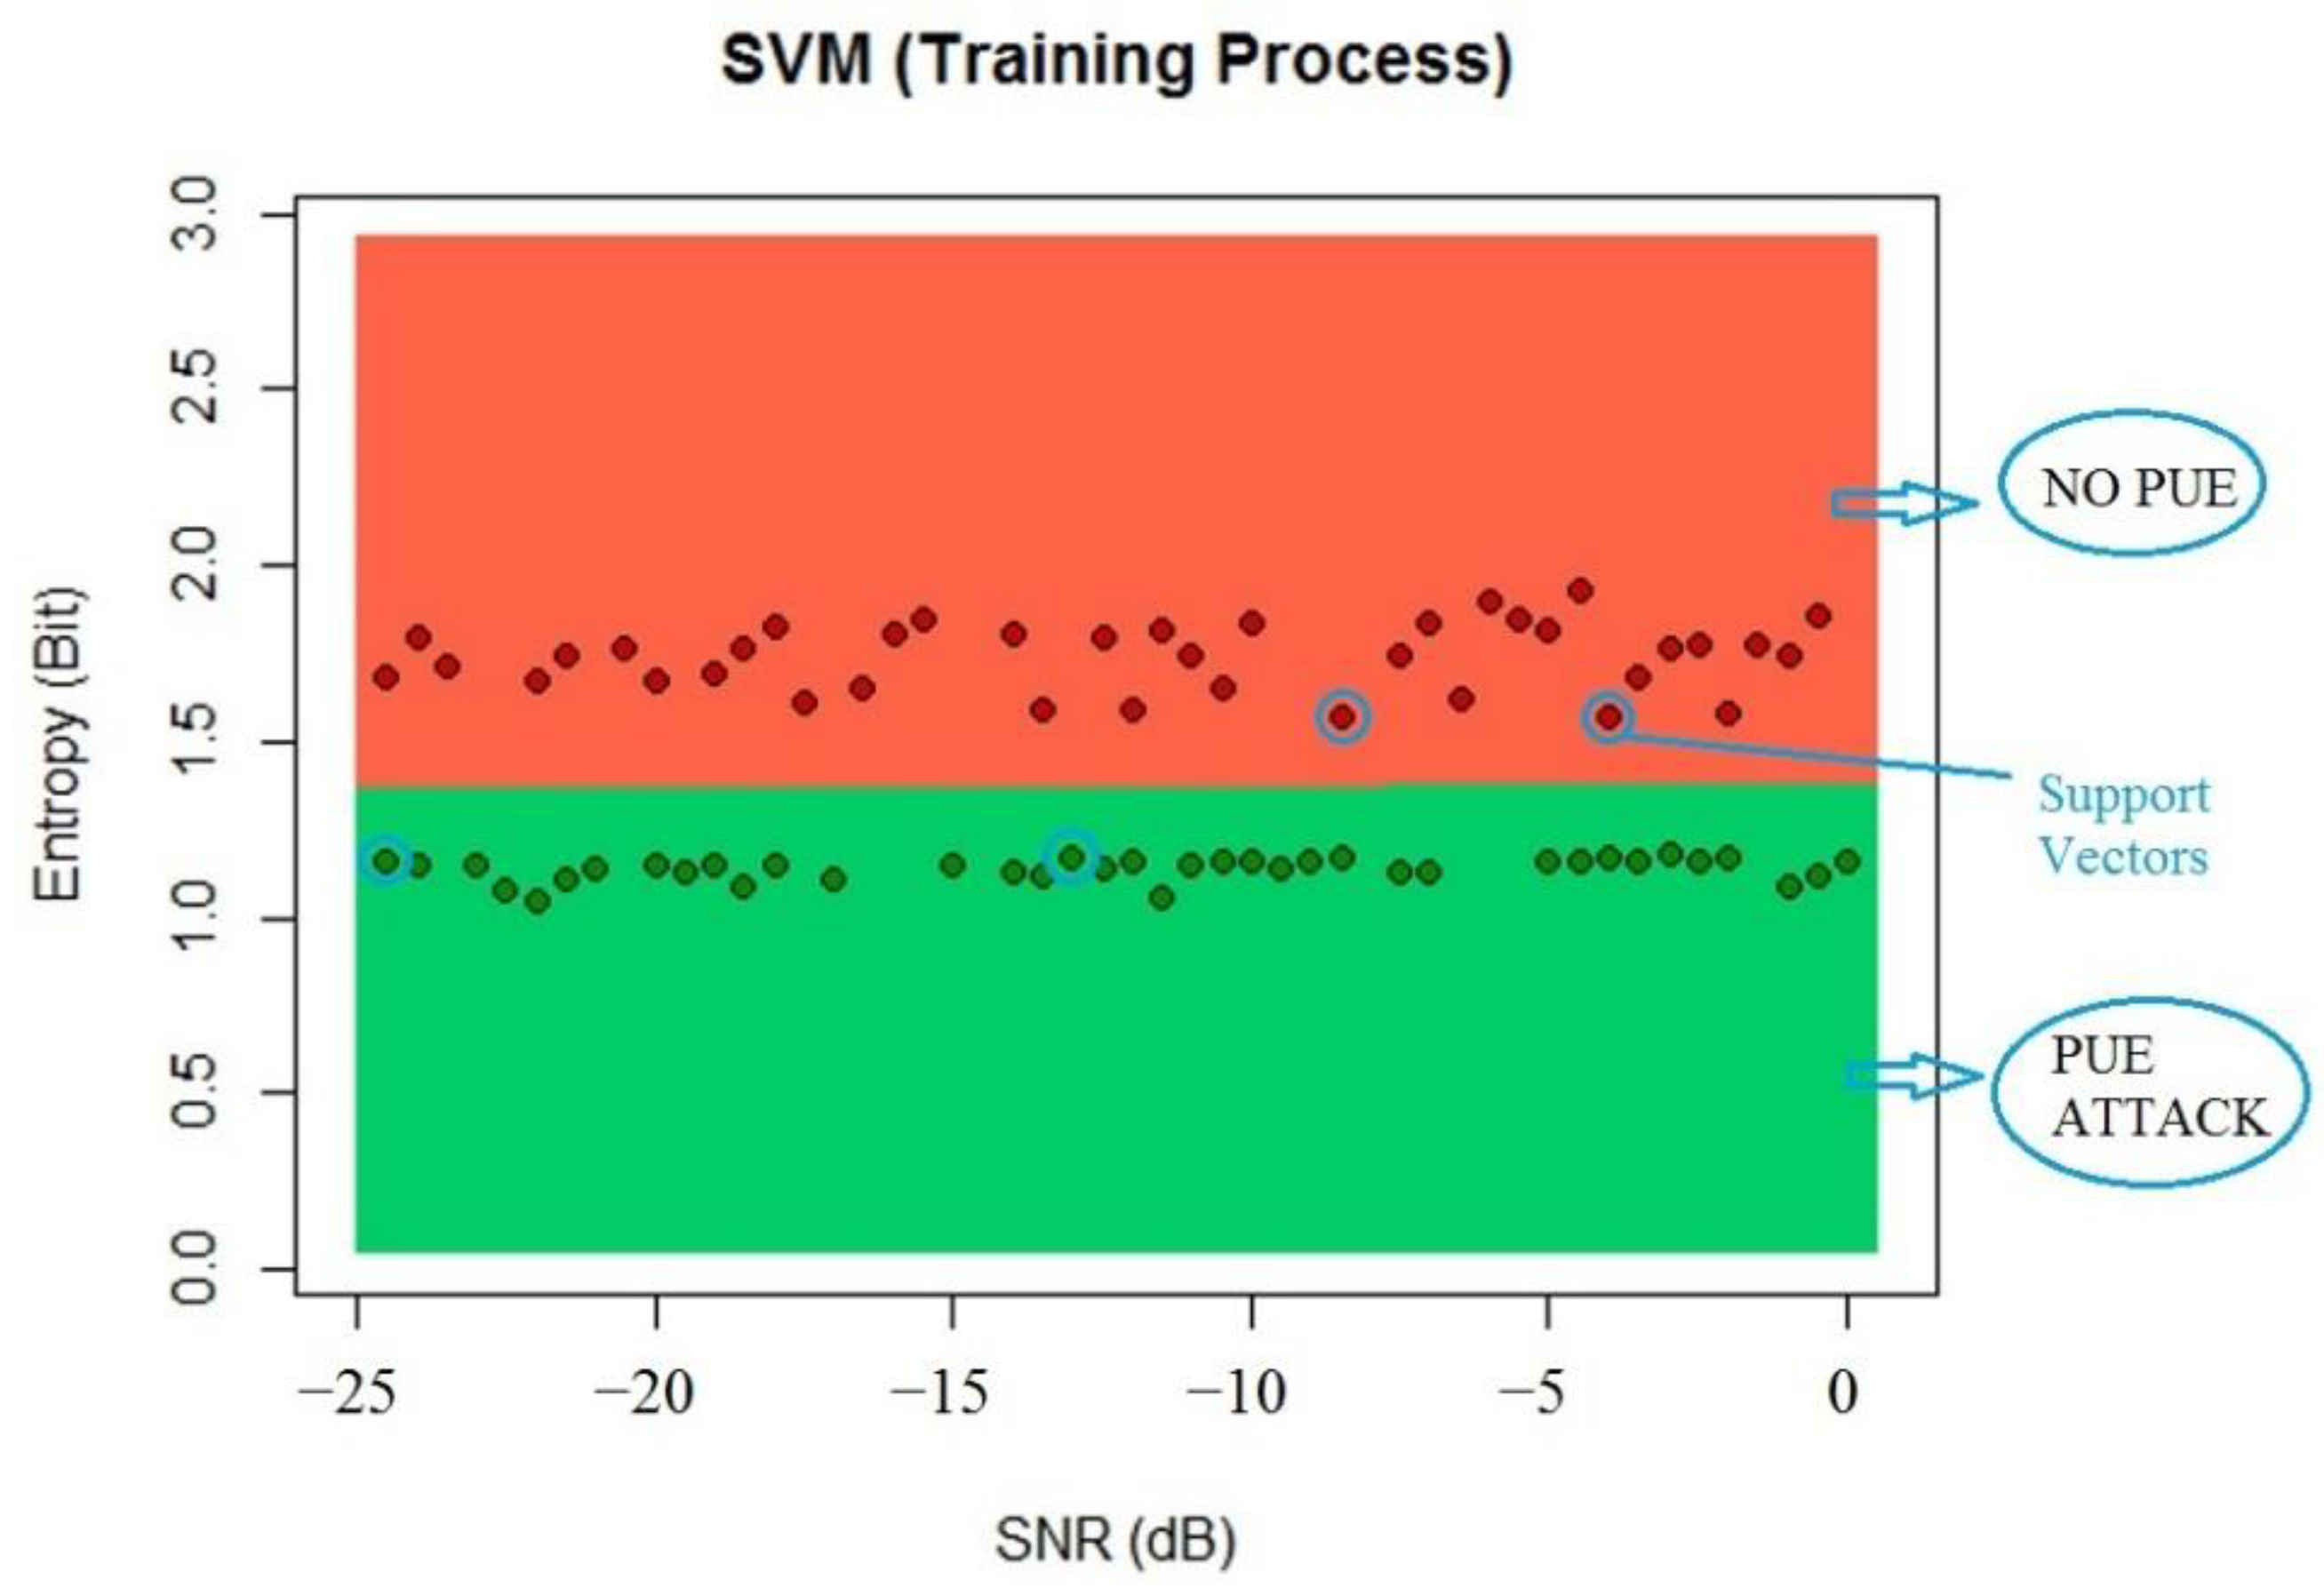
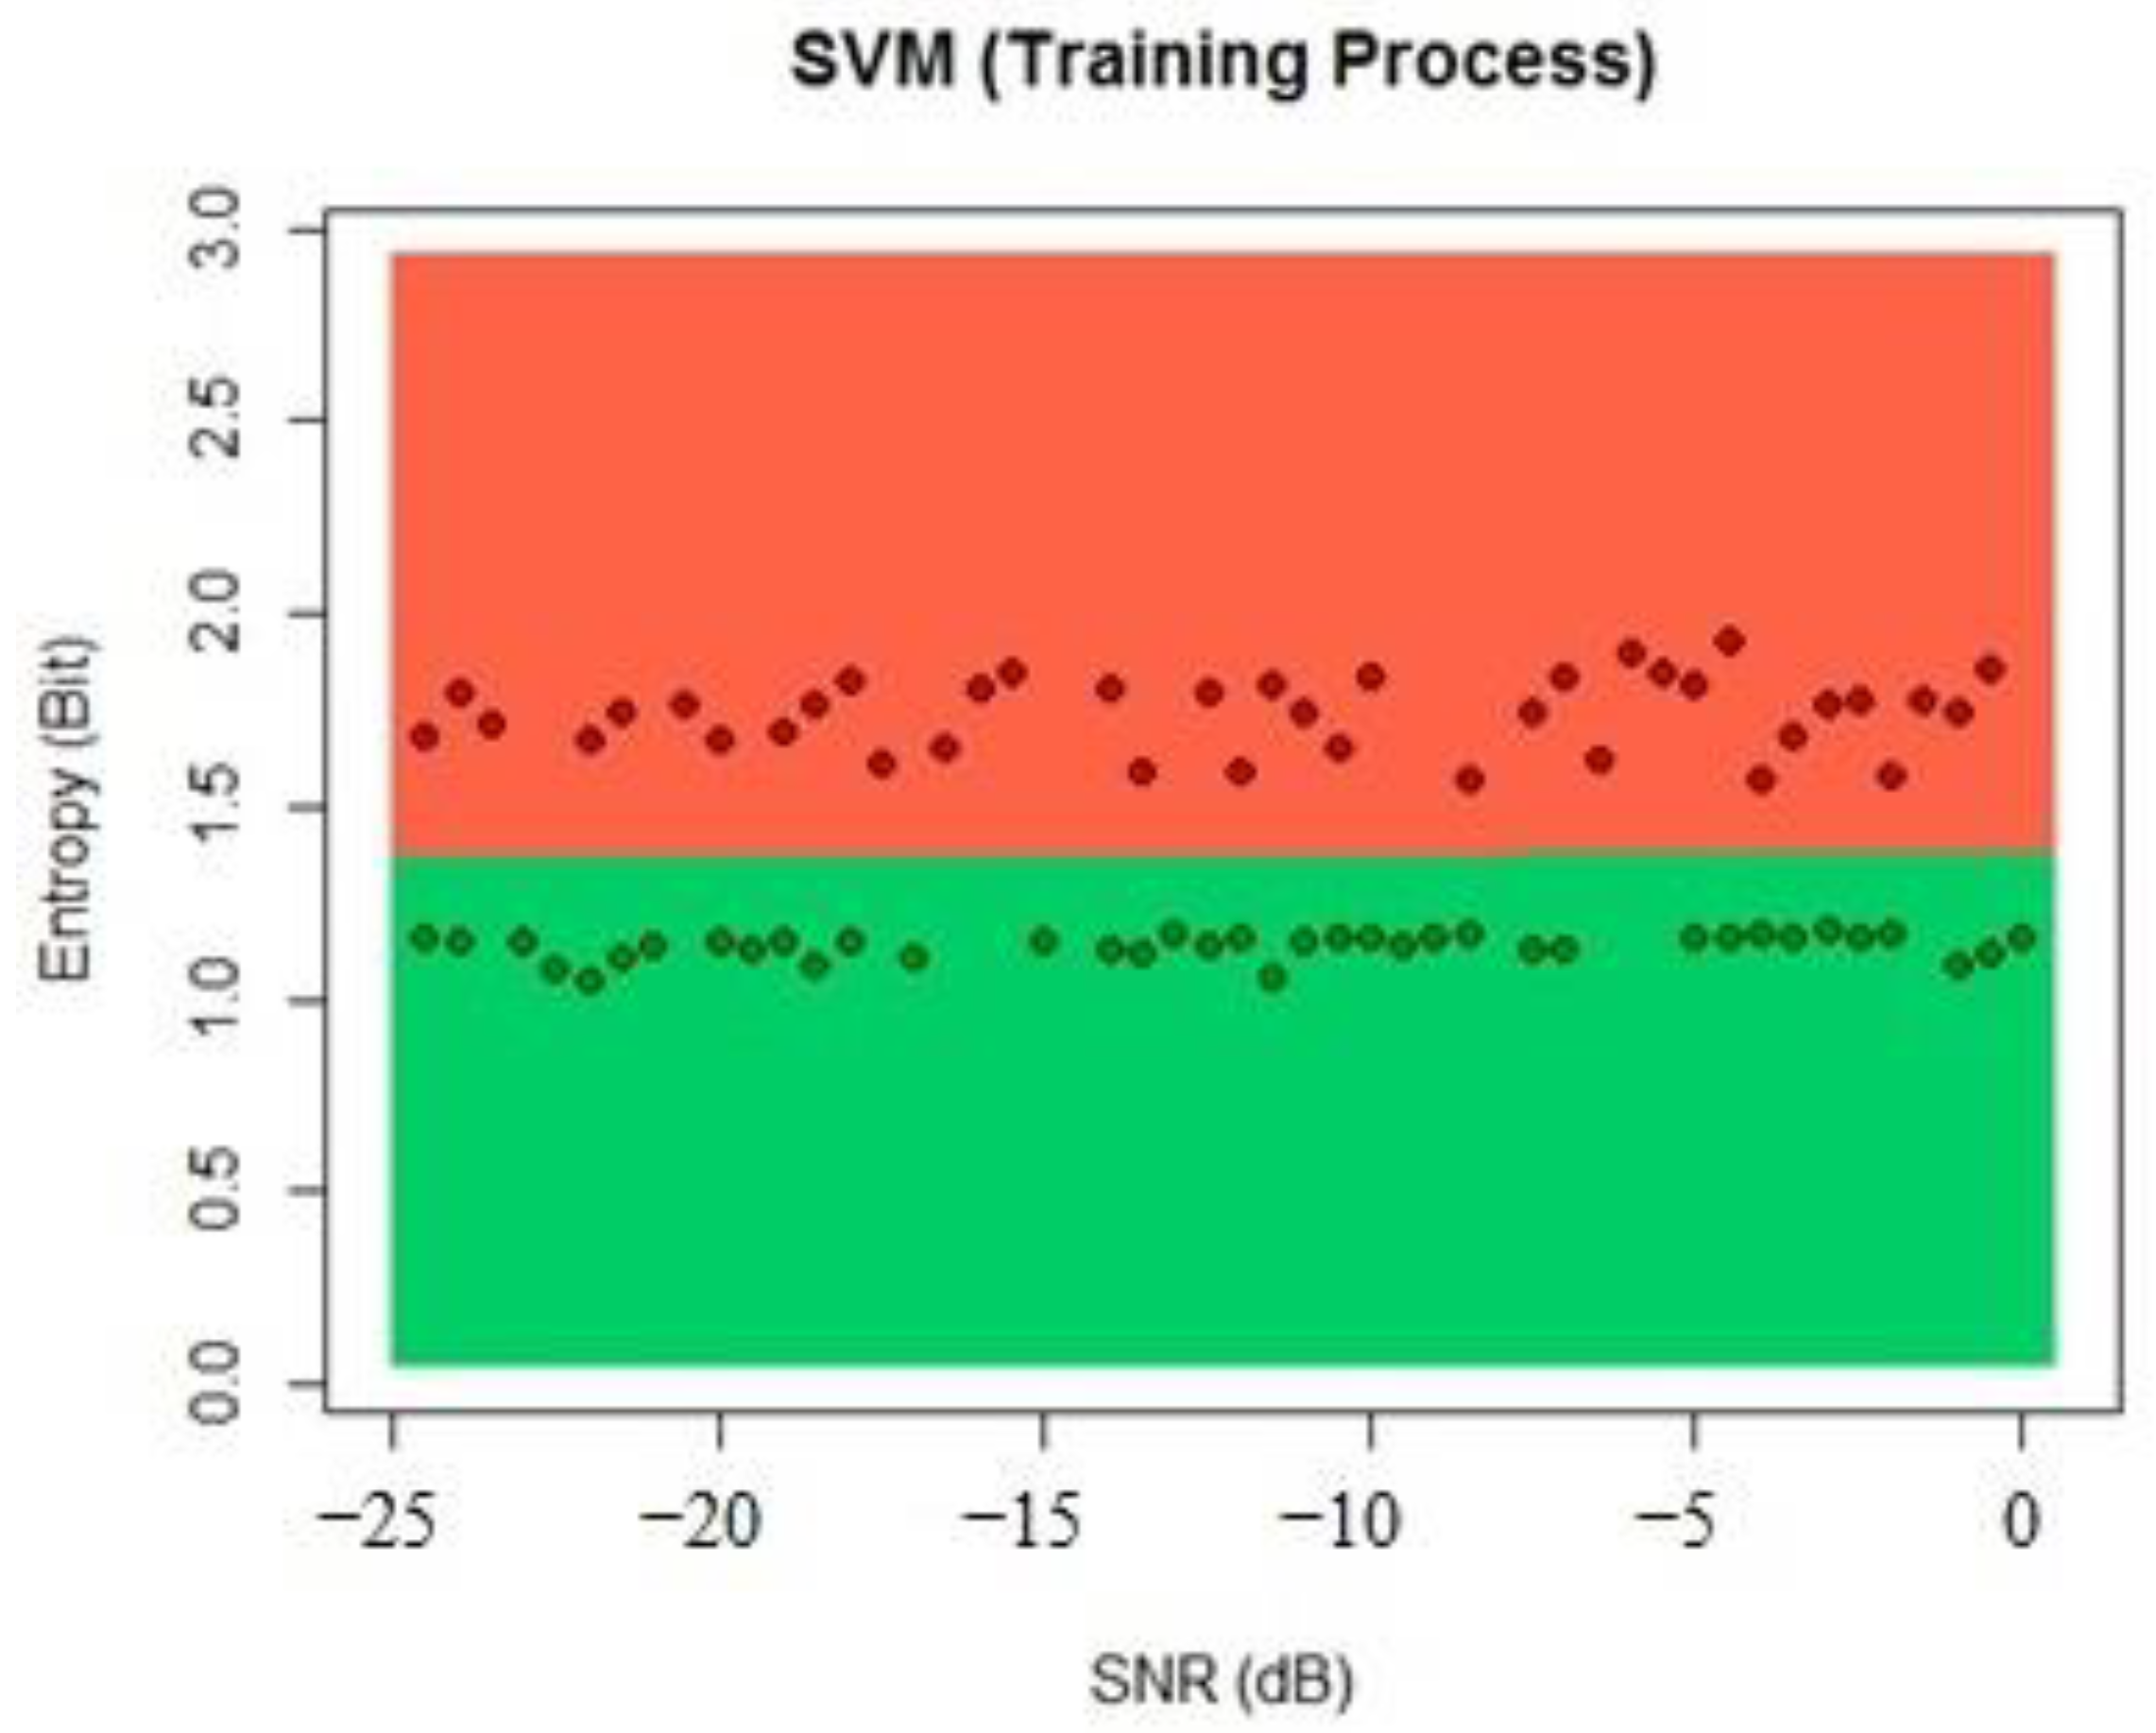
For our proposal, the input data for the SVM are the estimated entropy of the received signal and the measured SNR. The classification problem in this case is to detect if there is a PUE presence in the radio environment, which is achieved by comparing the entropy values and the SNR when PUE is on and when it is off. Then, we have three inputs to the system, the entropy in bits, the SNR in dB, and a binary variable that tells the system if there is a PUE attack. Then, the decision is made for each SNR value, and the supported vectors allow the linear kernel to separate the entropy for each SNR value. This algorithm maximizes the separation of the supported vectors, allowing better results than other techniques for PUE attack detection systems. The output of the system is the final decision that a PUE attack was detected in the radio environment at the selected frequency. An example of the application of the SVM for PUE detection can be seen in
Figure 4.
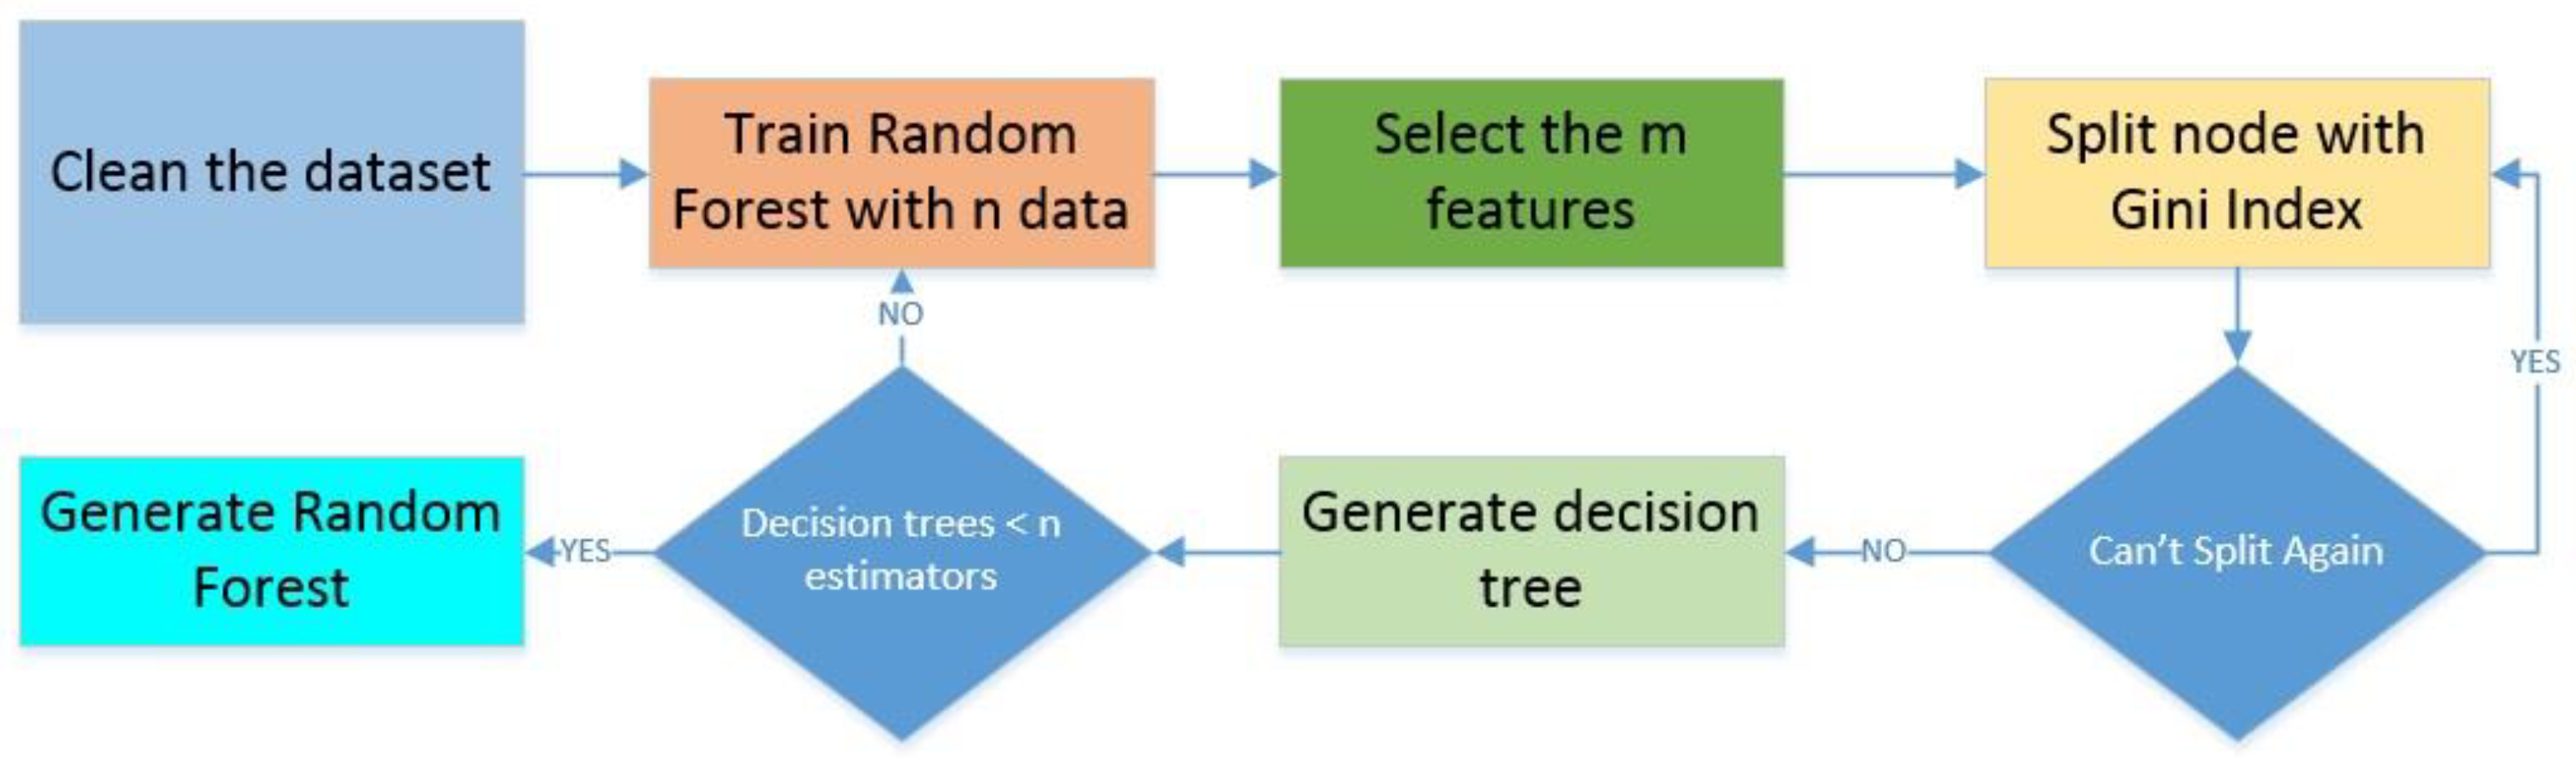
3.3.2. Random Forest
The random forest technique is part of the supervised learning process. It is based on a simple decision tree, but in this case, many trees are created in multiple ways depending on the features and with random sampling for each tree. The final classification decision is based on the majority rule. It reduces the overfitting presented on a single tree and can calculate the main features of the dataset [
34]. The process can be seen in
Figure 5.
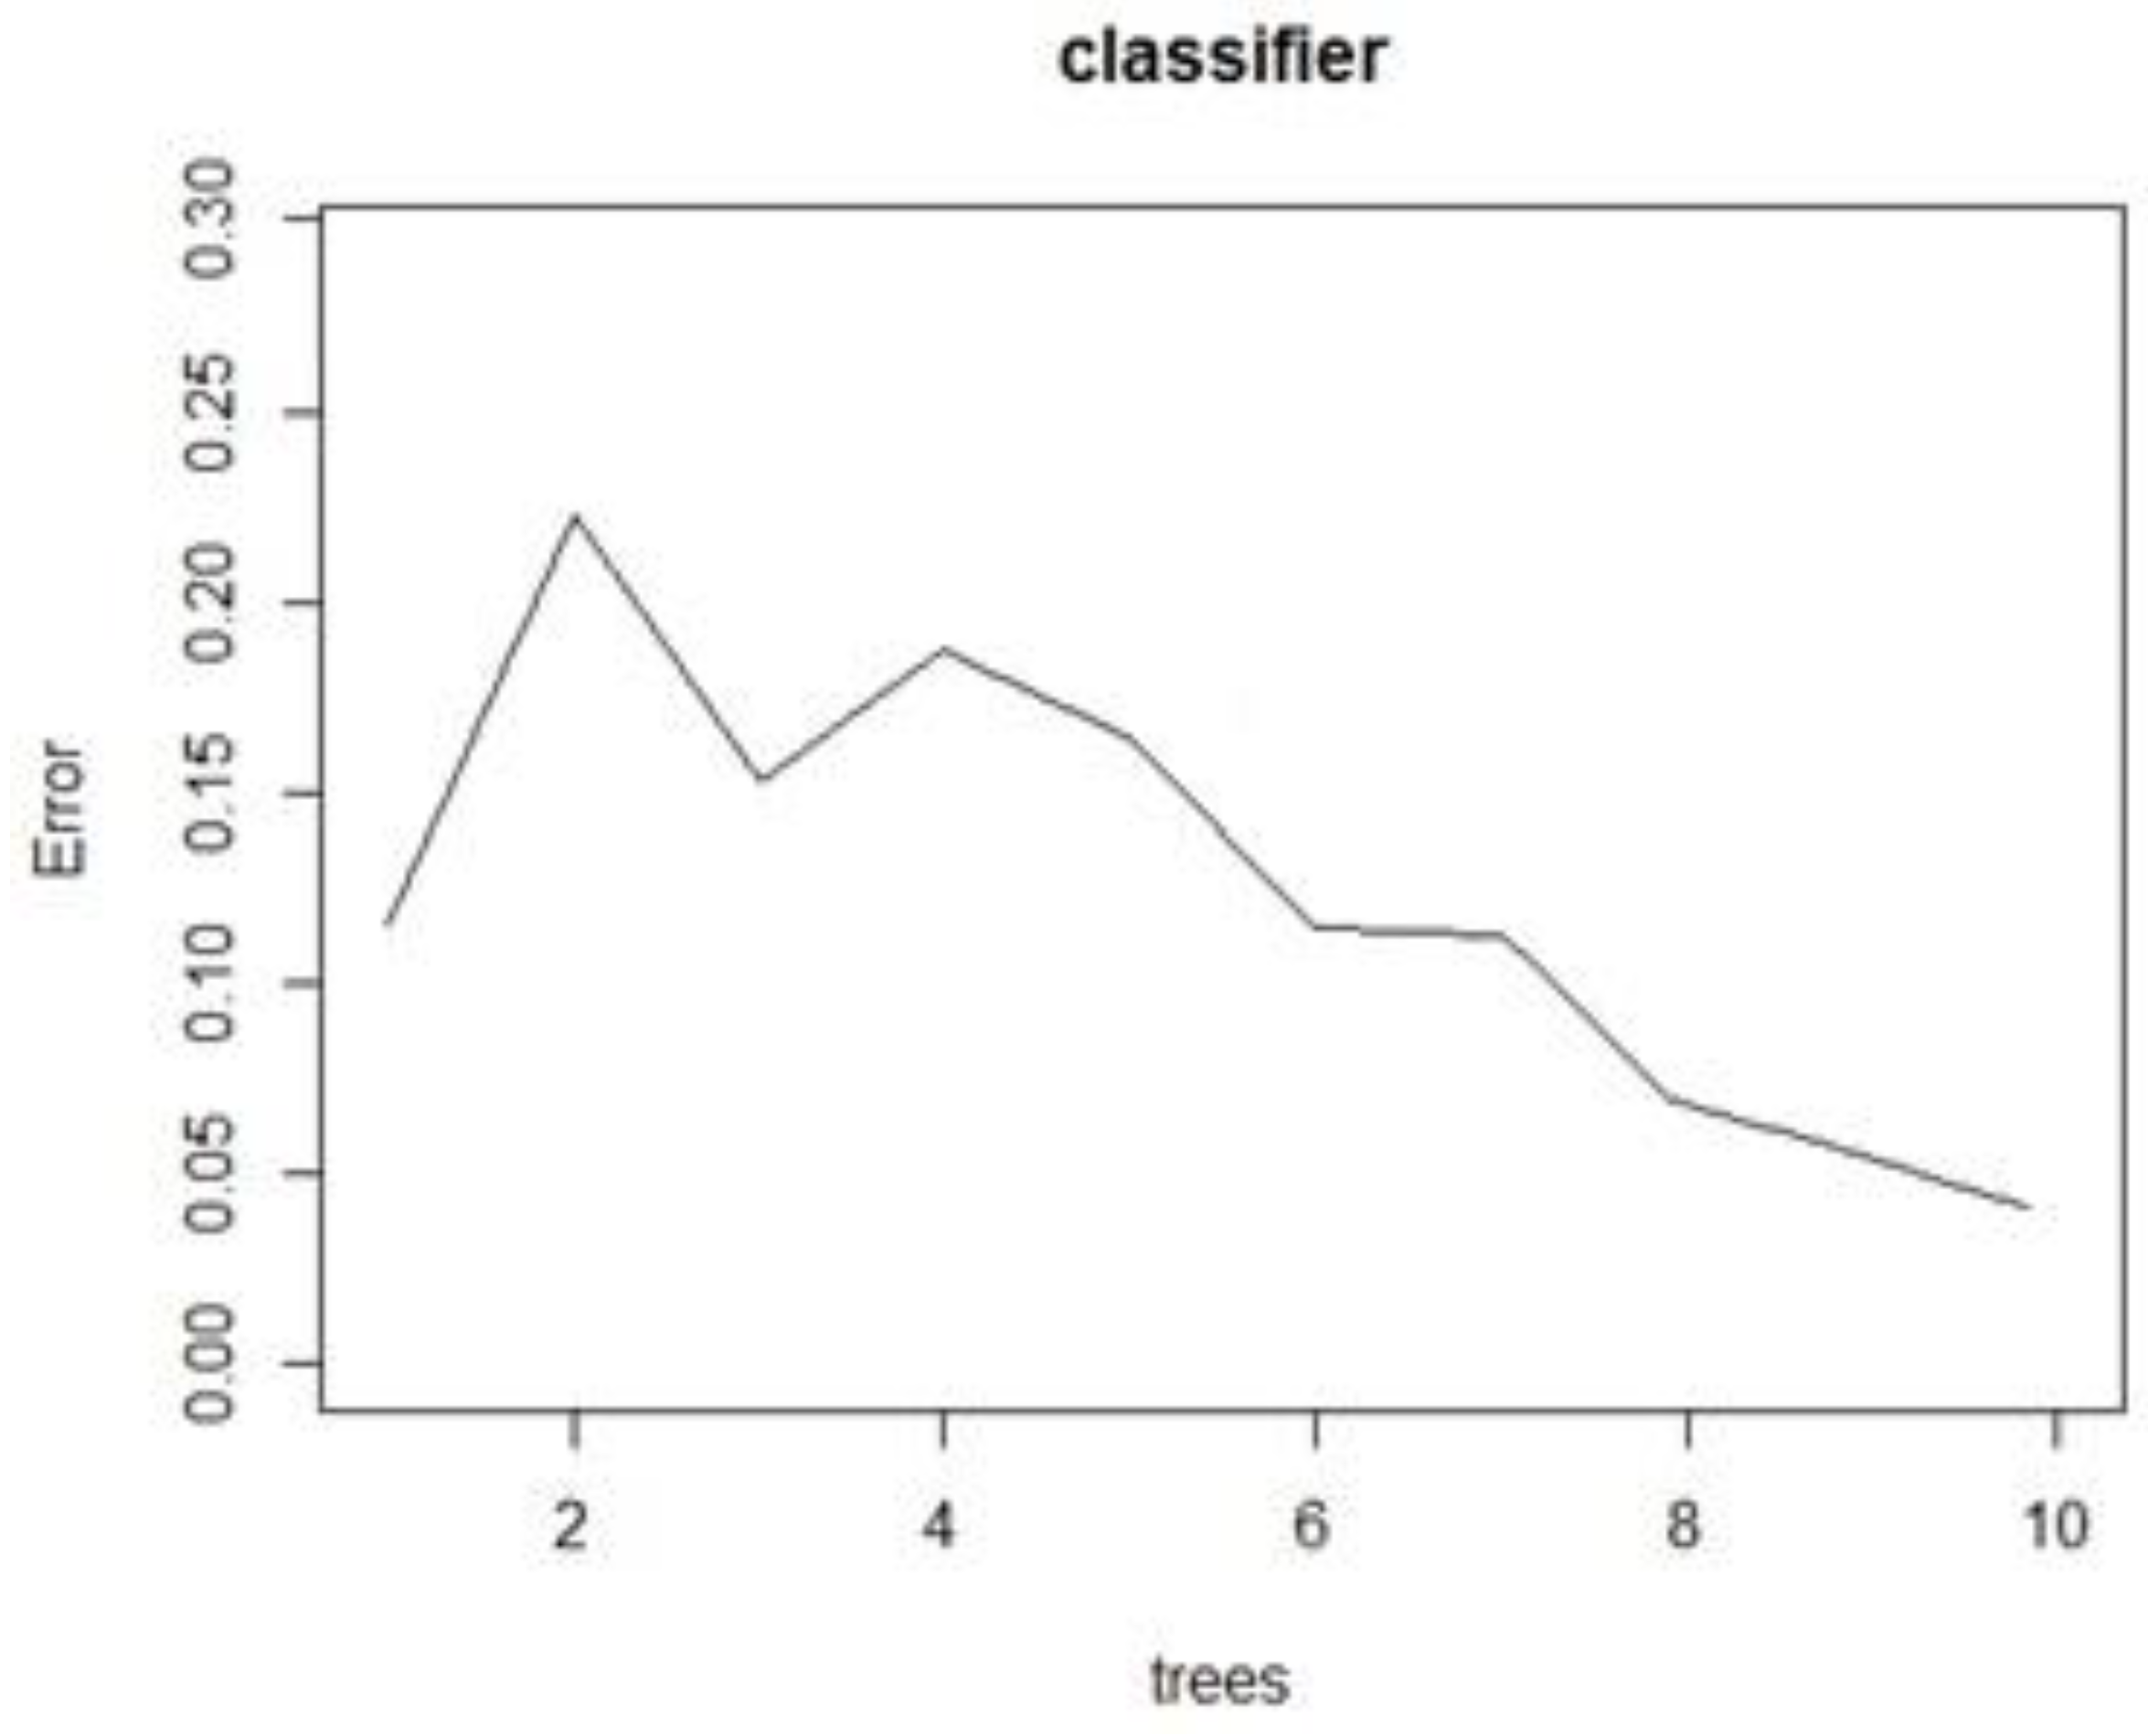
It has been implemented for classification and it shows better results than a simple tree and other techniques depending on the data composition and the dimensionality. Each tree takes values from a random sample using a unique distribution around all the trees in the forest. If there are too many trees, the error tends to a limit. We can use some algorithms to find the optimal number of trees for an estimated error and can be used to predict or classify data [
35].
The main process is divided into two parts: the first is to calculate the decision trees individually, and the second is to apply the majority rule to classify the data. For this objective training, a set must be randomly selected, the random forest must be calculated, and the nodes must be split. In this last part, the Gini coefficient is calculated, and the feature with the lower value is selected as the split feature. The calculation of the coefficient is made according to [
36].
where
i is the probability that category
j is in dataset
S.
- 2.
Calculate the split node by using (9).
where |
S| is the number of samples in the dataset and |
S1| and |
S2| represent the number of samples in the subsets [
36].
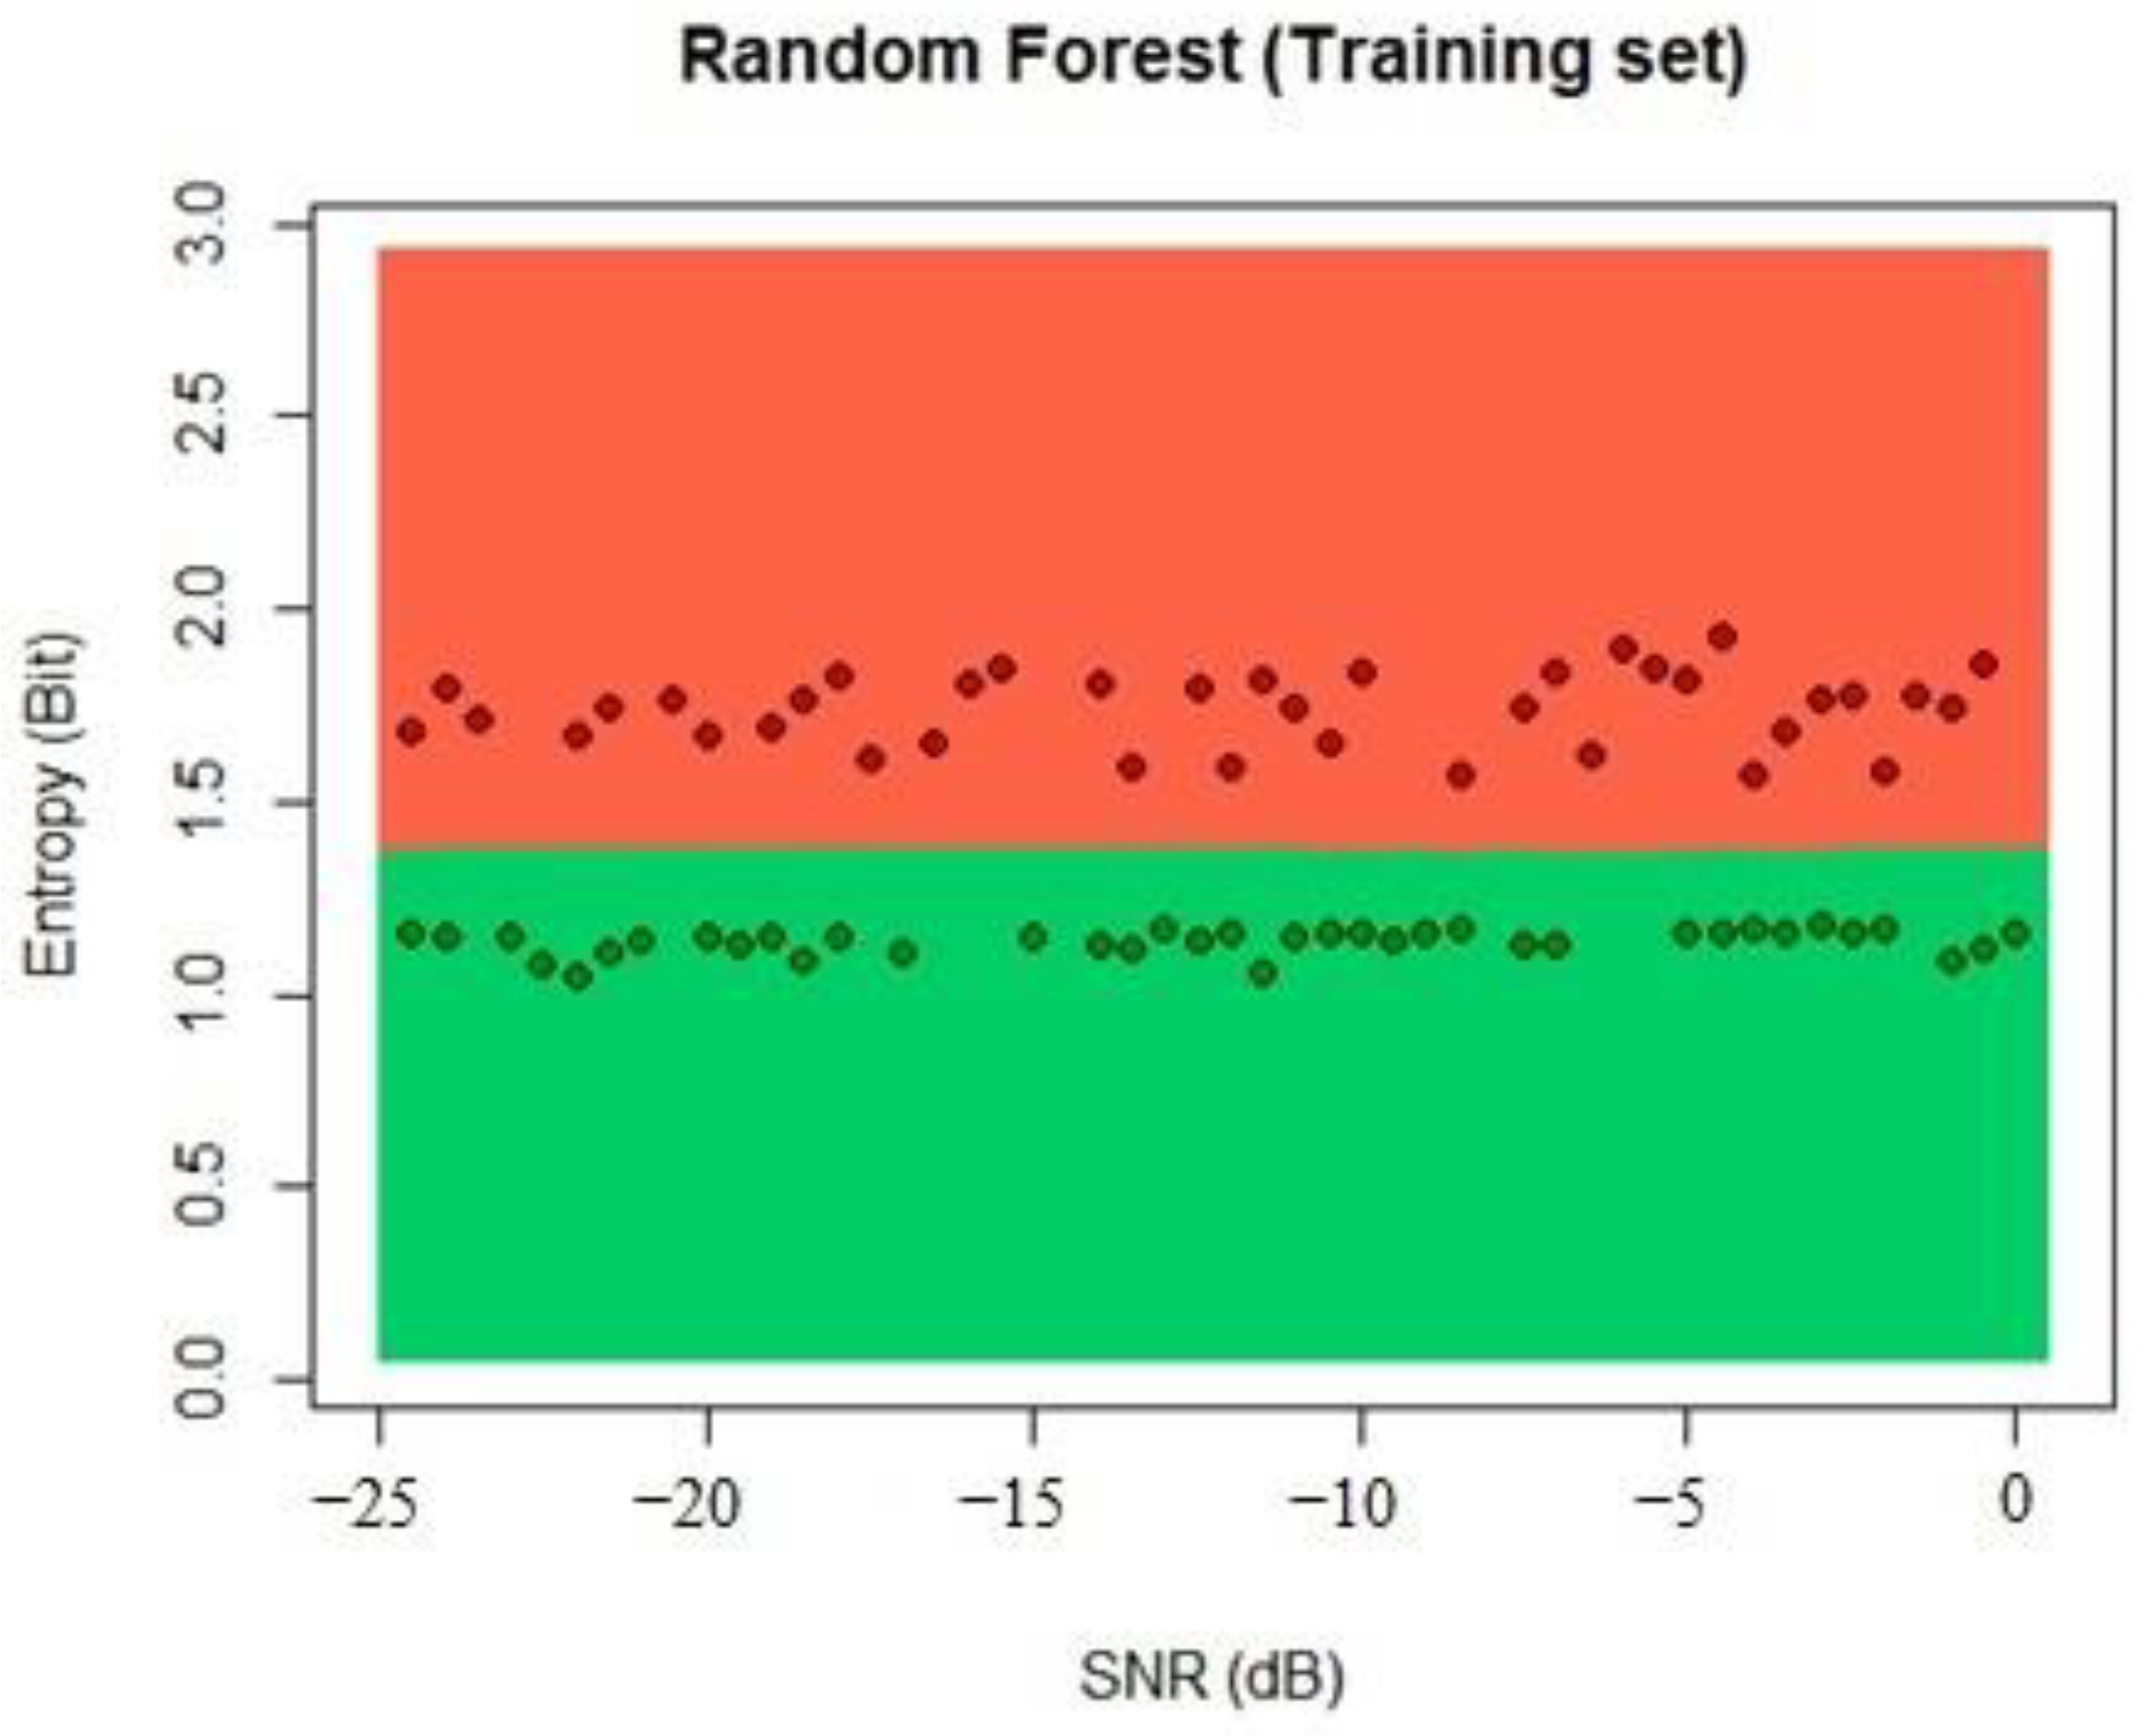
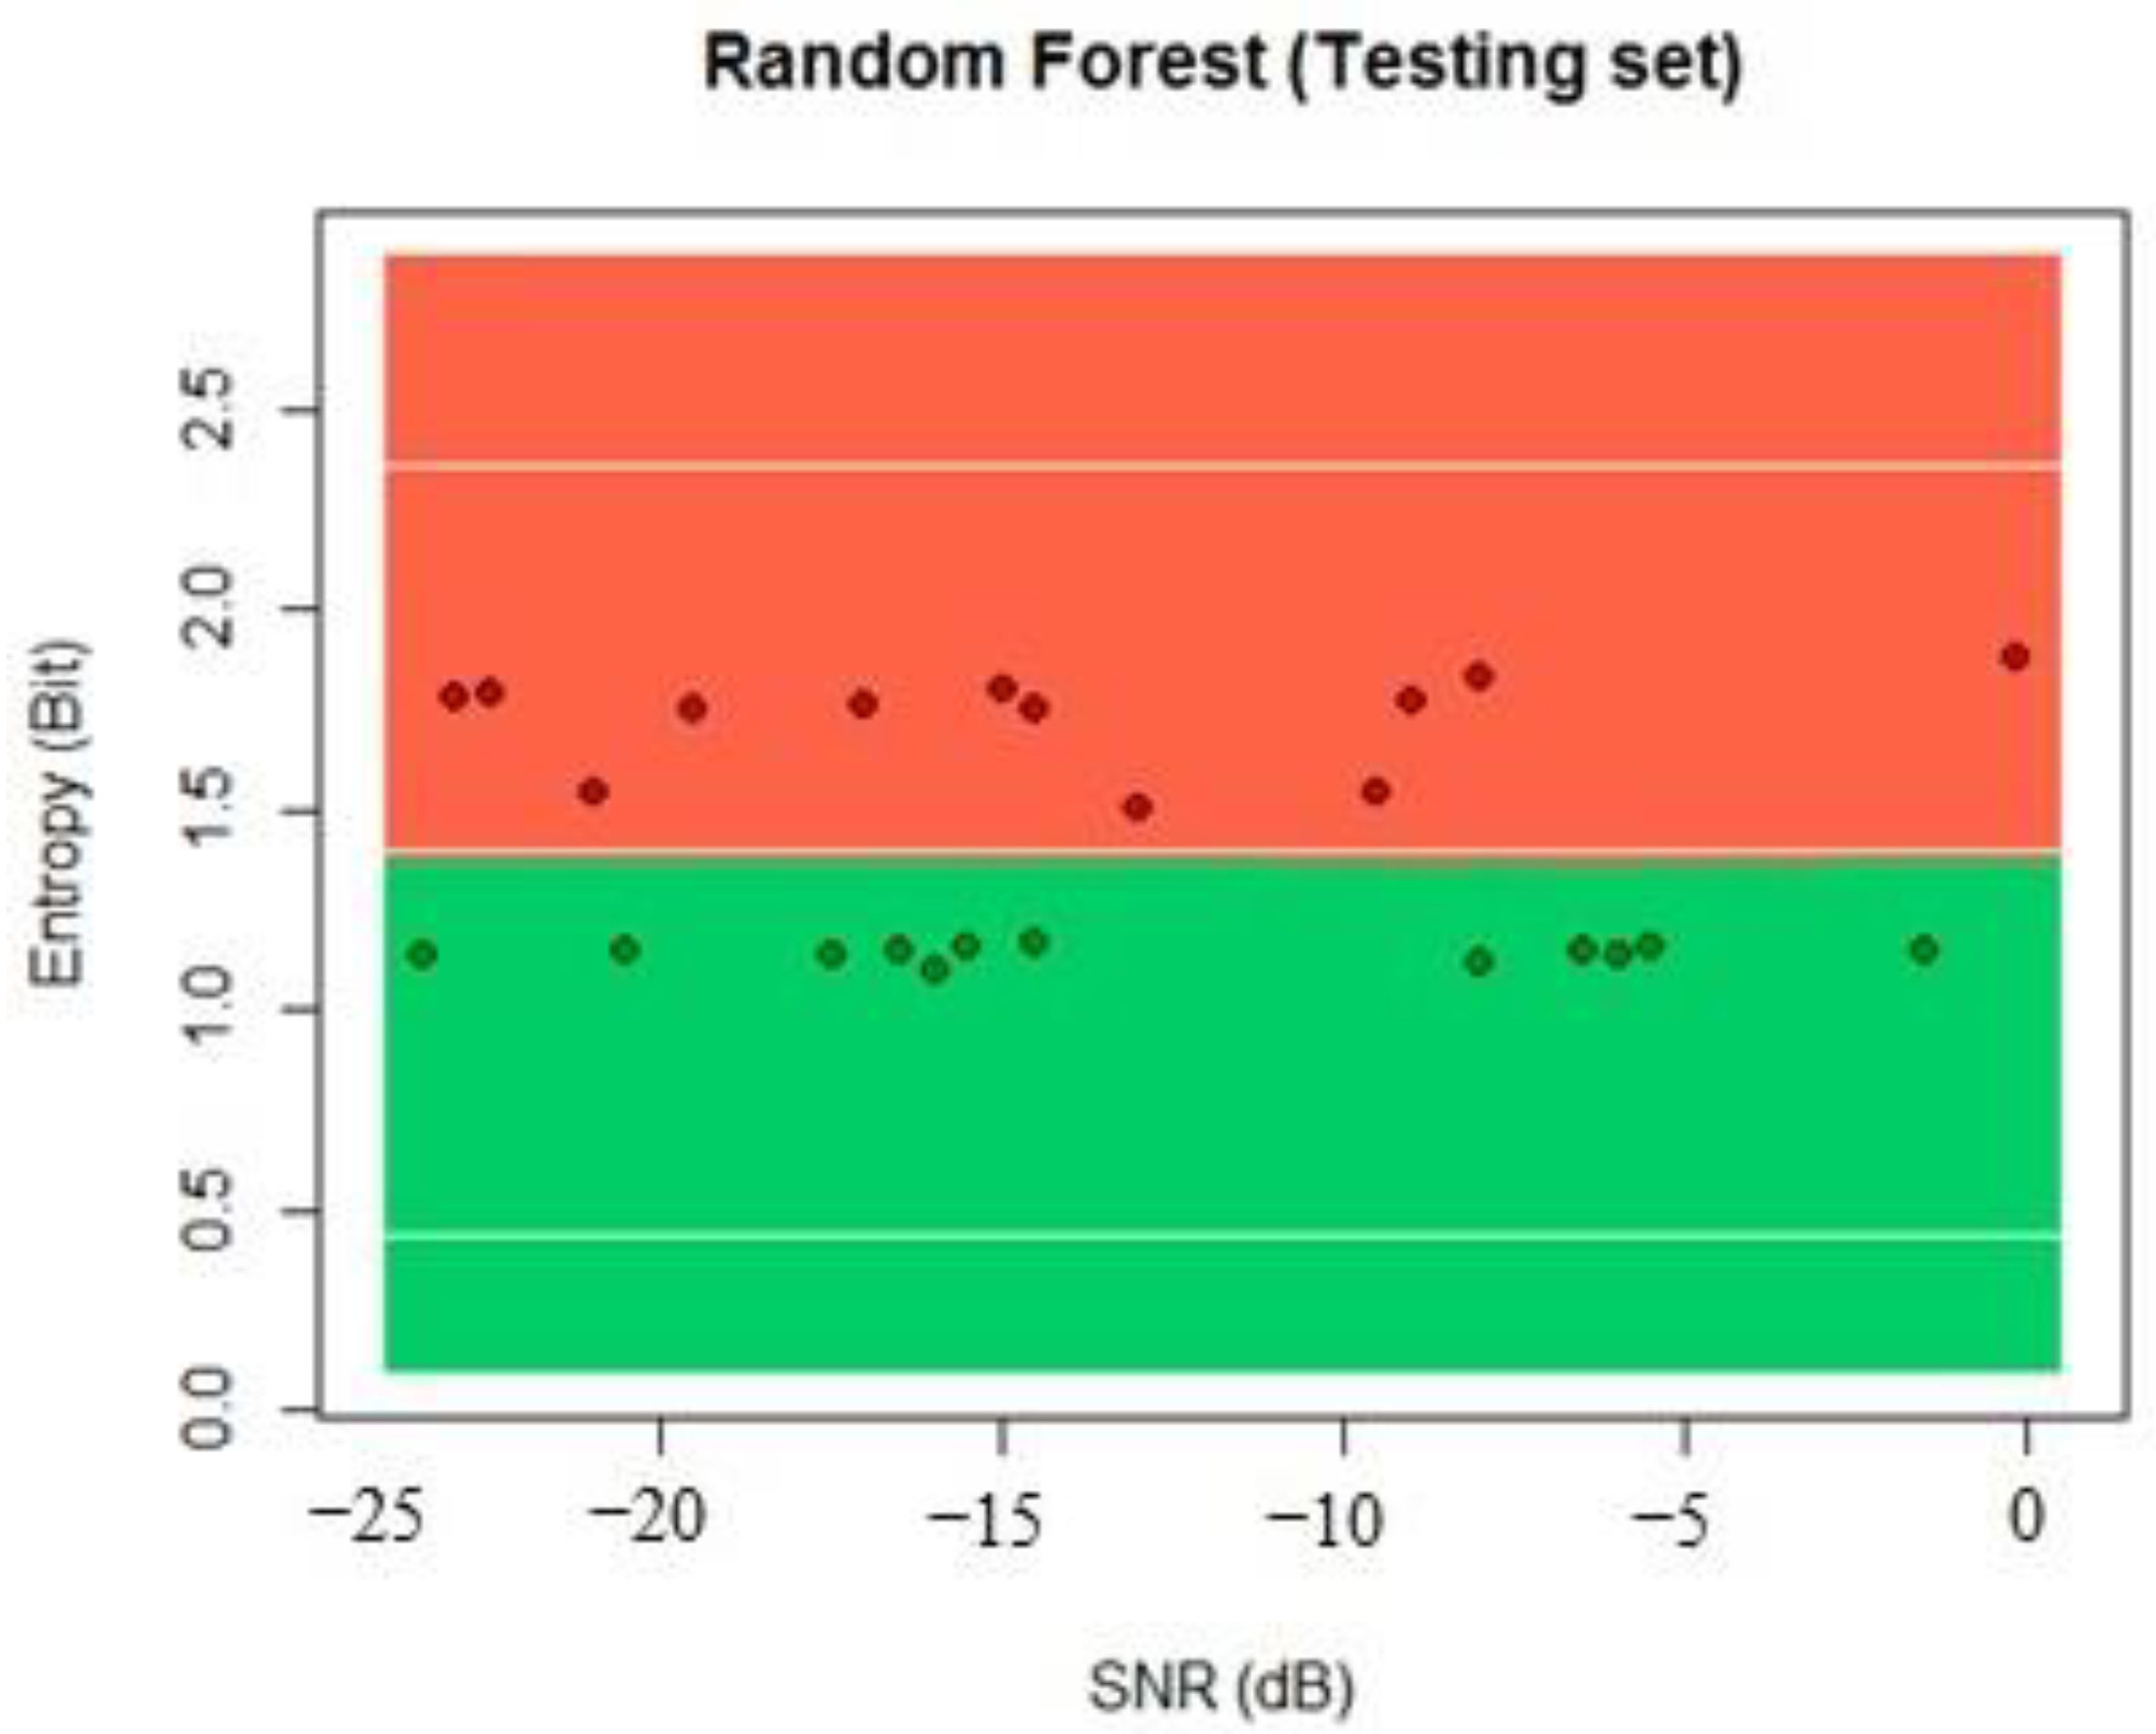
After the definition of the technique, the input data for the random forest are the estimated entropy of the received signal and the measured SNR, which are the features for the training of the random forest, with the same parameters for the splitting of 75% for training and 25% for testing. We choose 10 trees for the random forest, as is analyzed in
Section 4. The classification problem is to detect the PUE comparing the input parameters with the previous learning values and decide if there is a PUE present.
3.3.3. K-Nearest Neighbors
The KNN technique is based on the distance between the sampling point of data and the extracted data points of the known neighbors. The classification decision is based on the K-nearest sampling points. The process consists of the distance calculation between the sampling points and the new data; then, the closest neighbors are estimated, and finally, a classification decision is made. As with other M techniques, data are divided into the training set with N samples and M features and the testing set that is used to probe the algorithm performance. K is the number of neighbors used in the calculation [
37].
For the first step, there are several methods to calculate the distance between two data points (e.g., Euclidean distance and Manhattan distance, among others). The most common distance used in KNN is the Euclidean distance, which uses the sum of squared differences, as represented in (10) [
37].
Second, the distances are calculated and sorted, the K smallest values are extracted and selected for training data, and then the most common result in the samples is calculated [
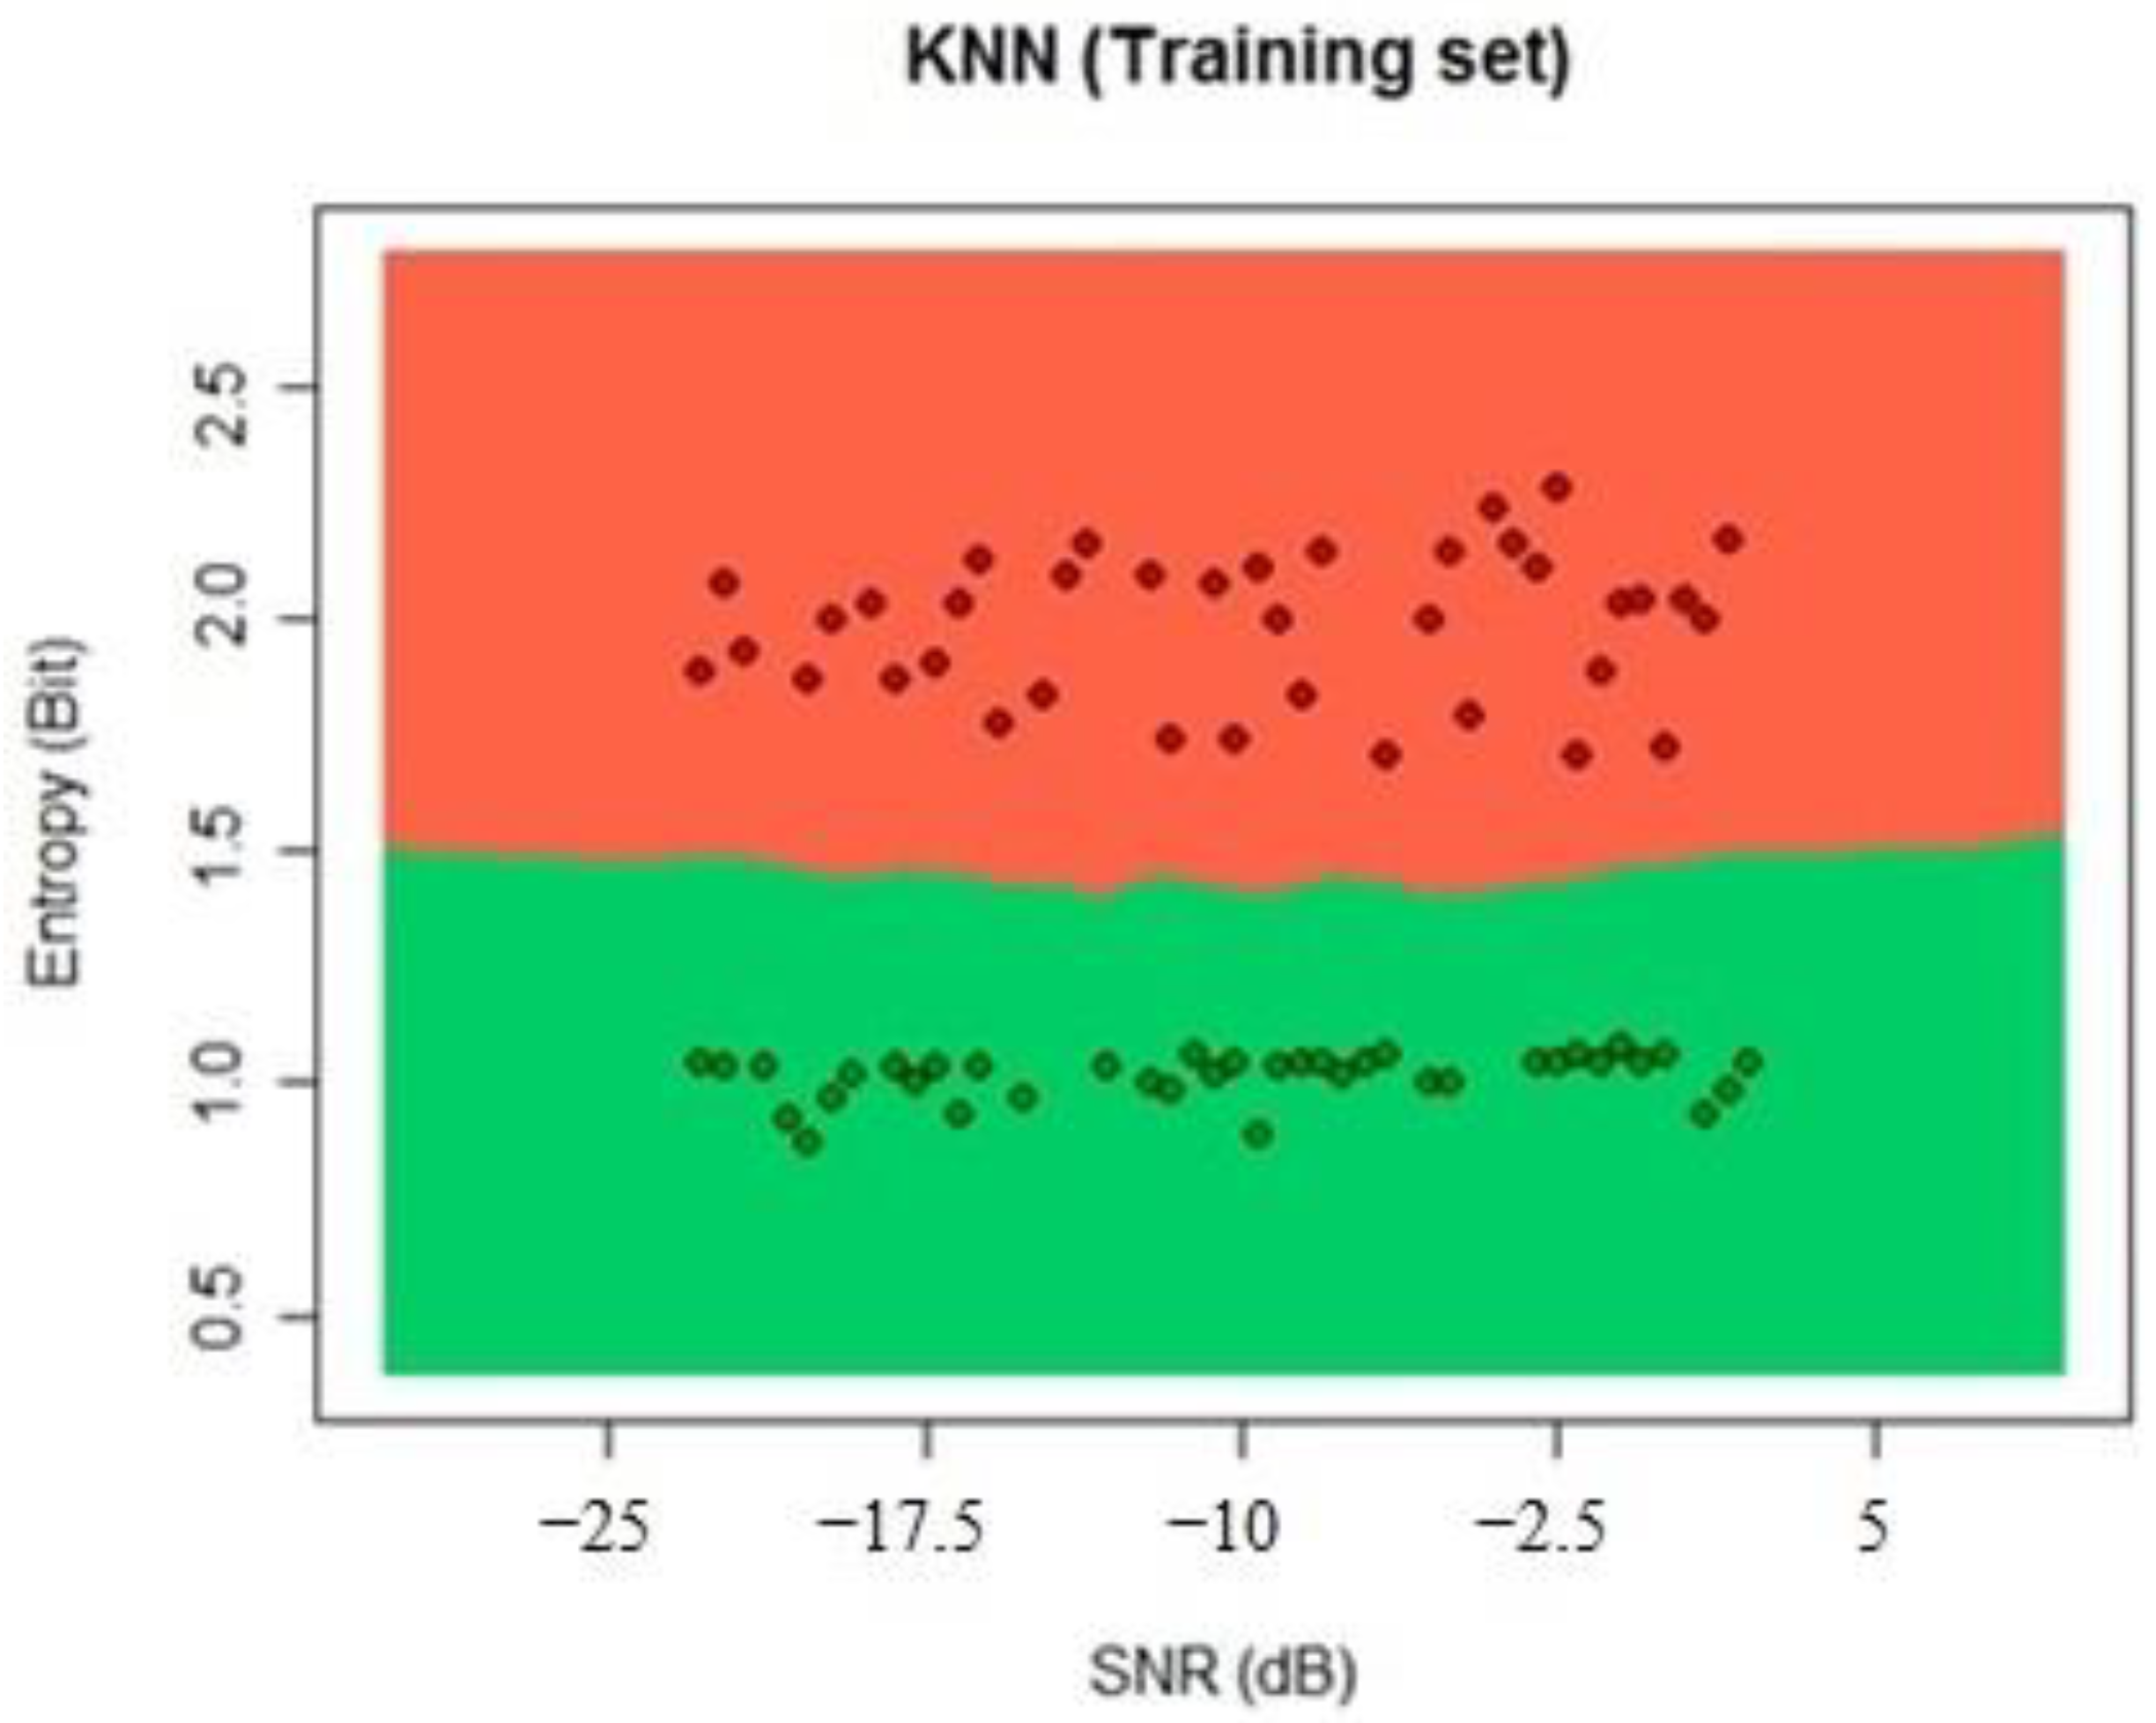
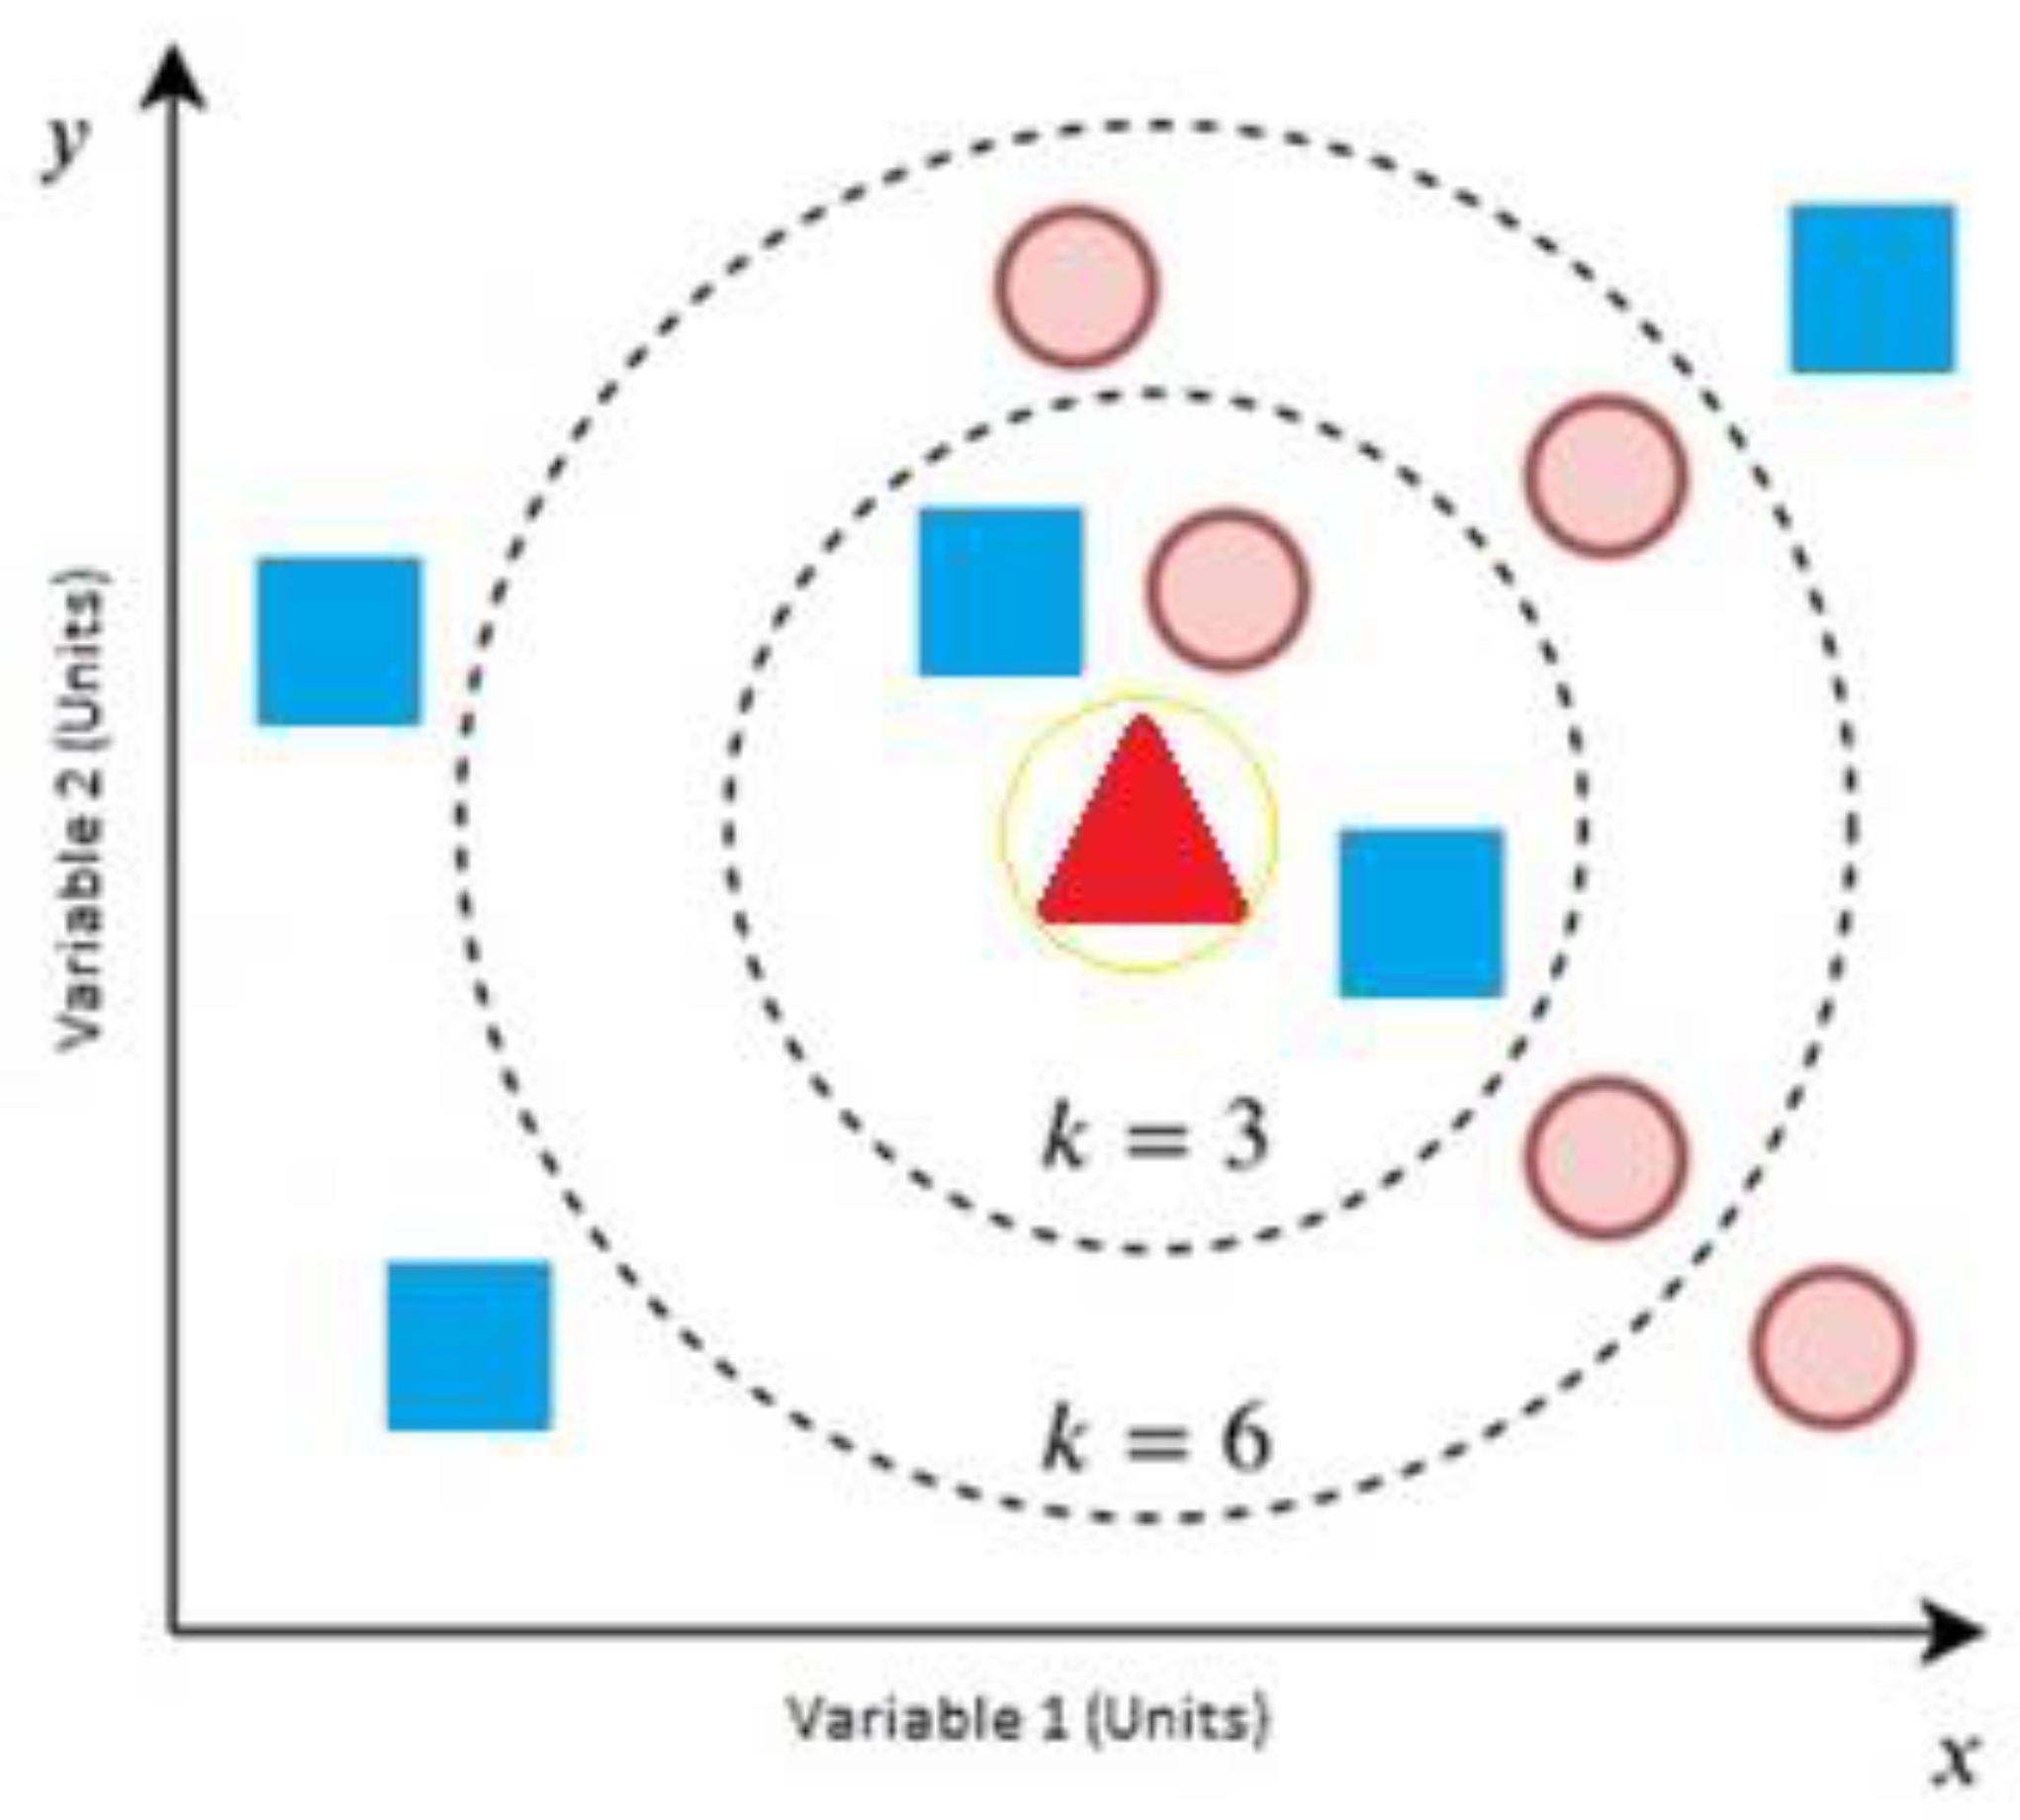
37]. An example of the KNN algorithm can be seen in
Figure 6—it is used to classify an unknown bidimensional sample (green) by using the training set with two variables, blue and red. As an example, if we select k = 3, most of the neighbors are blue, so the final decision is that the new data belong to blue. If we change it to 6, the result shows that most of them are red, and we have to take care in the selection because if we select an even value for K and the results for the two classes are the same, the algorithm will not make a final decision [
37].
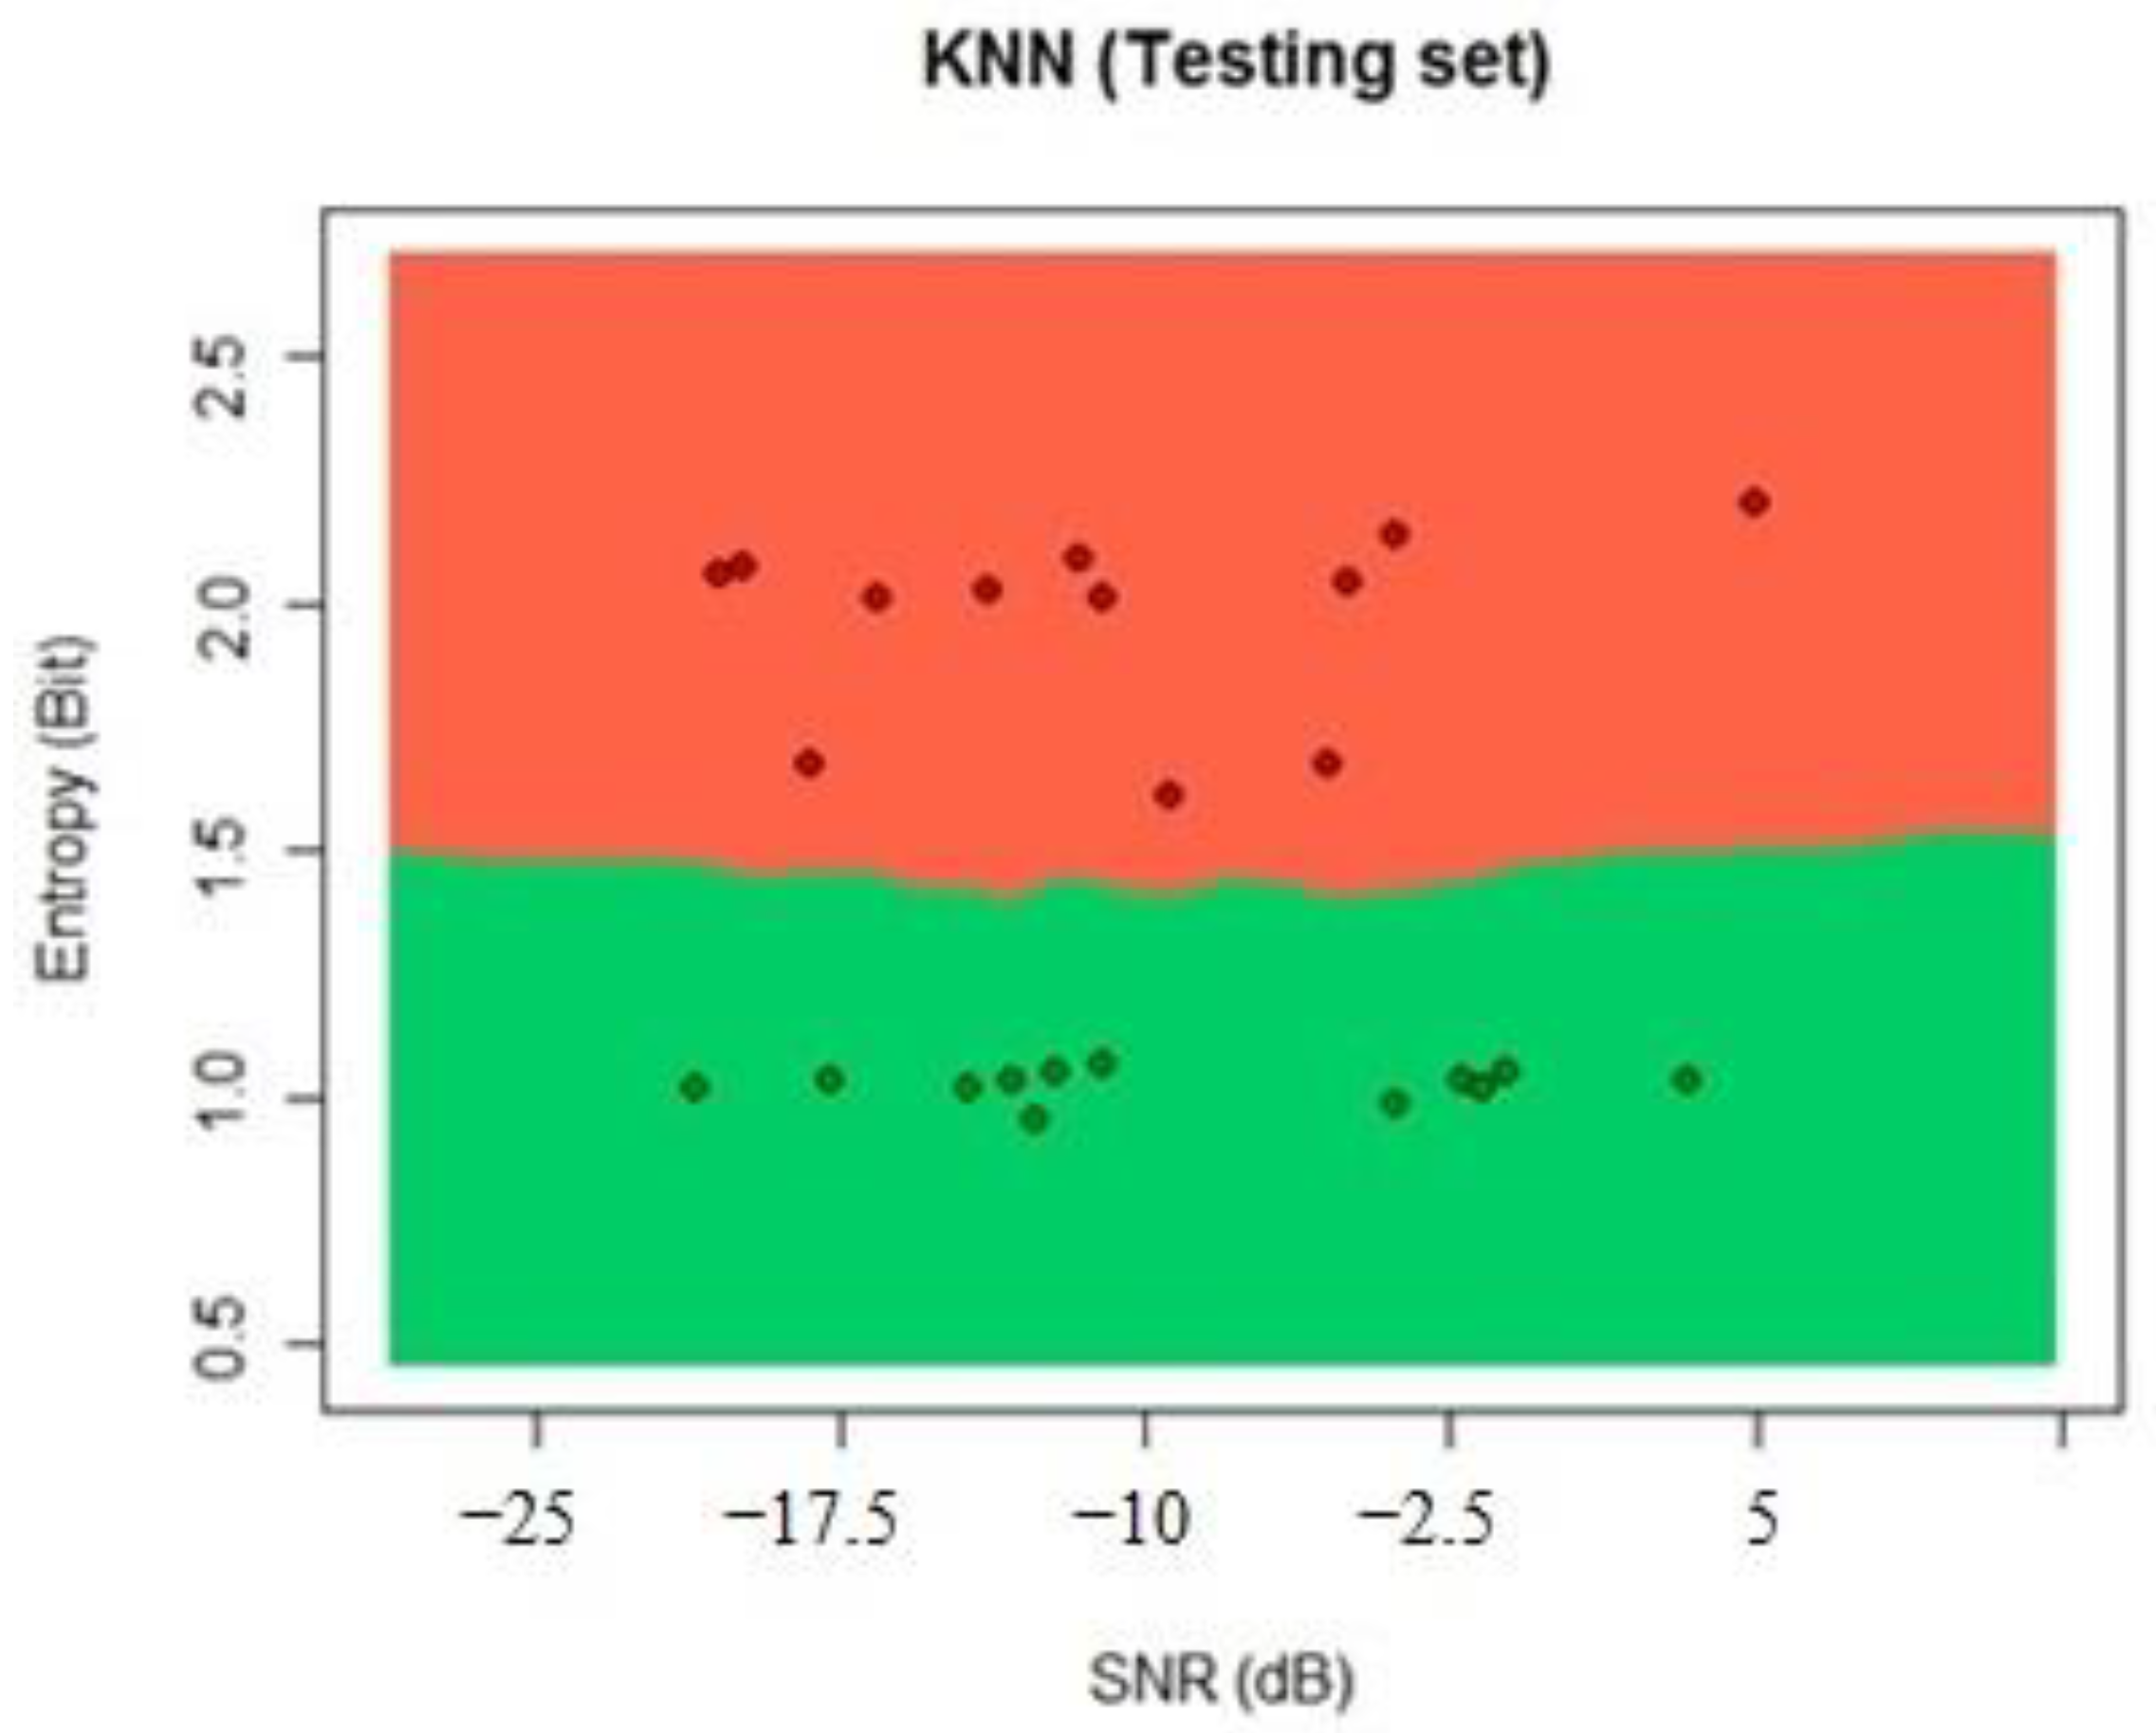
For this case, we used the estimated entropy of the received signal and the measured SNR as the input variables, and for each SNR value, we chose five neighbors to make a stable decision. The result shows whether a PUE attack is present or not by analyzing whether the neighbors have been identified as active or not in the previous learning process.
4. Experiments
We needed to capture the energy signal; for this purpose, we used an RTL-SDR 2832 device that is low-cost for spectrum analysis and is connected to a PC that works like an MCRN base station. For MCRN features, we used an NI USRP-2922 device with GNURadio software [
27]; this device emulates an MCRN with frequency hopping. The PUE was implemented in another device with the same features, and it transmitted a malicious SU signal in the chosen frequency. The uplink (UL) signal was used to measure the energy. The testbed can be seen in
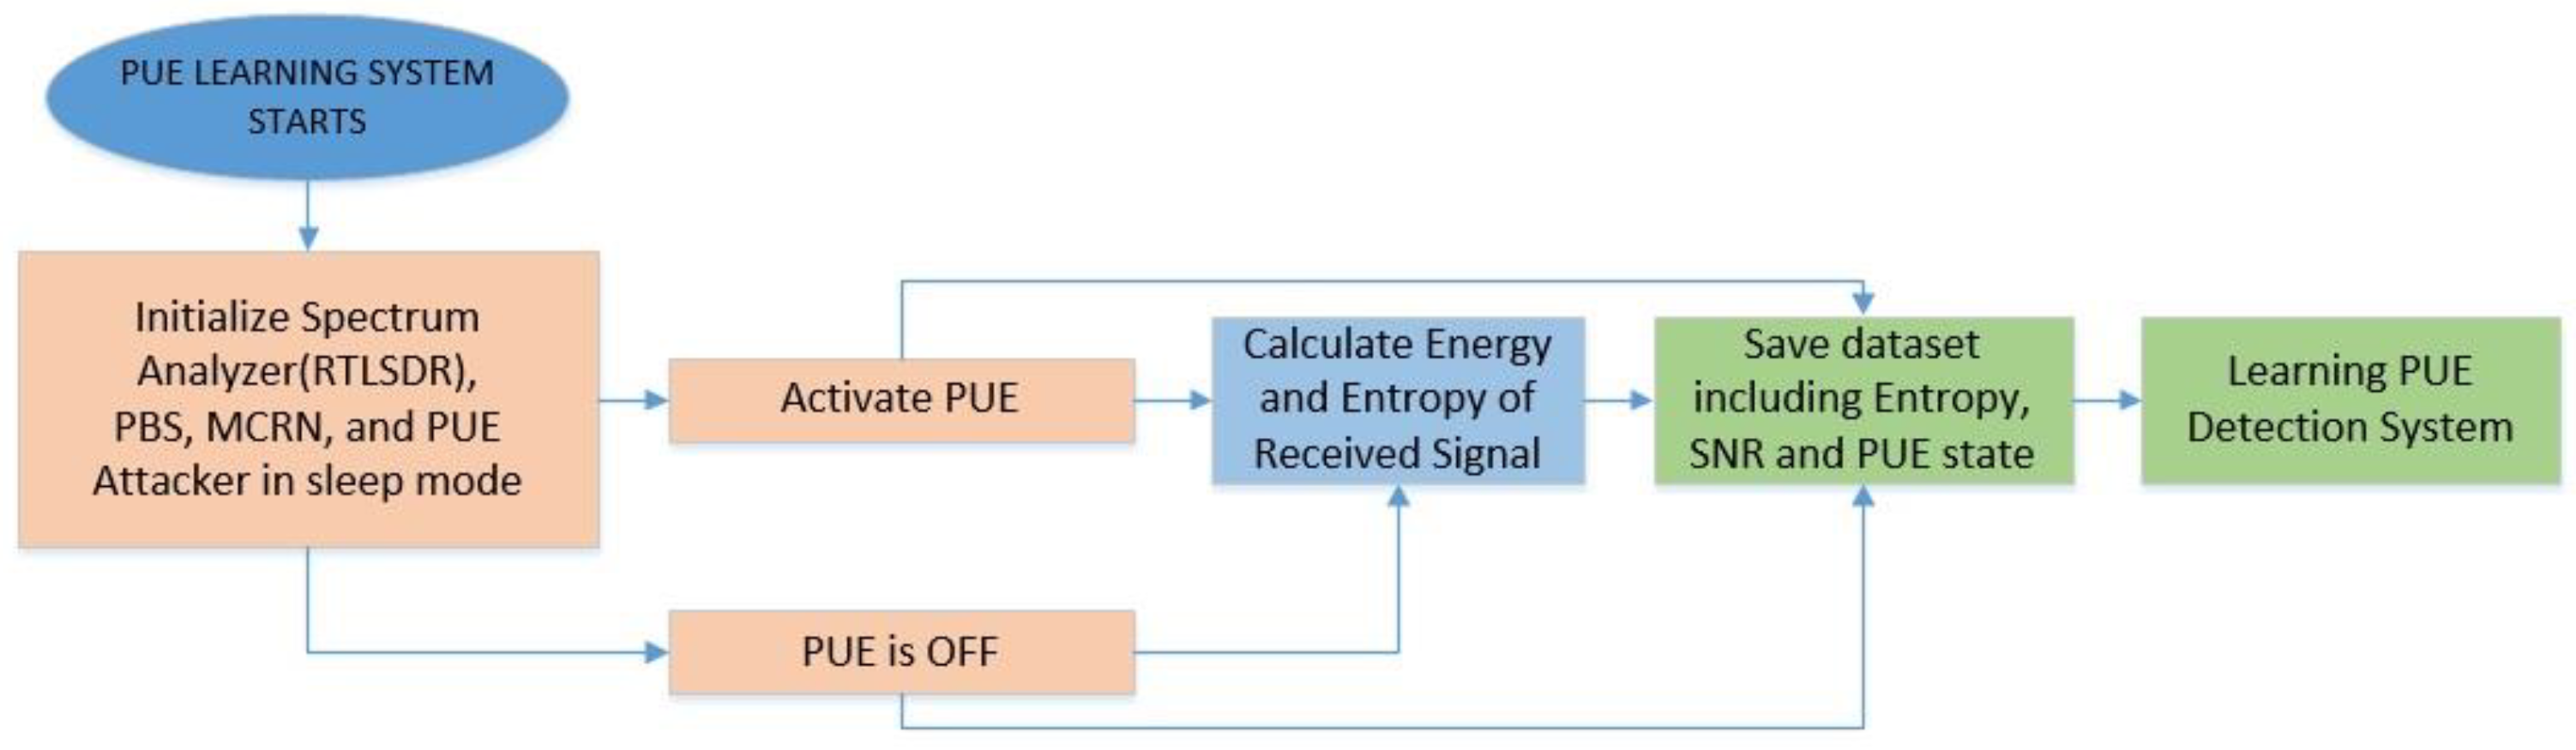
Figure 7.
In general, we can divide the ML techniques into two parts: the learning and the classification process. For the learning process, we configured the devices to read the samples of a real phone call of a local operator. We calculated the energy, the received entropy, and the SNR. These values were used for the learning algorithm of the three techniques. The energy was averaged from the RTL-SDR signals received. Then, entropy and SNR were estimated two times, when there was an active PUE and in the absence of the PUE. The protocol was configured to detect a PU signal and release the channel to avoid interfering with this PU. This part of the process is shown in
Figure 8.
RStudio [
38] is the software used for the application of the ML techniques defined previously. The ML algorithms were implemented using class, e1071, random forest libraries of ML, and the dataset was continuously updated. Python programming was used to configure the base station and the PUE attack and OpenBTS software for the real phone call emulation [
39]. Two midrange phones were used for the phone call, and all the algorithms were implemented on a PC working with Ubuntu 14.
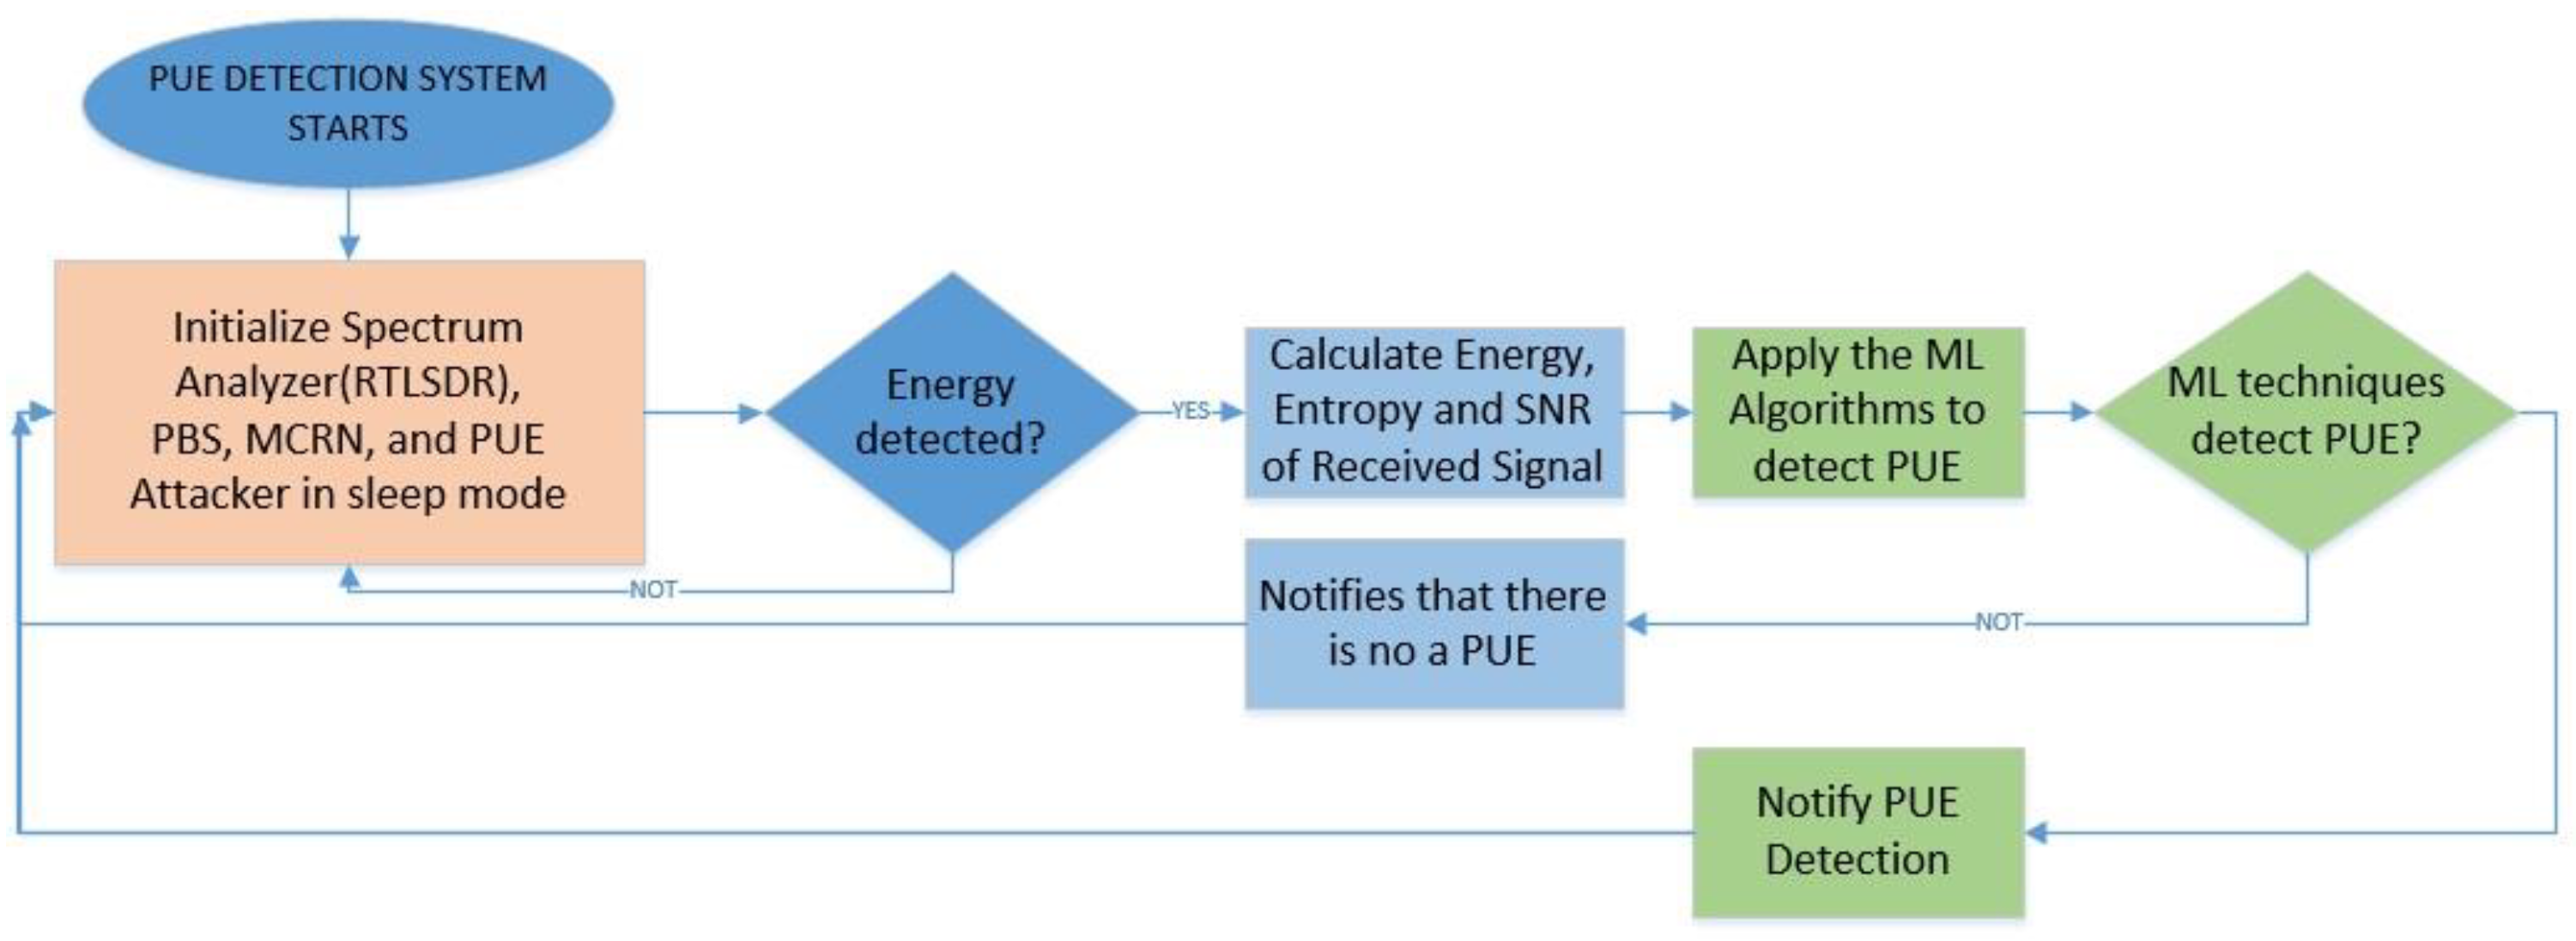
Once the learning process was completed, we continued with the detection of signals. For this process, each algorithm worked individually, and after a defined number of samples, it calculated whether there was a PUE attack present or not. We used the testing dataset to calculate the simulated probability of detection, and after all calculations, we estimated the detection with the real values when the PUE was active. This process can be seen in
Figure 9.
The learning process was made only one time, and after that, we updated the dataset that was used for the ML algorithm processing, obtaining a final value for each algorithm that showed if there was a PUE attack present. We were able to make the algorithms work individually or make a complete solution that compares the values, and with an AND/OR logic, we obtained a final decision. The results are analyzed in the next section.
6. Discussion
The obtained results using the ML techniques indicated that the proposed method increased the PD of PUE in real scenarios for MCRN, working better than a simple energy detector or even the entropy detector, compared with previous works [
11,
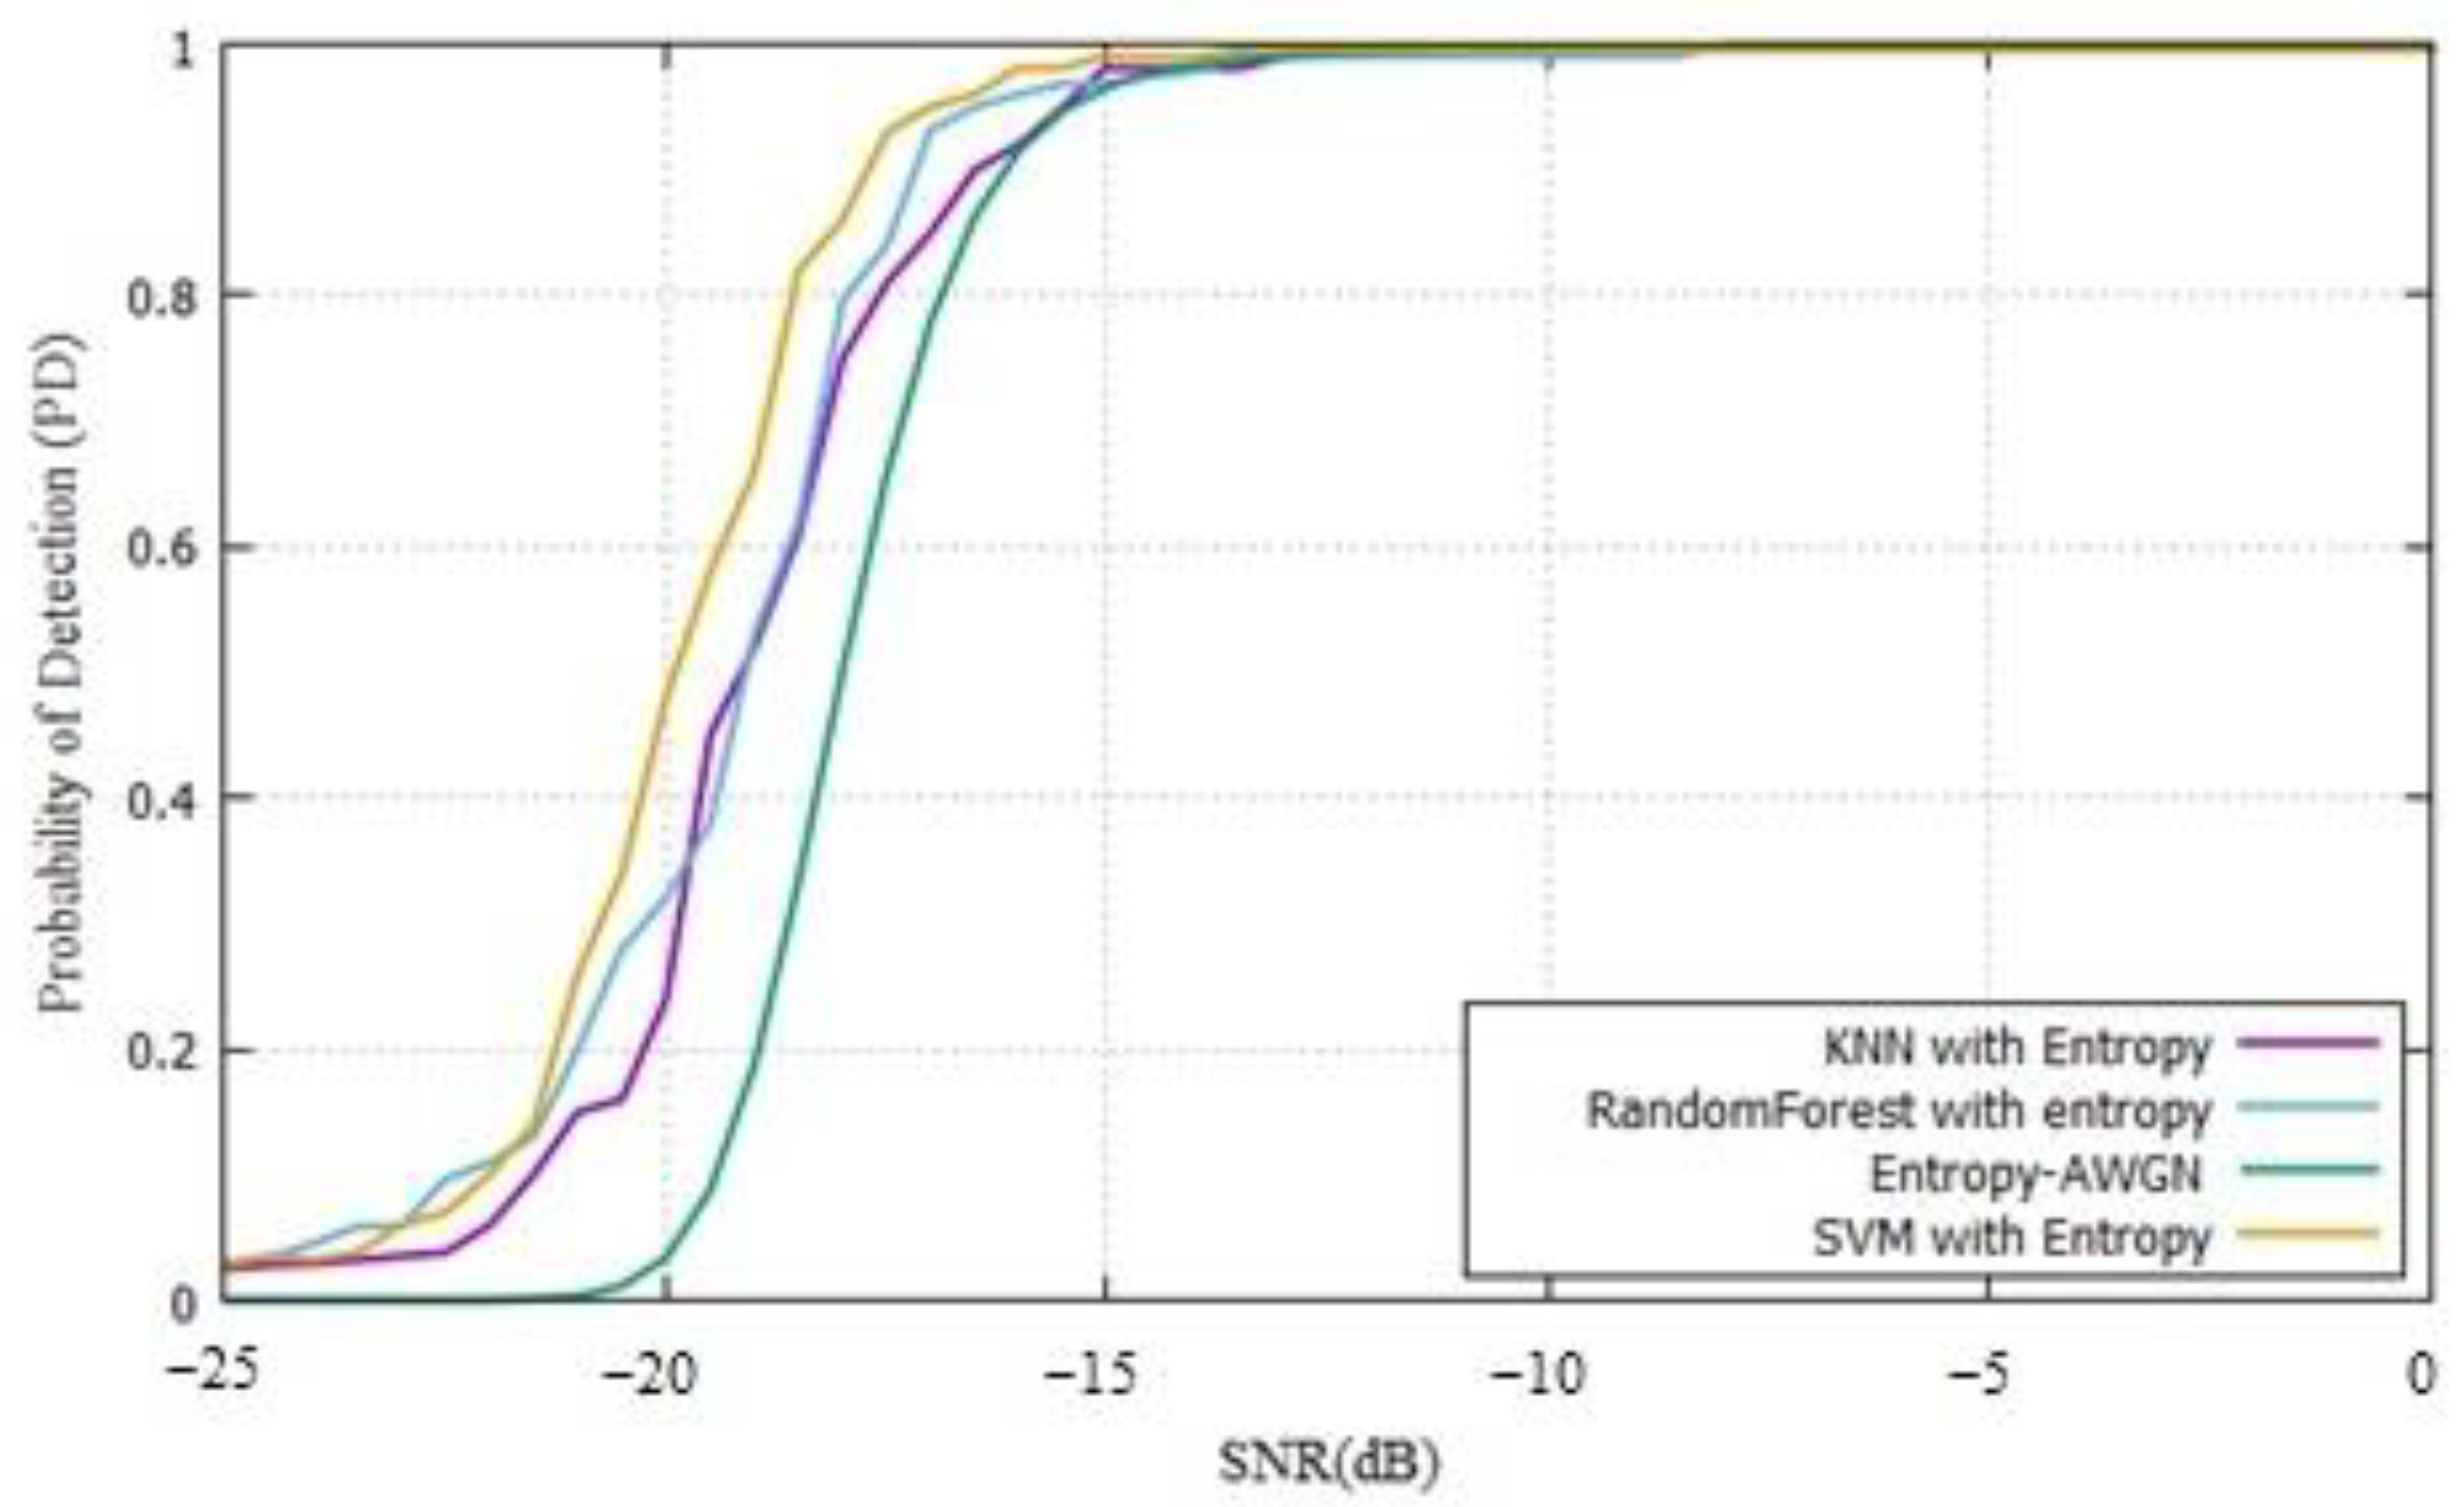
23]. The simulations used the same parameters found in the literature, and the results using the SDR showed that this solution worked even with low SNR values. A detection above 90% was found close to −18 dB, and with these results, the SVM worked better than other methods by 5%. The random forest and KNN results were very close and worked better than entropy by approximately 10%.
This solution worked better than energy detection because we did not have to measure or calculate a threshold and it was less vulnerable to noise. The three algorithms ran in a PC with Linux, and the computational complexity was medium in the first part of the learning process but low in the real-time detection because it made a comparison with the previous learning and classified the signal as a PUE attack or not. The fusion of the three techniques in OR logic worked better than individual approaches and allowed us to find a PD of 90% at −18 dB.
In the experiments, our solution worked better than the time arrival or localization methods because they were based on the received energy from a PU with a fixed location, but in the case of an MCRN, PU and SU were in movement, which was why these methods led to a low probability of detection. Due to the entropy calculation, our solution did not depend on a threshold and worked better in lower values of SNR and with users in movement. We emphasized that unlike other works, ours was implemented in SDR equipment and with real phone calls and PUE attacks to check the effectiveness of the detection and the system. After the learning process, our SDR testbed can detect PUE attacks very fast, protecting the licensed PU.
7. Conclusions
Machine learning techniques can be used to classify the presence of a PUE attack in an MCRN. Our work was probed in an indoor environment, and it achieved higher percentages of the probability of detection with a low complexity system that worked even with lower SNR values. The classification process obtained high values of classification because in this case, we worked with two features and they were linearly separated thanks to the use of entropy instead of energy for the PUE detection.
The results showed that the ML techniques were above the energy or entropy found in the literature, and an estimated PD value of 90% can be obtained at −18 dB. The energy detector was 12 dB above and 3 dB over the entropy detector. SVM worked 5% better than other ML techniques and KNN, and random forest worked better than entropy by 10% in terms of PD.
The experiments showed that an MCRN can be achieved in an SDR device, and with the modification of the source code, they can exploit the CRN capabilities. The PUE attack was replicated in this network, and with these techniques, it can be detected with high probability values, securing the PU networks and devices. Our solution worked better than energy, location, or entropy detection techniques in the literature, and it was implemented in SDR devices testing the detection time and the probability of detection with a phone call in MCRN.


