
An Extended Usability and UX Evaluation of a Mobile Application for the Navigation of Individuals with Blindness and Visual Impairments Outdoors—An Evaluation Framework Based on Training


Abstract
:1. Introduction
1.1. Background
1.2. System Description
1.2.1. Design Process
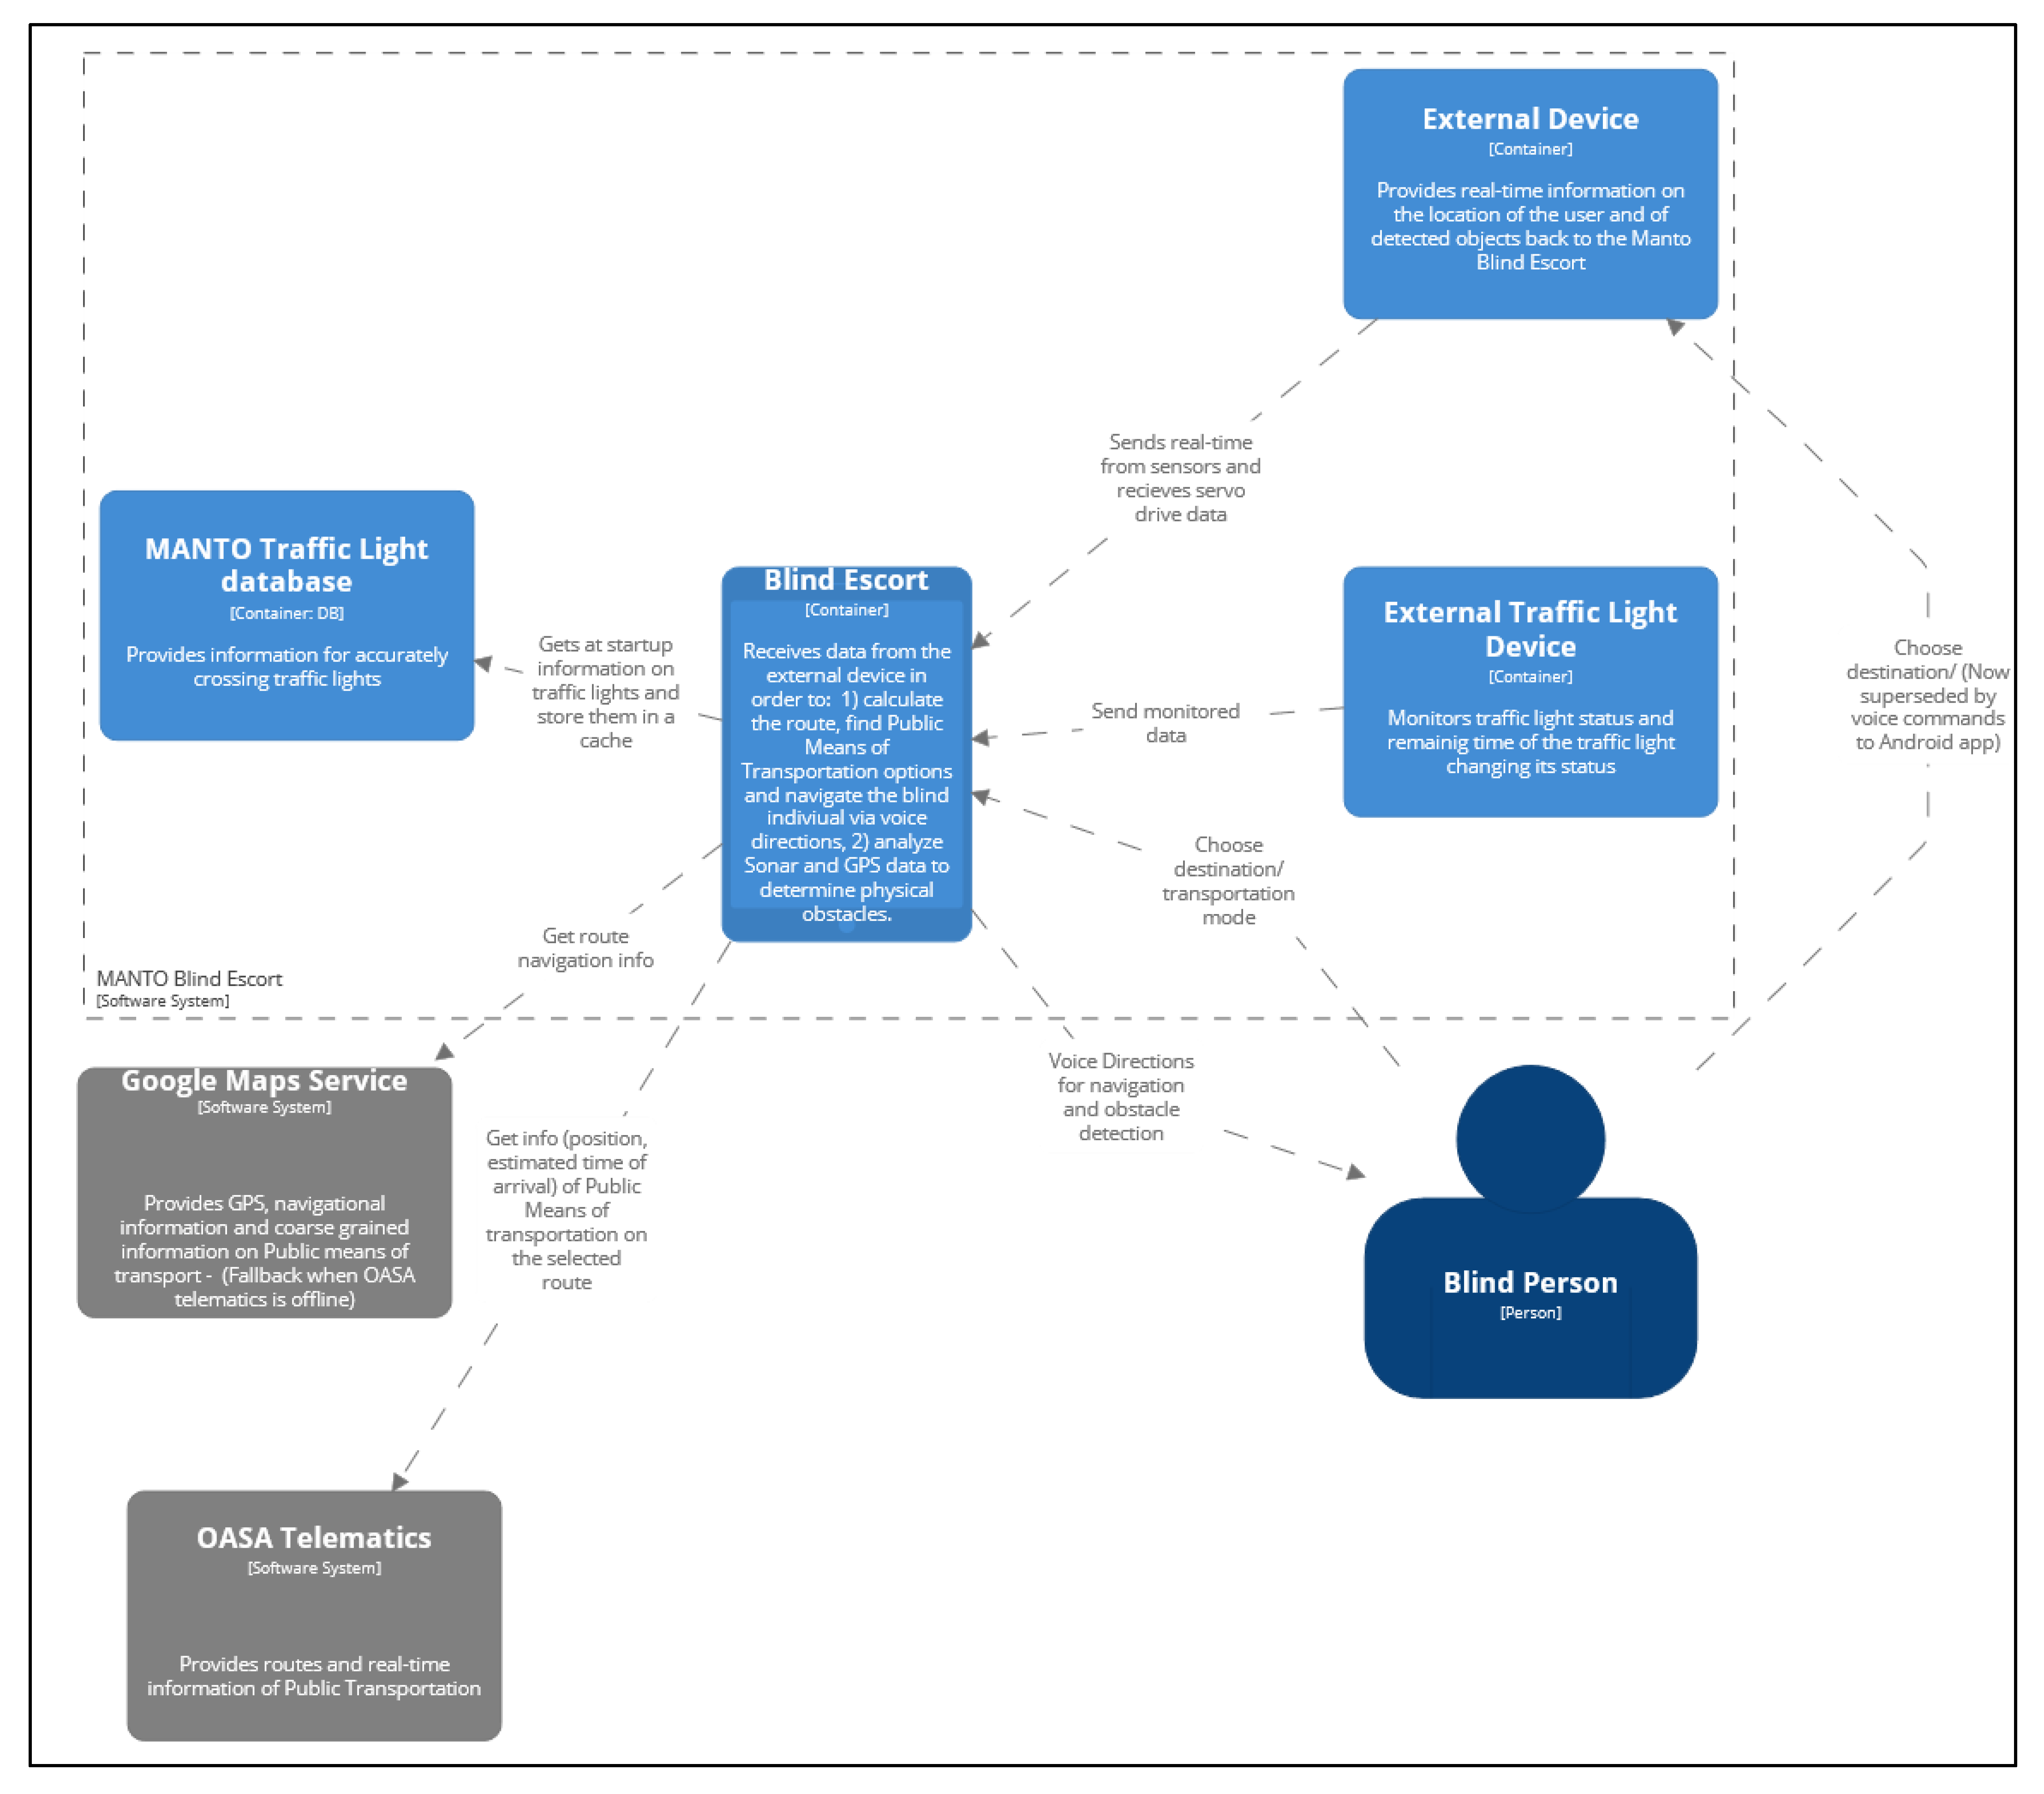
1.2.2. Subsystem Interaction
1.2.3. Tracking—Navigation with Great Accuracy Exploration of the Application
1.2.4. Real-Time Voice Instruction Scheduler
- Corner: it concerns the case of an upcoming turn with the highest priority.
- NavigationFlowCritical: It concerns the case of an instruction of critical importance. It is mainly used for instructions that help users to recover from an error back to the correct navigational path, leveraging the vector of the user’s path. It is classified as an interrupt job.
- NavigationFlow: It concerns the case of non-critical instructions. It is commonly used for instructions that guide the user to continue without any change, for example, “Continue straight”.
- TransitFlow: it concerns the case of instructions relevant to the Public Means of Transport.
- Summary: It concerns the instructions relevant to informing the user of the major navigational events along the route to the destination. This information is the first instruction issued by the application before starting the navigation.
- The voice instruction “the bus will arrive in 3 min” is not issued when the time has elapsed.
- The voice instruction “Continue straight on” is not issued after a critical change voice instruction that prompts the user to return to the correct navigational path due to deviating from the navigation vector.
- When the voice instruction remains the same for a long period, for example “Continue straight on” in the case of a long straight, the scheduler limits the frequency by which it is selected for emission in order to prevent the user from being overwhelmed by instructions void of utility.
1.2.5. Great Accuracy and Tracking Density
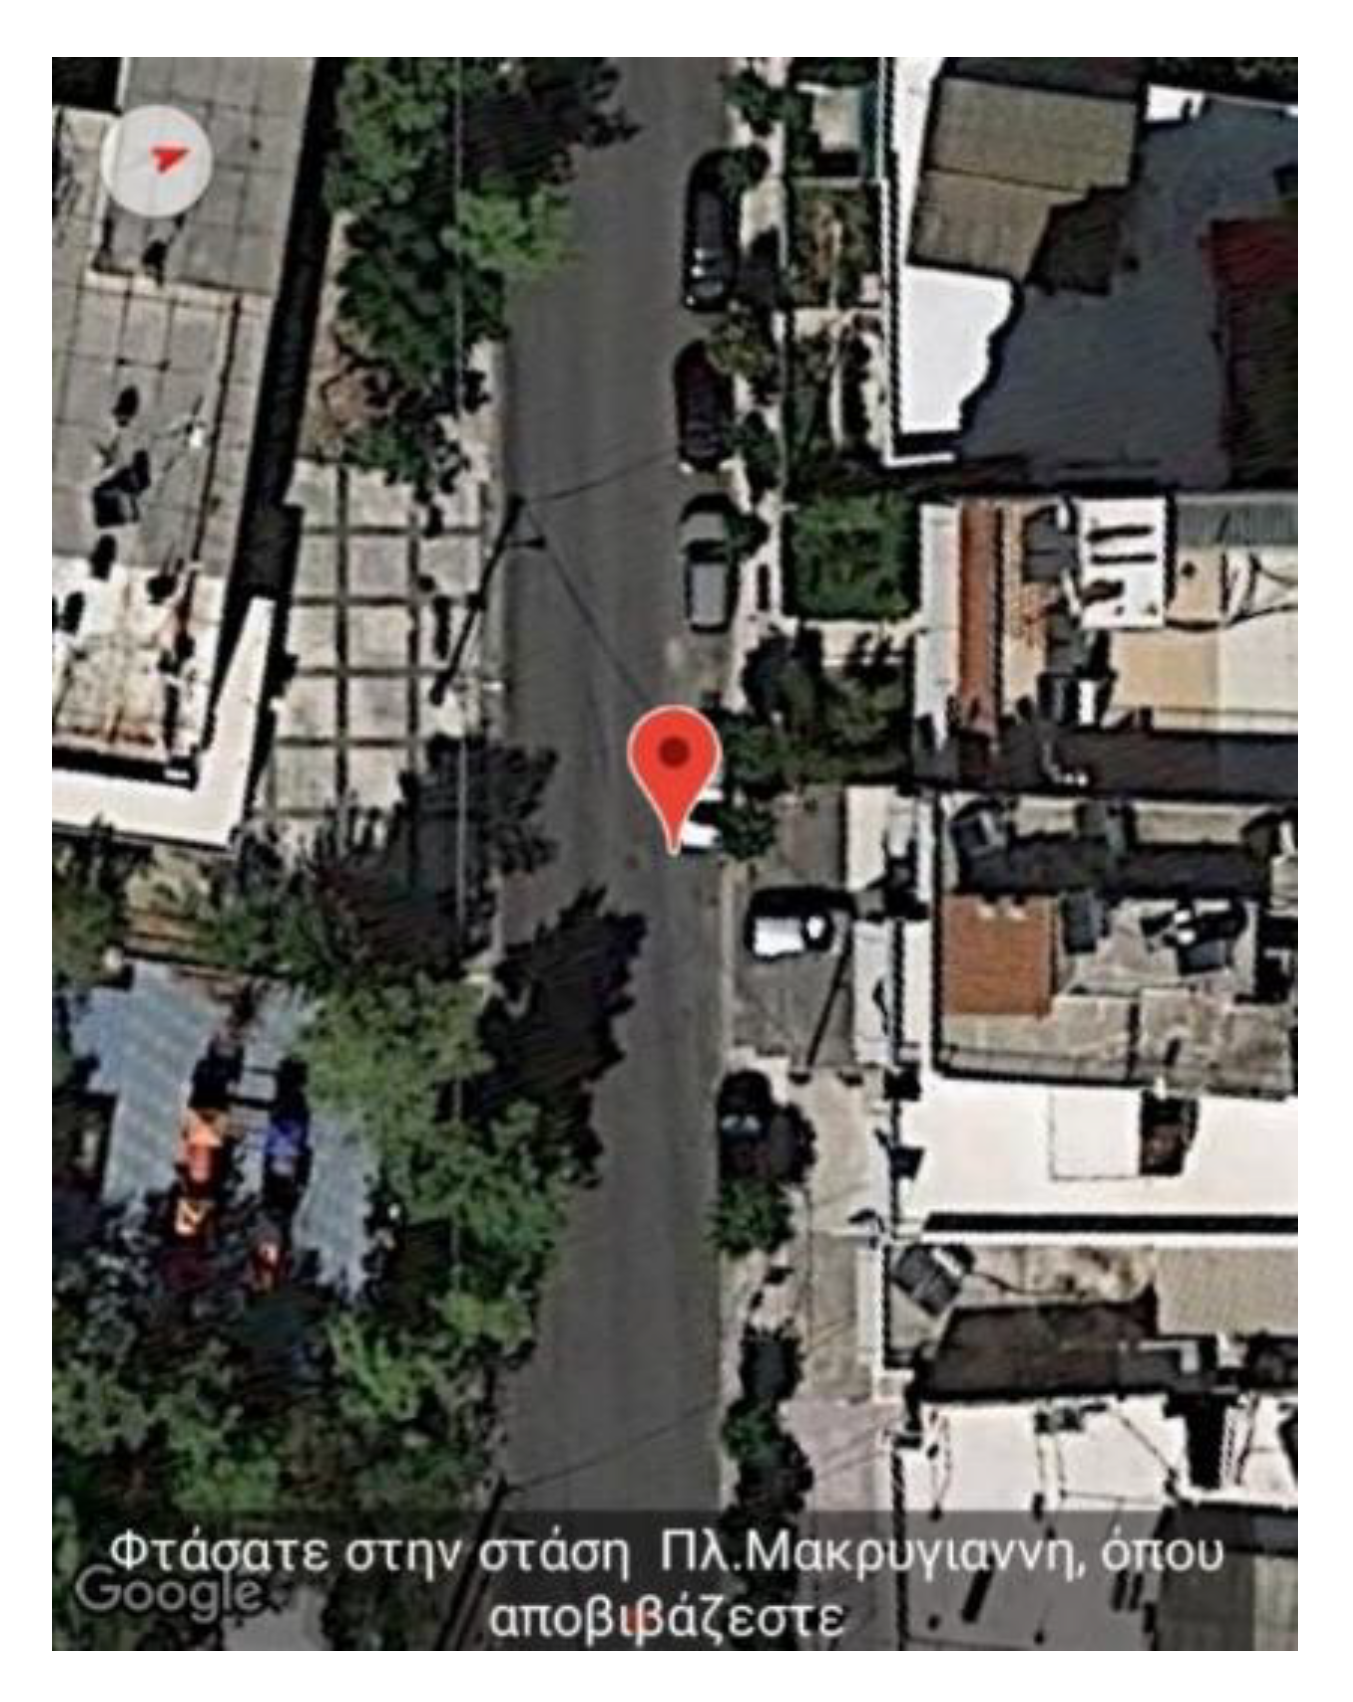
1.2.6. Navigation Route Combined with Public Means of Transport (Buses)
1.2.7. Passing Traffic Lights Crossings with Safety
2. Materials and Methods
2.1. Usability—User Experience (UX) Methodology
- Effectiveness—measures the degree to which users can complete a task.
- Efficiency—measures the time it takes users to complete a task.
- Satisfaction—measures, subjectively, the quality of interaction with the application.
2.2. Usability—Metrics for Effectiveness and Efficiency
- First task: completion of a pedestrian navigation route—this task demands the user to successfully complete both known and unknown itineraries that do not include the use of public means of transport or passing traffic lights crossings.
- Second task: combining pedestrian navigation with public means of transport (entering and exiting the bus)—this task demands that the user successfully complete the following steps:
- arriving at the bus stop
- leveraging the information emitted for being aware when the bus arrives
- entering the bus
- activating the public means of transport mode of operation by pressing the given interface element
- exiting the bus at the correct stop
- Third task: passing marked crossings near traffic lights—this task demands from the user to pass a traffic light marked crossing in time.
- First task:
- Completion: successful termination of the navigation despite any errors made during the trial.
- Error: the user giving up the attempt or asking for help from the research team counts as an error.
- Second task:
- Completion: successfully completing the steps described above.
- Error: if one of the steps described above is completed with the help of the research team or the user gives up, then it counts as an error.
- Third task:
- Completion: successfully passing a marked crossing close to a traffic light.
- Error: if the user gives up or asks for assistance from a member of the research team, then it counts as an error.
2.3. UEQ+ Standardized Questionnaire
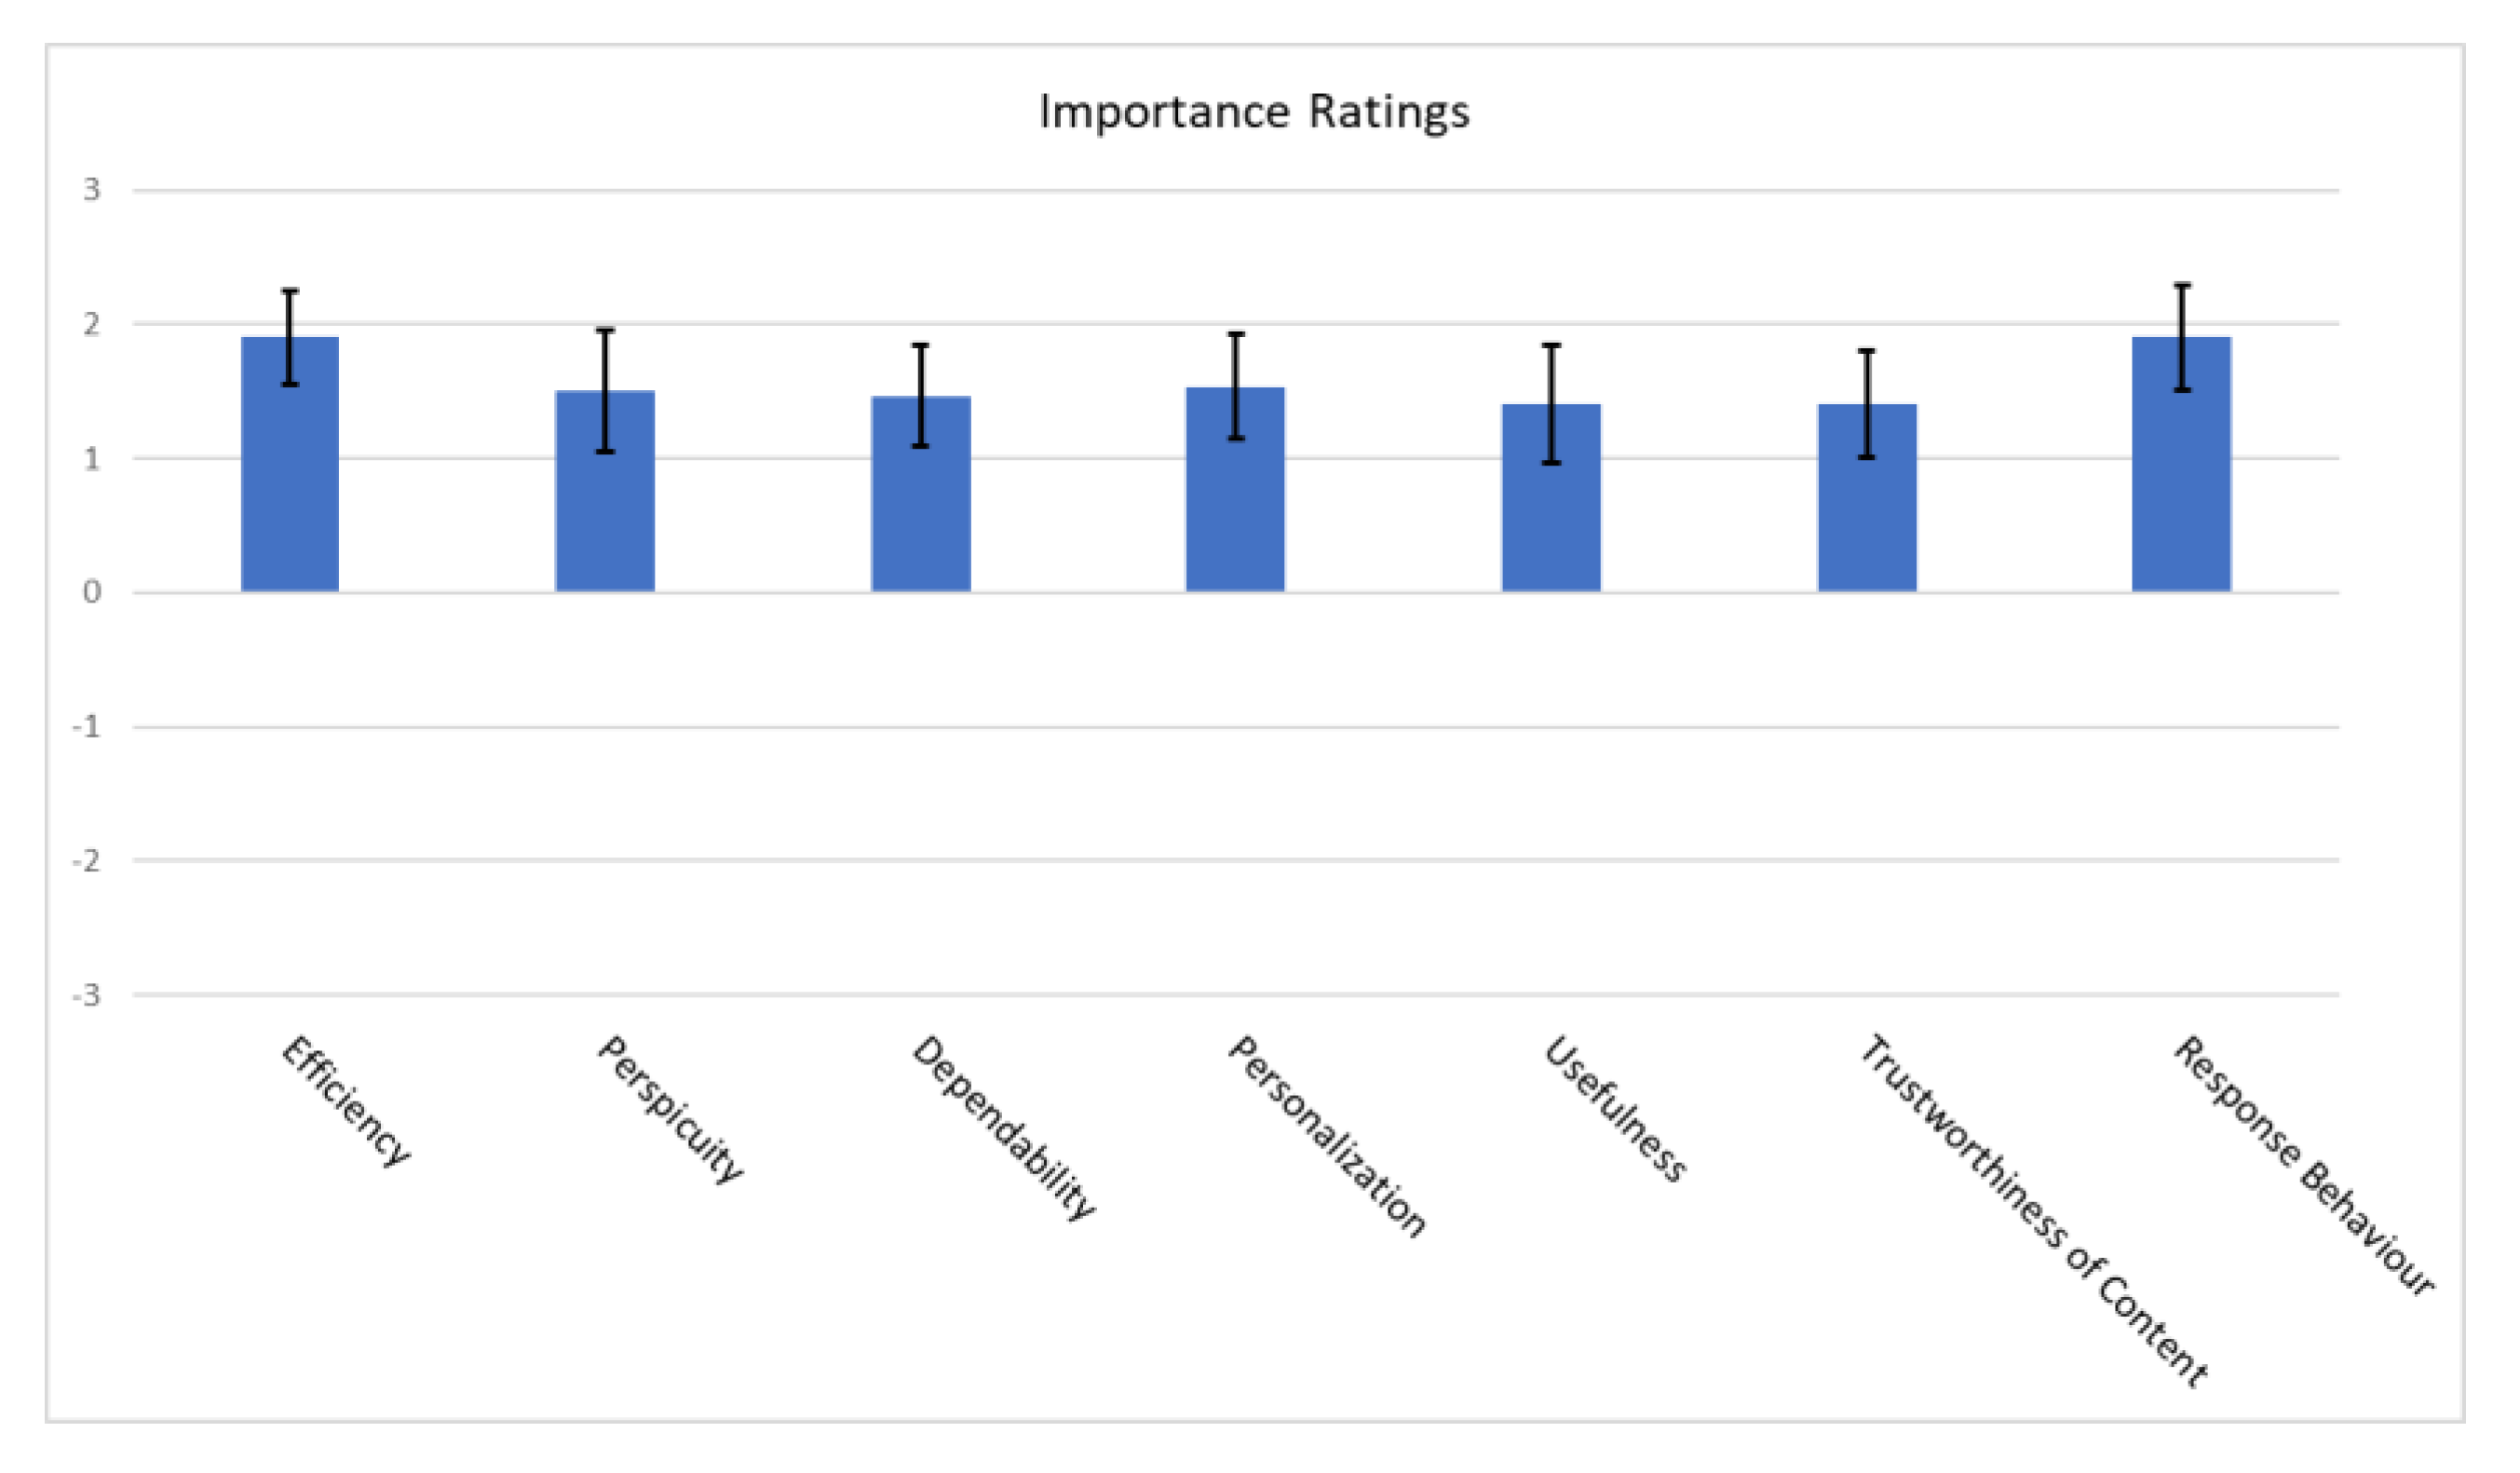
- Efficiency: this scale evaluates the user’s subjective impression as to whether he/she must put in the minimum effort required to achieve the desired goal as well as how quickly the application reacts to the user’s actions.
- Perspicuity: this scale evaluates the ease with which users become familiar with the application and how easily they can learn it (educability).
- Dependability: This scale evaluates the subjective impression that the user has on the predictability and consistency of the system’s response concerning its instructions and actions. In other words, it examines whether the user controls the interaction with the application.
- Adaptability: this scale evaluates whether the application can be adapted to the personal preferences of the user as well as how easily and quickly this adjustment process is done.
- Usefulness: this scale evaluates the advantages that the user perceives in terms of achieving his goals, how much time he/she saves and whether it increases his/her efficiency.
- Trustworthiness of content: this scale evaluates whether the content of the instructions provided by the application is of good quality and reliable.
- Response behavior: this scale evaluates whether the response from the voice assistant is friendly and pleasant to the user.
2.4. Semi-Structured Questionnaires
2.5. Description of the Evaluation Setup and the Interview Participants
2.5.1. Personal Characteristics Questionnaire
2.5.2. Exploration of the Application
2.5.3. Pedestrian Navigation Tasks
2.5.4. Usability, UEQ+ and Semi-Structured Interviews
2.5.5. Recording of Trials
2.5.6. Evaluation Process
3. Results
3.1. Completion Rate during Evaluation Activities
- Total # οf tasks completed successfully = # of tasks “Completion of a route” + # of tasks “entering and exiting the bus” + # of tasks “Passing crossing with traffic lights” = 162.
- Total # of tasks undertaken = #number of tasks per user * #of participants = 7 × 30 = 210.
3.2. Errors—Error Rate during Evaluation Activities
- Collision with obstacles: records the cases where users collided with an obstacle.
- Veering: Records the cases where users deviate from the designated path and veer off to one side or the other. This also pertains to the conventional methods of a white-cane and/or guide dogs.
- External factor: records the cases where users are affected by an external factor such as another person on the path or the application glitches.
- Missed turn: records the cases where users either react too early or too late and miss the correct turn.
- Over-turn: records the cases where users over-turned and missed the correct navigational path.
- Issued instructions: records the cases where users request further clarification about instructions from the research team.
- Boarding button: this category records the cases of activating the public means of transport mode of operation.
- Boarding on the bus: this category records the cases where the blind and the visually impaired user enters the bus.
- Exiting the bus: this category records the cases where the blind and visually impaired user exits at the correct bus stop.
- Veering: this category records the cases where the blind and visually impaired user deviates from the straight line of the user’s vector path.
- Reaction time to the status change notifications: this category records the cases where the blind and visually impaired user reacts to the traffic lights status change notification.
3.3. Efficiency
3.4. Questionnaires, Interviews and Group Discussions Findings (UEQ+)
3.5. Mean Value and Standard Deviation for Every Scale
3.6. Distribution of Responses by Scale
3.7. Consistency of the Evaluation Categories
3.8. Comparative Evaluation
3.8.1. Advancing the State-of-the-Art
- (a)
- accurate instructions for recovering back to the navigation path when the user diverges from it;
- (b)
- route selection confirmation;
- (c)
- navigation to bus stops, safely boarding them, upcoming bus stop notifications and instructions to exit the bus.
3.8.2. Commercial Navigation Applications
4. Discussion
- The importance of having a guiding application that allows blind users to complete all their activities.
- The necessity to adopt a design process that involves the blind and visually impaired users for enabling the development of an application where users can recognize the functionality of the cognitive processes used during their navigation.
- The necessity to design and implement an organized training framework for increasing the adoption and learning rate of the application.
- The importance of blending the design process of both the educational framework and the technical capabilities of the system to get a better and more robust result.
4.1. Technical Limitations and Future Work of BlindRouteVision
- The app should provide additional feedback to the user to recover in the case of over-turning.
- Participants would like for the app to provide the capability to control how much information is given to them (push interaction). Furthermore, the participants requested for both push- and pull-based interactions to be adjusted in order to better match their personal style of preference.
- Search based on shop names and general categories—it will be possible to constrain the search results returned to the user based on the selected coverage radius. It will also be possible to search either via shop names or via more general categories.
- Integration of the application with social networks—instant connection and presentation of news related to points of interest that were the result of a search.
- Use of other navigation map services such as TomTom, Navigon and Apple Maps.
- Support for a wider range of Public Means of Transport besides buses, including trains, subways and taxis.
- As it is common for the task performance to vary amongst users, or even for the same user, a method for adjusting to the user’s abilities is required to facilitate an efficient interface between the blind or visually impaired user and the navigation system. Currently, the interface is designed and fine-tuned exclusively for blind users, but we intend to experiment with high-contrast visual interfaces for partially sighted users as well.
- Providing the capability to repeat an issued instruction in the case where the user was unable to hear it due to external factors such as environmental noise or other distractions.
- Adding the capability to adjust the speed by which the overall brief description of the navigation route and the subsequent navigation instructions are issued.
- Allowing the user to flexibly change the destination without having to start the process all over again.
- Providing in-app updates. At the time of writing of this paper, the application is made available to download from an external link found in the bulletin board system of the Lighthouse for the Blind of Greece where manual installation is required.
- Multimodal sensory interface for traffic lights information by combining vibration and acoustic feedback. The above achieves safer and more accurate guidance for the user while passing traffic light crossings.
4.2. Limitations and Future Work for User Evaluation
4.3. Future Work for Ameliorating the General Trend on Adoption Rates Usage
- (a)
- the increased sensitivity of the target group to needs related to their disability, and
- (b)
- the corresponding psychological patterns that stem from the insecurity caused by their disability.
5. Conclusions
Author Contributions
Funding
Institutional Review Board Statement
Informed Consent Statement
Data Availability Statement
Conflicts of Interest
References
- Steinmetz, J.; Bourne, R.; Briant, P.; Flaxman, S.; Taylor, H.; Jonas, J.; Abdoli, A.; Abrha, W.; Abualhasan, A.; Abu-Gharbieh, E.; et al. Causes of Blindness and Vision Impairment in 2020 And Trends Over 30 Years, And Prevalence Of Avoidable Blindness in Relation to Vision 2020: The Right To Sight: An Analysis For The Global Burden Of Disease Study. Lancet Glob. Health 2021, 9, e144–e160. [Google Scholar] [CrossRef]
- Bourne, R.R.A.; Flaxman, S.R.; Braithwaite, T.; Cicinelli, M.V.; Das, A.; Jonas, J.B.; Keeffe, J.; Kempen, J.H.; Leasher, J.; Limburg, H.; et al. Magnitude, temporal trends, and projections of the global prevalence of blindness and distance and near vision impairment: A systematic review and meta-analysis. Lancet Glob. Health 2017, 5, e888–e897. [Google Scholar] [CrossRef] [Green Version]
- Vision Impairment and Blindness. Available online: https://www.who.int/news-room/fact-sheets/detail/blindness-and-visual-impairment (accessed on 27 March 2022).
- Wang, W.; Yan, W.; Müller, A.; Keel, S.; He, M. Association of Socioeconomics with Prevalence of Visual Impairment and Blindness. JAMA Ophthalmol. 2017, 135, 1295–1302. [Google Scholar] [CrossRef] [PubMed]
- Neeraj, S.; Reima, S. Assistive Technology for Totally Blind–Barriers to Adoption. In Proceedings of the 36th Information Systems Research Seminar in Scandinavia, Oslo, Norway, 11–14 August 2013; pp. 182–198. [Google Scholar]
- Gori, M.; Cappagli, G.; Tonelli, A.; Baud-Bovy, G.; Finocchietti, S. Devices for visually impaired people: High technological devices with low user acceptance and no adaptability for children. Neurosci. Biobehav. Rev. 2016, 69, 79–88. [Google Scholar] [CrossRef] [Green Version]
- Kuriakose, B.; Shrestha, R.; Sandnes, F.E. Tools and Technologies for Blind and Visually Impaired Navigation Support: A Review. IETE Tech. Rev. 2020, 39, 3–18. [Google Scholar] [CrossRef]
- El-Taher, F.; Taha, A.; Courtney, J.; Mckeever, S. A Systematic Review of Urban Navigation Systems for Visually Impaired People. Sensors 2021, 21, 3103. [Google Scholar] [CrossRef]
- Islam, M.; Sadi, M.S.; Zamli, K.Z.; Ahmed, M. Developing Walking Assistants for Visually Impaired People: A Review. IEEE Sens. J. 2019, 19, 2814–2828. [Google Scholar] [CrossRef]
- T1RCI-00593. MANTO: Innovative Autonomous Blind Navigation Outdoor and Indoor and in Museums. Available online: https://manto.ds.unipi.gr (accessed on 26 January 2022).
- Meliones, A.; Filios, C. BlindHelper: A Pedestrian Navigation System for Blinds and Visually Impaired. In Proceedings of the 9th ACM International Conference on Pervasive Technologies Related to Assistive Environments, Corfu, Greece, 29 June–1 July 2016. [Google Scholar]
- Meliones, A.; Sampson, D. Blind Museum Tourer: A System for Self-Guided Tours in Museums and Blind Indoor Navigation. Technologies 2018, 6, 4. [Google Scholar] [CrossRef] [Green Version]
- Velázquez, R.; Pissaloux, E.; Rodrigo, P.; Carrasco, M.; Giannoccaro, N.I.; Lay-Ekuakille, A. An Outdoor Navigation System for Blind Pedestrians Using GPS and Tactile-Foot Feedback. Appl. Sci. 2018, 8, 578. [Google Scholar] [CrossRef] [Green Version]
- Als, A.; King, A.; Johnson, K.; Sargeant, R. BluKane: An Obstacle Avoidance Navigation App to Assist the Visually Impaired. In Computers Helping People with Special Needs; Miesenberger, K., Kouroupetroglou, G., Eds.; Lecture Notes in Computer Science; Springer International Publishing: Cham, Switzerland, 2018; Volume 10897, pp. 36–43. [Google Scholar] [CrossRef]
- Murata, M.; Ahmetovic, D.; Sato, D.; Takagi, H.; Kitani, K.M.; Asakawa, C. Smartphone-Based Indoor Localization for Blind Navigation across Building Complexes. In Proceedings of the 2018 IEEE International Conference on Pervasive Computing and Communications (PerCom), Athens, Greece, 19–23 March 2018; pp. 1–10. [Google Scholar] [CrossRef]
- Gomes, J.P.; Sousa, J.P.; Cunha, C.R.; Morais, E.P. An Indoor Navigation Architecture Using Variable Data Sources for Blind and Visually Impaired Persons. In Proceedings of the 2018 13th Iberian Conference on Information Systems and Technologies (CISTI), Caceres, Spain, 13–16 June 2018; pp. 1–5. [Google Scholar] [CrossRef]
- Tao, Y.; Ding, L.; Ganz, A. Indoor Navigation Validation Framework for Visually Impaired Users. IEEE Access 2017, 5, 21763–21773. [Google Scholar] [CrossRef]
- Kasthuri, R.; Nivetha, B.; Shabana, S.; Veluchamy, M.; Sivakumar, S. Smart Device for Visually Impaired People. In Proceedings of the 2017 Third International Conference on Science Technology Engineering & Management (ICONSTEM), Chennai, India, 23–24 March 2017; pp. 54–59. [Google Scholar] [CrossRef]
- Patel, S.; Kumar, A.; Yadav, P.; Desai, J.; Patil, D. Smartphone-Based Obstacle Detection for Visually Impaired People. In Proceedings of the 2017 International Conference on Innovations in Information, Embedded and Communication Systems (ICIIECS), Coimbatore, India, 17–18 March 2017; pp. 1–3. [Google Scholar] [CrossRef]
- Asmara, R.A.; Al Huda, F.; Andoko, B.S.; Handayani, A.N. Optimized Walking Straight Guidance System for Visually Impaired Person That Use Android Smartphone. In Proceedings of the 2017 International Conference on Sustainable Information Engineering and Technology (SIET), Batu, Indonesia, 24–25 November 2017; pp. 332–336. [Google Scholar] [CrossRef]
- Mukherjee, S.; Pandian, K.S. Android Based Personal Travelling Assistant Using Turning Algorithm. In Proceedings of the 2017 International Conference on Energy, Communication, Data Analytics and Soft Computing (ICECDS), Chennai, India, 1–2 August 2017; pp. 3161–3165. [Google Scholar] [CrossRef]
- Csapó, Á.; Wersényi, G.; Nagy, H.; Stockman, T. A survey of assistive technologies and applications for blind users on mobile platforms: A review and foundation for research. J. Multimodal User Interfaces 2015, 9, 275–286. [Google Scholar] [CrossRef] [Green Version]
- Rodriguez-Sanchez, M.; Moreno-Alvarez, M.; Martin, E.; Borromeo, S.; Hernandez-Tamames, J. Accessible smartphones for blind users: A case study for a wayfinding system. Expert Syst. Appl. 2014, 41, 7210–7222. [Google Scholar] [CrossRef]
- Hakobyan, L.; Lumsden, J.M.; O’Sullivan, D.; Bartlett, H. Mobile assistive technologies for the visually impaired. Surv. Ophthalmol. 2013, 58, 513–528. [Google Scholar] [CrossRef] [Green Version]
- Karthick, M.; Suguna, R. Obstacles Detection for Visually Impaired People Using Smart Phones. Int. J. Emerg. Technol. Comput. Sci. Electron. 2015, 13, 530–535. [Google Scholar]
- Channabasaveshwara Institute of Technology; Karnataka, M.S.N.; Balaji, C.; Shantala, C.P. An Outdoor Navigation With Voice Recognition Security Application For Visually Impaired People. Int. J. Eng. Trends Technol. 2014, 10, 500–504. [Google Scholar] [CrossRef]
- Lin, B.-S.; Lee, C.-C.; Chiang, P.-Y. Simple Smartphone-Based Guiding System for Visually Impaired People. Sensors 2017, 17, 1371. [Google Scholar] [CrossRef] [Green Version]
- Ren, S.; He, K.; Girshick, R.; Sun, J. Faster R-CNN: Towards Real-Time Object Detection with Region Proposal Networks. arXiv 2016, arXiv:1506.01497. [Google Scholar] [CrossRef] [Green Version]
- Redmon, J.; Divvala, S.; Girshick, R.; Farhadi, A. You Only Look Once: Unified, Real-Time Object Detection. In Proceedings of the 2016 IEEE Conference on Computer Vision and Pattern Recognition (CVPR), Las Vegas, NV, USA, 27–30 June 2016; pp. 779–788. [Google Scholar] [CrossRef] [Green Version]
- Mataro, T.V.; Masulli, F.; Rovetta, S.; Cabri, A.; Traverso, C.; Capris, E.; Torretta, S. An Assistive Mobile System Supporting Blind and Visual Impaired People When Are Outdoor. In Proceedings of the 2017 IEEE 3rd International Forum on Research and Technologies for Society and Industry (RTSI), Modena, Italy, 11–13 September 2017; pp. 1–6. [Google Scholar] [CrossRef]
- Khenkar, S.; Alsulaiman, H.; Ismail, S.; Fairaq, A.; Jarraya, S.K.; Ben-Abdallah, H. ENVISION: Assisted Navigation of Visually Impaired Smartphone Users. Procedia Comput. Sci. 2016, 100, 128–135. [Google Scholar] [CrossRef] [Green Version]
- Lock, J.C.; Cielniak, G.; Bellotto, N. A Portable Navigation System with an Adaptive Multimodal Interface for the Blind. In Proceedings of the 2017 AAAI Spring Symposium Series, Stanford, CA, USA, 27–29 March 2017; AAAI: Palo Alto, CA, USA, 2017. [Google Scholar]
- Heuten, W.; Henze, N.; Boll, S.; Pielot, M. Tactile Wayfinder: A Non-Visual Support System for Wayfinding. In Proceedings of the 5th Nordic Conference on Human-Computer Interaction Building Bridges—NordiCHI ’08, Lund, Sweden, 20–22 October 2008; ACM Press: Lund, Sweden, 2008; p. 172. [Google Scholar] [CrossRef]
- Tepelea, L.; Gavrilu, I.; Gacsádi, A. Smartphone application to assist visually impaired people. In Proceedings of the 14th International Conference on Engineering of Modern Electric Systems (EMES), Oradea, Romania, 1–2 June 2017; pp. 228–231. [Google Scholar]
- Alghamdi, S.; van Schyndel, R.; Khalil, I. Accurate positioning using long range active RFID technology to assist visually impaired people. J. Netw. Comput. Appl. 2014, 41, 135–147. [Google Scholar] [CrossRef]
- Tanveer, M.S.R.; Hashem, M.M.A.; Hossain, M.K. Android Assistant EyeMate for Blind and Blind Tracker. In Proceedings of the 2015 18th International Conference on Computer and Information Technology (ICCIT), Dhaka, Bangladesh, 21–23 December 2015; pp. 266–271. [Google Scholar] [CrossRef] [Green Version]
- Patil, K.; Jawadwala, Q.; Shu, F.C. Design and Construction of Electronic Aid for Visually Impaired People. IEEE Trans. Human-Machine Syst. 2018, 48, 172–182. [Google Scholar] [CrossRef]
- Meshram, V.V.; Patil, K.; Meshram, V.A.; Shu, F.C. An Astute Assistive Device for Mobility and Object Recognition for Visually Impaired People. IEEE Trans. Human-Machine Syst. 2019, 49, 449–460. [Google Scholar] [CrossRef]
- Rahman, M.A.; Sadi, M.S.; Islam, M.M.; Saha, P. Design and Development of Navigation Guide for Visually Impaired People. In Proceedings of the 2019 IEEE International Conference on Biomedical Engineering, Computer and Information Technology for Health (BECITHCON), Dhaka, Bangladesh, 28–30 November 2019; pp. 89–92. [Google Scholar] [CrossRef]
- Chang, W.-J.; Chen, L.-B.; Chen, M.-C.; Su, J.-P.; Sie, C.-Y.; Yang, C.-H. Design and Implementation of an Intelligent Assistive System for Visually Impaired People for Aerial Obstacle Avoidance and Fall Detection. IEEE Sens. J. 2020, 20, 10199–10210. [Google Scholar] [CrossRef]
- Cardillo, E.; Di Mattia, V.; Manfredi, G.; Russo, P.; De Leo, A.; Caddemi, A.; Cerri, G. An Electromagnetic Sensor Prototype to Assist Visually Impaired and Blind People in Autonomous Walking. IEEE Sens. J. 2018, 18, 2568–2576. [Google Scholar] [CrossRef]
- Cardillo, E.; Li, C.; Caddemi, A. Millimeter-Wave Radar Cane: A Blind People Aid With Moving Human Recognition Capabilities. IEEE J. Electromagn. RF Microw. Med. Biol. 2021, 6, 204–211. [Google Scholar] [CrossRef]
- Kiuru, T.; Metso, M.; Utriainen, M.; Metsävainio, K.; Jauhonen, H.-M.; Rajala, R.; Savenius, R.; Ström, M.; Jylhä, T.-N.; Juntunen, R.; et al. Assistive device for orientation and mobility of the visually impaired based on millimeter wave radar technology—Clinical investigation results. Cogent Eng. 2018, 5, 1450322. [Google Scholar] [CrossRef]
- Islam, M.; Sadi, M.S.; Braunl, T. Automated Walking Guide to Enhance the Mobility of Visually Impaired People. IEEE Trans. Med. Robot. Bionics 2020, 2, 485–496. [Google Scholar] [CrossRef]
- Elmannai, W.M.; Elleithy, K.M. A Highly Accurate and Reliable Data Fusion Framework for Guiding the Visually Impaired. IEEE Access 2018, 6, 33029–33054. [Google Scholar] [CrossRef]
- Duh, P.-J.; Sung, Y.-C.; Chiang, L.-Y.F.; Chang, Y.-J.; Chen, K.-W. V-Eye: A Vision-Based Navigation System for the Visually Impaired. IEEE Trans. Multimed. 2020, 23, 1567–1580. [Google Scholar] [CrossRef]
- Lin, Y.; Wang, K.; Yi, W.; Lian, S. Deep Learning Based Wearable Assistive System for Visually Impaired People. In Proceedings of the IEEE/CVF International Conference on Computer Vision Workshops, Seoul, Korea, 27–28 October 2019; pp. 2549–2557. [Google Scholar] [CrossRef] [Green Version]
- Younis, O.; Al-Nuaimy, W.; Rowe, F.; Alomari, M.H. A Smart Context-Aware Hazard Attention System to Help People with Peripheral Vision Loss. Sensors 2019, 19, 1630. [Google Scholar] [CrossRef] [Green Version]
- Yang, K.; Wang, K.; Bergasa, L.M.; Romera, E.; Hu, W.; Sun, D.; Sun, J.; Cheng, R.; Chen, T.; López, E. Unifying terrain awareness for the visually impaired through real-time semantic segmentation. Sensors 2018, 18, 1506. [Google Scholar] [CrossRef] [Green Version]
- Bai, J.; Liu, Z.; Lin, Y.; Li, Y.; Lian, S.; Liu, D. Wearable Travel Aid for Environment Perception and Navigation of Visually Impaired People. Electronics 2019, 8, 697. [Google Scholar] [CrossRef] [Green Version]
- Long, N.; Wang, K.; Cheng, R.; Yang, K.; Hu, W.; Bai, J. Assisting the visually impaired: Multitarget warning through millimeter wave radar and RGB-depth sensors. J. Electron. Imaging 2019, 28, 013028. [Google Scholar] [CrossRef]
- Cheng, R.; Wang, K.; Lin, S. Intersection Navigation for People with Visual Impairment. In Computers Helping People with Special Needs; Miesenberger, K., Kouroupetroglou, G., Eds.; Lecture Notes in Computer Science; Springer International Publishing: Cham, Switzerland, 2018; Volume 10897, pp. 78–85. [Google Scholar] [CrossRef]
- Yu, S.; Lee, H.; Kim, J. Street Crossing Aid Using Light-Weight CNNs for the Visually Impaired. In Proceedings of the IEEE/CVF International Conference on Computer Vision Workshops, Seoul, Korea, 27–28 October 2019; pp. 2593–2601. [Google Scholar] [CrossRef] [Green Version]
- Ihejimba, C.; Wenkstern, R.Z. DetectSignal: A Cloud-Based Traffic Signal Notification System for the Blind and Visually Impaired. In Proceedings of the 2020 IEEE International Smart Cities Conference (ISC2), Piscataway, NJ, USA, 28 September–1 October 2020; pp. 1–6. [Google Scholar] [CrossRef]
- Theodorou, P.; Meliones, A.; Filios, C. Smart traffic lights for people with visual impairments: A literature overview and a proposed implementation. J. Vis. Impair. Blind. 2022. [Google Scholar] [CrossRef]
- Sáez, Y.; Muñoz, J.; Canto, F.; García, A.; Montes, H. Assisting Visually Impaired People in the Public Transport System through RF-Communication and Embedded Systems. Sensors 2019, 19, 1282. [Google Scholar] [CrossRef] [PubMed] [Green Version]
- Yu, C.; Li, Y.; Huang, T.-Y.; Hsieh, W.-A.; Lee, S.-Y.; Yeh, I.-H.; Lin, G.K.; Yu, N.-H.; Tang, H.-H.; Chang, Y.-J. BusMyFriend: Designing a Bus Reservation Service for People with Visual Impairments in Taipei. In Companion Publication of the 2020 ACM Designing Interactive Systems Conference; ACM: Eindhoven, The Netherlands, 2020; pp. 91–96. [Google Scholar] [CrossRef]
- See, A.R.; Sasing, B.G.; Advincula, W.D. A Smartphone-Based Mobility Assistant Using Depth Imaging for Visually Impaired and Blind. Appl. Sci. 2022, 12, 2802. [Google Scholar] [CrossRef]
- Meliones, A.; Filios, C.; Llorente, J. Reliable Ultrasonic Obstacle Recognition for Outdoor Blind Navigation. Technologies 2022, 10, 54. [Google Scholar] [CrossRef]
- Yaagoubi, R.; Edwards, G. Cognitive design in action: Developing assistive technology for situational awareness for persons who are blind. Disabil. Rehabil. Assist. Technol. 2008, 3, 241–252. [Google Scholar] [CrossRef]
- Theodorou, P.; Meliones, A. Towards a Training Framework for Improved Assistive Mobile App Acceptance and Use Rates by Blind and Visually Impaired People. Educ. Sci. 2020, 10, 58. [Google Scholar] [CrossRef] [Green Version]
- Noorhidawati, A.; Ghalebandi, S.; Hajar, R.S. How do young children engage with mobile apps? Cognitive, psychomotor, and affective perspective. Comput. Educ. 2015, 87, 385–395. [Google Scholar] [CrossRef]
- Marks, D.; Cremin, L.; Sneider, A.; Laxton, T.; McPhee, I.; Marks, L. Does Use of Touch Screen Computer Technology Improve Classroom Engagement in Children? Durham University School of Education: Durham, UK, 2012; p. 20. [Google Scholar]
- Lalmas, M.; O’Brien, H.; Yom-Tov, E. Measuring User Engagement. Synth. Lect. Inf. Concepts Retr. Serv. 2014, 6, 1–132. [Google Scholar] [CrossRef] [Green Version]
- Völkel, T.; Weber, G. RouteCheckr: Personalized Multicriteria Routing for Mobility Impaired Pedestrians. In Proceedings of the 10th International ACM SIGACCESS Conference on Computers and Accessibility—Assets ’08, Halifax, NS, Canada, 13–15 October 2008; ACM Press: Halifax, NS, Canada, 2008; p. 185. [Google Scholar] [CrossRef]
- Holzinger, A. Usability engineering methods for software developers. Commun. ACM 2005, 48, 71–74. [Google Scholar] [CrossRef]
- ISO/IEC 25010:2011. Available online: https://www.iso.org/standard/35733.html (accessed on 2 April 2022).
- Forlizzi, J.; Battarbee, K. Understanding Experience in Interactive Systems. In Proceedings of the 2004 Conference on Designing Interactive Systems Processes, Practices, Methods, and Techniques—DIS ’04, Cambridge, MA, USA, 1–4 August 2004; ACM Press: Cambridge, MA, USA, 2004; p. 261. [Google Scholar] [CrossRef]
- ISO 9241-210:2019. Available online: https://www.iso.org/standard/77520.html (accessed on 28 March 2022).
- Majrashi, K.; Hamilton, M.; Uitdenbogerd, A.L.; Al-Megren, S. Cross-Platform Usability Model Evaluation. Multimodal Technol. Interact. 2020, 4, 80. [Google Scholar] [CrossRef]
- Díaz-Oreiro, I.; López, G.; Quesada, L.; Guerrero, L. Standardized Questionnaires for User Experience Evaluation: A Systematic Literature Review. In Proceedings of the 13th International Conference on Ubiquitous Computing and Ambient Intelligence UCAmI 2019, Toledo, Spain, 2–5 December 2019; p. 14. [Google Scholar] [CrossRef] [Green Version]
- Lallemand, C.; Koenig, V. How Could an Intranet Be Like a Friend to Me? Why Standardized UX Scales Don’t Always Fit. In Proceedings of the European Conference on Cognitive Ergonomics 2017, Umeå, Sweden, 19–22 September 2017; ACM: Umeå, Sweden, 2017; pp. 9–16. [Google Scholar] [CrossRef]
- Baumgartner, J.; Sonderegger, A.; Sauer, J. No need to read: Developing a pictorial single-item scale for measuring perceived usability. Int. J. Human-Computer Stud. 2018, 122, 78–89. [Google Scholar] [CrossRef] [Green Version]
- Forster, Y.; Hergeth, S.; Naujoks, F.; Krems, J.F. How Usability Can Save the Day—Methodological Considerations for Making Automated Driving a Success Story. In Proceedings of the 10th International Conference on Automotive User Interfaces and Interactive Vehicular Applications, Toronto, ON, Canada, 23–25 September 2018; pp. 278–290. [Google Scholar] [CrossRef]
- Klammer, J.; van den Anker, F.W.G. Design, User Experience, and Usability: Users, Contexts and Case Studies; Springer International Publishing: Berlin/Heidelberg, Germany, 2018; Volume 10920. [Google Scholar]
- Hassenzahl, M.; Burmester, M.; Koller, F. AttrakDiff: Ein Fragebogen zur Messung wahrgenommener hedonischer und pragmatischer Qualitδt. In Mensch & Computer; Vieweg+ Teubner Verlag: Berlin/Heidelberg, Germany, 2003; pp. 187–196. [Google Scholar]
- Minge, M.; Thüring, M.; Wagner, I.; Kuhr, C.V. The meCUE Questionnaire: A Modular Tool for Measuring User Experience. In Advances in Ergonomics Modeling, Usability & Special Populations; Soares, M., Falcão, C., Ahram, T.Z., Eds.; Advances in Intelligent Systems and Computing; Springer: Cham, Switzerland, 2017; pp. 115–128. [Google Scholar]
- Fenton, N.E.; Bieman, J. Software Metrics: A Rigorous and Practical Approach; CRC Press: Boca Raton, FL, USA, 2014. [Google Scholar]
- Laugwitz, B.; Held, T.; Schrepp, M. Construction and Evaluation of a User Experience Questionnaire. In HCI and Usability for Education and Work; Holzinger, A., Ed.; Lecture Notes in Computer Science; Springer: Berlin/Heidelberg, Germany, 2008; Volume 5298, pp. 63–76. ISBN 978-3-540-89349-3. [Google Scholar] [CrossRef]
- Theodorou, P.; Meliones, A. Gaining Insight for the Design, Development, Deployment and Distribution of Assistive Navigation Systems for Blind and Visually Impaired People through a Detailed User Requirements Elicitation, Universal Access in the Information Society (UAIS); Springer International Publishing: Cham, Switzerland, 2022. [Google Scholar] [CrossRef]
- Díaz-Oreiro, I.; López, G.; Quesada, L.; Guerrero, L.A. UX Evaluation with Standardized Questionnaires in Ubiquitous Computing and Ambient Intelligence: A Systematic Literature Review. Adv. Human-Comput. Interact. 2021, 2021, 1–22. [Google Scholar] [CrossRef]
- Dell, N.; Vaidyanathan, V.; Medhi, I.; Cutrell, E.; Thies, W. “Yours Is Better!”: Participant Response Bias in HCI. In Proceedings of the SIGCHI Conference on Human Factors in Computing Systems, Austin, TX, USA, 5–10 May 2012; pp. 1321–1330. [Google Scholar] [CrossRef]
- Oliver, M. The social model of disability: Thirty years on. Disabil. Soc. 2013, 28, 1024–1026. [Google Scholar] [CrossRef]


| Gender | Age | Degree of Visual Impairment | Cause of Vision Loss | Digital Sophistication | |
|---|---|---|---|---|---|
| P1 | Male | 55 | Complete | By birth | High |
| P2 | Female | 35 | Severe | By birth | Average |
| P3 | Male | 36 | Complete | Diabetes | High |
| P4 | Male | 40 | Almost complete (95%) | By birth | Low |
| P5 | Male | 40 | Almost complete (95%) | By birth | Low |
| P6 | Female | 55 | Complete | Retinopathy (28 years old) | Low |
| P7 | Male | 40 | Almost complete (90–95%) | By birth | Low |
| P8 | Male | 40 | Complete | Cancer (7 years old) | Low |
| P9 | Male | 35 | Almost complete (>95%) | Benign tumor (15 years old) | Low |
| P10 | Male | 60 | Complete | By birth | High |
| P11 | Male | 30 | Complete | By birth | High |
| P12 | Male | 40 | Complete | By birth | High |
| P13 | Male | 38 | Almost complete (90–95%) | Craniocerebral injuries at 23 | High |
| P14 | Male | 54 | Complete | By birth | High |
| P15 | Female | 39 | Severe | By birth | Average |
| P16 | Male | 36 | Complete | Diabetes | High |
| P17 | Male | 46 | Almost complete (95%) | By birth | High |
| P18 | Male | 44 | Almost complete (95%) | By birth | Low |
| P19 | Female | 52 | Complete | Retinopathy (23 years old) | Low |
| P20 | Male | 50 | Almost complete (90–95%) | By birth | Low |
| P21 | Male | 40 | Complete | Cancer (15 years old) | Low |
| P22 | Male | 35 | Almost complete (>95%) | Benign tumor (6 years old) | Low |
| P23 | Female | 60 | Complete | By birth | Low |
| P24 | Male | 47 | Complete | By birth | Low |
| P25 | Male | 49 | Complete | By birth | Low |
| P26 | Female | 38 | Almost complete (90–95%) | By birth | Average |
| P27 | Female | 65 | Complete | By birth | Average |
| P28 | Female | 39 | Complete | By birth | Average |
| P29 | Female | 37 | Complete | By birth | Average |
| P30 | Female | 40 | Almost complete (90–95%) | Diabetes | Low |
| Participant | Completion of a Route | Entering and Exiting the Bus | Passing Crossing with a Traffic Light |
|---|---|---|---|
| P1 | 3 | 1 | 0 |
| P2 | 3 | 1 | 1 |
| P3 | 3 | 1 | 0 |
| P4 | 4 | 2 | 1 |
| P5 | 2 | 2 | 0 |
| P6 | 3 | 1 | 1 |
| P7 | 3 | 2 | 0 |
| P8 | 2 | 1 | 1 |
| P9 | 3 | 2 | 1 |
| P10 | 3 | 2 | 1 |
| P11 | 3 | 2 | 0 |
| P12 | 4 | 1 | 1 |
| P13 | 3 | 2 | 0 |
| P14 | 3 | 1 | 1 |
| P15 | 4 | 1 | 1 |
| P16 | 3 | 1 | 1 |
| P17 | 3 | 1 | 0 |
| P18 | 3 | 2 | 1 |
| P19 | 3 | 2 | 0 |
| P20 | 4 | 2 | 1 |
| P21 | 3 | 1 | 1 |
| P22 | 3 | 2 | 1 |
| P23 | 4 | 2 | 0 |
| P24 | 3 | 2 | 1 |
| P25 | 3 | 1 | 1 |
| P26 | 3 | 2 | 1 |
| P27 | 4 | 1 | 1 |
| P28 | 3 | 2 | 1 |
| P29 | 3 | 1 | 1 |
| P30 | 4 | 2 | 1 |
| Participant | Collision with Obstacles | Veering | External Factor | Missed Turn | Over-Turn | Issued Instructions | Assisted |
|---|---|---|---|---|---|---|---|
| P1 | 3 | 1 | 1 | 1 | 1 | 1 | 1 |
| P2 | 2 | 2 | 1 | 2 | 1 | 1 | 1 |
| P3 | 1 | 0 | 1 | 1 | 1 | 1 | 1 |
| P4 | 0 | 0 | 1 | 1 | 0 | 0 | 0 |
| P5 | 2 | 0 | 1 | 1 | 0 | 0 | 2 |
| P6 | 3 | 1 | 1 | 0 | 1 | 1 | 1 |
| P7 | 2 | 1 | 0 | 0 | 1 | 1 | 1 |
| P8 | 2 | 0 | 0 | 1 | 0 | 0 | 1 |
| P9 | 1 | 3 | 2 | 1 | 0 | 1 | 1 |
| P10 | 0 | 0 | 1 | 2 | 1 | 1 | 1 |
| P11 | 3 | 0 | 1 | 1 | 1 | 1 | 1 |
| P12 | 1 | 0 | 1 | 0 | 1 | 0 | 0 |
| P13 | 1 | 1 | 1 | 1 | 0 | 1 | 1 |
| P14 | 1 | 2 | 1 | 0 | 1 | 1 | 1 |
| P15 | 1 | 2 | 1 | 1 | 2 | 0 | 0 |
| P16 | 2 | 3 | 1 | 0 | 2 | 1 | 1 |
| P17 | 3 | 1 | 0 | 1 | 2 | 1 | 1 |
| P18 | 2 | 1 | 0 | 0 | 1 | 1 | 1 |
| P19 | 2 | 2 | 1 | 1 | 1 | 1 | 1 |
| P20 | 1 | 0 | 1 | 1 | 3 | 0 | 0 |
| P21 | 1 | 0 | 1 | 1 | 1 | 1 | 1 |
| P22 | 0 | 3 | 1 | 0 | 1 | 1 | 1 |
| P23 | 0 | 0 | 0 | 1 | 1 | 0 | 0 |
| P24 | 1 | 1 | 1 | 1 | 1 | 1 | 1 |
| P25 | 2 | 1 | 1 | 1 | 1 | 1 | 1 |
| P26 | 2 | 0 | 1 | 0 | 0 | 1 | 1 |
| P27 | 2 | 0 | 0 | 0 | 0 | 0 | 0 |
| P28 | 1 | 0 | 0 | 1 | 1 | 1 | 1 |
| P29 | 1 | 1 | 1 | 1 | 1 | 1 | 1 |
| P30 | 1 | 0 | 1 | 1 | 1 | 0 | 0 |
| Public Means of Transport | Traffic Lights Crossings | ||||||
|---|---|---|---|---|---|---|---|
| Participant | Boarding Button | Boarding | Exiting | Assisted | Veering | Reaction Time * | Assisted |
| P1 | 3 | 1 | 1 | 1 | 1 | 1 | 1 |
| P2 | 2 | 0 | 0 | 1 | 1 | 1 | 0 |
| P3 | 1 | 1 | 0 | 1 | 1 | 1 | 1 |
| P4 | 0 | 0 | 1 | 0 | 0 | 0 | 0 |
| P5 | 2 | 1 | 0 | 0 | 1 | 1 | 1 |
| P6 | 3 | 0 | 1 | 1 | 0 | 0 | 0 |
| P7 | 2 | 0 | 0 | 1 | 1 | 1 | 1 |
| P8 | 2 | 0 | 1 | 1 | 1 | 0 | 0 |
| P9 | 1 | 0 | 0 | 0 | 0 | 0 | 0 |
| P10 | 0 | 0 | 0 | 0 | 0 | 0 | 0 |
| P11 | 3 | 0 | 0 | 0 | 1 | 1 | 1 |
| P12 | 1 | 1 | 1 | 1 | 1 | 1 | 0 |
| P13 | 1 | 1 | 0 | 0 | 0 | 0 | 1 |
| P14 | 1 | 1 | 1 | 1 | 1 | 1 | 0 |
| P15 | 1 | 1 | 0 | 1 | 1 | 1 | 0 |
| P16 | 2 | 1 | 1 | 1 | 0 | 1 | 0 |
| P17 | 3 | 0 | 0 | 1 | 1 | 1 | 1 |
| P18 | 2 | 0 | 0 | 0 | 0 | 0 | 0 |
| P19 | 2 | 1 | 1 | 0 | 0 | 0 | 1 |
| P20 | 1 | 0 | 1 | 0 | 0 | 0 | 0 |
| P21 | 1 | 1 | 0 | 1 | 1 | 1 | 0 |
| P22 | 0 | 0 | 0 | 0 | 0 | 0 | 0 |
| P23 | 0 | 0 | 0 | 0 | 0 | 0 | 0 |
| P24 | 1 | 1 | 0 | 1 | 0 | 1 | 1 |
| P25 | 2 | 1 | 0 | 1 | 1 | 0 | 0 |
| P26 | 2 | 1 | 1 | 1 | 0 | 1 | 0 |
| P27 | 2 | 1 | 1 | 1 | 1 | 1 | 0 |
| P28 | 1 | 0 | 0 | 0 | 0 | 0 | 0 |
| P29 | 1 | 0 | 1 | 0 | 1 | 1 | 0 |
| P30 | 1 | 0 | 0 | 0 | 0 | 0 | 0 |
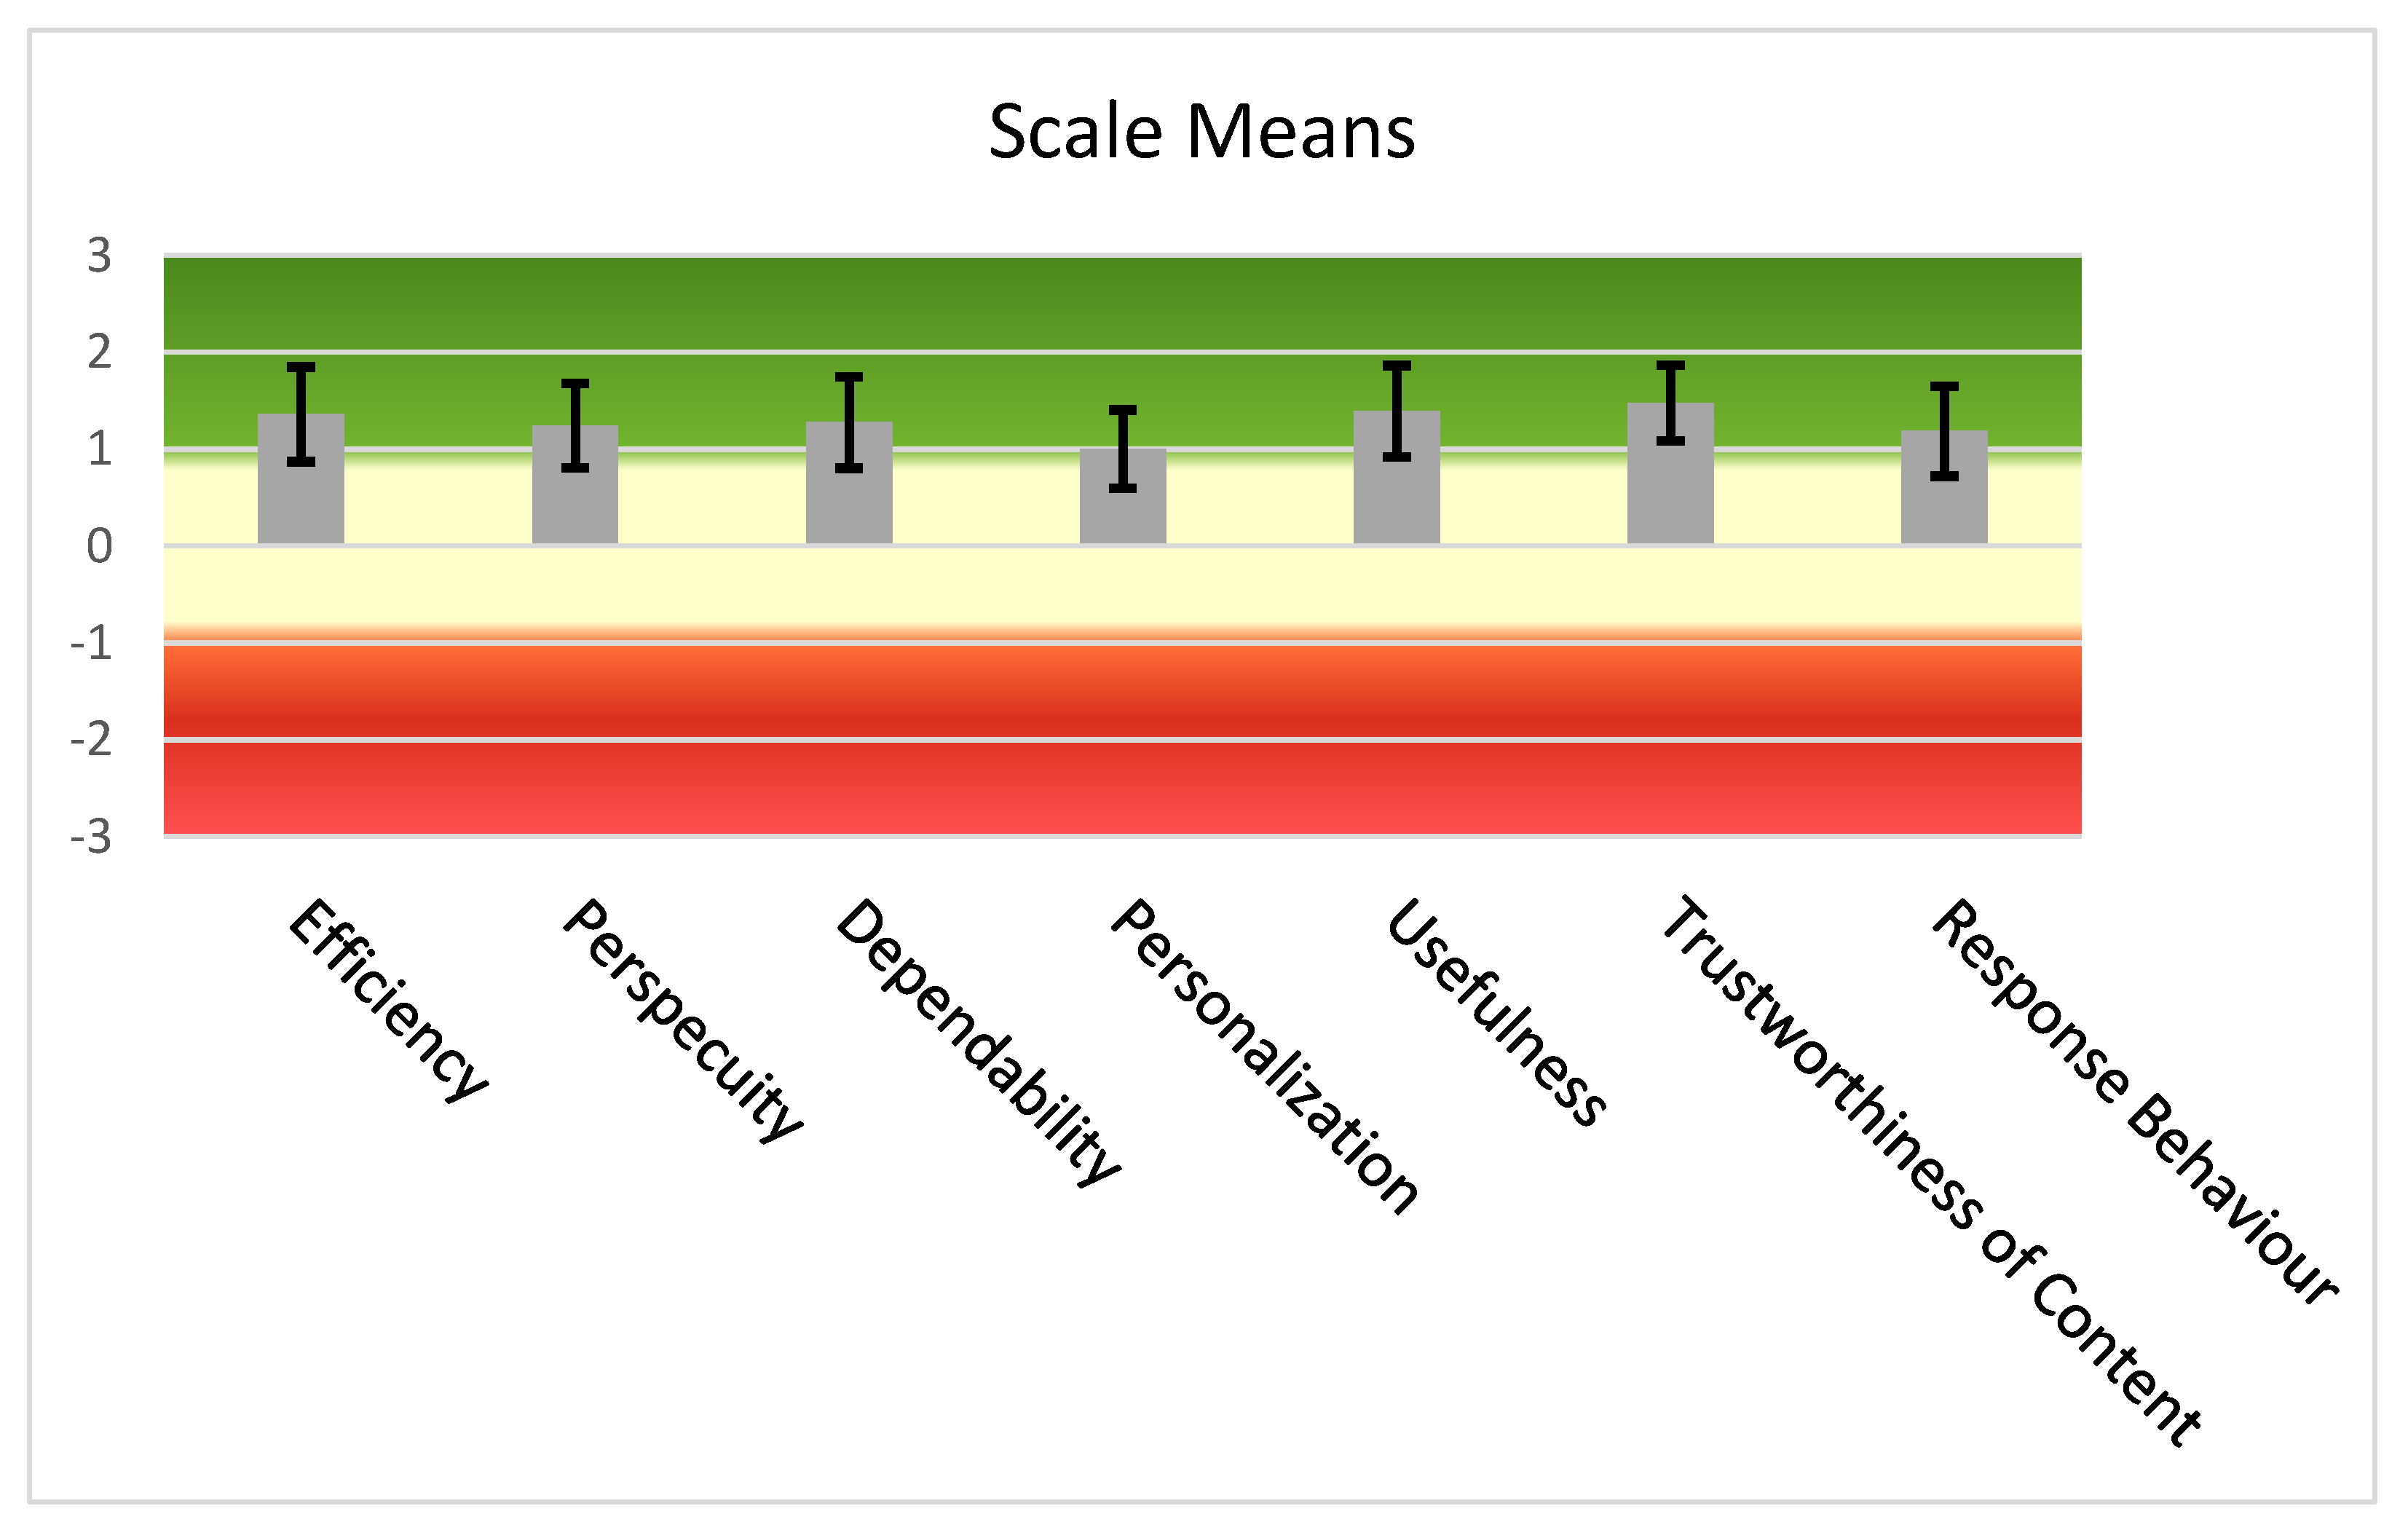
| Scale | Mean Value | Standard Deviation | Confidence | Confidence Intervals | |
|---|---|---|---|---|---|
| Efficiency | 1.36 | 1.37 | 0.49 | 0.87 | 1.85 |
| Perspicuity | 1.25 | 1.22 | 0.44 | 0.81 | 1.68 |
| Dependability | 1.38 | 1.25 | 0.45 | 0.94 | 1.83 |
| Personalization | 1.00 | 1.13 | 0.41 | 0.59 | 1.41 |
| Usefulness | 1.39 | 1.32 | 0.47 | 0.92 | 1.86 |
| Trustworthiness of Content | 1.34 | 1.00 | 0.36 | 0.99 | 1.70 |
| Response Behavior | 1.18 | 1.30 | 0.46 | 0.72 | 1.65 |
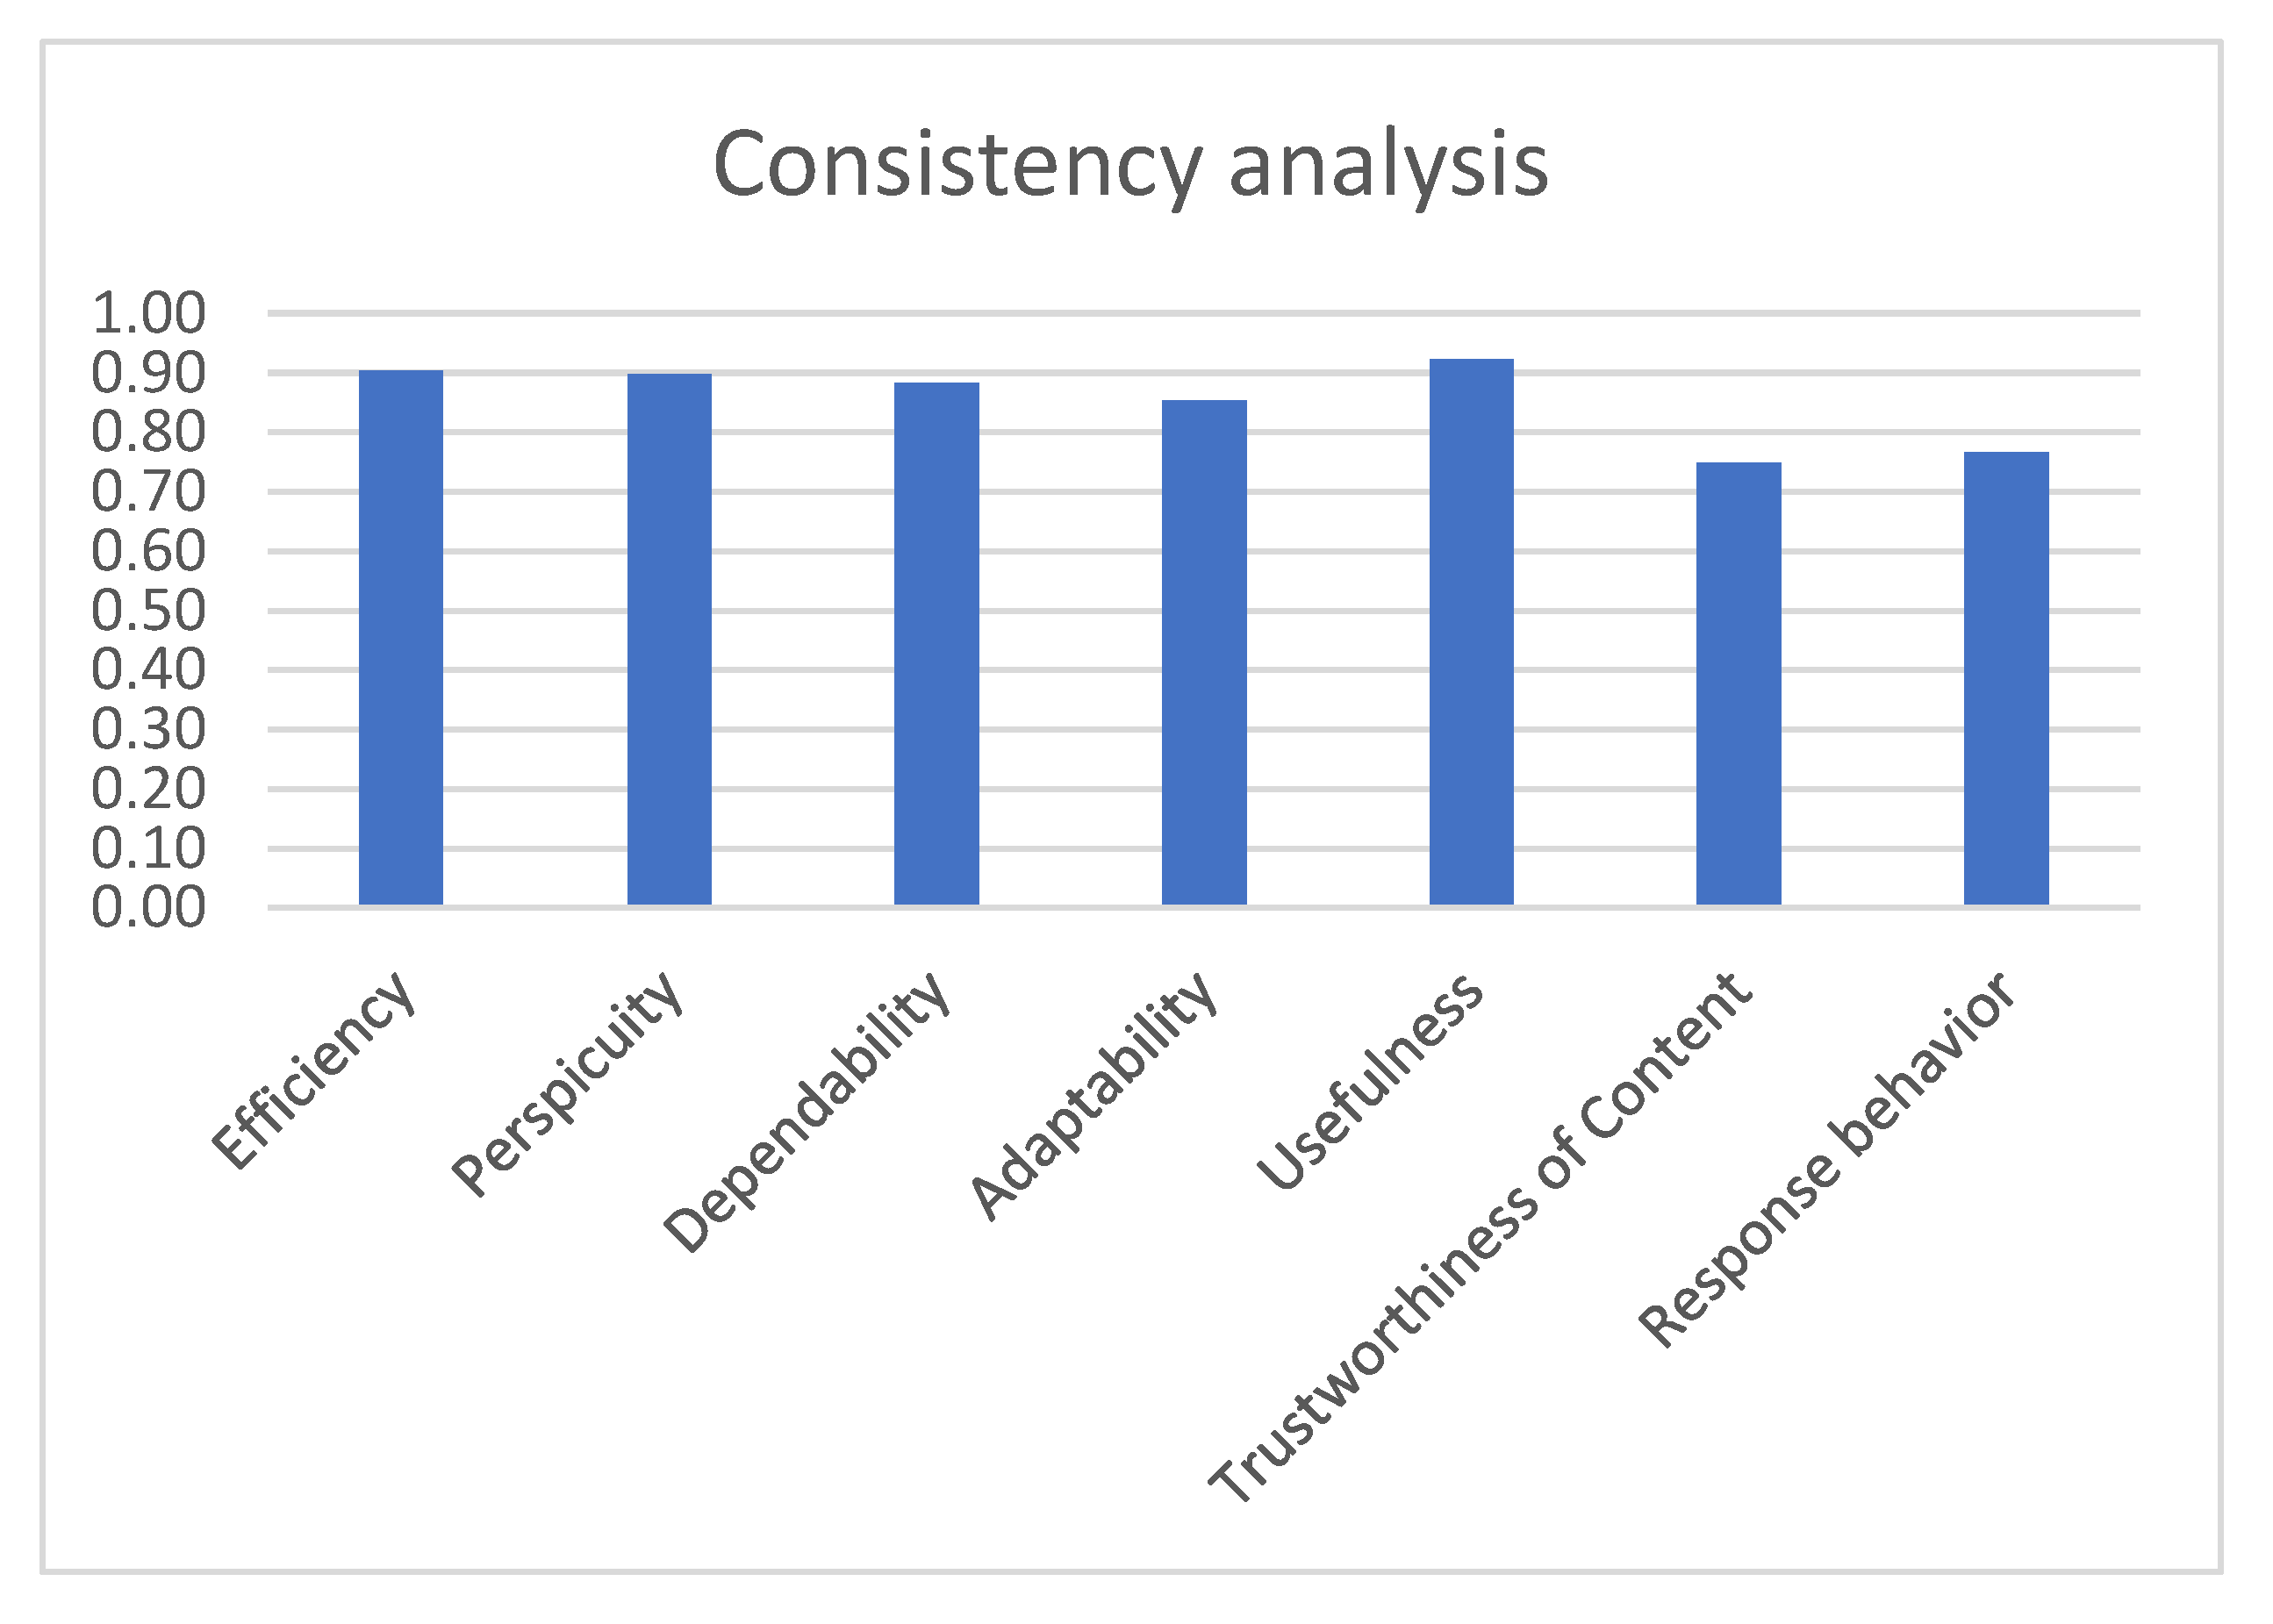
| Efficiency | 0.9 |
| Perspicuity | 0.9 |
| Dependability | 0.9 |
| Adaptability | 0.85 |
| Usefulness | 0.92 |
| Trustworthiness of Content | 0.72 |
| Response Behavior | 0.77 |
Publisher’s Note: MDPI stays neutral with regard to jurisdictional claims in published maps and institutional affiliations. |
© 2022 by the authors. Licensee MDPI, Basel, Switzerland. This article is an open access article distributed under the terms and conditions of the Creative Commons Attribution (CC BY) license (https://creativecommons.org/licenses/by/4.0/).
Share and Cite
Theodorou, P.; Tsiligkos, K.; Meliones, A.; Filios, C. An Extended Usability and UX Evaluation of a Mobile Application for the Navigation of Individuals with Blindness and Visual Impairments Outdoors—An Evaluation Framework Based on Training. Sensors 2022, 22, 4538. https://doi.org/10.3390/s22124538
Theodorou P, Tsiligkos K, Meliones A, Filios C. An Extended Usability and UX Evaluation of a Mobile Application for the Navigation of Individuals with Blindness and Visual Impairments Outdoors—An Evaluation Framework Based on Training. Sensors. 2022; 22(12):4538. https://doi.org/10.3390/s22124538
Chicago/Turabian StyleTheodorou, Paraskevi, Kleomenis Tsiligkos, Apostolos Meliones, and Costas Filios. 2022. "An Extended Usability and UX Evaluation of a Mobile Application for the Navigation of Individuals with Blindness and Visual Impairments Outdoors—An Evaluation Framework Based on Training" Sensors 22, no. 12: 4538. https://doi.org/10.3390/s22124538
APA StyleTheodorou, P., Tsiligkos, K., Meliones, A., & Filios, C. (2022). An Extended Usability and UX Evaluation of a Mobile Application for the Navigation of Individuals with Blindness and Visual Impairments Outdoors—An Evaluation Framework Based on Training. Sensors, 22(12), 4538. https://doi.org/10.3390/s22124538