
Practical Experiences of a Smart Livestock Location Monitoring System Leveraging GNSS, LoRaWAN and Cloud Services


Abstract
:1. Introduction
- A comprehensive state-of-the-art section is provided on the techniques and technologies used for livestock localization.
- A description of the hardware design and the firmware used.
- A detailed description of the design and development of the cloud-based monitoring platform for the livestock localization system consisting of the sensors, communication technology, and data-processing modules.
- We discuss the results of experiments to evaluate the transmission quality of our testbed under various scenarios.
2. State-of-the-Art and Related Works
2.1. Livestock Localization
- Time-of-Arrival (ToA) [15,16] utilizes the signal propagation time to calculate the distance between the transmitter and the receiver through the use of synchronized clocks. ToA uses time stamps labeled in the transmitted signals along with the received time to determine the distance the signal had traveled. ToA is one of the most accurate techniques available, but a perfect synchronization between the transmitters and receivers is important, thus also introducing complexity to the system. The key factors that affect ToA estimation accuracy are the signal bandwidth and the sampling rate. Low sampling rate (in time) reduces the ToA resolution as the signal may arrive between the sampled intervals. Frequency domain super-resolution techniques are commonly used to obtain the ToA with high resolution from the channel frequency response. In addition, in a TOA-based localization system, devices in the network need synchronized clocks, which require additional hardware, thus increasing the cost of the system.
- Time-Difference-of-Arrival (TDoA) measures the difference of propagation time between the signals in terms of their nature, such as using RF, acoustic, or ultrasonic signals [17]. The idea is that the distance is calculated by determining the differences in arrival time of the packet to the different receivers. This method is affected by delay that can be experienced by the transmitted signal, as the different distances are calculated based on the propagation times. This method sometimes controls the problem synchronization, and also reduces complexity [18].
- Received Signal Strength Indicator (RSSI) has gained much attention in the last years [19] due to the increasing number of IoT devices utilizing these methods for localization. RSSI measurements are commonly used for target detection, but one can also use them for localization without any additional sensor functionalities. RSSI utilizes some signal propagation models, either theoretical or empirical, to translate signal strength into distance. The received signal strength measurement is also highly sensitive to the interference and may experience significant deviations from one measurement to another.
- Angle-of-Arrival (AoA) is based on angle calculation of which direction the signal is received from (i.e., sent by the node) [20]. AoA systems use an array of antennas to determine the angle from which the signal is propagated. Triangulation is then performed, along with the geometric angles of triangles, to determine the position of the receiver. Using AoA techniques to estimate a position does not require time synchronization between the measuring units, and the position can be determined with as few as three measuring units for 3D positioning or two measuring units for 2D positioning. AoA techniques come at the price of requiring complex hardware and must be calibrated in order to obtain an accurate position [21].
2.1.1. NB-IoT
2.1.2. GNSS
2.1.3. Sigfox
2.1.4. LoRa/LoRaWAN
2.2. Related Works
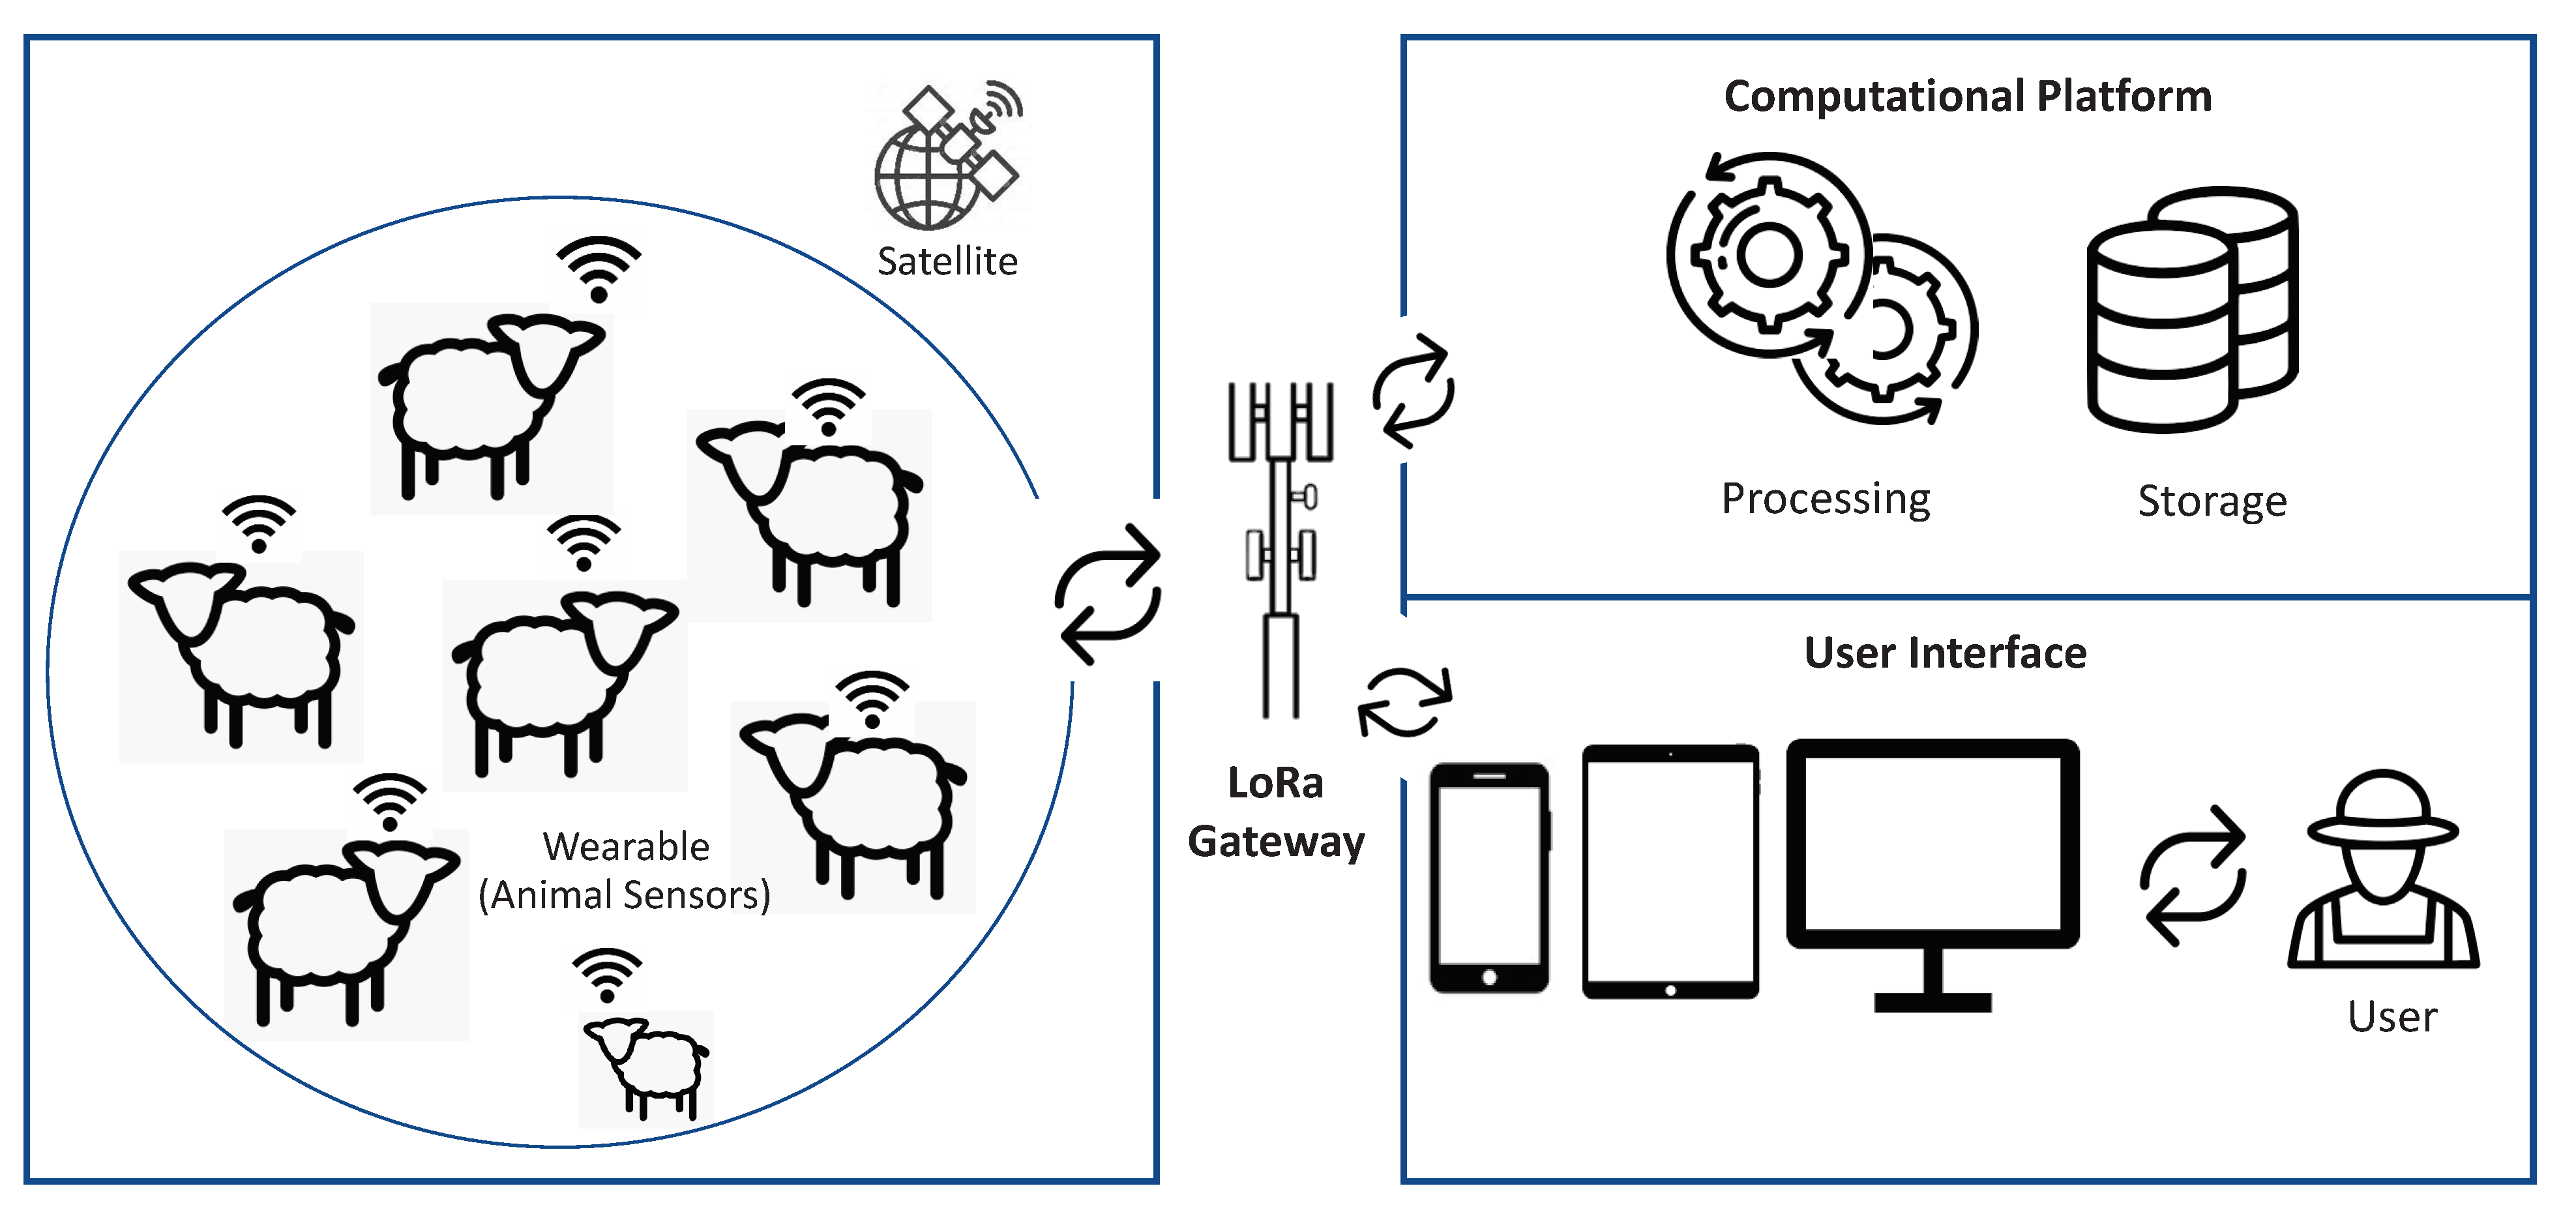
3. System Architecture
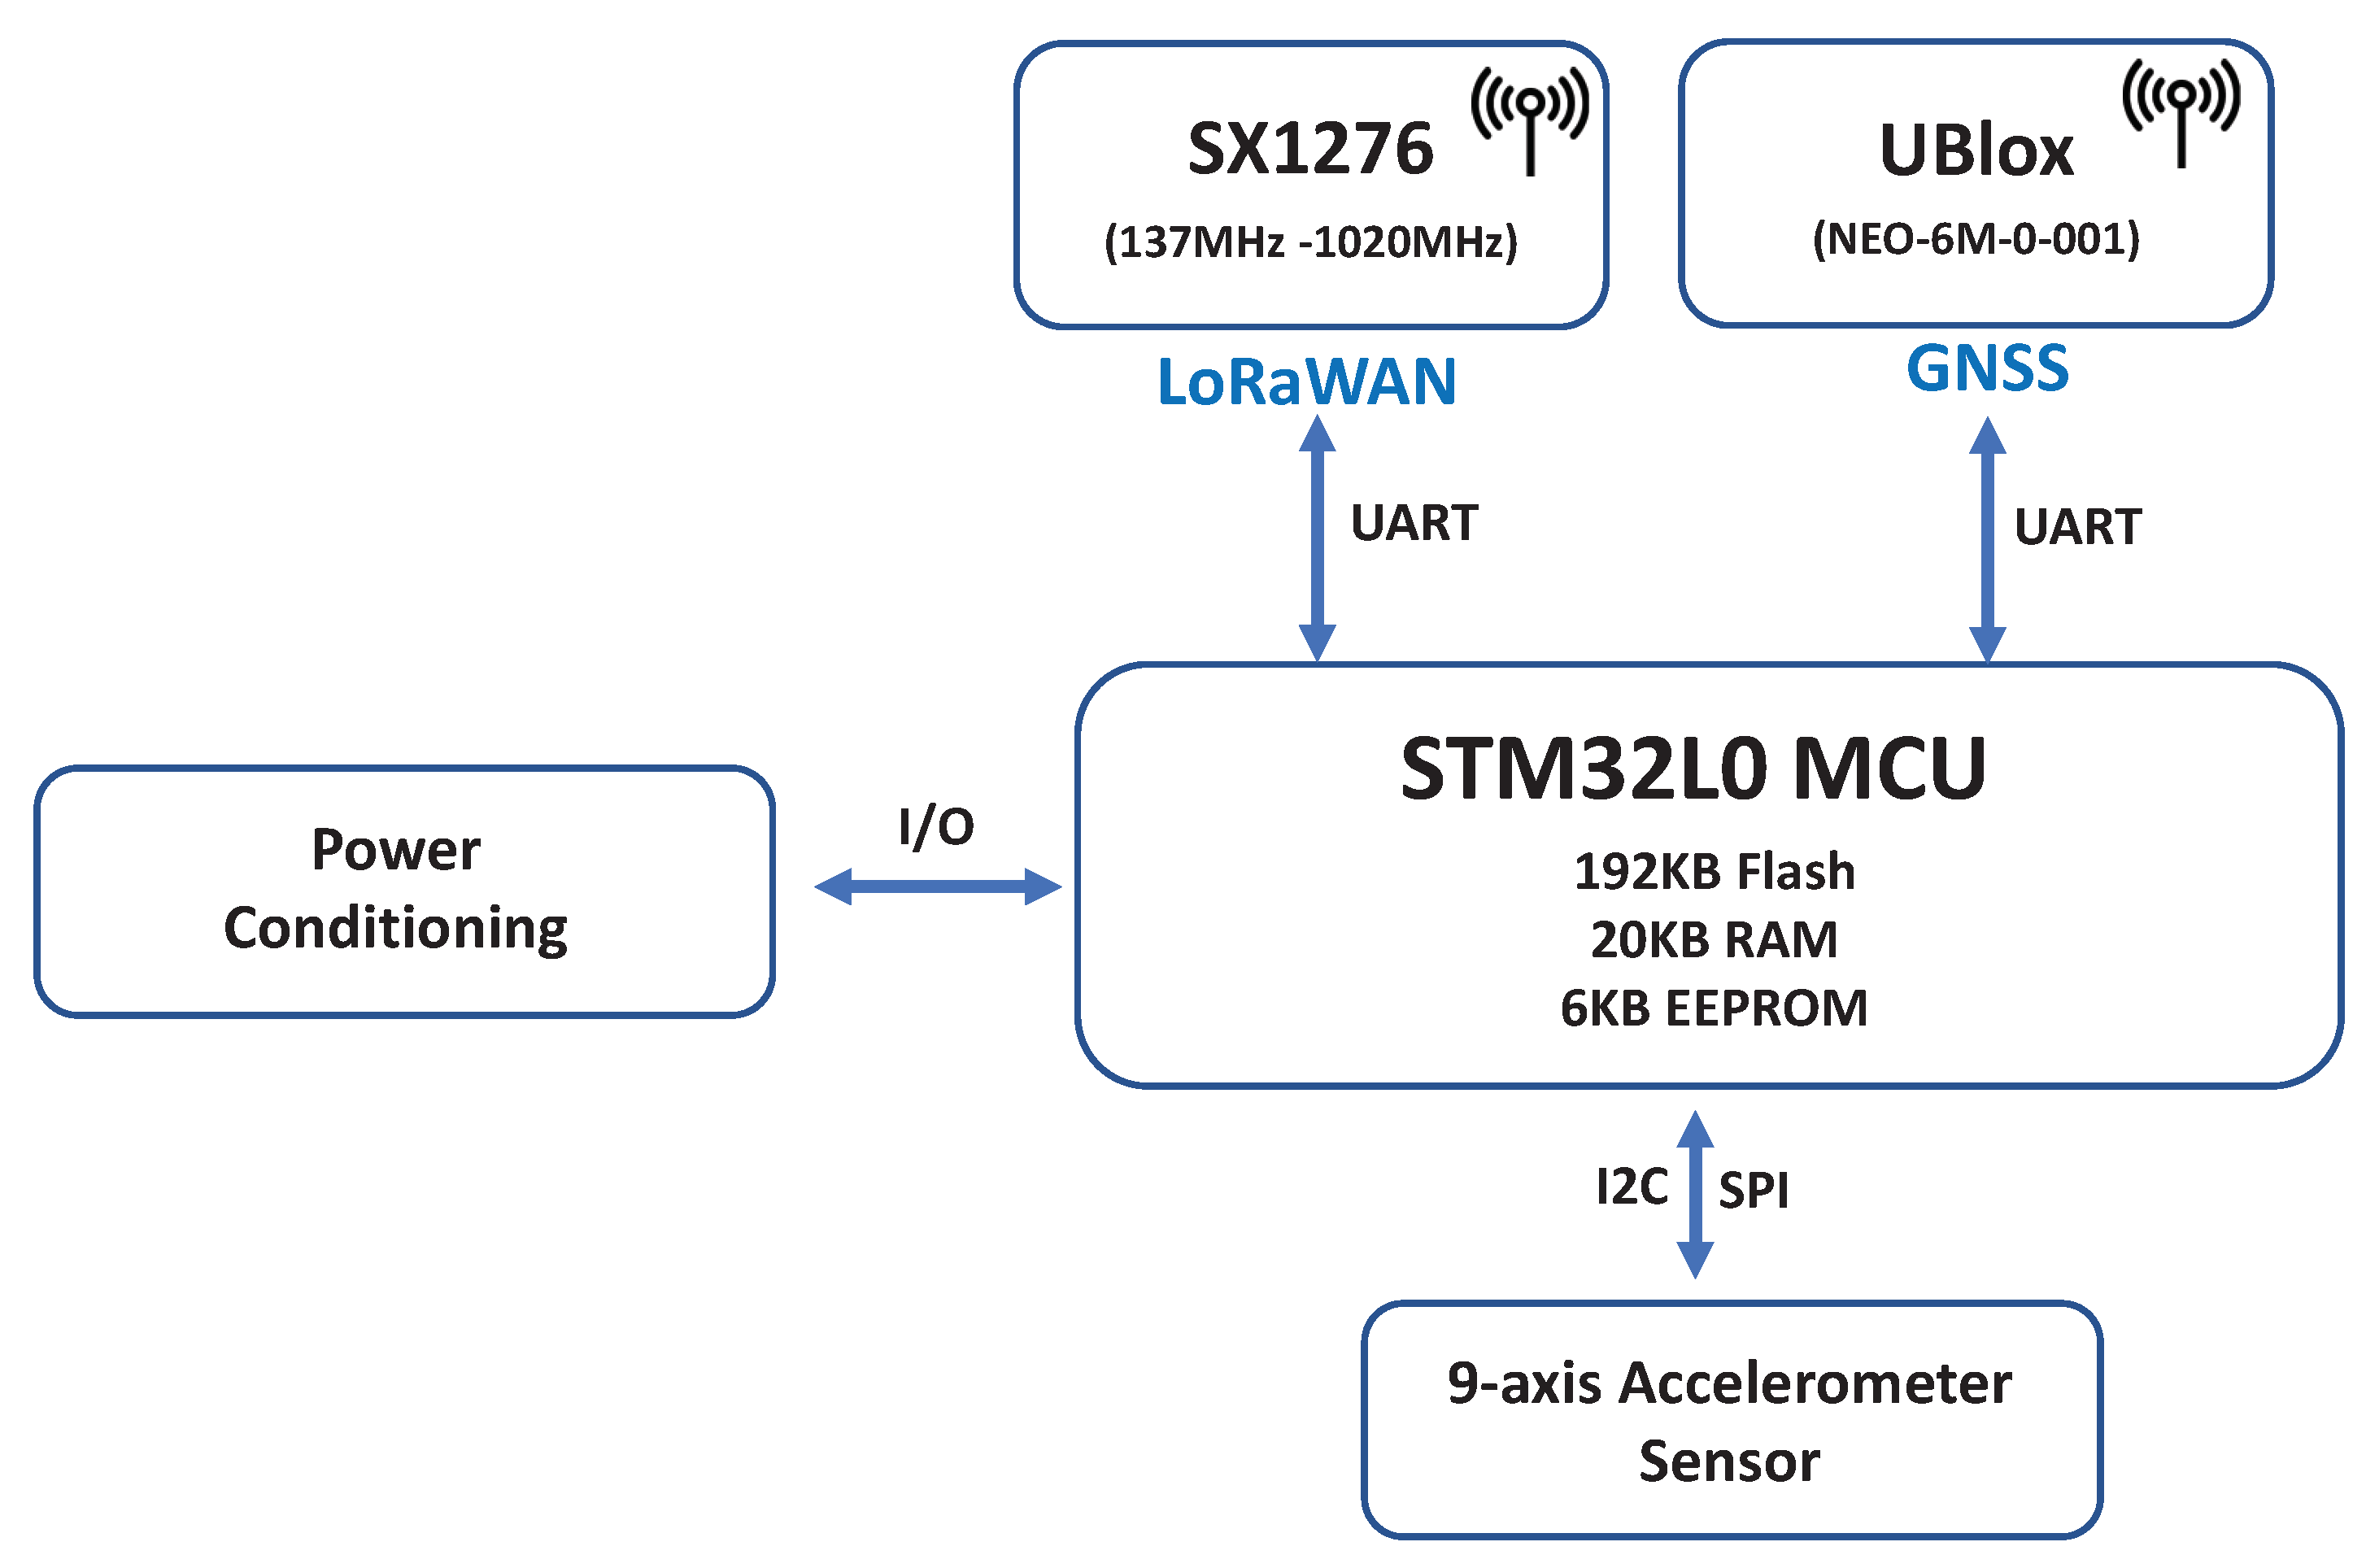
3.1. Device Description
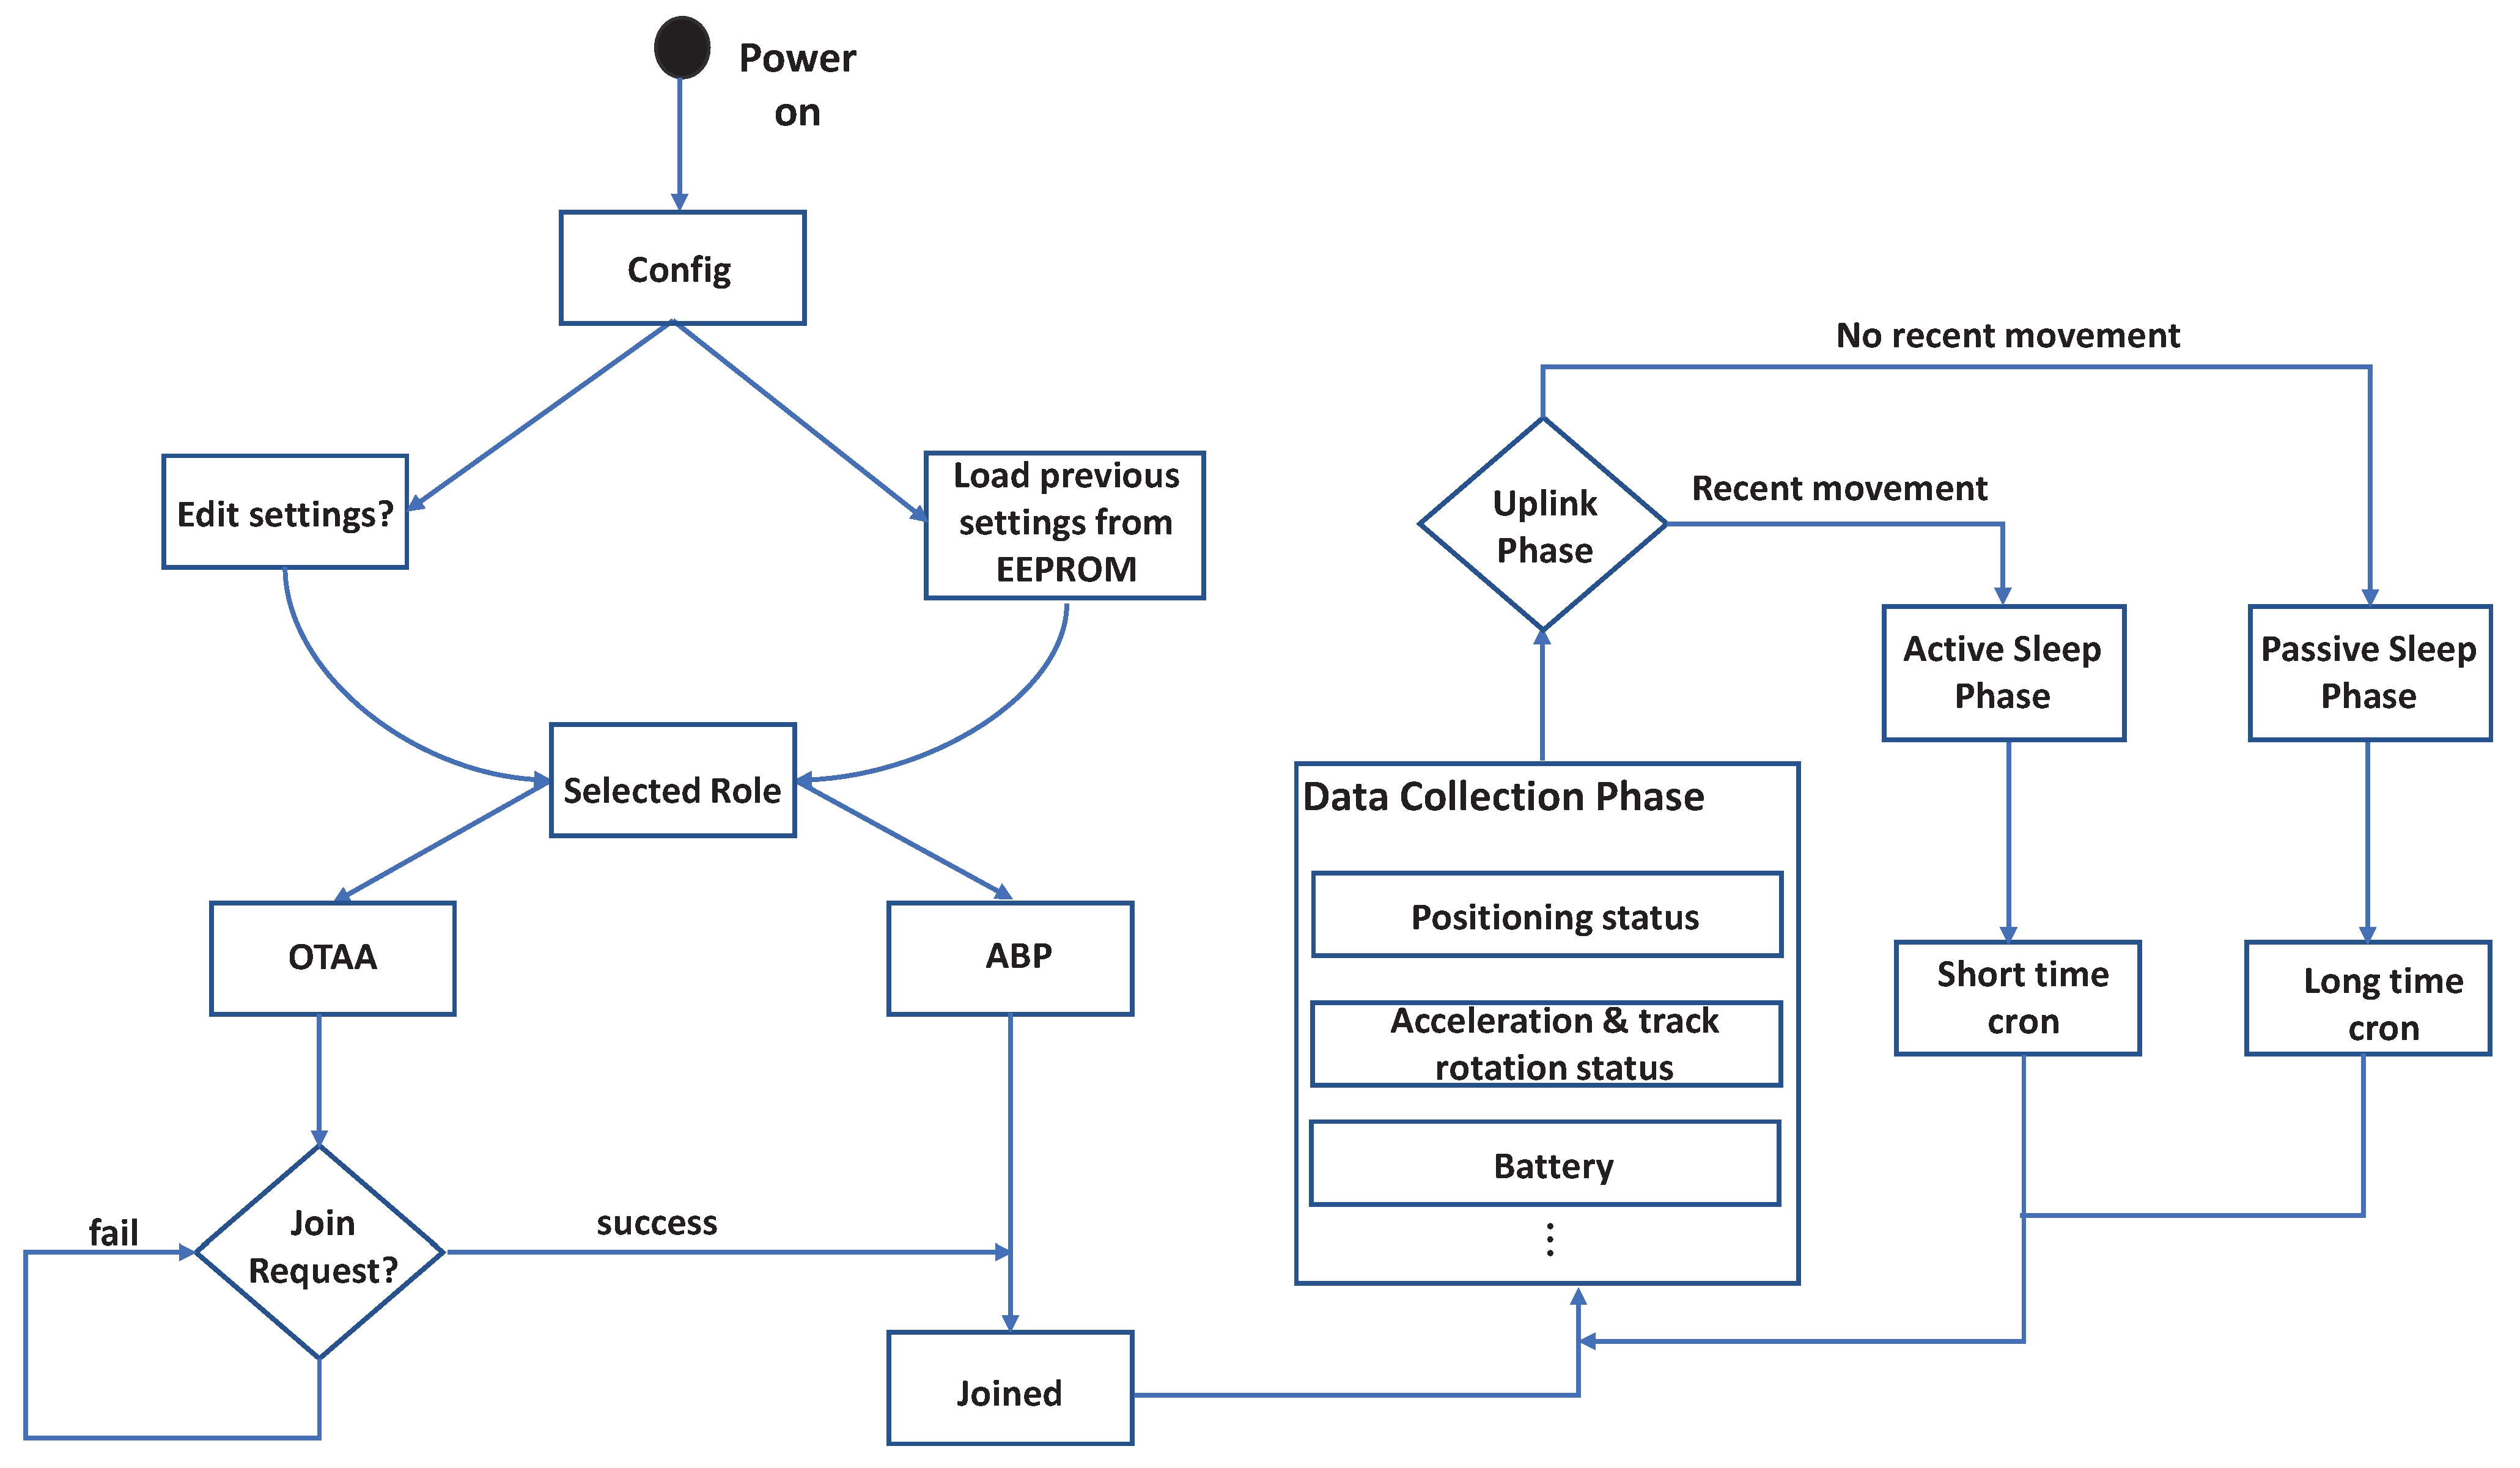
3.2. Mode of Operation
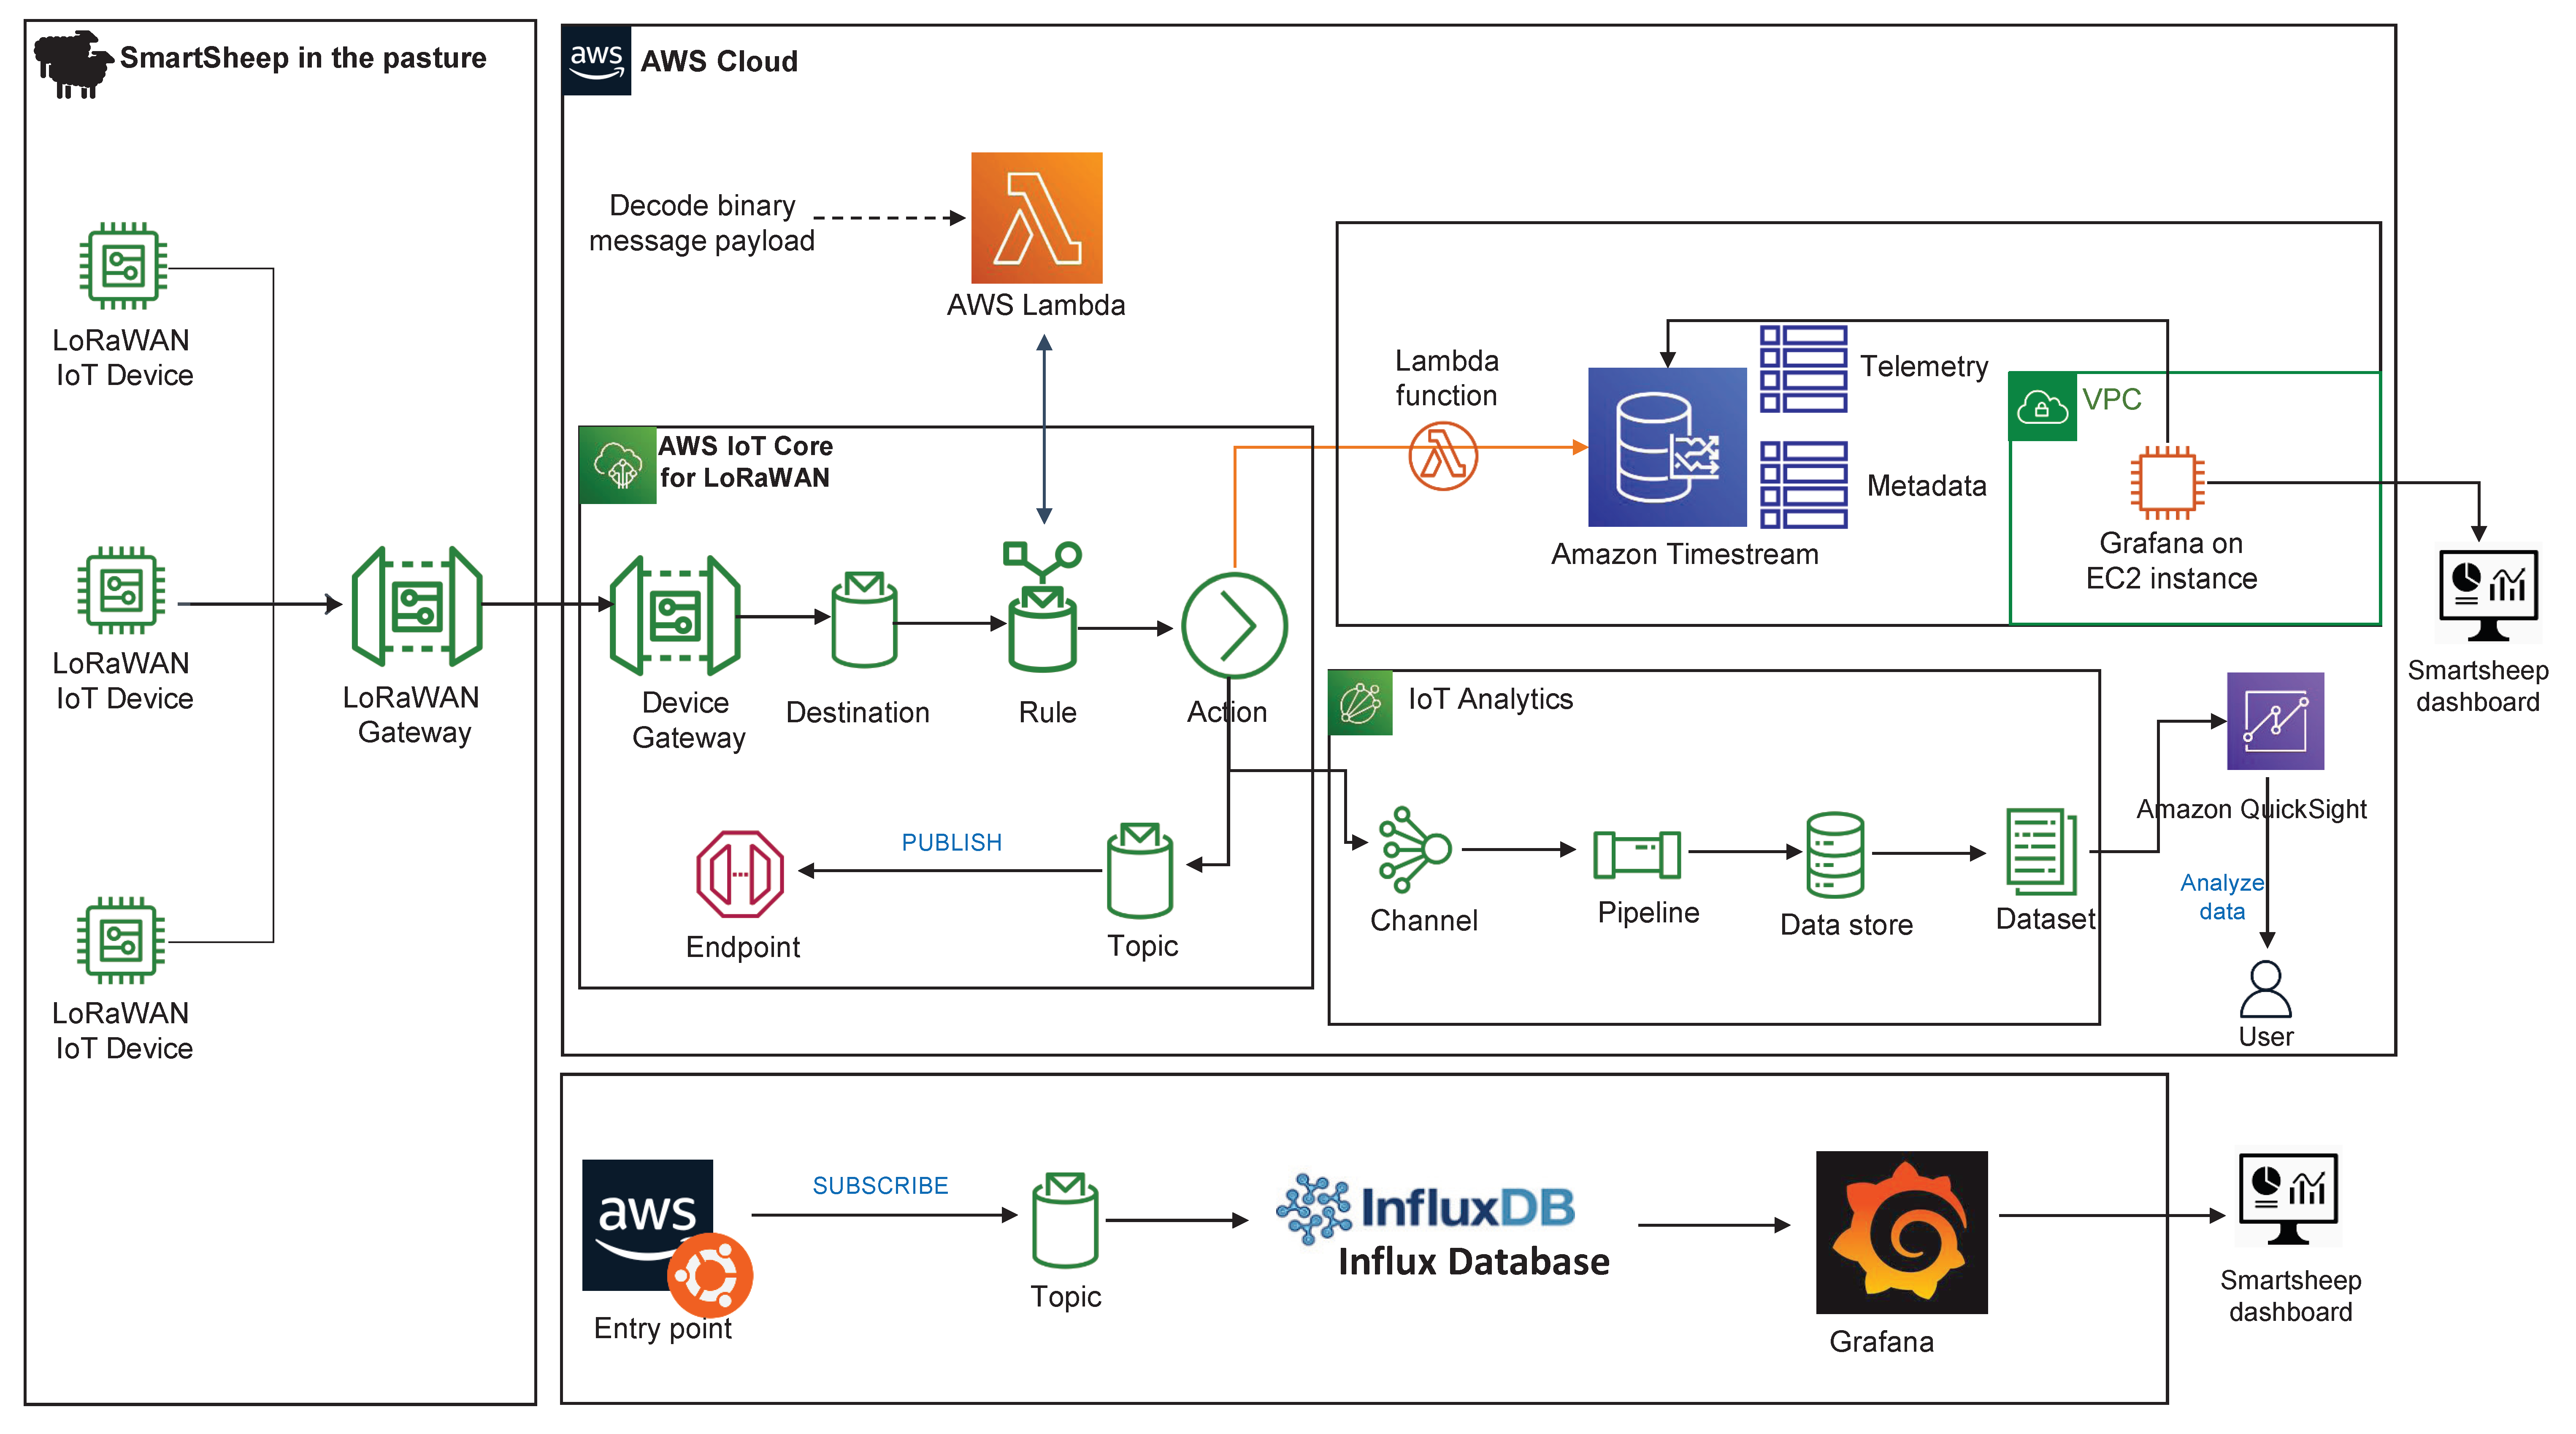
3.3. System Infrastructure
4. Results
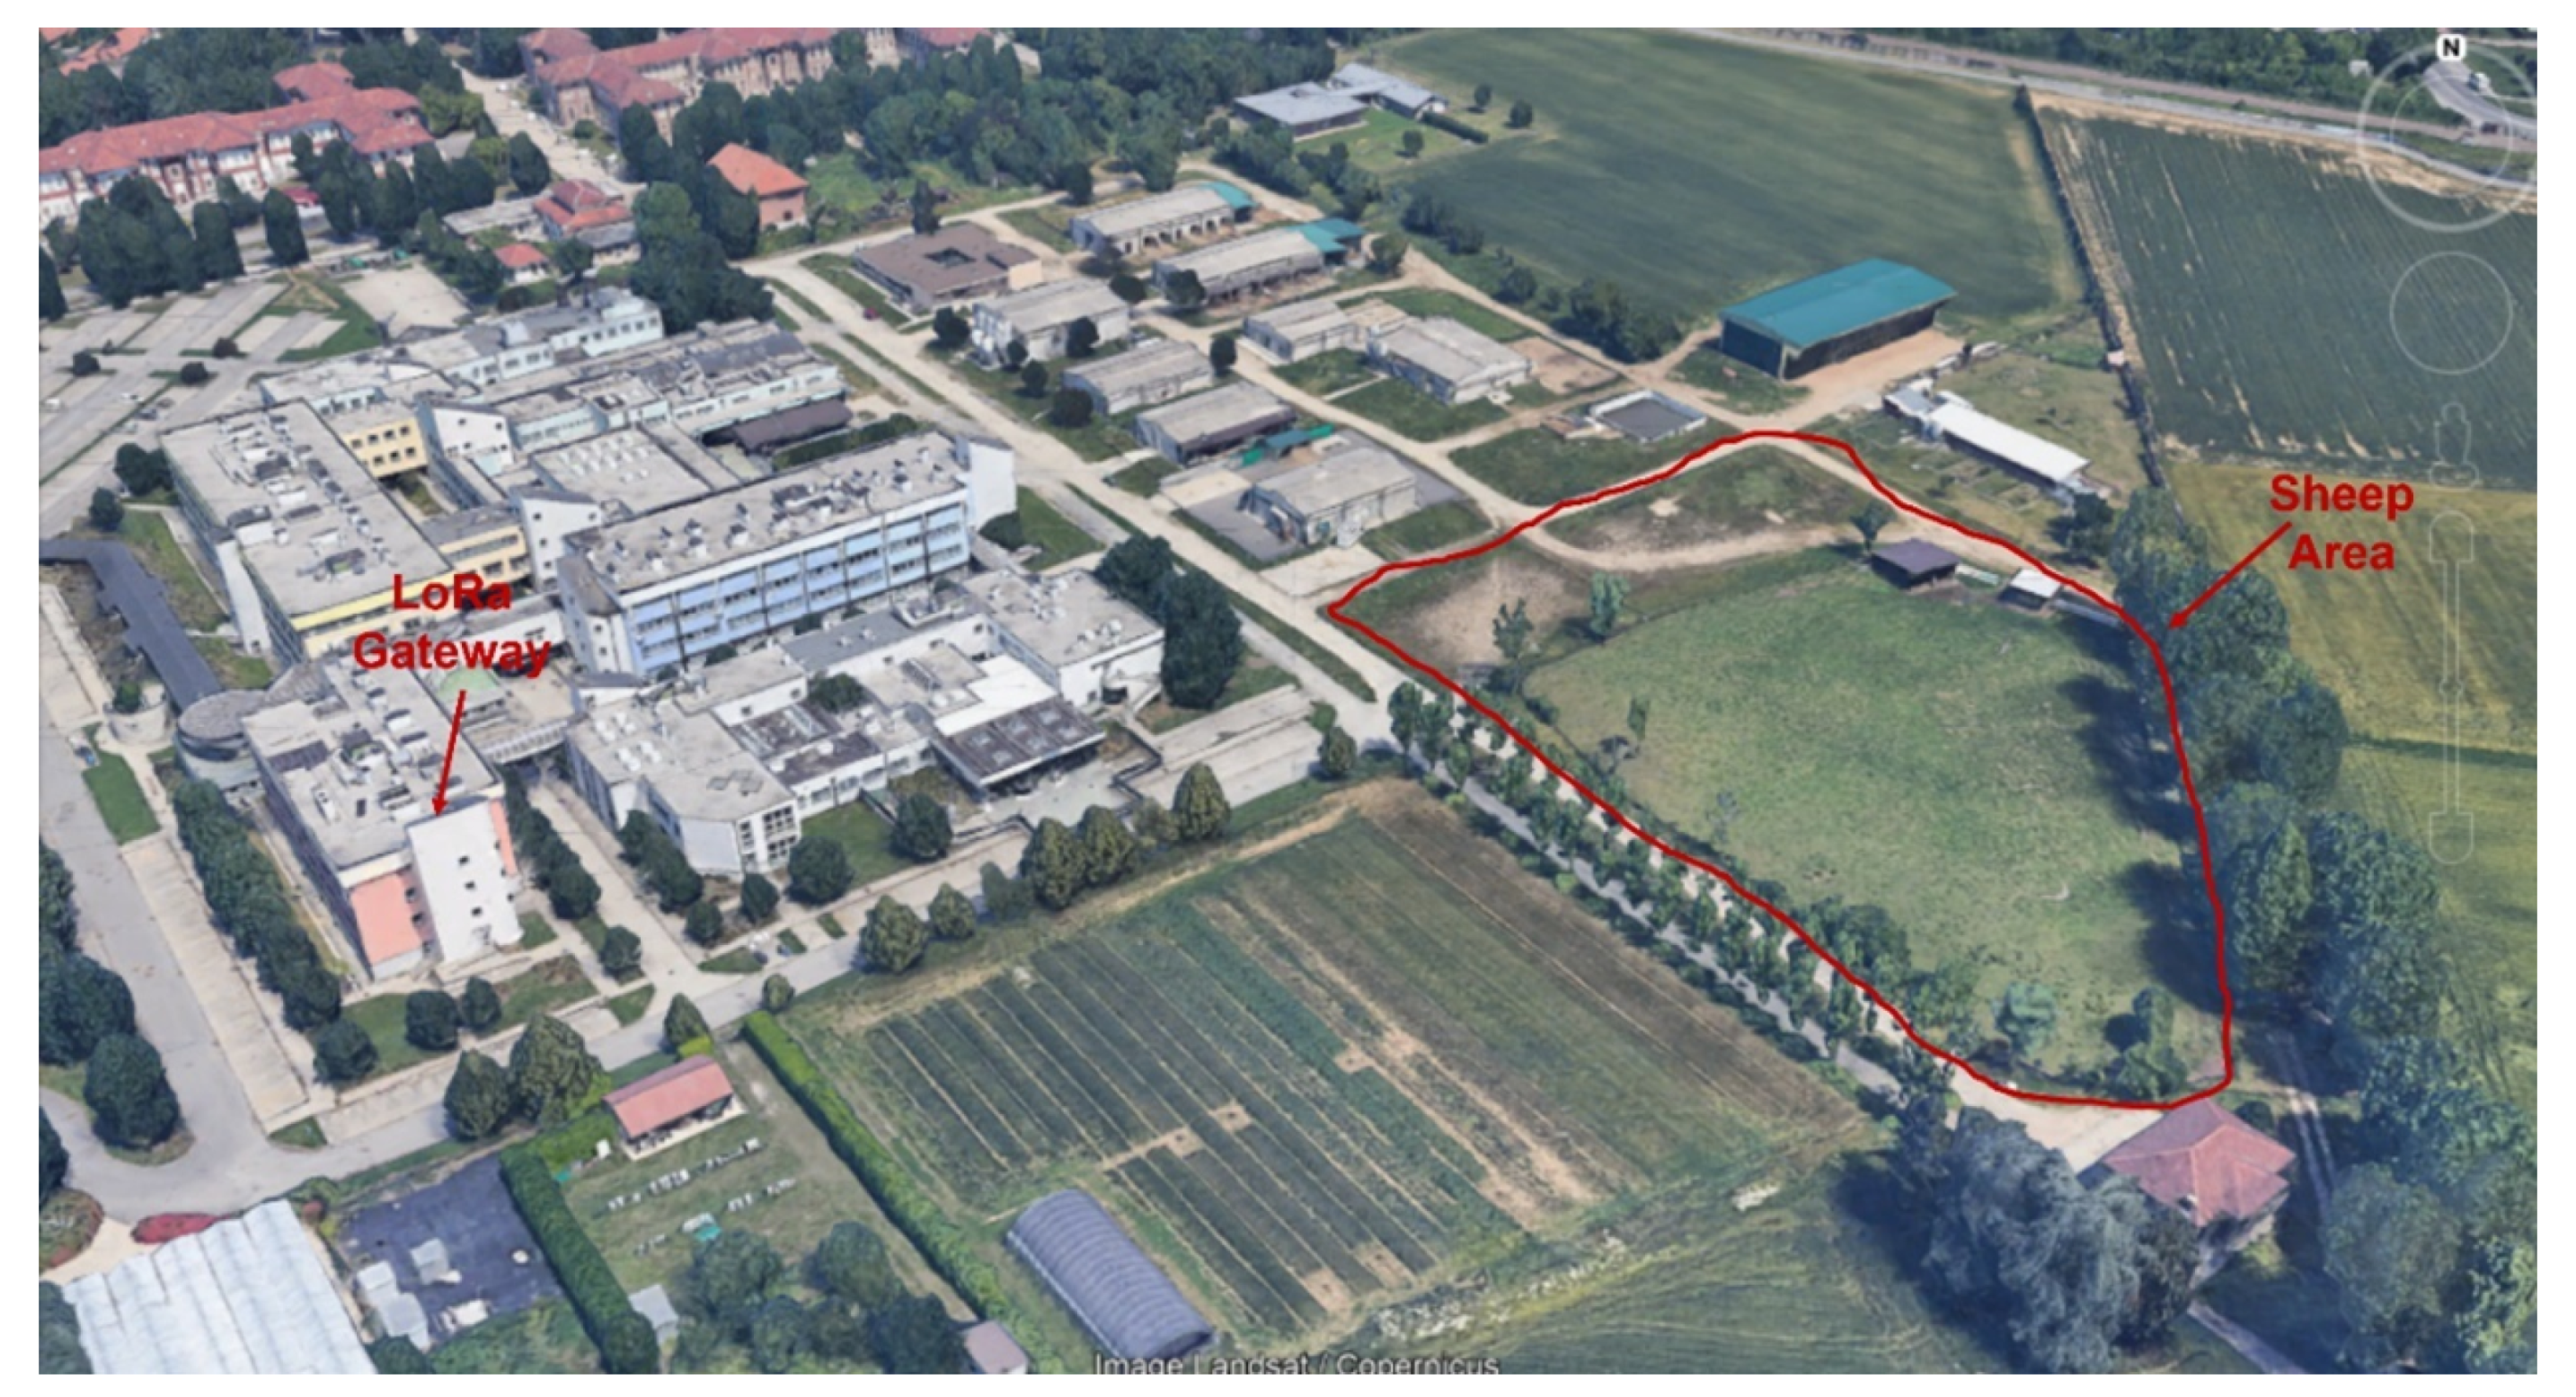
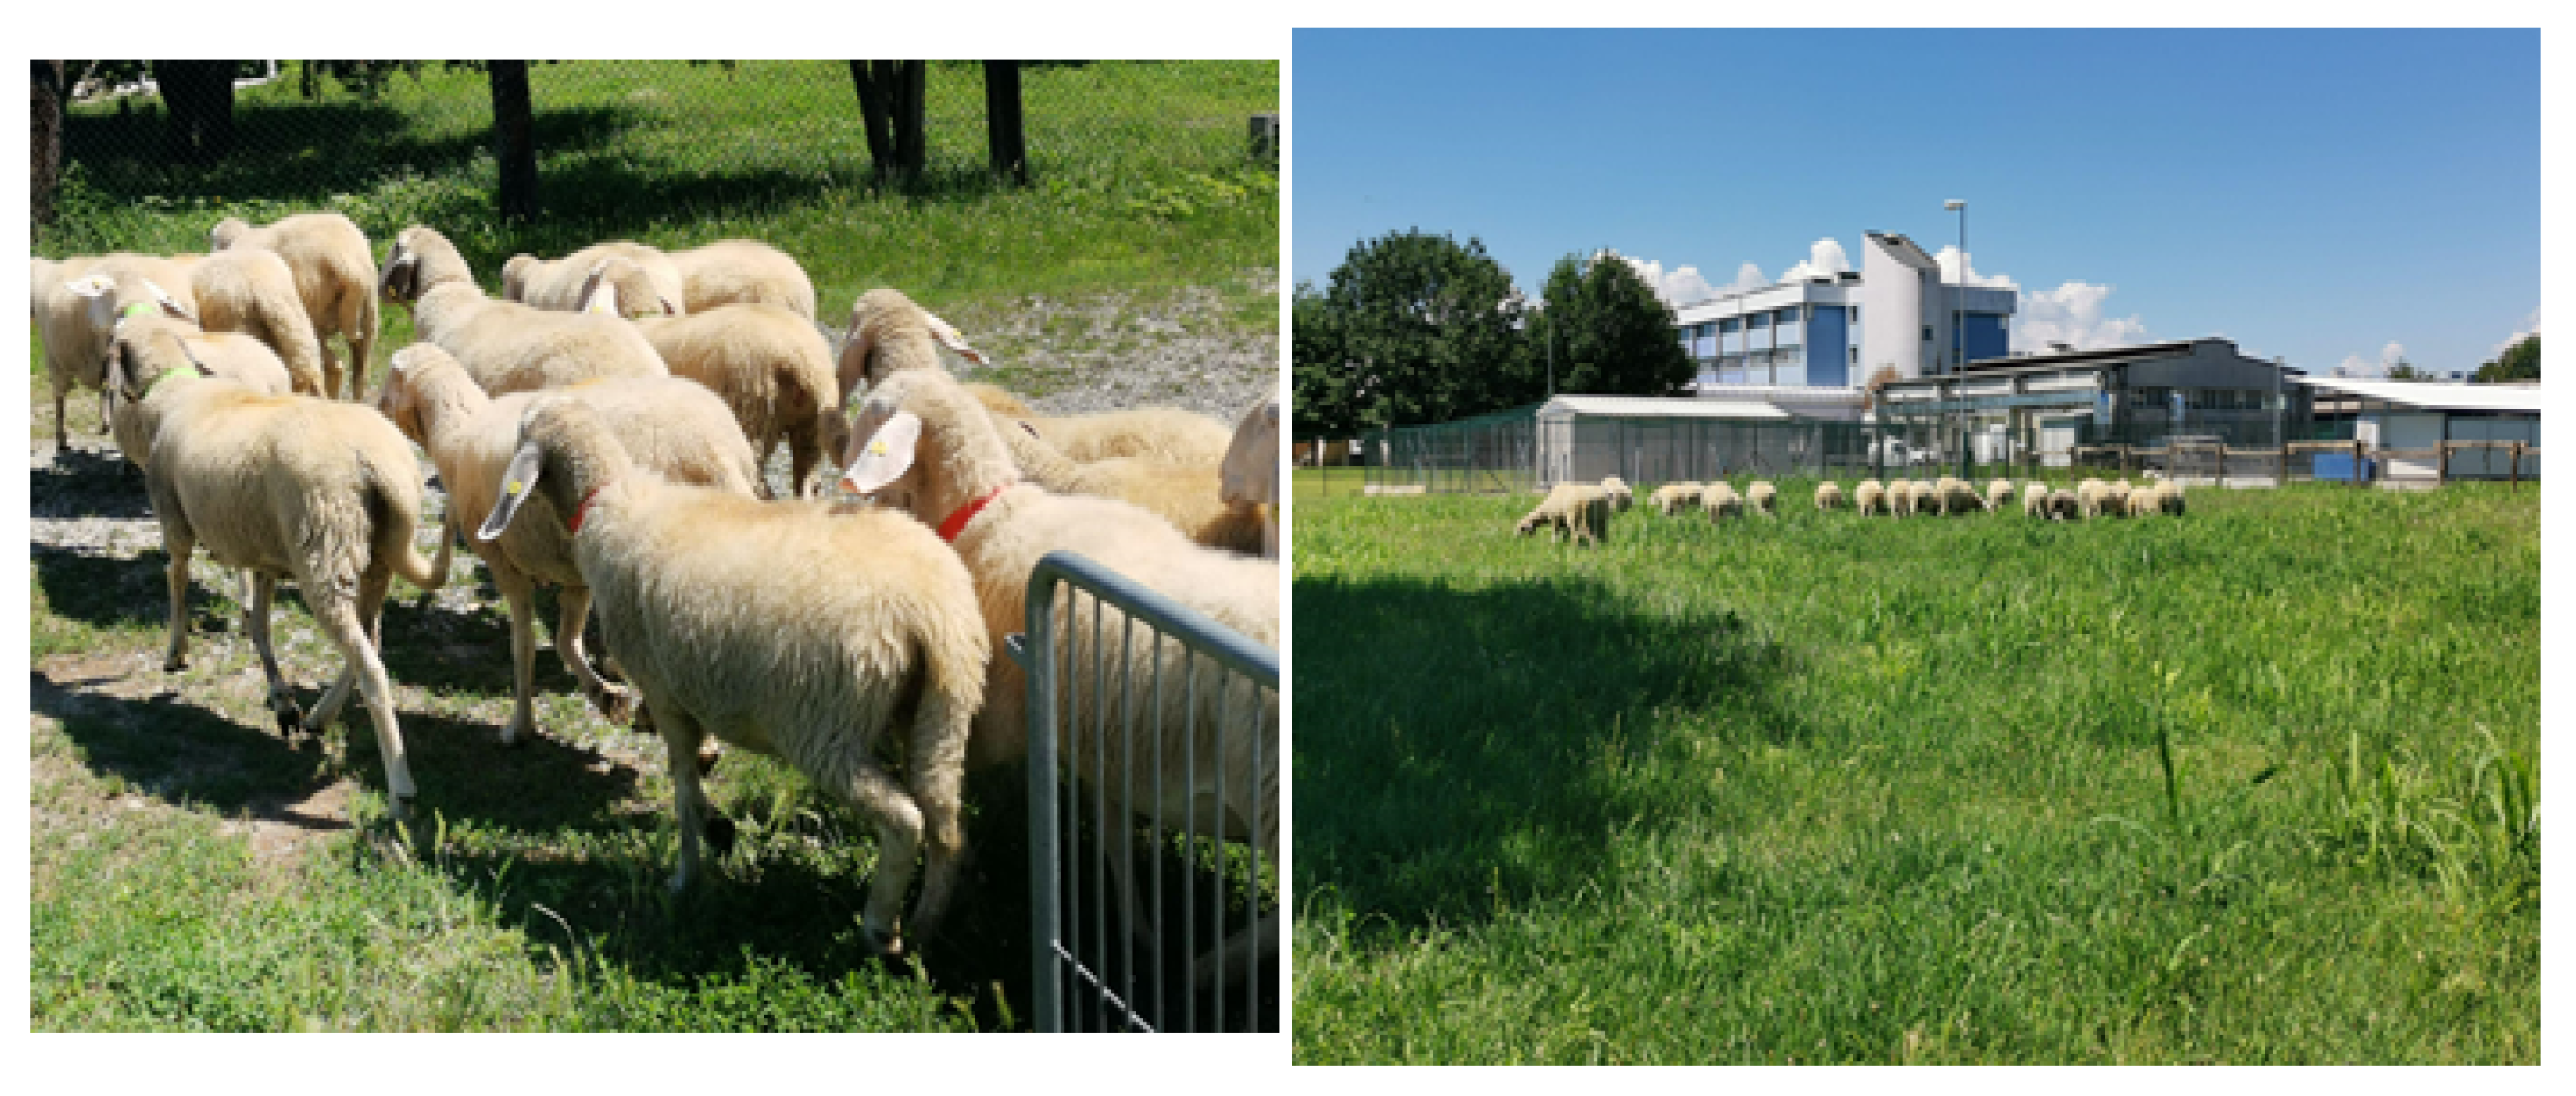
4.1. Experimental Testbed and Configurations
4.2. Convergence Time
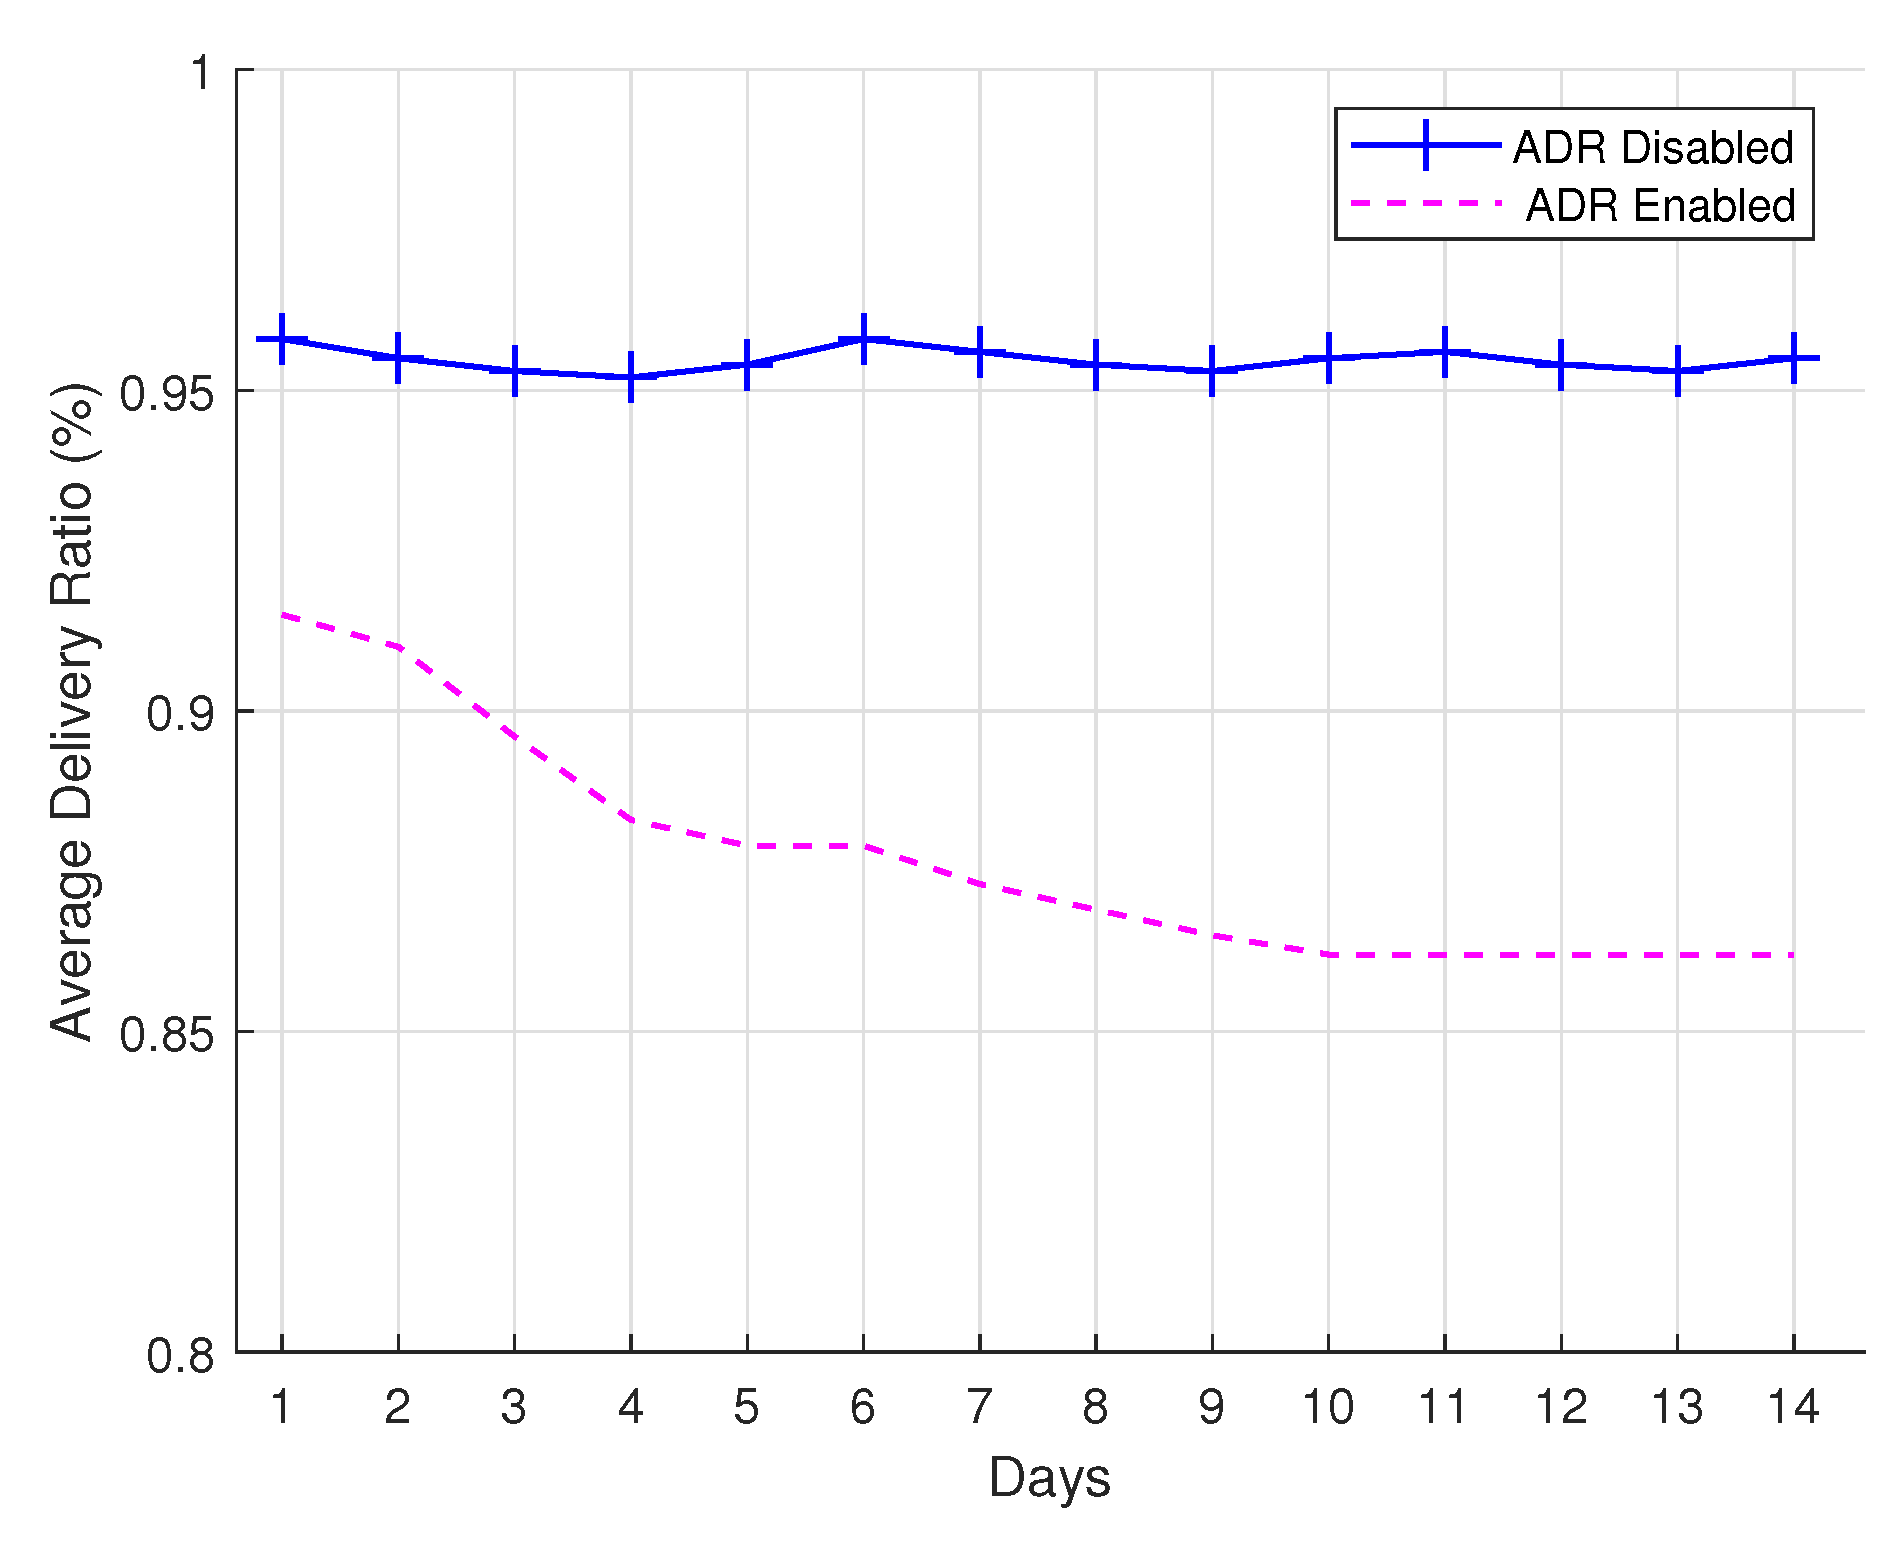
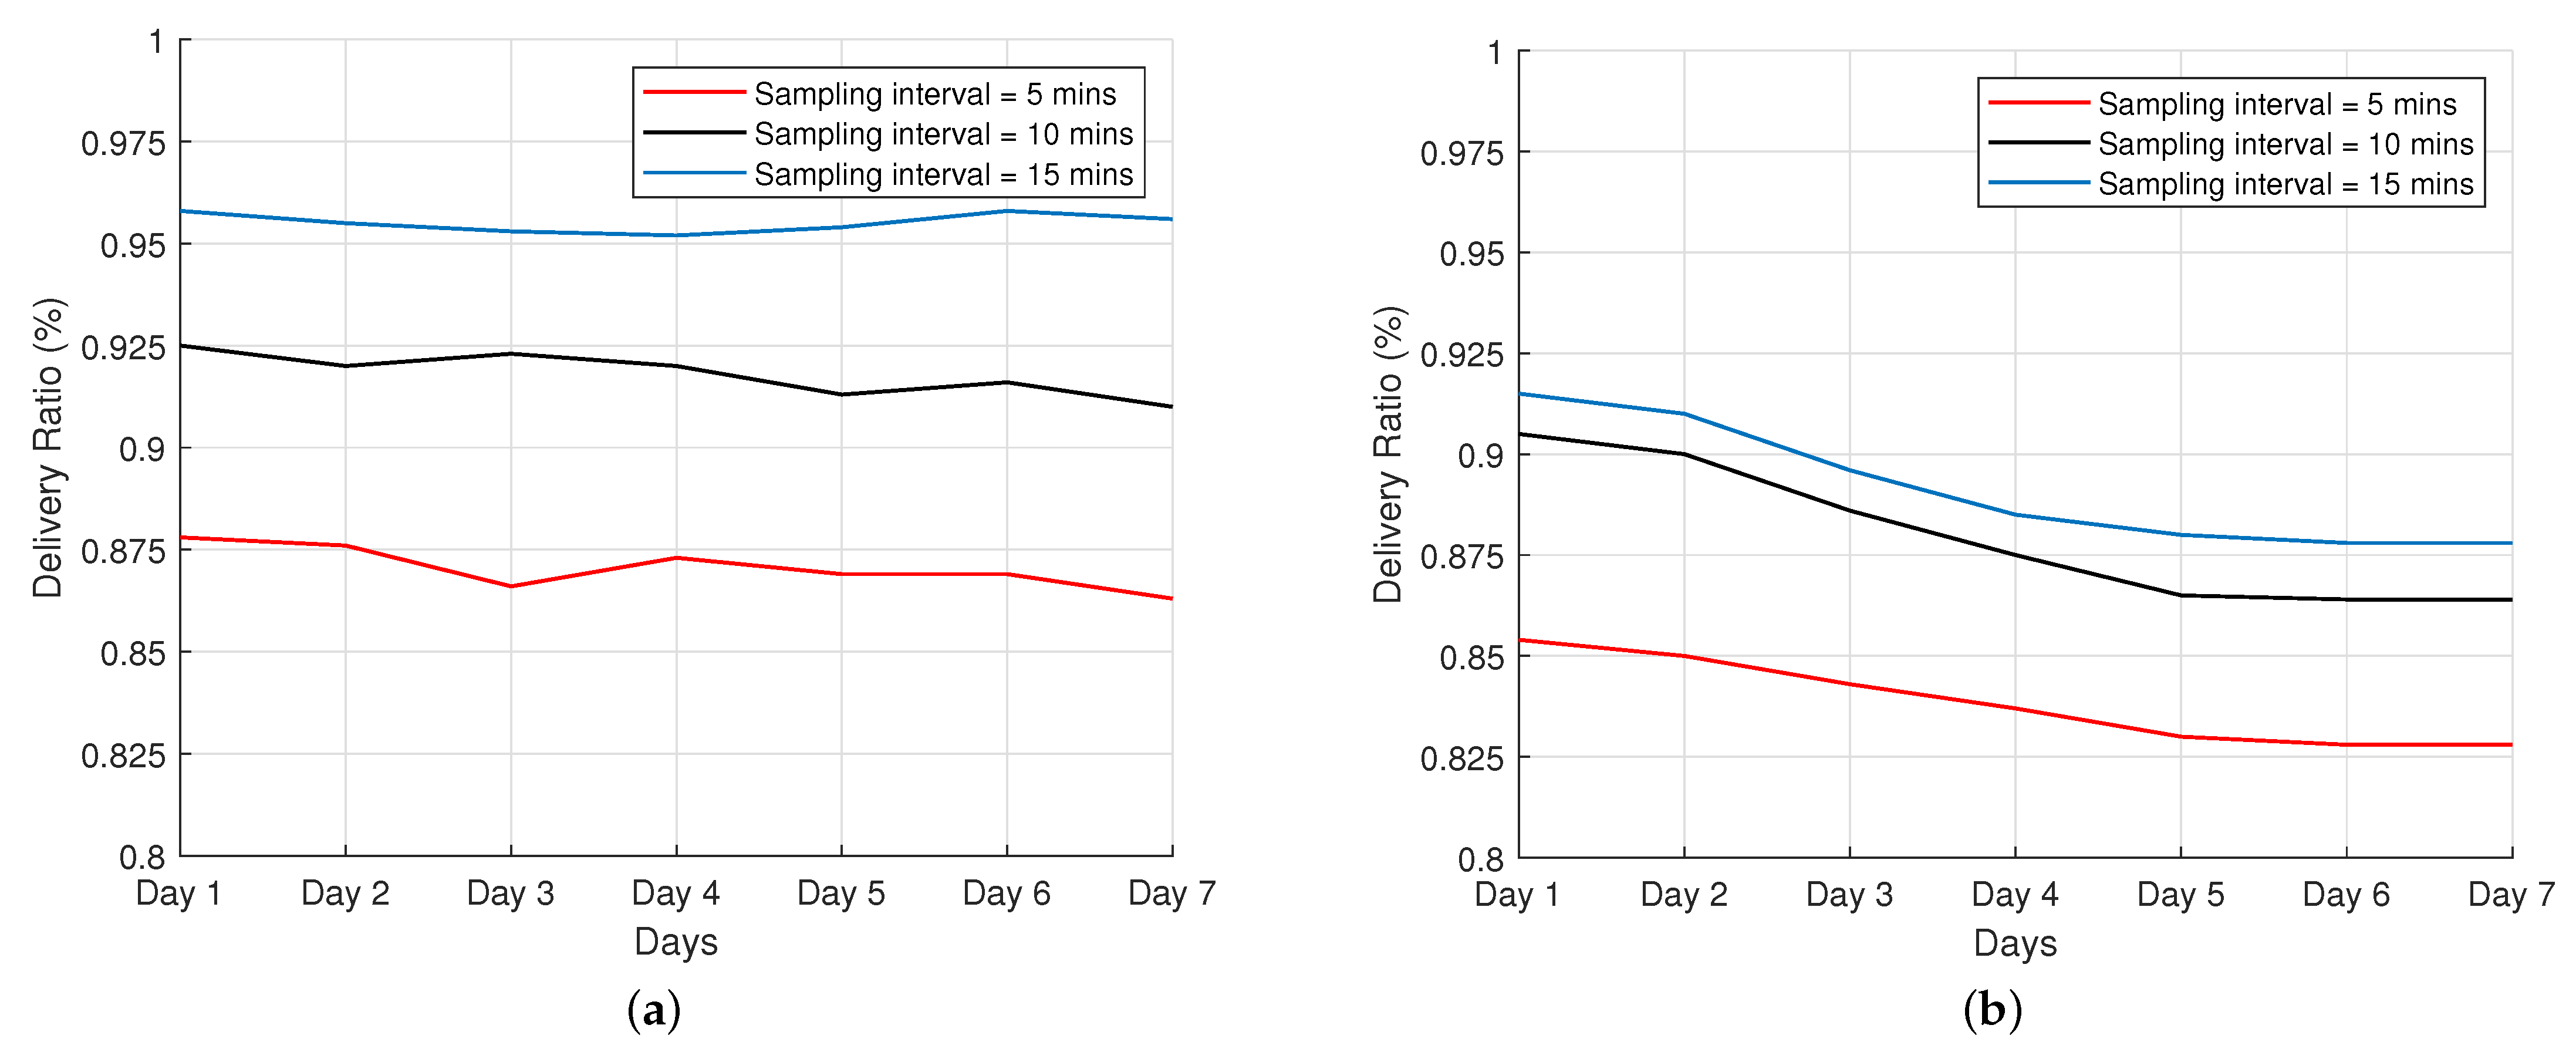
4.3. Delivery Ratio
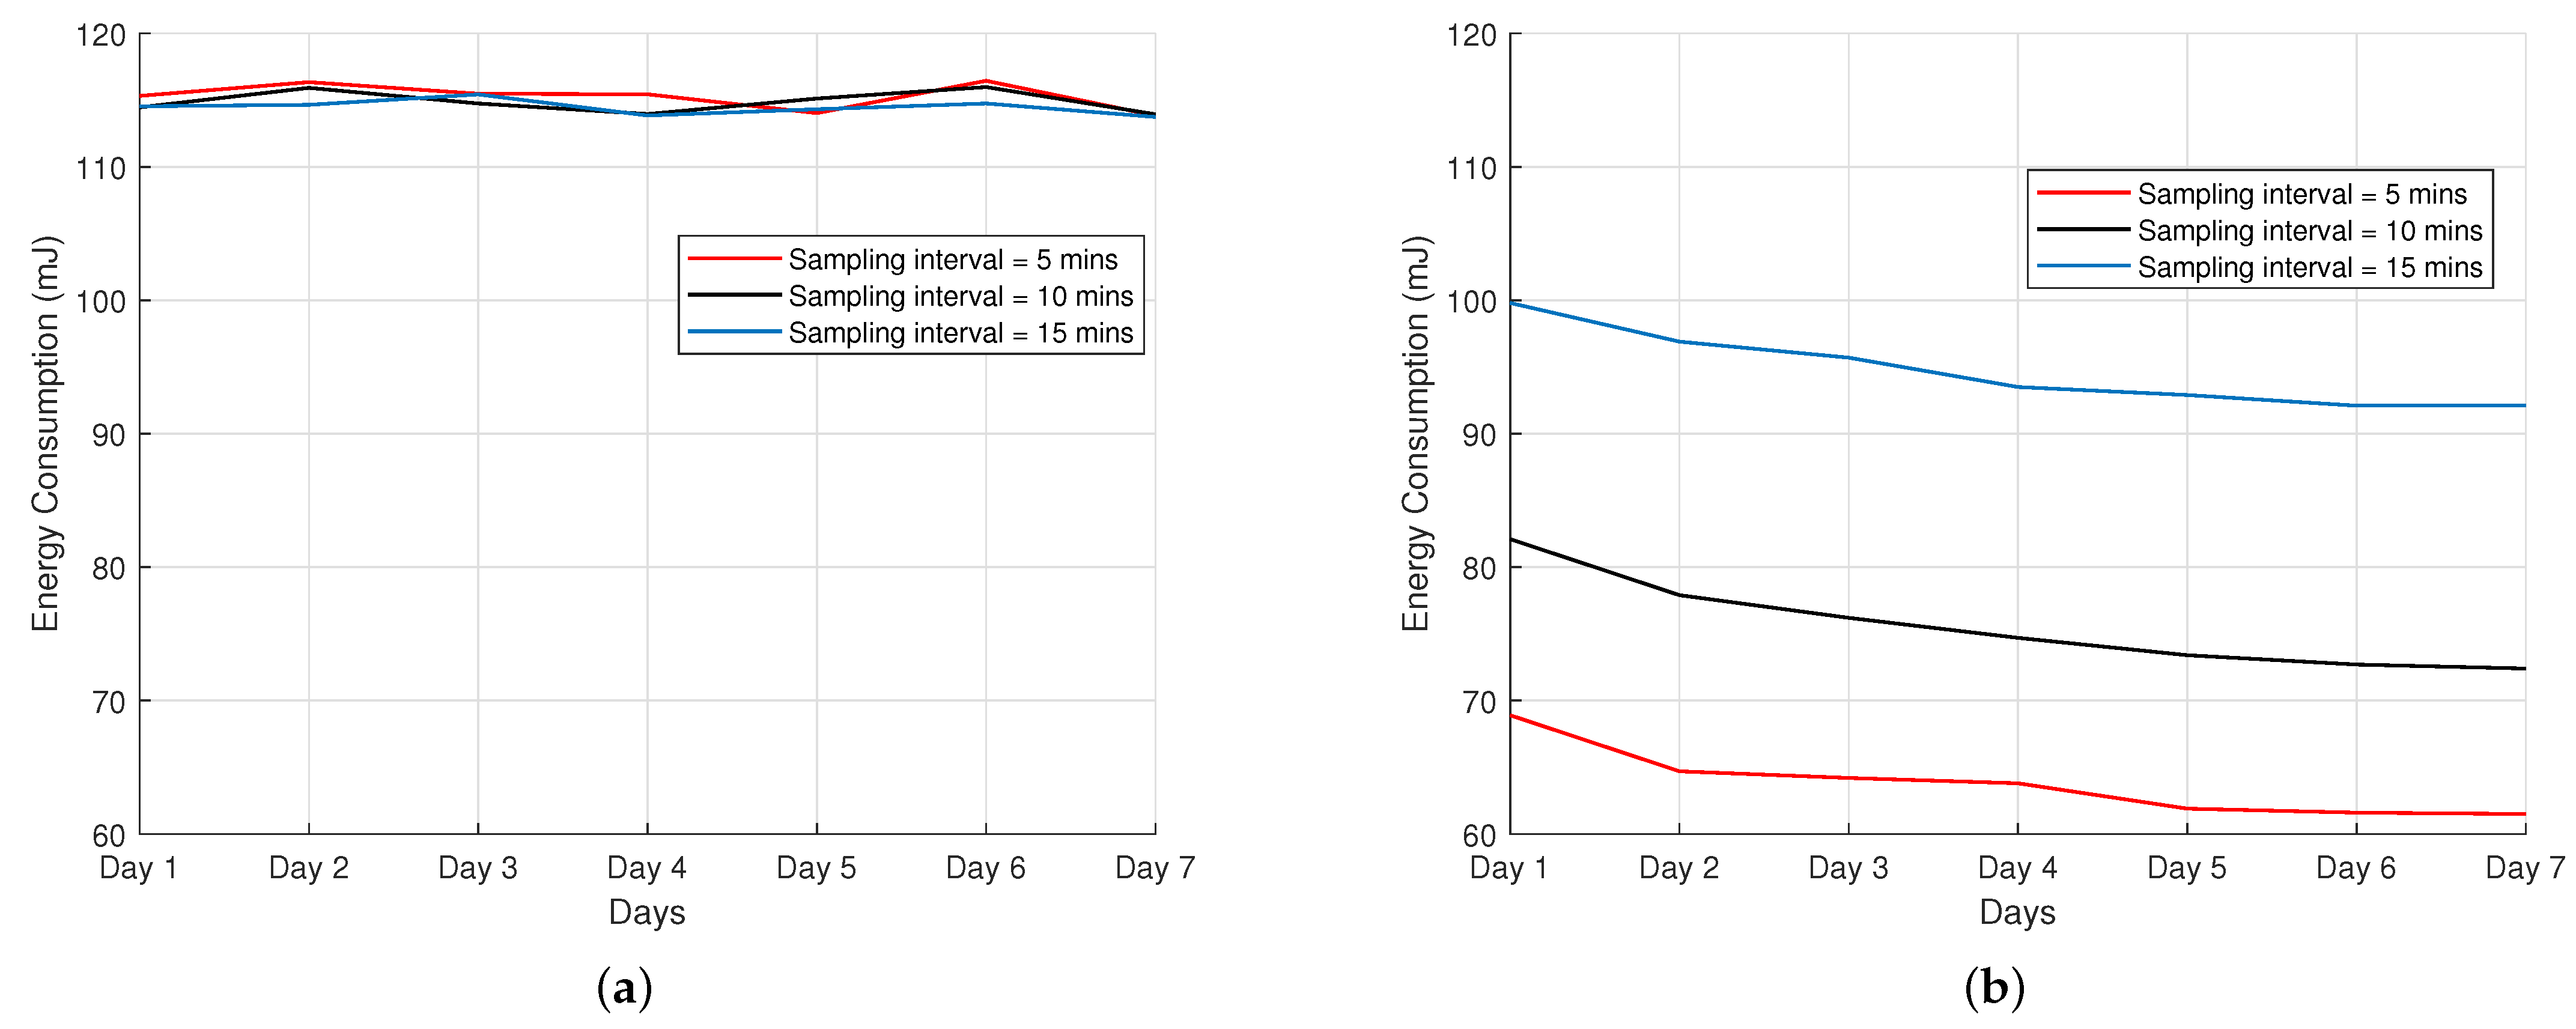
4.4. Energy Consumption
4.5. Battery Discharge Measurement
4.6. Localization Accuracy
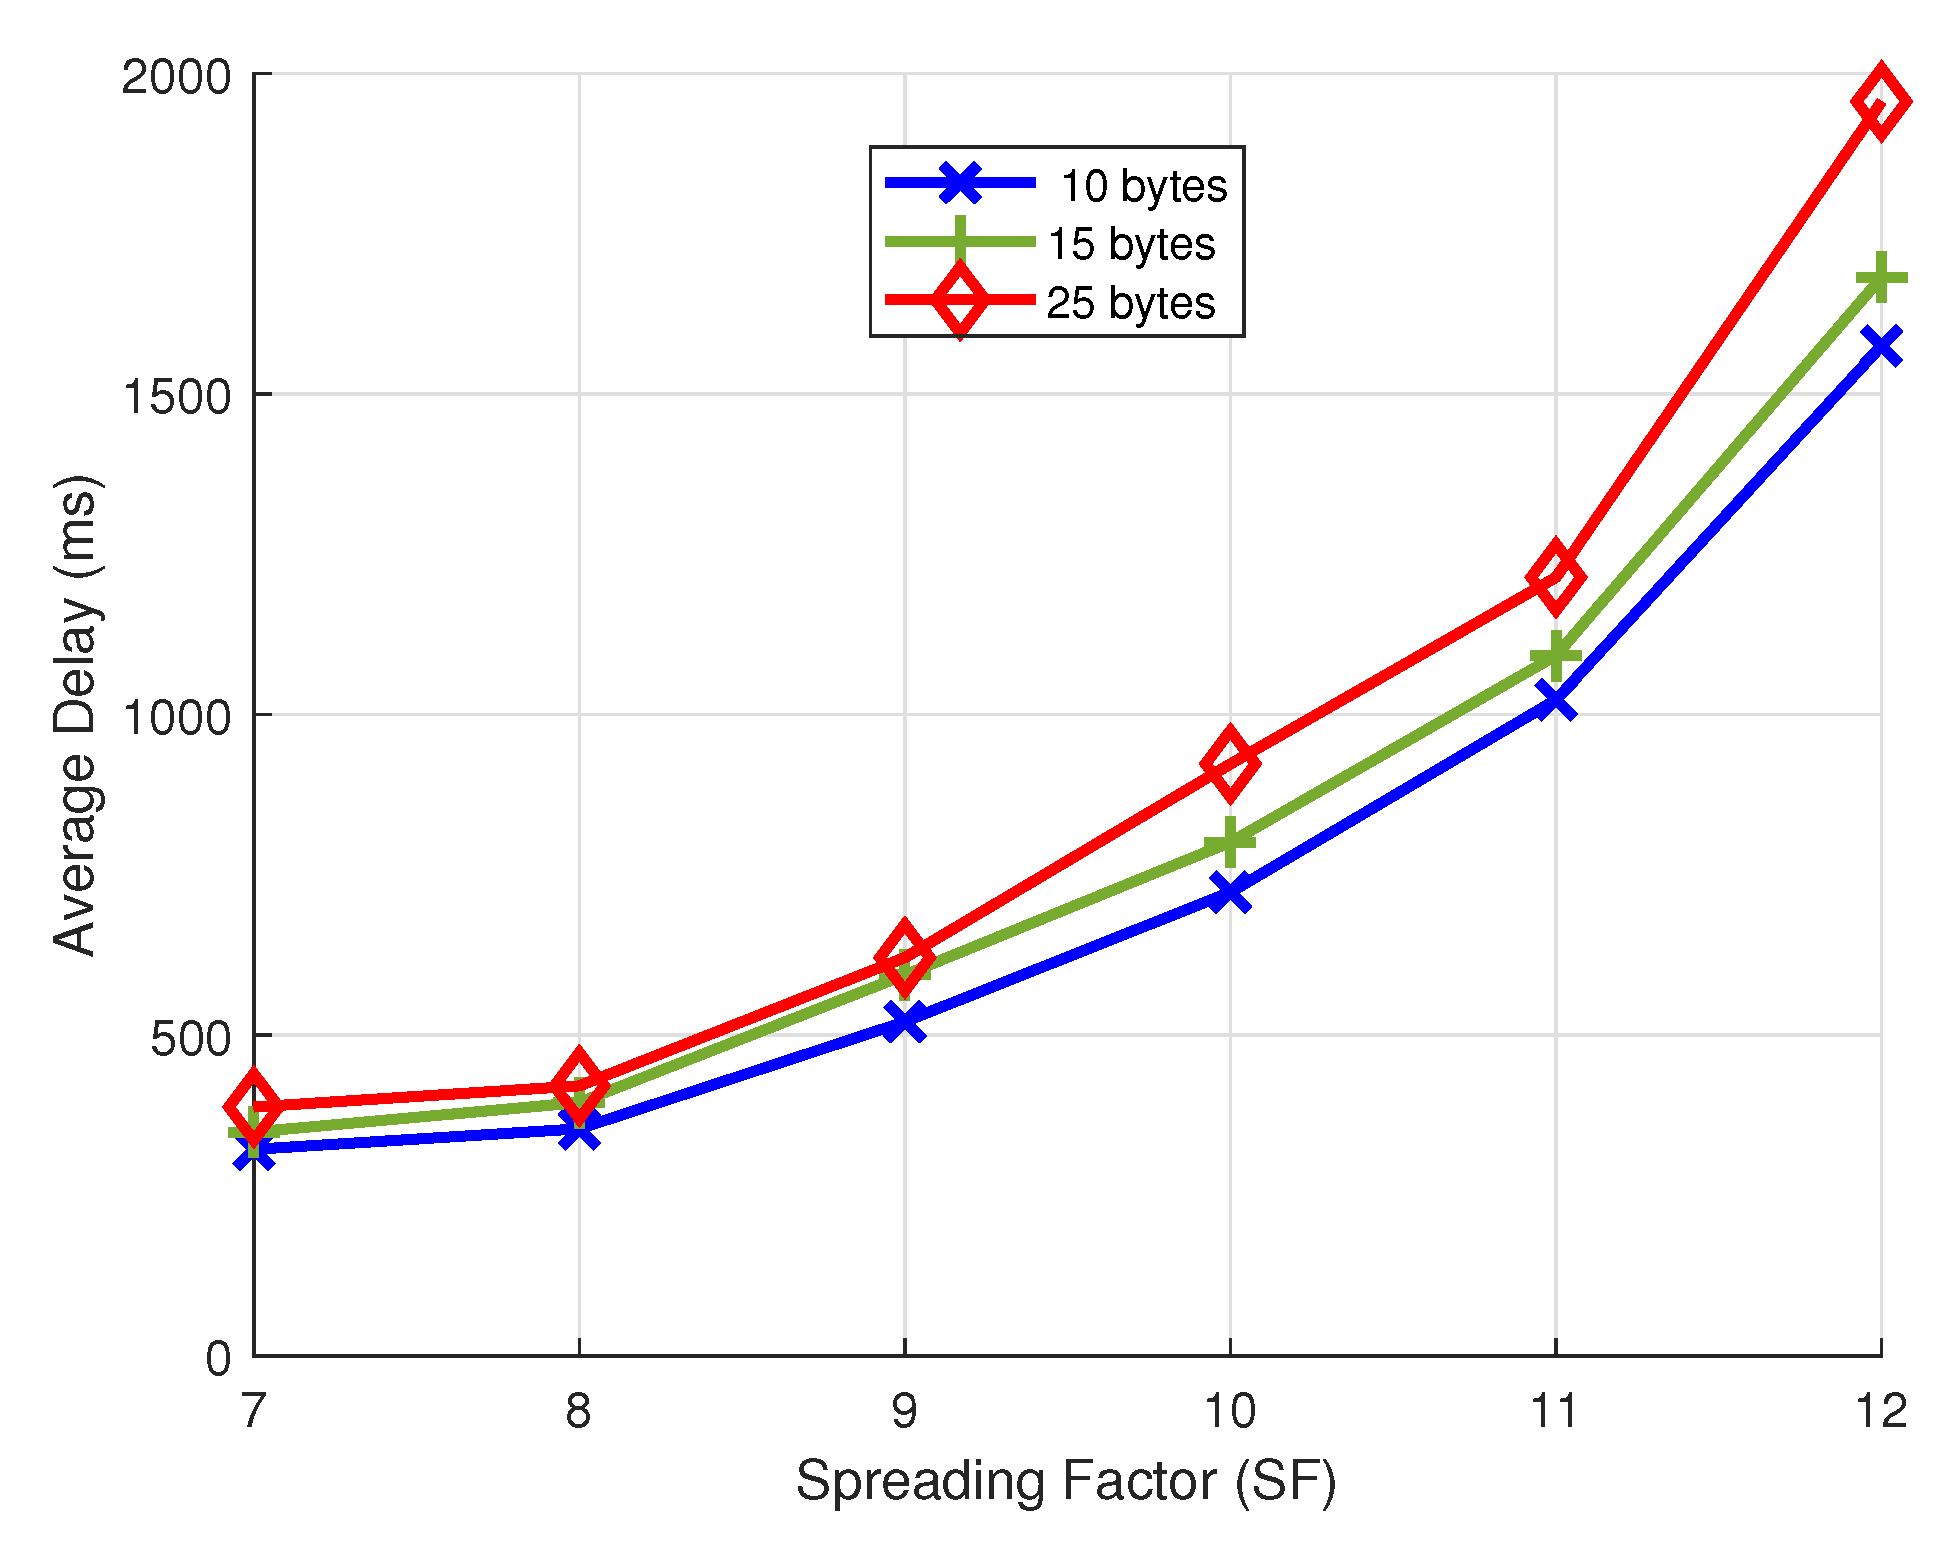
4.7. Average Delay
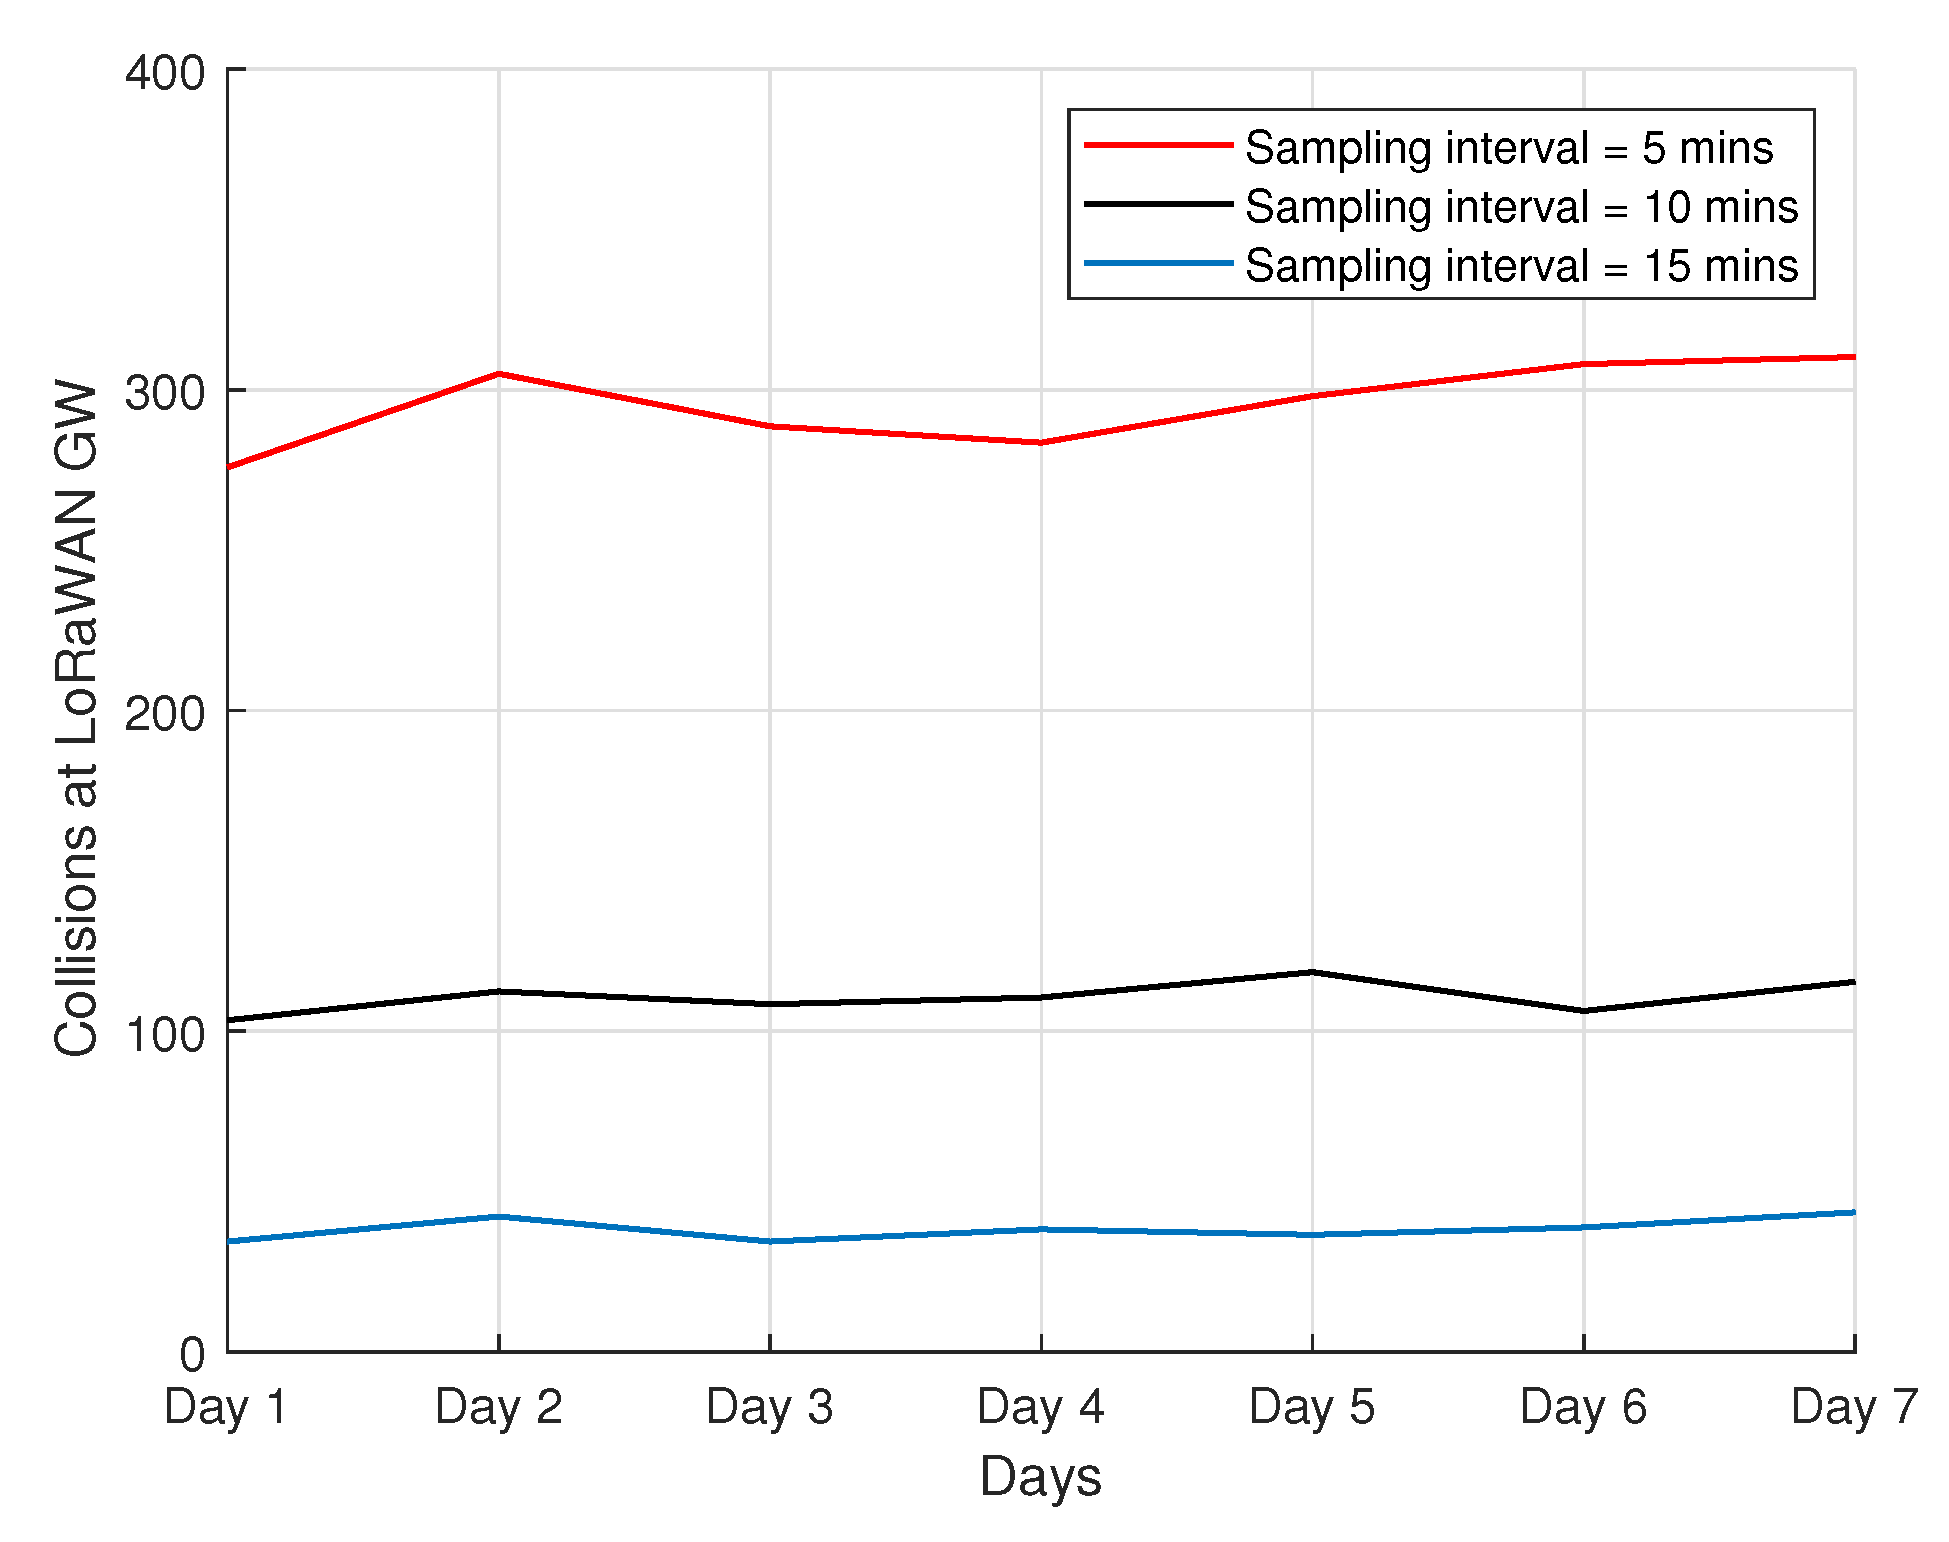
4.8. Collisions
5. Discussion
6. Conclusions
Author Contributions
Funding
Institutional Review Board Statement
Informed Consent Statement
Data Availability Statement
Acknowledgments
Conflicts of Interest
References
- Liu, Y.; Ma, X.; Shu, L.; Hancke, G.P.; Abu-Mahfouz, A.M. From Industry 4.0 to Agriculture 4.0: Current Status, Enabling Technologies, and Research Challenges. IEEE Trans. Ind. Inform. 2020, 17, 4322–4334. [Google Scholar] [CrossRef]
- De Clercq, M.; Vats, A.; Biel, A. Agriculture 4.0: The Future of Farming Technology. In Proceedings of the World Government Summit, Dubai, United Arab Emirates, 11–13 February 2018; pp. 1–30. [Google Scholar]
- Caja, G.; Castro-Costa, A.; Salama, A.A.; Oliver, J.; Baratta, M.; Ferrer, C.; Knight, C.H. Sensing Solutions for Improving the Performance, Health and Wellbeing of Small Ruminants. J. Dairy Res. 2020, 87, 34–46. [Google Scholar] [CrossRef]
- Maltz, E. Individual Dairy Cow Management: Achievements, Obstacles and Prospects. J. Dairy Res. 2020, 87, 145–157. [Google Scholar] [CrossRef] [PubMed]
- Halachmi, I.; Guarino, M.; Bewley, J.; Pastell, M. Smart Animal Agriculture: Application of Real-time Sensors to Improve Animal Well-being and Production. Annu. Rev. Anim. Biosci. 2019, 7, 403–425. [Google Scholar] [CrossRef] [PubMed]
- Bocquier, F.; Debus, N.; Lurette, A.; Maton, C.; Viudes, G.; Moulin, C.-H.; Jouven, M. Elevage de Précision en Systèmes D’élevage Peu Intensifiés. INRA Prod. Anim. 2014, 27, 101–112. [Google Scholar] [CrossRef] [Green Version]
- Rutter, S.M. Advanced Livestock Management Solutions. In Advances in Sheep Welfare; Elsevier: Amsterdam, The Netherlands, 2017; pp. 245–261. [Google Scholar]
- Isselstein, J.; Jeangros, B.; Pavlu, V. Agronomic Aspects of Biodiversity Targeted Management of Temperate Grasslands in Europe—A Review. Agronomy Res. 2005, 3, 139–151. [Google Scholar]
- El Bilali, H.; Allahyari, M.S. Transition Towards Sustainability in Agriculture and Food Systems: Role of Information and Communication Technologies. Inf. Process. Agric. 2018, 5, 456–464. [Google Scholar] [CrossRef]
- Greenwood, P.L.; Bishop-Hurley, G.J.; González, L.A.; Ingham, A.B. Development and Application of a Livestock Phenomics Platform to Enhance Productivity and Efficiency at Pasture. Anim. Prod. Sci. 2016, 56, 1299–1311. [Google Scholar] [CrossRef]
- Macmillan, K.; Gobikrushanth, M.; Plastow, G.; Colazo, M. Performance and Optimization of an Ear Tag Automated Activity Monitor for Estrus Prediction in Dairy Heifers. Theriogenology 2020, 155, 197–204. [Google Scholar] [CrossRef]
- Antanaitis, R.; Žilaitis, V.; Kučinskas, A.; Juozaitienė, V.; Leonauskaitė, K. Changes in Cow activity, Milk Yield, and Milk Conductivity before Clinical Diagnosis of Ketosis, and Acidosis. Vet. Med. Zoot 2015, 70, 3–9. [Google Scholar]
- Nóbrega, L.; Gonçalves, P.; Pedreiras, P.; Pereira, J. An IoT-based Solution for Intelligent Farming. Sensors 2019, 19, 603. [Google Scholar] [CrossRef] [Green Version]
- Dardari, D.; Conti, A.; Ferner, U.; Giorgetti, A.; Win, M.Z. Ranging with Ultrawide Bandwidth Signals in Multipath Environments. Proc. IEEE 2009, 97, 404–426. [Google Scholar] [CrossRef]
- Chen, Z.; Xia, F.; Huang, T.; Bu, F.; Wang, H. A Localization Method for the Internet of Things. J. Supercomput. 2013, 63, 657–674. [Google Scholar] [CrossRef] [Green Version]
- Sadowski, S.; Spachos, P. Rssi-based Indoor Localization with the Internet of Things. IEEE Access 2018, 6, 30149–30161. [Google Scholar] [CrossRef]
- Cheng, X.; Thaeler, A.; Xue, G.; Chen, D. TPS: A Time-Based Positioning Scheme for Outdoor Wireless Sensor Networks. In Proceedings of the IEEE INFOCOM 2004, Hong Kong, China, 7–11 March 2004; Volume 4, pp. 2685–2696. [Google Scholar]
- Khelifi, F.; Bradai, A.; Benslimane, A.; Rawat, P.; Atri, M. A Survey of Localization Systems in Internet of Things. Mob. Netw. Appl. 2019, 24, 761–785. [Google Scholar] [CrossRef]
- Cannizzaro, D.; Zafiri, M.; Pagliari, D.J.; Patti, E.; Macii, E.; Poncino, M.; Acquaviva, A. A Comparison Analysis of BLE-based Algorithms for Localization in Industrial Environments. Electronics 2020, 9, 44. [Google Scholar] [CrossRef] [Green Version]
- Niculescu, D.; Nath, B. Ad Hoc Positioning System (APS) Using AOA. In Proceedings of the IEEE INFOCOM 2003, Twenty-Second Annual Joint Conference of the IEEE Computer and Communications Societies (IEEE Cat. No. 03CH37428), San Francisco, CA, USA, 30 March–3 April 2003; Volume 3, pp. 1734–1743. [Google Scholar]
- Liu, H.; Darabi, H.; Banerjee, P.; Liu, J. Survey of Wireless Indoor Positioning Techniques and Systems. IEEE Trans. Syst. Man Cybern. Part C Appl. Rev. 2007, 37, 1067–1080. [Google Scholar] [CrossRef]
- Wang, Y.-P.E.; Lin, X.; Adhikary, A.; Grovlen, A.; Sui, Y.; Blankenship, Y.; Bergman, J.; Razaghi, H.S. A Primer on 3GPP Narrowband Internet of Things. IEEE Commun. Mag. 2017, 55, 117–123. [Google Scholar] [CrossRef]
- 3GPP. Evolved Universal Terrestrial Radio Access (E-UTRA). In Technical Specification (TS), 3rd Generation Partnership Project (3GPP), TS 36.321, Version 14.7.0; Technical Report; 3GPP: Valbonne, France, 2018; Available online: https://www.etsi.org/deliver/etsi_ts/136300_136399/136321/14.07.00_60/ts_136321v140700p.pdf (accessed on 1 December 2021).
- Lin, X.; Bergman, J.; Gunnarsson, F.; Liberg, O.; Razavi, S.M.; Razaghi, H.S.; Rydn, H.; Sui, Y. Positioning for the Internet of Things: A 3GPP Perspective. IEEE Commun. Mag. 2017, 55, 179–185. [Google Scholar] [CrossRef] [Green Version]
- Chen, M.; Miao, Y.; Hao, Y.; Hwang, K. Narrow Band Internet of Things. IEEE Access 2017, 5, 20557–20577. [Google Scholar] [CrossRef]
- Hofmann-Wellenhof, B.; Lichtenegger, H.; Wasle, E. GNSS–Global Navigation Satellite Systems: GPS, GLONASS, Galileo, and More, 1st ed.; Springer: Vienna, Austria, 2008; p. 518. [Google Scholar]
- Groves, P.D. Principles of GNSS, Inertial, and Multisensor Integrated Navigation Systems. IEEE Aerosp. Electron. Syst. Mag. 2015, 30, 26–27. [Google Scholar] [CrossRef]
- Vejlgaard, B.; Lauridsen, M.; Nguyen, H.; Kovács, I.Z.; Mogensen, P.; Sorensen, M. Coverage and Capacity Analysis of Sigfox, LoRa, GPRS, and NB-IOT. In Proceedings of the 2017 IEEE 85th Vehicular Technology Conference (VTC Spring), Sydney, Australia, 4–7 June 2017; pp. 1–5. [Google Scholar]
- SIGFOX. Sigfox in Agriculture [online]. Available online: https://www.sigfox.com/en/agriculture (accessed on 1 December 2021).
- Ribeiro, G.G.; de Lima, L.F.; Oliveira, L.; Rodrigues, J.J.; Marins, C.N.; Marcondes, G.A. An Outdoor Localization System based on Sigfox. In Proceedings of the 2018 IEEE 87th Vehicular Technology Conference (VTC Spring), Porto, Portugal, 3–6 June 2018; pp. 1–5. [Google Scholar]
- Reynders, B.; Pollin, S. Chirp Spread Spectrum as a Modulation Technique for Long Range Communication. In Proceedings of the 2016 Symposium on Communications and Vehicular Technologies (SCVT), Mons, Belgium, 22 November 2016; pp. 1–5. [Google Scholar]
- Adelantado, F.; Vilajosana, X.; Tuset-Peiro, P.; Martinez, B.; Melia-Segui, J.; Watteyne, T. Understanding the Limits of LORAWAN. IEEE Commun. Mag. 2017, 55, 34–40. [Google Scholar] [CrossRef] [Green Version]
- Ojo, M.O.; Adami, D.; Giordano, S. Experimental Evaluation of a LoRa Wildlife Monitoring Network in a Forest Vegetation Area. Future Internet 2021, 13, 115. [Google Scholar] [CrossRef]
- Froiz-Míguez, I.; Lopez-Iturri, P.; Fraga-Lamas, P.; Celaya-Echarri, M.; Blanco-Novoa, Ó.; Azpilicueta, L.; Falcone, F.; Fernández-Caramés, T.M. Design, Implementation, and Empirical Validation of an IoT Smart Irrigation System for Fog Computing Applications Based on LoRa and LoRaWAN Sensor Nodes. Sensors 2020, 20, 6865. [Google Scholar] [CrossRef] [PubMed]
- Adami, D.; Ojo, M.O.; Giordano, S. Design, Development and Valuation of an Intelligent Animal Repelling System for Crop Protection Based on Embedded Edge-AI. IEEE Access 2021, 9, 132125–132139. [Google Scholar] [CrossRef]
- Codeluppi, G.; Cilfone, A.; Davoli, L.; Ferrari, G. LoRaFarM: A LORAWAN-Based Smart Farming Modular IOT Architecture. Sensors 2020, 20, 2028. [Google Scholar] [CrossRef] [PubMed] [Green Version]
- LoRa Alliance Strategy Committee. LoRaWAN Geolocation Whitepaper; Technical Report; LoRa Alliance: Fremout, CA, USA, 2020. [Google Scholar]
- Janssen, T.; Berkvens, R.; Weyn, M. Benchmarking RSS-based Localization Algorithms with LoRaWAN. IOT 2020, 11, 100235. [Google Scholar] [CrossRef]
- Darroudi, S.M.; Gomez, C. Bluetooth Low Energy Mesh Networks: A Survey. Sensors 2017, 17, 1467. [Google Scholar] [CrossRef] [PubMed] [Green Version]
- Woolley, M. Bluetooth Core Specification Version 5.2 Feature Overview; Bluetooth SIG: Kirkland, WA, USA, 2020. [Google Scholar]
- Nikodem, M. Bluetooth Low Energy Livestock Positioning for Smart Farming Applications. In Proceedings of the International Conference on Computational Science, Krakow, Poland, 16–18 June 2021; pp. 55–67. [Google Scholar]
- Makario, J.; wa MAINA, C. A Bluetooth Low Energy (ble) Based System for Livestock Tracking and Localization. In Proceedings of the 2021 IST-Africa Conference (IST-Africa), South Africa, South Africa, 10–14 May 2021; pp. 1–7. [Google Scholar]
- Baronti, P.; Pillai, P.; Chook, V.W.; Chessa, S.; Gotta, A.; Hu, Y.F. Wireless Sensor Networks: A Survey on the State of the Art and the 802.15.4 and Zigbee Standards. Comput. Commun. 2007, 30, 1655–1695. [Google Scholar] [CrossRef]
- Huircán, J.I.; Muñoz, C.; Young, H.; von Dossow, L.; Bustos, J.; Vivallo, G.; Toneatti, M. Zigbee-based Wireless Sensor Network Localization for Cattle Monitoring in Grazing Fields. Comput. Electron. Agric. 2010, 74, 258–264. [Google Scholar] [CrossRef]
- Nadimi, E.S.; Søgaard, H.; Bak, T.; Oudshoorn, F.W. Zigbee-based Wireless Sensor Networks for Monitoring Animal Presence and Pasture time in a Strip of New Grass. Comput. Electron. Agric. 2008, 61, 79–87. [Google Scholar] [CrossRef] [Green Version]
- Raizman, E.; Rasmussen, H.B.; King, L.; Ihwagi, F.; Douglas-Hamilton, I. Feasibility Study on the Spatial and Temporal Movement of Samburu’s Cattle and Wildlife in Kenya using GPS Radio-tracking, Remote Sensing and GIS. Prev. Vet. Med. 2013, 111, 76–80. [Google Scholar] [CrossRef]
- Andriamandroso, A.; Bindelle, J.; Mercatoris, B.; Lebeau, F. A Review on the Use of Sensors to Monitor Cattle Jaw Movements and Behavior When Grazing. Biotechnol. Agron. SociÉTÉ Environ. 2016, 20, 273–286. [Google Scholar]
- Li, Q.; Liu, Z.; Xiao, J. A Data Collection Collar for Vital Signs of Cows on the Grassland Based on LoRa. In Proceedings of the 2018 IEEE 15th International Conference on e-Business Engineering (ICEBE), Xi’an, China, 12–14 October 2018; pp. 213–217. [Google Scholar]
- Panckhurst, B.; Brown, P.; Payne, K.; Molteno, T.C. Solar-powered Sensor for Continuous Monitoring of Livestock Position. In Proceedings of the 2015 IEEE Sensors Applications Symposium (SAS), Zadar, Croatia, 13–15 April 2015; pp. 1–6. [Google Scholar]
- Siror, J.K.; Huanye, S.; Wang, D.; Jie, W. Use of RFID Technologies to Combat Cattle Rustling in the East Africa. In Proceedings of the 2009 Fifth International Joint Conference on INC, IMS and IDC, Seoul, Korea, 25–27 August 2009; pp. 1556–1562. [Google Scholar]
- Wamuyu, P.K. A Conceptual framework for Implementing a WSN Based Cattle Recovery System in Case of Cattle Rustling in Kenya. Technologies 2017, 5, 54. [Google Scholar] [CrossRef] [Green Version]
- Molapo, N.A.; Malekian, R.; Nair, L. Real-time Livestock Tracking System with Integration of Sensors and Beacon Navigation. Wirel. Pers. Commun. 2019, 104, 853–879. [Google Scholar] [CrossRef]
- Casas, R.; Hermosa, A.; Marco, Á.; Blanco, T.; Zarazaga-Soria, F.J. Real-time Extensive Livestock Monitoring using LPWAN Smart Wearable and Infrastructure. Appl. Sci. 2021, 11, 1240. [Google Scholar] [CrossRef]
- Dieng, O.; Congduc, P.; Thiare, O. Outdoor Localization and Distance Estimation based on Dynamic RSSI Measurements in LoRa Networks: Application to Cattle Rustling Prevention. In Proceedings of the 2019 International Conference on Wireless and Mobile Computing, Networking and Communications (WiMob), Barcelona, Spain, 21–23 October 2019; pp. 1–6. [Google Scholar]
- Ma, N.; Pan, L.; Chen, S.; Liu, B. NB-IOT Estrus Detection System of Dairy Cows based on LSTM Networks. In Proceedings of the 2020 IEEE 31st Annual International Symposium on Personal, Indoor and Mobile Radio Communications, London, UK, 31 August–3 September 2020; pp. 1–5. [Google Scholar]
- Llaria, A.; Terrasson, G.; Arregui, H.; Hacala, A. Geolocation and Monitoring Platform for Extensive Farming in Mountain Pastures. In Proceedings of the 2015 IEEE International Conference on Industrial Technology (ICIT), Seville, Spain, 17–19 March 2015; pp. 2420–2425. [Google Scholar]
- Barbedo, J.G.A.; Koenigkan, L.V.; Santos, P.M.; Ribeiro, A.R.B. Counting Cattle in UAV Images—Dealing with Clustered Animals and Animal/background Contrast Changes. Sensors 2020, 20, 2126. [Google Scholar] [CrossRef] [PubMed] [Green Version]
- Aburasain, R.; Edirisinghe, E.A.; Albatay, A. Drone-based Cattle Detection Using Deep Neural Networks. In Proceedings of the SAI Intelligent Systems Conference, London, UK, 3–4 September 2020; Springer: Berlin, Germany, 2020; pp. 598–611. [Google Scholar]
- Rivas, A.; Chamoso, P.; González-Briones, A.; Corchado, J.M. Detection of Cattle using Drones and Convolutional Neural Networks. Sensors 2018, 18, 2048. [Google Scholar] [CrossRef] [PubMed] [Green Version]
- Webb, P.; Mehlhorn, S.A.; Smartt, P. Developing Protocols for Using a UAV to Monitor Herd Health. In Proceedings of the 2017 ASABE Annual International Meeting, Spokane, WA, USA, 16–19 July 2017; p. 1700865. [Google Scholar]
- Li, X.; Xing, L. Use of Unmanned Aerial Vehicles for Livestock Monitoring based on Streaming K-means Clustering. Ifac-Papersonline 2019, 52, 324–329. [Google Scholar] [CrossRef]
- Li, X.; Xing, L. Reactive Deployment of Autonomous Drones for Livestock Monitoring based on Density-based Clustering. In Proceedings of the 2019 IEEE International Conference on Robotics and Biomimetics (ROBIO), Dali, China, 6–8 December 2019; pp. 2421–2426. [Google Scholar]
- Goolsby, J.; Jung, J.; Landivar, J.; McCutcheon, W.; Lacewell, R.; Duhaime, R.; Schwartz, A. Evaluation of Unmanned Aerial Vehicles (UAVS) for detection of Cattle in the Cattle Fever Tick Permanent Quarantine Zone. Subtrop. Agric. Environ. 2016, 67, 24–27. [Google Scholar]
- Nyamuryekung’e, S.; Cibils, A.F.; Estell, R.E.; Gonzalez, A.L. Use of an Unmanned Aerial Vehicle-mounted Video Camera to Assess Feeding Behavior of Raramuri Criollo Cows. Rangel. Ecol. Manag. 2016, 69, 386–389. [Google Scholar] [CrossRef]
- Barbedo, J.G.A.; Koenigkan, L.V. Perspectives on the Use of Unmanned Aerial Systems to Monitor Cattle. Outlook Agric. 2018, 47, 214–222. [Google Scholar] [CrossRef] [Green Version]
- Ampatzidis, Y.; Partel, V.; Costa, L. Agroview: Cloud-based Application to Process, Analyze and Visualize UAV-collected Data for Precision Agriculture Applications Utilizing Artificial Intelligence. Comput. Electron. Agric. 2020, 174, 105457. [Google Scholar] [CrossRef]
- Valecce, G.; Strazzella, S.; Radesca, A.; Grieco, L.A. Solarfertigation: Internet of Things Architecture for Smart Agriculture. In Proceedings of the 2019 IEEE International Conference on Communications Workshops (ICC Workshops), Shanghai, China, 22–24 May 2019; pp. 1–6. [Google Scholar]
- Dineva, K.; Atanasova, T. Design of Scalable IOT Architecture Based on AWS for Smart Livestock. Animals 2021, 11, 2697. [Google Scholar] [CrossRef] [PubMed]
- Dave, D.; Naik, H.; Singhal, S.; Dwivedi, R.; Patel, P. Towards Designing Computer Vision-based Explainable-AI Solution: A Use Case of Livestock Mart Industry. arXiv 2021, arXiv:2103.03096. [Google Scholar]
- Nofence Grazing Technology. Available online: https://www.nofence.no/ (accessed on 1 December 2021).
- Ojo, M.O.; Giordano, S.; Procissi, G.; Seitanidis, I.N. A Review of Low-end, Middle-end, and High-end IoT Devices. IEEE Access 2018, 6, 70528–70554. [Google Scholar] [CrossRef]
- Buyya, R.; Broberg, J.; Goscinski, A.M. Cloud Computing: Principles and Paradigms; John Wiley & Sons, Inc.: Hoboken, NJ, USA, 2011. [Google Scholar]
- Avram, M.-G. Advantages and Challenges of Adopting Cloud Computing from an Enterprise Perspective. Procedia Technol. 2014, 12, 529–534. [Google Scholar] [CrossRef] [Green Version]
- Making Sense of IoT Platforms: AWS vs. Azure vs. Google vs. IBM vs. Cisco [online]. Available online: https://www.altexsoft.com/blog/iot-platforms/ (accessed on 1 December 2021).
- Kufakunesu, R.; Hancke, G.P.; Abu-Mahfouz, A.M. A Survey on Adaptive Data Rate Optimization in LoRaWAN: Recent Solutions and Major Challenges. Sensors 2020, 20, 5044. [Google Scholar] [CrossRef]
- Finnegan, J.; Farrell, R.; Brown, S. Analysis and Enhancement of the LoRaWAN Adaptive Data Rate Scheme. IEEE Internet Things J. 2020, 7, 7171–7180. [Google Scholar] [CrossRef]
- Zook, B.C.; Simmens, S.J. The effects of 860 MHZ Radiofrequency Radiation on the Induction or Promotion of Brain Tumors and other Neoplasms in Rats. Radiat. Res. 2001, 155, 572–583. [Google Scholar] [CrossRef]
- Langendoen, K.; Baggio, A.; Visser, O. Murphy Loves Potatoes: Experiences from a Pilot Sensor Network Deployment in Precision Agriculture. In Proceedings of the 20th IEEE International Parallel & Distributed Processing Symposium, Rhodes Island, Greece, 25–29 April 2006; pp. 1–8. [Google Scholar]


| Localization Techniques | Advantages | Disadvantages |
|---|---|---|
| ToA |
|
|
| TDoA |
|
|
| RSSI |
|
|
| AoA |
|
|
| Ref. | Target Animal | Localization Technologies | Localization Method | Cloud Infrastructure | Nature of Research |
|---|---|---|---|---|---|
| [41] | Cow | BLE | RSSI | NS | Performance Analysis |
| [44] | Cattle | Zigbee | ratiometric vector iteration (RVI) | NS | Performance Analysis |
| [45] | Cattle | Zigbee | NS | NS | Use Case Analysis |
| [53] | Cattle | GPS + LoRaWAN | NS | Yes | Laboratory and Field Tests |
| [54] | Cattle | GPS + LoRa | RSSI | No | Performance Analysis |
| [55] | Cattle | NB-IoT | NS | Yes | Performance Analysis |
| [13] | Sheep | NS | RSSI | Yes | Performance Analysis |
| [70] | Goat | GPS + Bluetooth, LTE | NS | NS | NS |
| [56] | Cattle | GPS + Sigfox | NS | NS | Performance Analysis |
| [46] | Cattle | GPS + GSM | NS | No | Statistical Analysis |
| [52] | Cattle | Zigbee | ToA | No | Experimental Analysis |
| [48] | Cattle | GPS + LoRa | NS | No | Field tests |
| [61,62] | Cattle & Sheep | GPS + UAV | NS | No | Simulation tests |
| End Devices | Sampling Interval |
|---|---|
| Sheep-1 | 5 min |
| Sheep-2 | |
| Sheep-3 | 10 min |
| Sheep-4 | |
| Sheep-5 | 15 min |
| Sheep-6 |
| Sheep-I | AD (m) | MD (m) | OB (Percentage) |
|---|---|---|---|
| Sheep-1 | 3.5 | 5.4 | 3.16 |
| Sheep-2 | 4.98 | 7.6 | 1.32 |
| Sheep-3 | 2.1 | 3.2 | 0.82 |
| Sheep-4 | 0.32 | 0.32 | 0.056 |
| Sheep-5 | 0.85 | 1.1 | 0.12 |
| Sheep-6 | 2.7 | 3.9 | 1.82 |
| Sheep-7 | 4.78 | 14.2 | 2.52 |
| Sheep-8 | 1.5 | 1.5 | 0.64 |
| Sheep-9 | 3.4 | 5.4 | 1.64 |
| Sheep-10 | 2.52 | 4.3 | 0.76 |
Publisher’s Note: MDPI stays neutral with regard to jurisdictional claims in published maps and institutional affiliations. |
© 2021 by the authors. Licensee MDPI, Basel, Switzerland. This article is an open access article distributed under the terms and conditions of the Creative Commons Attribution (CC BY) license (https://creativecommons.org/licenses/by/4.0/).
Share and Cite
Ojo, M.O.; Viola, I.; Baratta, M.; Giordano, S. Practical Experiences of a Smart Livestock Location Monitoring System Leveraging GNSS, LoRaWAN and Cloud Services. Sensors 2022, 22, 273. https://doi.org/10.3390/s22010273
Ojo MO, Viola I, Baratta M, Giordano S. Practical Experiences of a Smart Livestock Location Monitoring System Leveraging GNSS, LoRaWAN and Cloud Services. Sensors. 2022; 22(1):273. https://doi.org/10.3390/s22010273
Chicago/Turabian StyleOjo, Mike O., Irene Viola, Mario Baratta, and Stefano Giordano. 2022. "Practical Experiences of a Smart Livestock Location Monitoring System Leveraging GNSS, LoRaWAN and Cloud Services" Sensors 22, no. 1: 273. https://doi.org/10.3390/s22010273
APA StyleOjo, M. O., Viola, I., Baratta, M., & Giordano, S. (2022). Practical Experiences of a Smart Livestock Location Monitoring System Leveraging GNSS, LoRaWAN and Cloud Services. Sensors, 22(1), 273. https://doi.org/10.3390/s22010273