
Application of Terrestrial Laser Scanning (TLS) in the Architecture, Engineering and Construction (AEC) Industry


Abstract
1. Introduction
2. TLS Technology
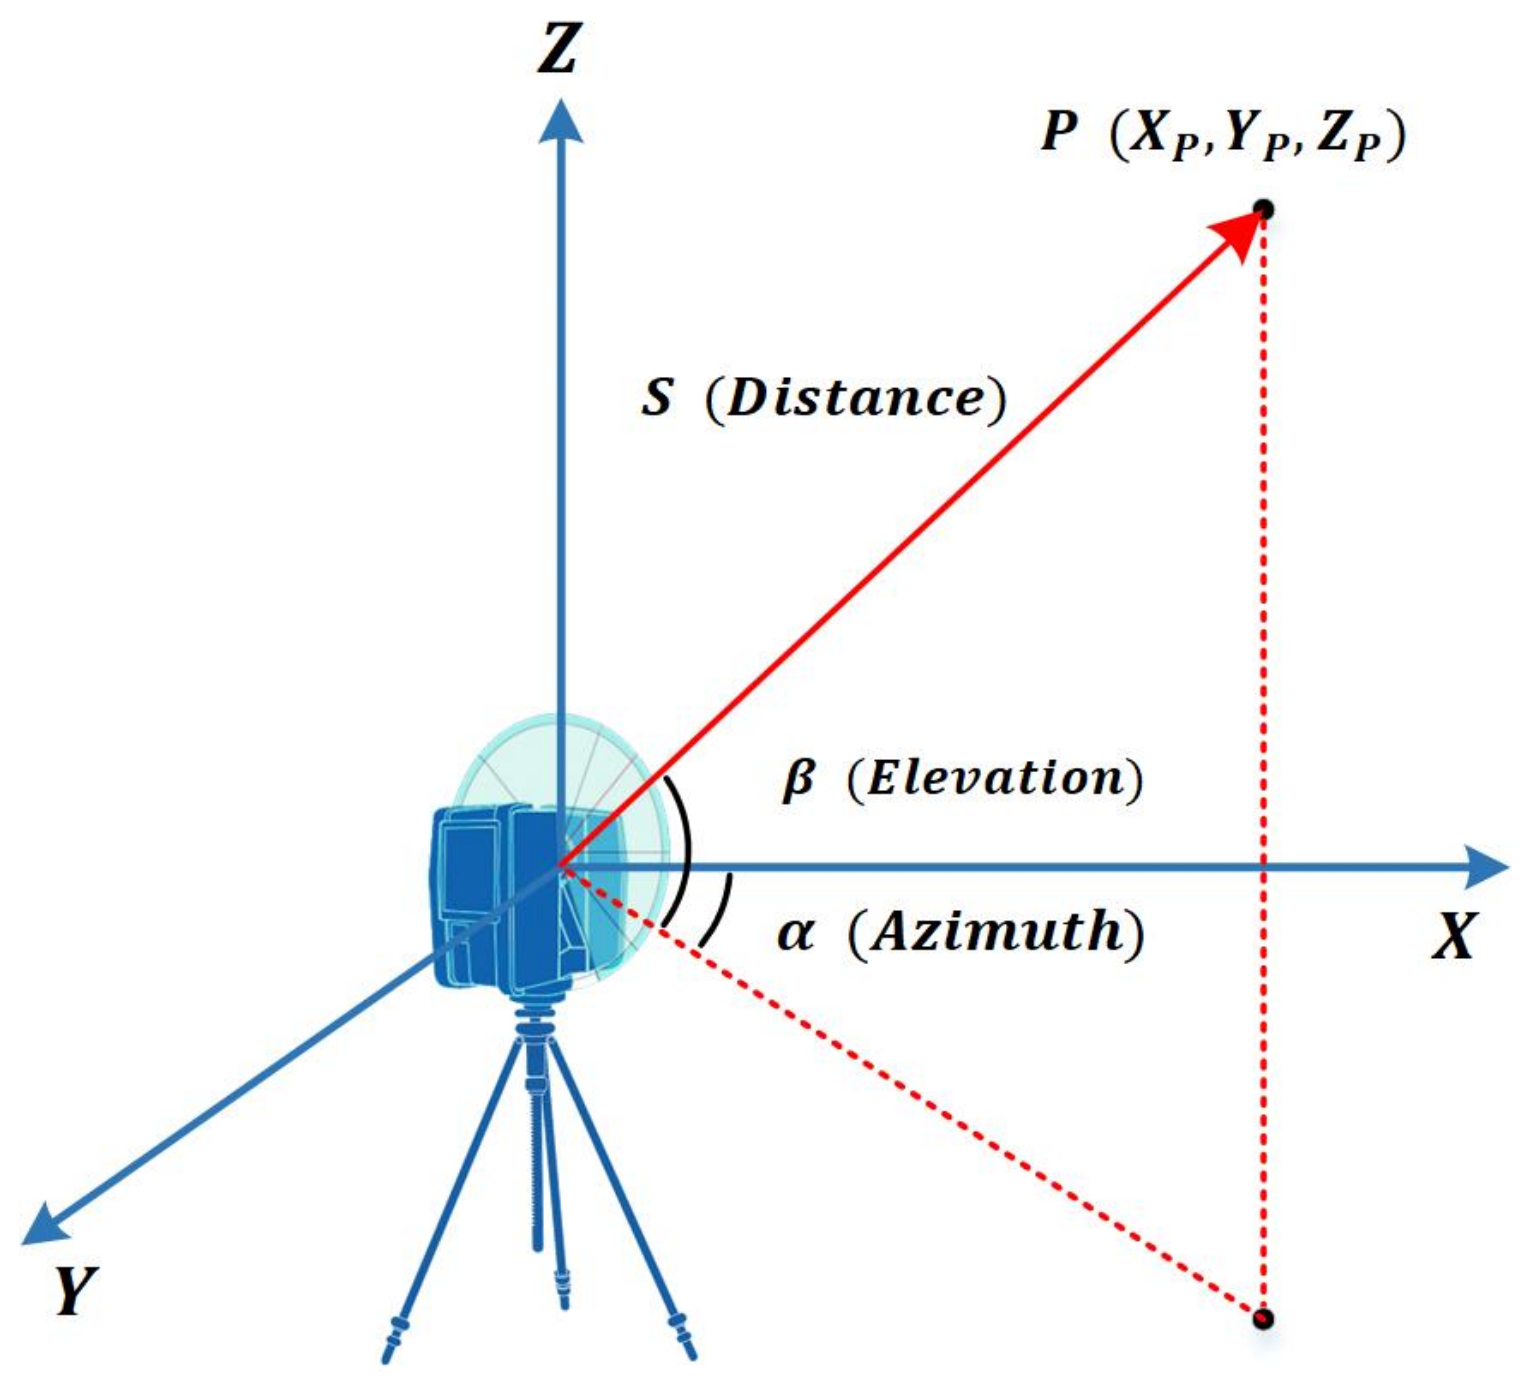
2.1. Working Principle of a Terrestrial Laser Scanner
2.2. Potential Benefits of Using TLS in the AEC Industry
3. Method
3.1. Literature Search and Dataset Construction
3.2. Analysis of Publications
4. Research Topics Related to TLS in the AEC Industry
4.1. 3D Model Reconstruction (MR)
4.2. Object Recognition (OR)
4.3. Deformation Measurement (DM)
4.4. Quality Assessment (QA)
4.5. Progress Tracking (PT)
4.6. Other Applications
4.6.1. Performance Evaluation of Terrestrial Laser Scanners
4.6.2. Comparison of Different Techniques and Tools for Capturing 3D Point Clouds
4.6.3. Integration of Digital Technologies
5. Critical Issues in Application
5.1. Workflow
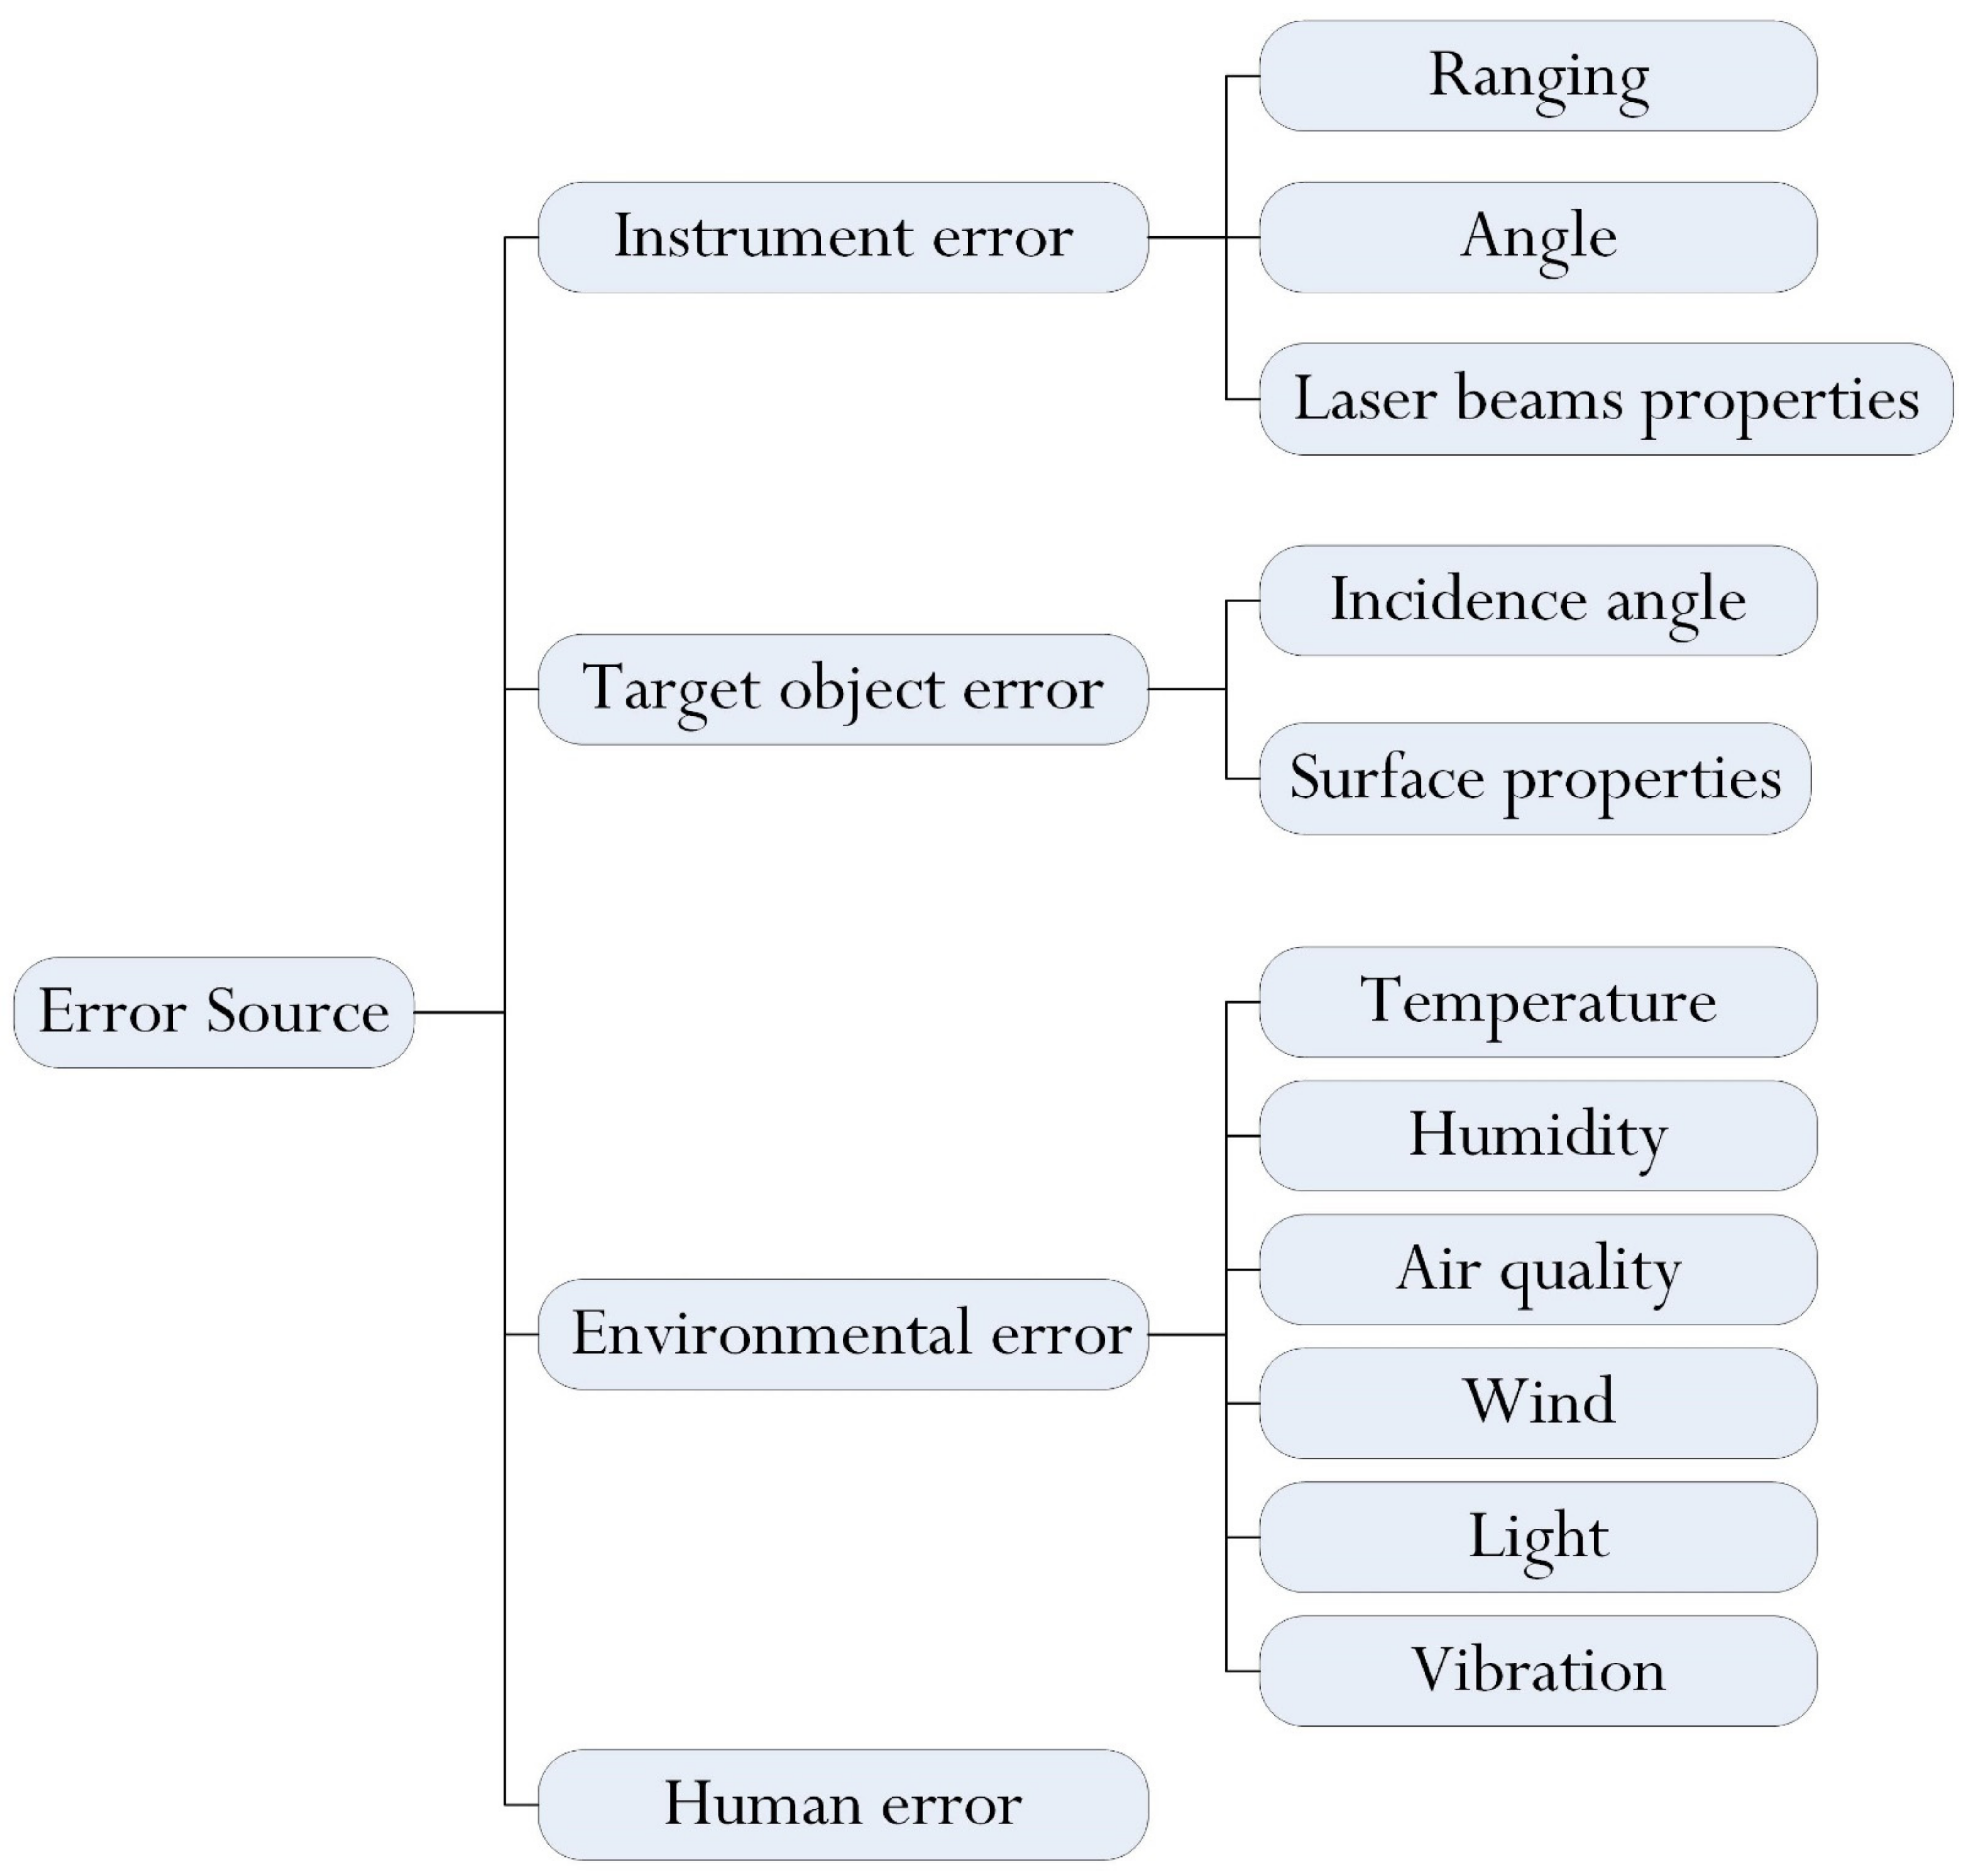
5.2. Data Quality
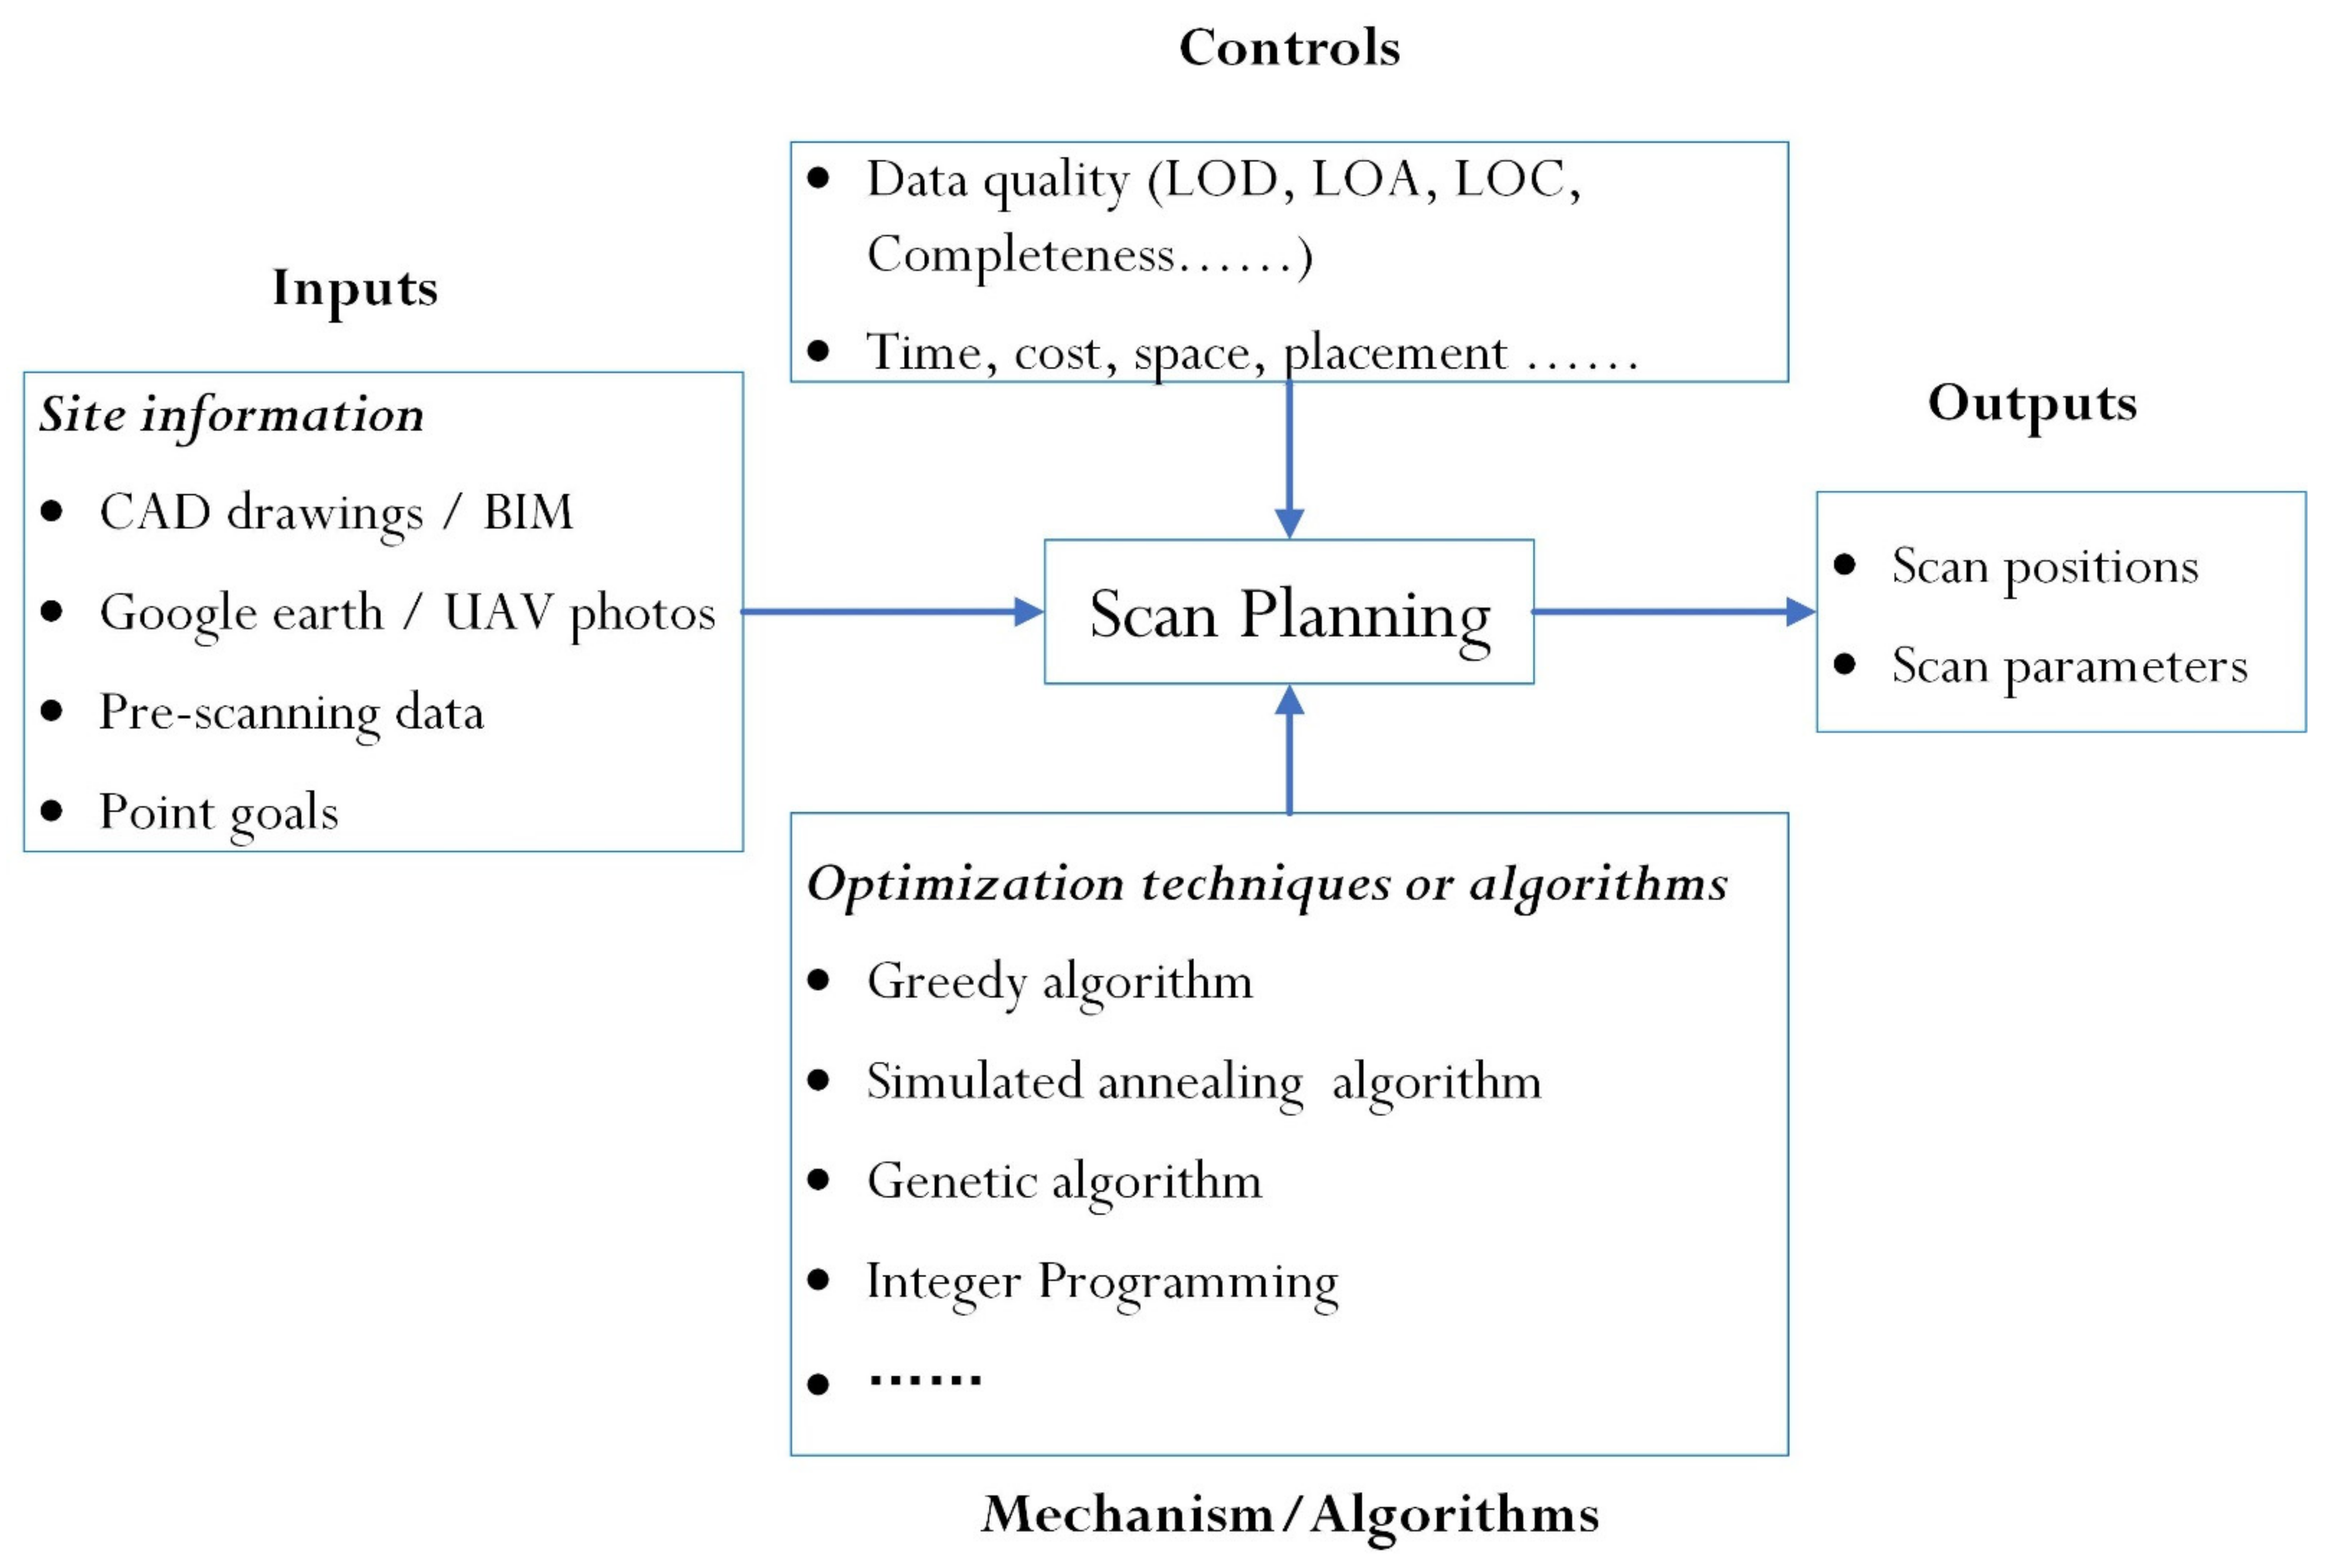
5.3. Scan Planning
5.4. Data Processing
6. Future Research Directions
7. Conclusions
Author Contributions
Funding
Institutional Review Board Statement
Informed Consent Statement
Data Availability Statement
Conflicts of Interest
References
- Wang, M.; Wang, C.C.; Sepasgozar, S.; Zlatanova, S. A systematic review of digital technology adoption in off-site construction: Current status and future direction towards industry 4.0. Buildings 2020, 10, 204. [Google Scholar] [CrossRef]
- Pan, Y.; Zhang, L. Roles of artificial intelligence in construction engineering and management: A critical review and future trends. Autom. Constr. 2021, 122, 103517. [Google Scholar] [CrossRef]
- Štefanič, M.; Stankovski, V. A review of technologies and applications for smart construction. In Proceedings of the Institution of Civil Engineers-Civil Engineering; Thomas Telford Ltd.: London, UK, 2018; pp. 83–87. [Google Scholar]
- Opoku, D.-G.J.; Perera, S.; Osei-Kyei, R.; Rashidi, M. Digital twin application in the construction industry: A literature review. J. Build. Eng. 2021, 40, 102726. [Google Scholar] [CrossRef]
- Jiang, F.; Ma, L.; Broyd, T.; Chen, K. Digital twin and its implementations in the civil engineering sector. Autom. Constr. 2021, 130, 103838. [Google Scholar] [CrossRef]
- Hire, S.; Sandbhor, S.; Ruikar, K. Bibliometric survey for adoption of building information modeling (bim) in construction industry—A safety perspective. Arch. Comput. Methods Eng. 2021, 28, 1–15. [Google Scholar] [CrossRef]
- Duan, K.-K.; Cao, S.-Y. Emerging rfid technology in structural engineering—A review. In Structures; Elsevier: Amsterdam, The Netherlands, 2020; pp. 2404–2414. [Google Scholar]
- Attard, L.; Debono, C.J.; Valentino, G.; Di Castro, M. Tunnel inspection using photogrammetric techniques and image processing: A review. ISPRS J. Photogramm. Remote Sens. 2018, 144, 180–188. [Google Scholar] [CrossRef]
- Israr, A.; Abro, G.E.M.; Sadiq Ali Khan, M.; Farhan, M.; Zulkifli, B.M.; ul Azrin, S. Internet of things (iot)-enabled unmanned aerial vehicles for the inspection of construction sites: A vision and future directions. Math. Probl. Eng. 2021, 2021, 9931112. [Google Scholar] [CrossRef]
- Bello, S.A.; Oyedele, L.O.; Akinade, O.O.; Bilal, M.; Delgado, J.M.D.; Akanbi, L.A.; Ajayi, A.O.; Owolabi, H.A. Cloud computing in construction industry: Use cases, benefits and challenges. Autom. Constr. 2020, 122, 103441. [Google Scholar] [CrossRef]
- Cheng, M.; Liu, G.; Xu, Y.; Chi, M. When blockchain meets the aec industry: Present status, benefits, challenges, and future research opportunities. Buildings 2021, 11, 340. [Google Scholar] [CrossRef]
- Tang, P.; Huber, D.; Akinci, B.; Lipman, R.; Lytle, A. Automatic reconstruction of as-built building information models from laser-scanned point clouds: A review of related techniques. Autom. Constr. 2010, 19, 829–843. [Google Scholar] [CrossRef]
- Mukupa, W.; Roberts, G.W.; Hancock, C.M.; Al-Manasir, K. A review of the use of terrestrial laser scanning application for change detection and deformation monitoring of structures. Surv. Rev. 2017, 49, 99–116. [Google Scholar] [CrossRef]
- Xu, Y.; Stilla, U. Toward building and civil infrastructure reconstruction from point clouds: A review on data and key techniques. IEEE J. Sel. Top. Appl. Earth Obs. Remote Sens. 2021, 14, 2857–2885. [Google Scholar] [CrossRef]
- Dong, Z.; Liang, F.; Yang, B.; Xu, Y.; Zang, Y.; Li, J.; Wang, Y.; Dai, W.; Fan, H.; Hyyppä, J. Registration of large-scale terrestrial laser scanner point clouds: A review and benchmark. ISPRS J. Photogramm. Remote Sens. 2020, 163, 327–342. [Google Scholar] [CrossRef]
- Wang, Q.; Tan, Y.; Mei, Z. Computational methods of acquisition and processing of 3D point cloud data for construction applications. Arch. Comput. Methods Eng. 2020, 27, 479–499. [Google Scholar] [CrossRef]
- Xu, Y.; Tong, X.; Stilla, U. Voxel-Based representation of 3D point clouds: Methods, applications, and its potential use in the construction industry. Autom. Constr. 2021, 126, 103675. [Google Scholar] [CrossRef]
- Rashidi, M.; Mohammadi, M.; Sadeghlou Kivi, S.; Abdolvand, M.M.; Truong-Hong, L.; Samali, B. A decade of modern bridge monitoring using terrestrial laser scanning: Review and future directions. Remote Sens. 2020, 12, 3796. [Google Scholar] [CrossRef]
- Wang, Q.; Kim, M.K. Applications of 3D point cloud data in the construction industry: A fifteen-year review from 2004 to 2018. Adv. Eng. Inform. 2019, 39, 306–319. [Google Scholar] [CrossRef]
- Maiman, T.H. Stimulated Optical Radiation in Ruby; University of Chicago Press: Chicago, IL, USA, 1960. [Google Scholar]
- Staiger, R. 10 years of terrestrial laser scanning-technology, systems and applications. Interexpo Geo-Siberia 2011, 43–55. [Google Scholar]
- Shan, J.; Toth, C.K. Topographic Laser Ranging and Scanning: Principles and Processing; CRC Press: Boca Raton, FL, USA, 2018. [Google Scholar]
- Lachat, E.; Landes, T.; Grussenmeyer, P. Investigation of a combined surveying and scanning device: The trimble sx10 scanning total station. Sensors 2017, 17, 730. [Google Scholar] [CrossRef]
- Pfeifer, N.; Briese, C. Laser scanning—Principles and applications. In Proceedings of the GeoSiberia 2007—International Exhibition and Scientific Congress, Novosibirsk, Russia, 25 April 2007. [Google Scholar]
- Berberan, A.; Ferreira, I.; Portela, E.; Oliveira, S.; Oliveira, A.; Baptista, B. Overview on terrestrial laser scanning as a tool for dam surveillance. In Proceedings of the 6th International Dam Engineering Conference, Lisbon, Portugal, 15–17 February 2011. [Google Scholar]
- Chang, K.; Wang, E.; Chang, Y.; Cheng, H. Post-disaster structural evaluation using a terrestrial laser scanner. In Proceedings of the IIntegrating Generations FIG Working Week, Stockholm, Sweden, 14–19 June 2008. [Google Scholar]
- Arayici, Y. An approach for real world data modelling with the 3D terrestrial laser scanner for built environment. Autom. Constr. 2007, 16, 816–829. [Google Scholar] [CrossRef]
- Fekete, S.; Diederichs, M.; Lato, M. Geotechnical and operational applications for 3-dimensional laser scanning in drill and blast tunnels. Tunn. Undergr. Space Technol. 2010, 25, 614–628. [Google Scholar] [CrossRef]
- Gordon, S.; Lichti, D.; Stewart, M.; Franke, J. Structural deformation measurement using terrestrial laser scanners. In Proceedings of the 11th International FIG Symposium on Deformation Measurements, Santorini, Greece, 25–28 May 2003; p. 8. [Google Scholar]
- Lichti, D.; Gordon, S.; Stewart, M.; Franke, J.; Tsakiri, M. Comparison of digital photogrammetry and laser scanning. In Proceedings of the International Society for Photogrammetry and Remote Sensing, Graz, Austria, 9–13 September 2002; pp. 39–44. [Google Scholar]
- Tsakiri, M.; Lichti, D.; Pfeifer, N. Terrestrial laser scanning for deformation monitoring. In Proceedings of the Citeseer, Baden, Austria, 22–24 May 2006. [Google Scholar]
- Gordon, S.J.; Lichti, D.D. Modeling terrestrial laser scanner data for precise structural deformation measurement. J. Surv. Eng. 2007, 133, 72–80. [Google Scholar] [CrossRef]
- Garfield, E. Citation analysis as a tool in journal evaluation. Science 1972, 178, 471–479. [Google Scholar] [CrossRef] [PubMed]
- Chen, C.; Hu, Z.; Liu, S.; Tseng, H. Emerging trends in regenerative medicine: A scientometric analysis in citespace. Expert Opin. Biol. Ther. 2012, 12, 593–608. [Google Scholar] [CrossRef] [PubMed]
- Chen, C. Eugene Garfield’s scholarly impact: A scientometric review. Scientometrics 2018, 114, 489–516. [Google Scholar] [CrossRef]
- Chen, C.; Song, M. The uncertainty of science: Navigating through the unknown. In Representing Scientific Knowledge: The Role of Uncertainty; Springer International Publishing: Cham, Switzerland, 2017; pp. 1–35. [Google Scholar]
- Chen, C. Citespace II: Detecting and visualizing emerging trends and transient patterns in scientific literature. J. Am. Soc. Inf. Sci. Technol. 2006, 57, 359–377. [Google Scholar] [CrossRef]
- Liu, H.; Zhu, Y.; Guo, Y.; Li, S.; Yang, J. Visualization Analysis of Subject, Region, Author, and Citation on Crop Growth Model by Citespace II Software; Springer: Berlin/Heidelberg, Germany, 2014; pp. 243–252. [Google Scholar]
- Golparvar-Fard, M.; Bohn, J.; Teizer, J.; Savarese, S.; Pena-Mora, F. Evaluation of image-based modeling and laser scanning accuracy for emerging automated performance monitoring techniques. Autom. Constr. 2011, 20, 1143–1155. [Google Scholar] [CrossRef]
- Volk, R.; Stengel, J.; Schultmann, F. Building information modeling (BIM) for existing buildings—Literature review and future needs. Autom. Constr. 2014, 38, 109–127. [Google Scholar] [CrossRef]
- Patraucean, V.; Armeni, I.; Nahangi, M.; Yeung, J.M.; Brilakis, I.; Haas, C. State of research in automatic as-built modelling. Adv. Eng. Inform. 2015, 29, 162–171. [Google Scholar] [CrossRef]
- Turkan, Y.; Bosche, F.; Haas, C.T.; Haas, R. Automated progress tracking using 4D schedule and 3D sensing technologies. Autom. Constr. 2012, 22, 414–421. [Google Scholar] [CrossRef]
- Bosche, F.; Ahmed, M.; Turkan, Y.; Haas, C.T.; Haas, R. The value of integrating scan-to-bim and scan-vs-bim techniques for construction monitoring using laser scanning and bim: The case of cylindrical mep components. Autom. Constr. 2015, 49, 201–213. [Google Scholar] [CrossRef]
- Walsh, S.B.; Borello, D.J.; Guldur, B.; Hajjar, J.F. Data processing of point clouds for object detection for structural engineering applications. Comput.-Aided Civ. Infrastruct. Eng. 2013, 28, 495–508. [Google Scholar] [CrossRef]
- Kim, M.K.; Cheng, J.C.P.; Sohn, H.; Chang, C.C. A framework for dimensional and surface quality assessment of precast concrete elements using bim and 3D laser scanning. Autom. Constr. 2015, 49, 225–238. [Google Scholar] [CrossRef]
- Xiong, X.H.; Adan, A.; Akinci, B.; Huber, D. Automatic creation of semantically rich 3D building models from laser scanner data. Autom. Constr. 2013, 31, 325–337. [Google Scholar] [CrossRef]
- Bosche, F. Automated recognition of 3D cad model objects in laser scans and calculation of as-built dimensions for dimensional compliance control in construction. Adv. Eng. Inform. 2010, 24, 107–118. [Google Scholar] [CrossRef]
- Kim, C.; Son, H.; Kim, C. Automated construction progress measurement using a 4d building information model and 3D data. Autom. Constr. 2013, 31, 75–82. [Google Scholar] [CrossRef]
- Biagini, C.; Capone, P.; Donato, V.; Facchini, N. Towards the bim implementation for historical building restoration sites. Autom. Constr. 2016, 71, 74–86. [Google Scholar] [CrossRef]
- Chen, D.-L.; Lu, Y.-Y.; Jia, D.-Z. Automatic 3D reconstruction of highway tunnel using terrestrial laser scanning technology. Fresenius Environ. Bull. 2018, 27, 7677–7684. [Google Scholar]
- Garavaglia, E.; Anzani, A.; Maroldi, F.; Vanerio, F. Non-invasive identification of vulnerability elements in existing buildings and their visualization in the bim model for better project management: The case study of cuccagna farmhouse. Appl. Sci. 2020, 10, 2119. [Google Scholar] [CrossRef]
- Ham, N.; Lee, S.-H. Empirical study on structural safety diagnosis of large-scale civil infrastructure using laser scanning and bim. Sustainability 2018, 10, 4024. [Google Scholar] [CrossRef]
- Khairadeen Ali, A.; Lee, O.J.; Lee, D.; Park, C. Remote indoor construction progress monitoring using extended reality. Sustainability 2021, 13, 2290. [Google Scholar] [CrossRef]
- Kim, S.; Kim, S.; Lee, D.-E. 3D point cloud and bim-based reconstruction for evaluation of project by as-planned and as-built. Remote Sens. 2020, 12, 1457. [Google Scholar] [CrossRef]
- Leon-Robles, C.A.; Reinoso-Gordo, J.F.; Gonzalez-Quinones, J.J. Heritage building information modeling (h-bim) applied to a stone bridge. ISPRS Int. J. Geo-Inf. 2019, 8, 121. [Google Scholar] [CrossRef]
- Li, H.; Zhang, C.; Song, S.; Demirkesen, S.; Chang, R. Improving tolerance control on modular construction project with 3D laser scanning and bim: A case study of removable floodwall project. Appl. Sci. 2020, 10, 8680. [Google Scholar] [CrossRef]
- Lu, R.; Brilakis, I. Digital twinning of existing reinforced concrete bridges from labelled point clusters. Autom. Constr. 2019, 105, 102837. [Google Scholar] [CrossRef]
- Ma, L.; Sacks, R.; Kattel, U.; Bloch, T. 3D object classification using geometric features and pairwise relationships. Comput.-Aided Civ. Infrastruct. Eng. 2018, 33, 152–164. [Google Scholar] [CrossRef]
- Ma, S. Three-Dimensional laser combined with bim technology for building modeling, information data acquisition and monitoring. Nonlinear Opt. Quantum Opt. 2020, 52, 191–203. [Google Scholar]
- Mustafa, M.H.; Ali, M.; Hashim, K.S.H.Y.; Suhaimi, M.S.M. Recreating historical malay architecture with bim process. Int. J. Built Environ. Sustain. 2020, 7, 79–89. [Google Scholar] [CrossRef]
- Mustafa, M.H.; Ali, M.; Ismail, K.M.; Hashim, K.S.H.Y.; Suhaimi, M.S.M. Bim backed decision support system in the management of heritage building. Int. J. Built Environ. Sustain. 2019, 6, 63–71. [Google Scholar] [CrossRef]
- Odrobinak, J.; Farbak, M.; Chromcak, J.; Kortis, J.; Gocal, J. Real geometrical imperfection of bow-string arches-measurement and global analysis. Appl. Sci. 2020, 10, 4530. [Google Scholar] [CrossRef]
- Pepe, M.; Costantino, D.; Garofalo, A.R. An efficient pipeline to obtain 3D model for hbim and structural analysis purposes from 3D point clouds. Appl. Sci. 2020, 10, 1235. [Google Scholar] [CrossRef]
- Sedek, M.; Serwa, A. Development of new system for detection of bridges construction defects using terrestrial laser remote sensing technology. Egypt. J. Remote Sens. Space Sci. 2016, 19, 273–283. [Google Scholar] [CrossRef][Green Version]
- Shanbari, H.A.; Blinn, N.M.; Issa, R.R. Laser scanning technology and bim in construction management education. J. Inf. Technol. Constr. 2016, 21, 204–217. [Google Scholar]
- Shim, C.-S.; Dang, S.N.; Park, S. Three-Dimensional information delivery for design and construction of prefabricated bridge piers. Struct. Eng. Int. 2018, 28, 6–12. [Google Scholar] [CrossRef]
- Nguyen, T.A.; Nguyen, P.T.; Do, S.T. Application of bim and 3D laser scanning for quantity management in construction projects. Adv. Civ. Eng. 2020, 2020, 8839923. [Google Scholar] [CrossRef]
- Wang, C.; Cho, Y.K. Smart scanning and near real-time 3D surface modeling of dynamic construction equipment from a point cloud. Autom. Constr. 2015, 49, 239–249. [Google Scholar] [CrossRef]
- Wang, J.; Zhang, S.; Teizer, J. Geotechnical and safety protective equipment planning using range point cloud data and rule checking in building information modeling. Autom. Constr. 2015, 49, 250–261. [Google Scholar] [CrossRef]
- Xu, Y.; Shen, X.; Lim, S. Cordet: Corner-aware 3D object detection networks for automated scan-to-bim. J. Comput. Civ. Eng. 2021, 35, 04021002. [Google Scholar] [CrossRef]
- Xu, Z.; Kang, R.; Lu, R. 3D reconstruction and measurement of surface defects in prefabricated elements using point clouds. J. Comput. Civ. Eng. 2020, 34, 04020033. [Google Scholar] [CrossRef]
- Zhao, L.; Zhang, H.; Wang, Q.; Wang, H. Digital-Twin-Based evaluation of nearly zero-energy building for existing buildings based on scan-to-bim. Adv. Civ. Eng. 2021, 2021, 6638897. [Google Scholar] [CrossRef]
- Bautista-De Castro, A.; Sanchez-Aparicio, L.J.; Ramos, L.F.; Sena-Cruz, J.; Gonzalez-Aguilera, D. Integrating geomatic approaches, operational modal analysis, advanced numerical and updating methods to evaluate the current safety conditions of the historical boco bridge. Constr. Build. Mater. 2018, 158, 961–984. [Google Scholar] [CrossRef]
- Zhou, Y.; Han, D.; Hu, K.; Qin, G.; Xiang, Z.; Ying, C.; Zhao, L.; Hu, X. Accurate virtual trial assembly method of prefabricated steel components using terrestrial laser scanning. Adv. Civ. Eng. 2021, 2021, 9916859. [Google Scholar] [CrossRef]
- Isailovic, D.; Stojanovic, V.; Trapp, M.; Richter, R.; Hajdin, R.; Doellner, J. Bridge damage: Detection, ifc-based semantic enrichment and visualization. Autom. Constr. 2020, 112, 22. [Google Scholar] [CrossRef]
- Qin, G.; Zhou, Y.; Hu, K.; Han, D.; Ying, C. Automated reconstruction of parametric bim for bridge based on terrestrial laser scanning data. Adv. Civ. Eng. 2021, 2021, 8899323. [Google Scholar] [CrossRef]
- Poechtrager, M.; Styhler-Aydin, G.; Hochreiner, G.; Oezka, T.; Doering-Williams, M.; Pfeifer, N. Bridging the gap: Digital models of historic roof structures for enhanced interdisciplinary research. SCIRES-IT-SCIentific Res. Inf. Technol. 2020, 10, 31–42. [Google Scholar] [CrossRef]
- Cheng, Y.-J.; Qiu, W.-G.; Duan, D.-Y. Automatic creation of as-is building information model from single-track railway tunnel point clouds. Autom. Constr. 2019, 106, 16. [Google Scholar] [CrossRef]
- Kim, M.K.; Wang, Q.; Park, J.W.; Cheng, J.C.P.; Sohn, H.; Chang, C.C. Automated dimensional quality assurance of full-scale precast concrete elements using laser scanning and bim. Autom. Constr. 2016, 72, 102–114. [Google Scholar] [CrossRef]
- Yang, H.; Xu, X.Y.; Neumann, I. An automatic finite element modelling for deformation analysis of composite structures. Compos. Struct. 2019, 212, 434–438. [Google Scholar] [CrossRef]
- Yang, H.; Xu, X.Y.; Neumann, I. The benefit of 3D laser scanning technology in the generation and calibration of fem models for health assessment of concrete structures. Sensors 2014, 14, 21889–21904. [Google Scholar] [CrossRef]
- Lubowiecka, I.; Armesto, J.; Arias, P.; Lorenzo, H. Historic bridge modelling using laser scanning, ground penetrating radar and finite element methods in the context of structural dynamics. Eng. Struct. 2009, 31, 2667–2676. [Google Scholar] [CrossRef]
- Kogut, J.P.; Pilecka, E. Application of the terrestrial laser scanner in the monitoring of earth structures. Open Geosci. 2020, 12, 503–517. [Google Scholar] [CrossRef]
- Binczyk, M.; Kalitowski, P.; Szulwic, J.; Tysiac, P. Nondestructive testing of the miter gates using various measurement methods. Sensors 2020, 20, 1749. [Google Scholar] [CrossRef]
- Matsumoto, K.; Panting, C.A.L.; Kitratporn, N.; Takeuchi, W.; Nagai, K.; Iwasaki, E. Performance assessment using structural analysis and spatial measurement of a damaged suspension bridge: Case study of twantay bridge, myanmar. J. Bridge Eng. 2018, 23, 14. [Google Scholar] [CrossRef]
- Dall’Asta, A.; Leoni, G.; Meschini, A.; Petrucci, E.; Zona, A. Integrated approach for seismic vulnerability analysis of historic massive defensive structures. J. Cult. Herit. 2019, 35, 86–98. [Google Scholar] [CrossRef]
- Qiu, W.G.; Cheng, Y.J. High-resolution dem generation of railway tunnel surface using terrestrial laser scanning data for clearance inspection. J. Comput. Civ. Eng. 2017, 31, 13. [Google Scholar] [CrossRef]
- Braun, A.; Tuttas, S.; Borrmann, A.; Stilla, U. Improving progress monitoring by fusing point clouds, semantic data and computer vision. Autom. Constr. 2020, 116, 103210. [Google Scholar] [CrossRef]
- Erkal, B.G.; Hajjar, J.F. Using extracted member properties for laser-based surface damage detection and quantification. Struct. Control. Health Monit. 2020, 27, e2616. [Google Scholar] [CrossRef]
- Kim, H.; Kim, C. Deep-Learning-based classification of point clouds for bridge inspection. Remote Sens. 2020, 12, 3757. [Google Scholar] [CrossRef]
- Lu, R.; Brilakis, I.; Middleton, C.R. Detection of structural components in point clouds of existing rc bridges. Comput.-Aided Civ. Infrastruct. Eng. 2019, 34, 191–212. [Google Scholar] [CrossRef]
- Maalek, R.; Lichti, D.D.; Ruwanpura, J.Y. Automatic recognition of common structural elements from point clouds for automated progress monitoring and dimensional quality control in reinforced concrete construction. Remote Sens. 2019, 11, 1102. [Google Scholar] [CrossRef]
- Ponciano, J.-J.; Trerneau, A.; Boochs, F. Automatic detection of objects in 3D point clouds based on exclusively semantic guided processes. ISPRS Int. J. Geo-Inf. 2019, 8, 442. [Google Scholar] [CrossRef]
- Sacks, R.; Ma, L.; Yosef, R.; Borrmann, A.; Daum, S.; Kattel, U. Semantic enrichment for building information modeling: Procedure for compiling inference rules and operators for complex geometry. J. Comput. Civ. Eng. 2017, 31, 04017062. [Google Scholar] [CrossRef]
- Wang, Q.; Cheng, J.C.P.; Sohn, H. Automated estimation of reinforced precast concrete rebar positions using colored laser scan data. Comput.-Aided Civ. Infrastruct. Eng. 2017, 32, 787–802. [Google Scholar] [CrossRef]
- Xu, Y.; Tuttas, S.; Hoegner, L.; Stilla, U. Geometric primitive extraction from point clouds of construction sites using vgs. IEEE Geosci. Remote Sens. Lett. 2017, 14, 424–428. [Google Scholar] [CrossRef]
- Yan, Y.; Hajjar, J.F. Automated extraction of structural elements in steel girder bridges from laser point clouds. Autom. Constr. 2021, 125, 103582. [Google Scholar] [CrossRef]
- Yoon, J.-S.; Sagong, M.; Lee, J.S.; Lee, K.-S. Feature extraction of a concrete tunnel liner from 3D laser scanning data. NDT E Int. 2009, 42, 97–105. [Google Scholar] [CrossRef]
- Acikgoz, S.; Soga, K.; Woodhams, J. Evaluation of the response of a vaulted masonry structure to differential settlements using point cloud data and limit analyses. Constr. Build. Mater. 2017, 150, 916–931. [Google Scholar] [CrossRef]
- Alamdari, M.M.; Ge, L.; Kildashti, K.; Zhou, Y.; Harvey, B.; Du, Z. Non-contact structural health monitoring of a cable-stayed bridge: Case study. Struct. Infrastruct. Eng. 2019, 15, 1119–1136. [Google Scholar] [CrossRef]
- Artese, S.; Nico, G. Tls and gb-rar measurements of vibration frequencies and oscillation amplitudes of tall structures: An application to wind towers. Appl. Sci. 2020, 10, 2237. [Google Scholar] [CrossRef]
- Batur, M.; Yilmaz, O.; Ozener, H. A case study of deformation measurements of istanbul land walls via terrestrial laser scanning. IEEE J. Sel. Top. Appl. Earth Obs. Remote Sens. 2020, 13, 6362–6371. [Google Scholar] [CrossRef]
- Cao, Z.; Chen, D.; Shi, Y.; Zhang, Z.; Jin, F.; Yun, T.; Xu, S.; Kang, Z.; Zhang, L. A flexible architecture for extracting metro tunnel cross sections from terrestrial laser scanning point clouds. Remote Sens. 2019, 11, 297. [Google Scholar] [CrossRef]
- Chang, K.T.; Wang, E.H. Developing procedures for post-earthquake structural evaluation by laser scanning techniques. Insight 2012, 54, 562–567. [Google Scholar] [CrossRef]
- Chen, M.C.; Chen, C.-S.; Wu, C.-T.; Wang, E.H. Monitoring of sag deformation in suspension bridges using a 3D laser scanner. Mater. Eval. 2010, 68, 1368–1378. [Google Scholar]
- Chen, X.; Zhang, G.; Hua, X.; Wu, H.; Xuan, W. Extracting of six deformation parameters using improved icp matching based on terrestrial laser scanning data. J. Indian Soc. Remote Sens. 2017, 45, 123–130. [Google Scholar] [CrossRef]
- Cheng, Y.-J.; Qiu, W.; Lei, J. Automatic extraction of tunnel lining cross-sections from terrestrial laser scanning point clouds. Sensors 2016, 16, 1648. [Google Scholar] [CrossRef] [PubMed]
- Erdelyi, J.; Kopacik, A.; Kyrinovic, P. Spatial data analysis for deformation monitoring of bridge structures. Appl. Sci. 2020, 10, 8731. [Google Scholar] [CrossRef]
- Gawronek, P.; Makuch, M. Tls measurement during static load testing of a railway bridge. ISPRS Int. J. Geo-Inf. 2019, 8, 44. [Google Scholar] [CrossRef]
- Gawronek, P.; Makuch, M.; Mitka, B.; Gargula, T. Measurements of the vertical displacements of a railway bridge using tls technology in the context of the upgrade of the polish railway transport. Sensors 2019, 19, 4275. [Google Scholar] [CrossRef]
- Gonzalez-Jorge, H.; Riveiro, B.; Armesto, J.; Arias, P. Procedure to evaluate the accuracy of laser-scanning systems using a linear precision electro-mechanical actuator. IET Sci. Meas. Technol. 2012, 6, 6–12. [Google Scholar] [CrossRef]
- Gonzalez-Jorge, H.; Solla, M.; Armesto, J.; Arias, P. Novel method to determine laser scanner accuracy for applications in civil engineering. Opt. Appl. 2012, 42, 43–53. [Google Scholar] [CrossRef]
- Gumus, K.; Erkaya, H.; Soycan, M. Investigation of repeatability of digital surface model obtained from point clouds in a concrete arch dam for monitoring of deformations. Bol. Cienc. Geod. 2013, 19, 268–286. [Google Scholar] [CrossRef][Green Version]
- Hu, Q.; Yin, W. Tempo-Space deformation detection of subway tunnel based on sequence temporal 3D point cloud. Disaster Adv. 2012, 5, 1326–1330. [Google Scholar]
- Jiang, Q.; Zhong, S.; Pan, P.-Z.; Shi, Y.; Guo, H.; Kou, Y. Observe the temporal evolution of deep tunnel’s 3D deformation by 3D laser scanning in the jinchuan no. 2 mine. Tunn. Undergr. Space Technol. 2020, 97, 103237. [Google Scholar] [CrossRef]
- Kalasapudi, V.S.; Tang, P.; Xiong, W.; Shi, Y. A multi-level 3D data registration approach for supporting reliable spatial change classification of single-pier bridges. Adv. Eng. Inform. 2018, 38, 187–202. [Google Scholar] [CrossRef]
- Kang, Z.; Zhang, L.; Tuo, L.; Wang, B.; Chen, J. Continuous extraction of subway tunnel cross sections based on terrestrial point clouds. Remote Sens. 2014, 6, 857–879. [Google Scholar] [CrossRef]
- Kermarrec, G.; Kargoll, B.; Alkhatib, H. Deformation analysis using b-spline surface with correlated terrestrial laser scanner observations—A bridge under load. Remote Sens. 2020, 12, 829. [Google Scholar] [CrossRef]
- Kermarrec, G.; Paffenholz, J.-A.; Alkhatib, H. How significant are differences obtained by neglecting correlations when testing for deformation: A real case study using bootstrapping with terrestrial laser scanner observations approximated by b-spline surfaces. Sensors 2019, 19, 3640. [Google Scholar] [CrossRef]
- Kim, K.; Kim, J. Dynamic displacement measurement of a vibratory object using a terrestrial laser scanner. Meas. Sci. Technol. 2015, 26, 045002. [Google Scholar] [CrossRef]
- Kitratporn, N.; Takeuchi, W.; Matsumoto, K.; Nagai, K. Structure deformation measurement with terrestrial laser scanner at pathein bridge in myanmar. J. Disaster Res. 2018, 13, 40–49. [Google Scholar] [CrossRef]
- Li, Y.; Liu, P.; Li, H.; Huang, F. A comparison method for 3D laser point clouds in displacement change detection for arch dams. ISPRS Int. J. Geo-Inf. 2021, 10, 184. [Google Scholar] [CrossRef]
- Lohmus, H.; Ellmann, A.; Mardla, S.; Idnurm, S. Terrestrial laser scanning for the monitoring of bridge load tests—Two case studies. Surv. Rev. 2018, 50, 270–284. [Google Scholar] [CrossRef]
- Mill, T.; Ellmann, A.; Kiisa, M.; Idnurm, J.; Idnurm, S.; Horemuz, M.; Aavik, A. Geodetic monitoring of bridge deformations occurring during static load testing. Balt. J. Road Bridge Eng. 2015, 10, 17–27. [Google Scholar] [CrossRef]
- Oparin, V.N.; Yushkin, V.F.; Polyankin, G.N.; Grishin, A.N.; Kuznetsov, A.O.; Rublev, D.E. Geomechanical monitoring of temporal lining in railway tunneling in complex geological conditions. J. Min. Sci. 2015, 51, 839–859. [Google Scholar] [CrossRef]
- Ramos-Alcazar, L.; Marchamalo-Sacristan, M.; Martinez-Marin, R. Estimating and plotting tls midrange precisions in field conditions: Application to dam monitoring. Int. J. Civ. Eng. 2017, 15, 299–307. [Google Scholar] [CrossRef]
- Sanpei, T.; Mizoguchi, T. Fundamental study for real-time detection of sudden displacement by high-speed laser scanner. J. Struct. Integr. Maint. 2018, 3, 227–232. [Google Scholar] [CrossRef]
- Wang, E.H.; Chang, K.T.; Chen, M.C.; Wang, C.Y.; Chen, C.S. Working procedures derived from lessons learned on bridge inspections using terrestrial laser scanners. Lasers Eng. 2012, 22, 63–78. [Google Scholar]
- Wang, W.; Chen, W.; Kevin, W.; Shuang, L. Extraction of tunnel center line and cross-sections on fractional calculus, 3D invariant moments and best-fit ellipse. Opt. Laser Technol. 2020, 128, 106220. [Google Scholar] [CrossRef]
- Xu, H.; Li, H.; Yang, X.; Qi, S.; Zhou, J. Integration of terrestrial laser scanning and nurbs modeling for the deformation monitoring of an earth-rock dam. Sensors 2019, 19, 22. [Google Scholar] [CrossRef]
- Xu, J.; Ding, L.; Luo, H.; Chen, E.J.; Wei, L. Near real-time circular tunnel shield segment assembly quality inspection using point cloud data: A case study. Tunn. Undergr. Space Technol. 2019, 91, 102998. [Google Scholar] [CrossRef]
- Xu, X.; Kargoll, B.; Bureick, J.; Yang, H.; Alkhatib, H.; Neumann, I. Tls-based profile model analysis of major composite structures with robust b-spline method. Compos. Struct. 2018, 184, 814–820. [Google Scholar] [CrossRef]
- Xu, X.; Yang, H. Network method for deformation analysis of three-dimensional point cloud with terrestrial laser scanning sensor. Int. J. Distrib. Sens. Netw. 2018, 14, 1550147718814139. [Google Scholar] [CrossRef]
- Xu, X.; Yang, H. Robust model reconstruction for intelligent health monitoring of tunnel structures. Int. J. Adv. Robot. Syst. 2020, 17, 1729881420910836. [Google Scholar] [CrossRef]
- Xu, X.; Yang, H.; Kargoll, B. Robust and automatic modeling of tunnel structures based on terrestrial laser scanning measurement. Int. J. Distrib. Sens. Netw. 2019, 15, 1550147719884886. [Google Scholar] [CrossRef]
- Xu, X.; Yang, H.; Neumann, I. A feature extraction method for deformation analysis of large-scale composite structures based on tls measurement. Compos. Struct. 2018, 184, 591–596. [Google Scholar] [CrossRef]
- Xuan, W.; Hua, X.; Zou, J.; He, X. Determining the deformation monitorable indicator of point cloud using error ellipsoid. J. Indian Soc. Remote Sens. 2017, 45, 35–43. [Google Scholar] [CrossRef]
- Yang, H.; Xu, X. Multi-sensor technology for b-spline modelling and deformation analysis of composite structures. Compos. Struct. 2019, 224, 111000. [Google Scholar] [CrossRef]
- Zhang, C.; Lei, Y.; Zhang, L.; Chen, N. Modeling tunnel profile in the presence of coordinate errors: A gaussian process-based approach. IISE Trans. 2017, 49, 1065–1077. [Google Scholar] [CrossRef]
- Zhang, L.; Cheng, X.; Wang, L. Ellipse-fitting algorithm and adaptive threshold to eliminate outliers. Surv. Rev. 2019, 51, 250–256. [Google Scholar] [CrossRef]
- Zhao, X.; Lei, D.; Zhang, S. Stability analysis of underground water-sealed oil storage caverns in china: A case study. Energy Explor. Exploit. 2020, 38, 2252–2276. [Google Scholar] [CrossRef]
- Zhao, X.; Alkhatib, H.; Kargoll, B.; Neumann, I. Statistical evaluation of the influence of the uncertainty budget on b-spline curve approximation. J. Appl. Geod. 2017, 11, 215–230. [Google Scholar] [CrossRef]
- Acikgoz, S.; Pelecanos, L.; Giardina, G.; Aitken, J.; Soga, K. Distributed sensing of a masonry vault during nearby piling. Struct. Control. Health Monit. 2017, 24, 19. [Google Scholar] [CrossRef]
- Ye, C.; Acikgoz, S.; Pendrigh, S.; Riley, E.; DeJong, M.J. Mapping deformations and inferring movements of masonry arch bridges using point cloud data. Eng. Struct. 2018, 173, 530–545. [Google Scholar] [CrossRef]
- Jaafar, H.A.; Meng, X.L.; Sowter, A.; Bryan, P. New approach for monitoring historic and heritage buildings: Using terrestrial laser scanning and generalised procrustes analysis. Struct. Control. Health Monit. 2017, 24, e1987. [Google Scholar] [CrossRef]
- Hu, C.; Zhou, Y.-H.; Zhao, C.-J.; Pan, Z.-G. Slope excavation quality assessment and excavated volume calculation in hydraulic projects based on laser scanning technology. Water Sci. Eng. 2015, 8, 164–173. [Google Scholar] [CrossRef]
- Jeng, C.-H.; Chiu, H.-J.; Lu, C.-W.; Chao, M. Innovative launch of long-span arch bridge across waterway using special hydraulic crawler. Pract. Period. Struct. Des. Constr. 2020, 25, 05020005. [Google Scholar] [CrossRef]
- Kim, D.; Kwak, Y.; Sohn, H. Accelerated cable-stayed bridge construction using terrestrial laser scanning. Autom. Constr. 2020, 117, 103269. [Google Scholar] [CrossRef]
- Ordonez, C.; Argueelles, R.; Martinez, J.; Garcia-Cortes, S. A mathematical algorithm for dimensional control of tunnels using topographic profiles. Int. J. Comput. Math. 2013, 90, 2072–2078. [Google Scholar] [CrossRef]
- Sklodowska, A.M.; Mitew-Czajewska, M. The influence of electronic detonators on the quality of the tunnel excavation. Arch. Civ. Eng. 2021, 67, 333–349. [Google Scholar] [CrossRef]
- Kwon, K.-B.; Song, C.-H.; Park, J.-Y.; Oh, J.-Y.; Lee, J.-W.; Cho, J.-W. Evaluation of drilling efficiency by percussion testing of a drill bit with new button arrangement. Int. J. Precis. Eng. Manuf. 2014, 15, 1063–1068. [Google Scholar] [CrossRef]
- Forsman, S.; Laitila, L. Three-dimensional, as-built site verification in supplying engineer-to-order joinery products to construction. Wood Mater. Sci. Eng. 2015, 10, 353–367. [Google Scholar] [CrossRef]
- Guo, J.; Yuan, L.; Wang, Q. Time and cost analysis of geometric quality assessment of structural columns based on 3D terrestrial laser scanning. Autom. Constr. 2020, 110, 103014. [Google Scholar] [CrossRef]
- Lee, M.; Lee, S.; Kwon, S.; Chin, S. A study on scan data matching for reverse engineering of pipes in plant construction. KSCE J. Civ. Eng. 2017, 21, 2027–2036. [Google Scholar] [CrossRef]
- Yang, Y.; Balange, L.; Gericke, O.; Schmeer, D.; Zhang, L.; Sobek, W.; Schwieger, V. Monitoring of the production process of graded concrete component using terrestrial laser scanning. Remote Sens. 2021, 13, 1622. [Google Scholar] [CrossRef]
- Arashpour, M.; Heidarpour, A.; Nezhad, A.; Hosseinifard, Z.; Chileshe, N.; Hosseini, R. Performance-based control of variability and tolerance in off-site manufacture and assembly: Optimization of penalty on poor production quality. Constr. Manag. Econ. 2020, 38, 502–514. [Google Scholar] [CrossRef]
- Tang, P.; Chen, G.; Shen, Z. A spatial-context-based approach for automated spatial change analysis of piece-wise linear building elements. Comput.-Aided Civ. Infrastruct. Eng. 2016, 31, 65–80. [Google Scholar] [CrossRef]
- Andersson, L.R.; Hellstrom, J.G.I.; Andreasson, P.; Lundstrom, T.S. Numerical investigation of a hydropower tunnel: Estimating localised head-loss using the manning equation. Water 2019, 11, 1562. [Google Scholar] [CrossRef]
- Colombo, M.; di Prisco, M.; Mazzoleni, L. Sprayed tunnel linings: A comparison between several reinforcement solutions. Mater. Struct. 2009, 42, 1295–1311. [Google Scholar] [CrossRef]
- Covian, E.; Casero, M.; Menendez, M.; Bernardo, A. Application of hds techniques to bridge inspection. Nondestruct. Test. Eval. 2018, 33, 301–314. [Google Scholar] [CrossRef]
- Hasan, M.S.; Li, S.S.; Zsaki, A.M.; Nokken, M.R. Measurement of abrasion on concrete surfaces with 3D scanning technology. J. Mater. Civ. Eng. 2019, 31, 04019207. [Google Scholar] [CrossRef]
- Li, D.; Liu, J.; Feng, L.; Zhou, Y.; Liu, P.; Chen, Y.F. Terrestrial laser scanning assisted flatness quality assessment for two different types of concrete surfaces. Measurement 2020, 154, 107436. [Google Scholar] [CrossRef]
- Li, F.; Li, H.; Kim, M.-K.; Lo, K.-C. Laser scanning based surface flatness measurement using flat mirrors for enhancing scan coverage range. Remote Sens. 2021, 13, 714. [Google Scholar] [CrossRef]
- Li, L.; Cui, L.; Liu, H.; Qin, C.; Hu, J.; Zhang, M. A method of tunnel critical rock identification and stability analysis based on a laser point cloud. Arab. J. Geosci. 2020, 13, 538. [Google Scholar] [CrossRef]
- Li, X.; Chen, J.; Zhu, H. A new method for automated discontinuity trace mapping on rock mass 3D surface model. Comput. Geosci. 2016, 89, 118–131. [Google Scholar] [CrossRef]
- Miskiewicz, M.; Bruski, D.; Chroscielewski, J.; Wilde, K. Safety assessment of a concrete viaduct damaged by vehicle impact and an evaluation of the repair. Eng. Fail. Anal. 2019, 106, 104147. [Google Scholar] [CrossRef]
- Monsalve, J.J.; Baggett, J.; Bishop, R.; Ripepi, N. Application of laser scanning for rock mass characterization and discrete fracture network generation in an underground limestone mine. Int. J. Min. Sci. Technol. 2019, 29, 131–137. [Google Scholar] [CrossRef]
- Mugnai, F.; Farina, P.; Tucci, G. Exploiting a semi-automatic point cloud segmentation method to improve the quality of rock-mass characterization. The cima grappa conservative restoration case study. ISPRS Int. J. Geo-Inf. 2021, 10, 276. [Google Scholar] [CrossRef]
- Suchocki, C.; Katzer, J.; Rapinski, J. Terrestrial laser scanner as a tool for assessment of saturation and moisture movement in building materials. Period. Polytech.-Civ. Eng. 2018, 62, 694–699. [Google Scholar] [CrossRef]
- Tang, P.; Huber, D.; Akinci, B. Characterization of laser scanners and algorithms for detecting flatness defects on concrete surfaces. J. Comput. Civ. Eng. 2011, 25, 31–42. [Google Scholar] [CrossRef]
- Turkan, Y.; Hong, J.; Laflamme, S.; Puri, N. Adaptive wavelet neural network for terrestrial laser scanner-based crack detection. Autom. Constr. 2018, 94, 191–202. [Google Scholar] [CrossRef]
- Wang, Q.; Kim, M.-K.; Sohn, H.; Cheng, J.C.P. Surface flatness and distortion inspection of precast concrete elements using laser scanning technology. Smart. Struct. Syst. 2016, 18, 601–623. [Google Scholar] [CrossRef]
- Xu, T.; Xu, L.; Li, X.; Yao, J. Detection of water leakage in underground tunnels using corrected intensity data and 3D point cloud of terrestrial laser scanning. IEEE Access 2018, 6, 32471–32480. [Google Scholar] [CrossRef]
- Xu, X.; Yang, H. Intelligent crack extraction and analysis for tunnel structures with terrestrial laser scanning measurement. Adv. Mech. Eng. 2019, 11, 1687814019872650. [Google Scholar] [CrossRef]
- Xue, X.; Zhang, J.; Zhou, X. Reliability evaluation of water-rich loess tunnel with lining crack based on extension theory. Adv. Civ. Eng. 2019, 2019, 8267406. [Google Scholar] [CrossRef]
- Braun, A.; Tuttas, S.; Borrmann, A.; Stilla, U. A concept for automated construction progress monitoring using bim-based geometric constraints and photogrammetric point clouds. J. Inf. Technol. Constr. 2015, 20, 68–79. [Google Scholar]
- Son, H.; Kim, C.; Cho, Y.K. Automated schedule updates using as-built data and a 4d building information model. J. Manag. Eng. 2017, 33, 04017012. [Google Scholar] [CrossRef]
- Zhang, C.; Arditi, D. Advanced progress control of infrastructure construction projects using terrestrial laser scanning technology. Infrastructures 2020, 5, 83. [Google Scholar] [CrossRef]
- Mousavi, V.; Khosravi, M.; Ahmadi, M.; Noori, N.; Haghshenas, S.; Hosseininaveh, A.; Varshosaz, M. The performance evaluation of multi-image 3D reconstruction software with different sensors. Measurement 2018, 120, 1–10. [Google Scholar] [CrossRef]
- Bhatla, A.; Choe, S.Y.; Fierro, O.; Leite, F. Evaluation of accuracy of as-built 3D modeling from photos taken by handheld digital cameras. Autom. Constr. 2012, 28, 116–127. [Google Scholar] [CrossRef]
- Moon, D.; Chung, S.; Kwon, S.; Seo, J.; Shin, J. Comparison and utilization of point cloud generated from photogrammetry and laser scanning: 3D world model for smart heavy equipment planning. Autom. Constr. 2019, 98, 322–331. [Google Scholar] [CrossRef]
- Pleansamai, K.; Chaiyasarn, K. M-estimator sample consensus planar extraction from image-based 3D point cloud for building information modelling. Int. J. Geomate 2019, 17, 69–76. [Google Scholar] [CrossRef]
- Chen, J.; Fang, Y.; Cho, Y.K.; Kim, C. Principal axes descriptor for automated construction-equipment classification from point clouds. J. Comput. Civ. Eng. 2017, 31, 04019027. [Google Scholar] [CrossRef]
- Hackel, T.; Wegner, J.D.; Savinov, N.; Ladicky, L.; Schindler, K.; Pollefeys, M. Large-scale supervised learning for 3D point cloud labeling: Semantic3D. Net. Photogramm. Eng. Remote Sens. 2018, 84, 297–308. [Google Scholar] [CrossRef]
- Shan-Long, K. Optimization and Design of Deformation Monitoring Schemes. Ph.D. Thesis, The University of New Brunswick, Saint John, NB, Canada, 1993. [Google Scholar]
- Xie, X.; Zhu, K. Development of a three-dimensional modeling method for monitoring overall foundation pit deformation based on terrestrial laser scanning. Appl. Mech. Mater. 2015, 743, 866–875. [Google Scholar] [CrossRef]
- Riveiro, B.; DeJong, M.J.; Conde, B. Automated processing of large point clouds for structural health monitoring of masonry arch bridges. Autom. Constr. 2016, 72, 258–268. [Google Scholar] [CrossRef]
- Hess, M.; Petrovic, V.; Yeager, M.; Kuester, F. Terrestrial laser scanning for the comprehensive structural health assessment of the baptistery di san giovanni in florence, italy: An integrative methodology for repeatable data acquisition, visualization and analysis. Struct. Infrastruct. Eng. 2018, 14, 247–263. [Google Scholar] [CrossRef]
- D’Altri, A.M.; Milani, G.; de Miranda, S.; Castellazzi, G.; Sarhosis, V. Stability analysis of leaning historic masonry structures. Autom. Constr. 2018, 92, 199–213. [Google Scholar] [CrossRef]
- Cabaleiro, M.; Hermida, J.; Riveiro, B.; Caamano, J.C. Automated processing of dense points clouds to automatically determine deformations in highly irregular timber structures. Constr. Build. Mater. 2017, 146, 393–402. [Google Scholar] [CrossRef]
- Bertolini-Cestari, C.; Chiabrando, F.; Invernizzi, S.; Marzi, T.; Spano, A. Terrestrial laser scanning and settled techniques: A support to detect pathologies and safety conditions of timber structures. In Proceedings of the 2nd International Conference on Structural Health Assessment of Timber Structures (SHATIS), Trento, Italy, 4–6 September 2013; pp. 350–357. [Google Scholar]
- Cuartero, J.; Cabaleiro, M.; Sousa, H.S.; Branco, J.M. Tridimensional parametric model for prediction of structural safety of existing timber roofs using laser scanner and drilling resistance tests. Eng. Struct. 2019, 185, 58–67. [Google Scholar] [CrossRef]
- Nguyen, A.C.; Weinand, Y. Displacement study of a large-scale freeform timber plate structure using a total station and a terrestrial laser scanner. Sensors 2020, 20, 413. [Google Scholar] [CrossRef]
- Deruyter, G.; Van Quickelberghe, A.; Nuttens, T.; Stal, C.; De Wulf, A. Risk assessment: A comparison between the use of laser scanners and total stations in a situation where time is the critical factor. In Proceedings of the 13th International Multidisciplinary Scientific Geoconference, SGEM 2013, Albena, Bulgaria, 16–22 June 2013; pp. 687–694. [Google Scholar]
- Monserrat, O.; Crosetto, M. Deformation measurement using terrestrial laser scanning data and least squares 3D surface matching. ISPRS J. Photogramm. Remote Sens. 2008, 63, 142–154. [Google Scholar] [CrossRef]
- Sanchez-Rodriguez, A.; Riveiro, B.; Conde, B.; Soilan, M. Detection of structural faults in piers of masonry arch bridges through automated processing of laser scanning data. Struct. Control. Health Monit. 2018, 25, e2126. [Google Scholar] [CrossRef]
- Ivorra, S.; Spairani, Y.; Torres, B.; Bru, D. Modeling the seismic behavior of a masonry aqueduct. In Proceedings of the 5th International Congress on Mechanical Models in Structural Engineering (CMMoST), Univ. Alicante, Escuela Politecnica Super, Alicante, Spain, 23–25 October 2019; pp. 475–485. [Google Scholar]
- Riveiro, B.; Morer, P.; Arias, P.; de Arteaga, I. Terrestrial laser scanning and limit analysis of masonry arch bridges. Constr. Build. Mater. 2011, 25, 1726–1735. [Google Scholar] [CrossRef]
- Arias, P.; Riveiro, B.; Armesto, J.; Solla, M. Terrestrial laser scanning and non parametric methods in masonry arches inspection. In Proceedings of the ISPRS-Commission V Mid-Term Symposium on Close Range Image Measurement Technique, Newcastle upon Tyne, UK, 21–24 June 2010; pp. 39–44. [Google Scholar]
- Conde, B.; Diaz-Vilarino, L.; Laguela, S.; Arias, P. Structural analysis of monforte de lemos masonry arch bridge considering the influence of the geometry of the arches and fill material on the collapse load estimation. Constr. Build. Mater. 2016, 120, 630–642. [Google Scholar] [CrossRef]
- Barsi, F.; Barsotti, R.; Bennati, S. Equilibrium of Masonry Sail Vaults: The Case Study of a Subterranean Vault by Antonio da Sangallo the Elder in the Ldquofortezza Vecchiardquo in Livorno; Springer International Publishing: Cham, Switzerland, 2020; pp. 2094–2103. [Google Scholar]
- Viti, S.; Pintucchi, B.; Rotunno, T.; Tanganelli, M. The seismic analysis of cerere at the museum of bargello. Bull. Earthq. Eng. 2020, 18, 2635–2656. [Google Scholar] [CrossRef]
- D’Altri, A.M.; Castellazzi, G.; de Miranda, S.; Tralli, A. Seismic-Induced damage in historical masonry vaults: A case-study in the 2012 emilia earthquake-stricken area. J. Build. Eng. 2017, 13, 224–243. [Google Scholar] [CrossRef]
- Angjeliu, G.; Coronelli, D.; Cardani, G.; Boothby, T. Structural assessment of iron tie rods based on numerical modelling and experimental observations in milan cathedral. Eng. Struct. 2020, 206, 109690. [Google Scholar] [CrossRef]
- Cabaleiro, M.; Lindenbergh, R.; Gard, W.F.; Arias, P.; van de Kuilen, J.W.G. Algorithm for automatic detection and analysis of cracks in timber beams from lidar data. Constr. Build. Mater. 2017, 130, 41–53. [Google Scholar] [CrossRef]
- Cabaleiro, M.; Branco, J.M.; Sousa, H.S.; Conde, B. First results on the combination of laser scanner and drilling resistance tests for the assessment of the geometrical condition of irregular cross-sections of timber beams. Mater. Struct. 2018, 51, 99. [Google Scholar] [CrossRef]
- Mol, A.; Cabaleiro, M.; Sousa, H.S.; Branco, J.M. Hbim for storing life-cycle data regarding decay and damage in existing timber structures. Autom. Constr. 2020, 117, 103262. [Google Scholar] [CrossRef]
- Bertolini-Cestari, C.; Spano, A.; Invernizzi, S.; Donadio, E.; Marzi, T.; Sammartano, G. The role of terrestrial lidar for mechanical and safety evaluation of historic timber floors. In Proceedings of the Conference on Historical Earthquake-Resistant Timber Framing in the Mediterranean Area (HEaRT), Lisbon, Portugal, 2–4 December 2015; pp. 277–286. [Google Scholar]
- Delcev, S.; Pejic, M.; Gucevic, J.; Ogizovic, V.; Vdi, V.-G. A procedure for accuracy investigation of terrestrial laser scanners. In Proceedings of the 10th IMEKO Symposium Laser Metrology for Precision Measurement and Inspection in Industry (LMPMI 2011), Braunschweig, Germany, 12–13 September 2011; pp. 273–280. [Google Scholar]
- Deruyter, G.; Nuttens, T.; Stal, C.; De Wulf, A. Assessment of the accuracy and precision of a near-real-time processing method of laser scan data applied on concrete structures. In Proceedings of the 14th International Multidisciplinary Scientific Geoconference (SGEM), Albena, Bulgaria, 17–26 June 2014; pp. 35–42. [Google Scholar]
- Ling, X.C. Research on building measurement accuracy verification based on terrestrial 3D laser scanner. In Proceedings of the IOP Asia Conference on Geological Research and Environmental Technology (GRET), Electr Network, Kamakura City, Japan, 10–11 October 2020. [Google Scholar]
- Muszynski, Z.; Rybak, J. Evaluation of terrestrial laser scanner accuracy in the control of hydrotechnical structures. Studia Geotech. Et Mech. 2017, 39, 45–57. [Google Scholar] [CrossRef]
- Krelling, P.C.L.; Gonzalez-Jorge, H.; Martinez-Sanchez, J.; Arias, P. Accuracy in target center evaluation using riegl lms z390i laser scanner and riscan pro software. Opt. Appl. 2012, 42, 773–781. [Google Scholar] [CrossRef]
- Pfennigbauer, M.; Ullrich, A.; do Carmo, J.P. High precision, accuracy, and resolution 3D laser scanner employing pulsed-time-of-flight measurement. In Proceedings of the Conference on Laser Radar Technology and Applications XVI, Orlando, FL, USA, 27–29 April 2011. [Google Scholar]
- Calders, K.; Disney, M.I.; Armston, J.; Burt, A.; Brede, B.; Origo, N.; Muir, J.; Nightingale, J. Evaluation of the range accuracy and the radiometric calibration of multiple terrestrial laser scanning instruments for data interoperability. IEEE Trans. Geosci. Remote Sens. 2017, 55, 2716–2724. [Google Scholar] [CrossRef]
- González-Jorge, H.; Rodríguez-Gonzálvez, P.; Shen, Y.; Lagüela, S.; Díaz-Vilariño, L.; Lindenbergh, R.; González-Aguilera, D.; Arias, P. Metrological intercomparison of six terrestrial laser scanning systems. IET Sci. Meas. Technol. 2018, 12, 218–222. [Google Scholar] [CrossRef]
- Ge, X.; Wunderlich, T. Target identification in terrestrial laser scanning. Surv. Rev. 2015, 47, 129–140. [Google Scholar] [CrossRef]
- Hartmann, J.; Paffenholz, J.A.; Strubing, T.; Neumann, I. Determination of position and orientation of lidar sensors on multisensor platforms. J. Surv. Eng. 2017, 143, 04017012. [Google Scholar] [CrossRef]
- Shi, S.D.; Muralikrishnan, B.; Sawyer, D. Terrestrial laser scanner calibration and performance evaluation using the network method. Opt. Lasers Eng. 2020, 134, 106298. [Google Scholar] [CrossRef]
- Kolapo, P.; Cawood, F. Factors to be considered in establishing a scanning laboratory for testing the accuracy of terrestrial laser scanning technologies. Int. J. Min. Miner. Eng. 2020, 11, 180–190. [Google Scholar] [CrossRef]
- Chow, J.C.K.; Lichti, D.D.; Teskey, W.F. Self-calibration of the trimble (mensi) gs200 terrestrial laser scanner. In Proceedings of the ISPRS-Commission V Mid-Term Symposium on Close Range Image Measurement Technique, Newcastle upon Tyne, UK, 21–24 June 2010; pp. 161–166. [Google Scholar]
- Glennie, C.L.; Kusari, A.; Facchin, A. Calibration and stability analysis of the vlp-16 laser scanner. In Proceedings of the European Calibration and Orientation Workshop (EuroCOW), Lausanne, Switzerland, 10–12 February 2016; pp. 55–59. [Google Scholar]
- Liu, F.F.; Ren, Y. Development of a standard device for laser scanner spatial performance calibration. In Proceedings of the Conference on Optical Metrology and Inspection for Industrial Applications VII, Electr Network, Online, 11–16 October 2020. [Google Scholar]
- Pareja, T.F.; Pablos, A.G.; Oliva, J.D.Y. Terrestrial laser scanner (tls) equipment calibration. In Proceedings of the 5th Manufacturing Engineering Society International Conference (MESIC), Univ. Zaragoza, Zaragoza, Spain, 26–28 June 2013; pp. 278–286. [Google Scholar]
- Reshetyuk, Y. A unified approach to self-calibration of terrestrial laser scanners. ISPRS J. Photogramm. Remote Sens. 2010, 65, 445–456. [Google Scholar] [CrossRef]
- Zhu, K.; Gong, L.; Gu, D.J.; Liu, C.L. An analytic calibration method for turntable-based 3D scanning system. In Proceedings of the IEEE/ASME International Conference on Advanced Intelligent Mechatronics (AIM), Hong Kong, China, 8–12 July 2019; pp. 495–500. [Google Scholar]
- Wang, L.; Muralikrishnan, B.; Lee, V.; Rachakonda, P.; Sawyer, D.; Gleason, J. A first realization of astm e3125-17 test procedures for laser scanner performance evaluation. Measurement 2020, 153, 107398. [Google Scholar] [CrossRef]
- Shi, S.D.; Muralikrishnan, B.; Lee, V.; Sawyer, D.; Icasio-Hernandez, O. Improvised long test lengths via stitching scale bar method: Performance evaluation of terrestrial laser scanners per astm e3125-17. J. Res. Natl. Inst. Stand. Technol. 2020, 125, 125017. [Google Scholar] [CrossRef]
- Mohammadi, M.; Rashidi, M.; Mousavi, V.; Karami, A.; Yu, Y.; Samali, B. Quality evaluation of digital twins generated based on uav photogrammetry and tls: Bridge case study. Remote Sens. 2021, 13, 3499. [Google Scholar] [CrossRef]
- Bobkowska, K.; Inglot, A.; Mikusova, M.; Tysiac, P. Implementation of spatial information for monitoring and analysis of the area around the port using laser scanning techniques. Pol. Marit. Res. 2017, 24, 10–15. [Google Scholar] [CrossRef]
- Sun, J.; Olsson, P.; Eriksson, H.; Harrie, L. Evaluating the geometric aspects of integrating bim data into city models. J. Spat. Sci. 2020, 65, 235–255. [Google Scholar] [CrossRef]
- Kalenjuk, S.; Lienhart, W.; Rebhan, M.J. Processing of mobile laser scanning data for large-scale deformation monitoring of anchored retaining structures along highways. Comput.-Aided Civ. Infrastruct. Eng. 2021, 36, 678–694. [Google Scholar] [CrossRef]
- Sun, J.; Sun, H.; Zhong, R.; Han, Y. Deformation detection method of mine tunnel based on mobile detection system. Sensors 2020, 20, 5400. [Google Scholar] [CrossRef] [PubMed]
- Yue, Z.; Sun, H.; Zhong, R.; Ma, H.; Xu, Z.; Elliott, F. Measurement of tunnel clearance convergence using mobile laser detection technology. Can. J. Remote Sens. 2021, 47, 100–118. [Google Scholar] [CrossRef]
- D’Amico, N.; Yu, T. Accuracy analysis of point cloud modeling for evaluating concrete specimens. In Proceedings of the Conference on Nondestructive Characterization and Monitoring of Advanced Materials, Aerospace, and Civil Infrastructure, Portland, OR, USA, 26–29 March 2017. [Google Scholar]
- Jeong, H.; Ahn, H.; Shin, D.; Choi, C. Comparison the mapping accuracy of construction sites using uavs with low-cost cameras. Korean J. Remote Sens. 2019, 35, 1–13. [Google Scholar] [CrossRef]
- Liu, C.; Zhou, L.; Wang, W.; Zhao, X. Concrete surface damage volume measurement based on three-dimensional reconstruction by smartphones. IEEE Sens. J. 2021, 21, 11349–11360. [Google Scholar] [CrossRef]
- Erdenebat, D.; Waldmann, D. Application of the dad method for damage localisation on an existing bridge structure using close-range uav photogrammetry. Eng. Struct. 2020, 218, 110727. [Google Scholar] [CrossRef]
- Freimuth, H.; Koenig, M. A framework for automated acquisition and processing of as-built data with autonomous unmanned aerial vehicles. Sensors 2019, 19, 4513. [Google Scholar] [CrossRef]
- Jacob-Loyola, N.; Munoz-La Rivera, F.; Herrera, R.F.; Atencio, E. Unmanned aerial vehicles (uavs) for physical progress monitoring of construction. Sensors 2021, 21, 4227. [Google Scholar] [CrossRef] [PubMed]
- Mora, O.E.; Chen, J.; Stoiber, P.; Koppanyi, Z.; Pluta, D.; Josenhans, R.; Okubo, M. Accuracy of stockpile estimates using low-cost suas photogrammetry. Int. J. Remote Sens. 2020, 41, 4512–4529. [Google Scholar] [CrossRef]
- Wang, S.; Zhang, Z.; Wang, C.; Zhu, C.; Ren, Y. Multistep rocky slope stability analysis based on unmanned aerial vehicle photogrammetry. Environ. Earth Sci. 2019, 78, 260. [Google Scholar] [CrossRef]
- Rashidi, A.; Dai, F.; Brilakis, I.; Vela, P. Optimized selection of key frames for monocular videogrammetric surveying of civil infrastructure. Adv. Eng. Inform. 2013, 27, 270–282. [Google Scholar] [CrossRef]
- Varbla, S.; Puust, R.; Ellmann, A. Accuracy assessment of rtk-gnss equipped uav conducted as-built surveys for construction site modelling. Surv. Rev. 2021, 53, 477–492. [Google Scholar] [CrossRef]
- Owerko, P.; Owerko, T. Novel approach to inspections of as-built reinforcement in incrementally launched bridges by means of computer vision-based point cloud data. IEEE Sens. J. 2021, 21, 11822–11833. [Google Scholar] [CrossRef]
- Brilakis, I.; Fathi, H.; Rashidi, A. Progressive 3D reconstruction of infrastructure with videogrammetry. Autom. Constr. 2011, 20, 884–895. [Google Scholar] [CrossRef]
- Fathi, H.; Brilakis, I. Automated sparse 3D point cloud generation of infrastructure using its distinctive visual features. Adv. Eng. Inform. 2011, 25, 760–770. [Google Scholar] [CrossRef]
- Rashidi, A.; Karan, E. Video to brim: Automated 3D as-built documentation of bridges. J. Perform. Constr. Facil. 2018, 32, 11. [Google Scholar] [CrossRef]
- Buegler, M.; Borrmann, A.; Ogunmakin, G.; Vela, P.A.; Teizer, J. Fusion of photogrammetry and video analysis for productivity assessment of earthwork processes. Comput.-Aided Civ. Infrastruct. Eng. 2017, 32, 107–123. [Google Scholar] [CrossRef]
- Maalek, R.; Lichti, D.D.; Maalek, S. Towards automatic digital documentation and progress reporting of mechanical construction pipes using smartphones. Autom. Constr. 2021, 127, 103735. [Google Scholar] [CrossRef]
- Puente, I.; Solla, M.; González-Jorge, H.; Arias, P. Ndt documentation and evaluation of the roman bridge of lugo using gpr and mobile and static lidar. J. Perform. Constr. Facil. 2015, 29, 06014004. [Google Scholar] [CrossRef]
- Francisco, C.; Gonçalves, L.; Gaspar, F.; Rodrigues, H.; Carracelas, M.S.; Luna, I.P.; Gonçalves, G.; Providência, P. Data acquisition in cultural heritage buildings using non-destructive techniques, and its gathering with bim—The case study of the gothic monastery of batalha in portugal. In Sustainability and Automation in Smart Constructions; Springer: Cham, Switzerland, 2021; pp. 59–68. [Google Scholar]
- Conde, B.; Ramos, L.F.; Oliveira, D.V.; Riveiro, B.; Solla, M. Structural assessment of masonry arch bridges by combination of non-destructive testing techniques and three-dimensional numerical modelling: Application to vilanova bridge. Eng. Struct. 2017, 148, 621–638. [Google Scholar] [CrossRef]
- Solla, M.; Lorenzo, H.; Rial, F.I.; Novo, A.; Riveiro, B. Masonry Arch Bridges Evaluation by Means of GPR; IEEE: New York, NY, USA, 2010; pp. 1–6. [Google Scholar]
- Liu, L.L.; Chen, I.M.; Kayacan, E.; Tiong, L.K.; Maruvanchery, V. Automated construction quality assessment: A review. In Proceedings of the International Symposium on Mechatronics and its Applications (ISMA), Sharjah, United Arab Emirates, 8–10 December 2015. [Google Scholar]
- Shim, C.S.; Dang, N.S.; Lon, S.; Jeon, C.H. Development of a bridge maintenance system for prestressed concrete bridges using 3D digital twin model. Struct. Infrastruct. Eng. 2019, 15, 1319–1332. [Google Scholar] [CrossRef]
- Duer, Z.; Ogle, T.; Hicks, D.; Fralin, S.; Tucker, T.; Yu, R. Making the invisible visible: Illuminating the hidden histories of the world war I tunnels at vauquois through a hybridized virtual reality exhibition. IEEE Comput. Graph. Appl. 2020, 40, 39–49. [Google Scholar] [CrossRef] [PubMed]
- Teizer, J.; Allread, B.S.; Mantripragada, U. Automating the blind spot measurement of construction equipment. Autom. Constr. 2010, 19, 491–501. [Google Scholar] [CrossRef]
- Cheng, T.; Teizer, J. Modeling tower crane operator visibility to minimize the risk of limited situational awareness. J. Comput. Civ. Eng. 2014, 28, 04014004. [Google Scholar] [CrossRef]
- Marks, E.D.; Cheng, T.; Teizer, J. Laser scanning for safe equipment design that increases operator visibility by measuring blind spots. J. Constr. Eng. Manag. 2013, 139, 1006–1014. [Google Scholar] [CrossRef]
- Kivrak, S.; Kia, F.R. A virtual blind spot identification system for construction projects. Sci. Iran. 2018, 25, 109–117. [Google Scholar] [CrossRef]
- Roca-Pardinas, J.; Arguelles-Fraga, R.; Lopez, F.D.A.; Ordonez, C. Analysis of the influence of range and angle of incidence of terrestrial laser scanning measurements on tunnel inspection. Tunn. Undergr. Space Technol. 2014, 43, 133–139. [Google Scholar] [CrossRef]
- Wang, J.; Kutterer, H.; Fang, X. External error modelling with combined model in terrestrial laser scanning. Surv. Rev. 2016, 47, 40–50. [Google Scholar] [CrossRef]
- Kerekes, G.; Schwieger, V. Elementary error model applied to terrestrial laser scanning measurements: Study case arch dam kops. Mathematics 2020, 8, 21. [Google Scholar] [CrossRef]
- Bolkas, D.; Martinez, A. Effect of target color and scanning geometry on terrestrial lidar point-cloud noise and plane fitting. J. Appl. Geod. 2018, 12, 109–127. [Google Scholar] [CrossRef]
- Muralikrishnan, B. Performance evaluation of terrestrial laser scanners—A review. Meas. Sci. Technol. 2021, 32, 072001. [Google Scholar] [CrossRef] [PubMed]
- Argüelles-Fraga, R.; Ordóñez, C.; García-Cortés, S.; Roca-Pardiñas, J. Measurement planning for circular cross-section tunnels using terrestrial laser scanning. Autom. Constr. 2013, 31, 1–9. [Google Scholar] [CrossRef]
- Cabo, C.; Ordóñez, C.; Argüelles-Fraga, R. An algorithm for optimizing terrestrial laser scanning in tunnels. Autom. Constr. 2017, 83, 163–168. [Google Scholar] [CrossRef]
- Aryan, A.; Bosche, F.; Tang, P. Planning for terrestrial laser scanning in construction: A review. Autom. Constr. 2021, 125, 103551. [Google Scholar] [CrossRef]
- Gautier, Q.K.; Garrison, T.G.; Rushton, F.; Bouck, N.; Lo, E.; Tueller, P.; Schurgers, C.; Kastner, R. Low-Cost 3D scanning systems for cultural heritage documentation. J. Cult. Herit. Manag. Sustain. Dev. 2020, 10, 437–455. [Google Scholar] [CrossRef]
- Chen, J.D.; Kira, Z.; Cho, Y.K. Deep learning approach to point cloud scene understanding for automated scan to 3D reconstruction. J. Comput. Civ. Eng. 2019, 33, 04019027. [Google Scholar] [CrossRef]
- Cheng, X.L.; Hu, X.H.; Tan, K.; Wang, L.W.; Yang, L.J. Automatic detection of shield tunnel leakages based on terrestrial mobile lidar intensity images using deep learning. IEEE Access 2021, 9, 55300–55310. [Google Scholar] [CrossRef]
- Huang, H.W.; Cheng, W.; Zhou, M.L.; Chen, J.Y.; Zhao, S. Towards automated 3D inspection of water leakages in shield tunnel linings using mobile laser scanning data. Sensors 2020, 20, 6669. [Google Scholar] [CrossRef] [PubMed]
- Luo, C.L.; Sha, H.; Ling, C.L.; Li, J.Y. Intelligent detection for tunnel shotcrete spray using deep learning and lidar. IEEE Access 2020, 8, 1755–1766. [Google Scholar] [CrossRef]


| Distance Measuring Methods | Typical Products | Maximum Range (m) | Scan Speed (pts/s) | Ranging Accuracy |
|---|---|---|---|---|
| Time-of-flight | Riegl VZ-400i | 800 | 500,000 | 5 mm @ 100 m |
| Topcon GLS-2000 | 500 | 120,000 | 3.5 mm @ 150 m | |
| Phase-based | Faro FocusS 150 | 150 | 976,000 | 1 mm @ 25 m |
| Z+F IMAGER 5016 | 365 | 1,100,000 | 1.6 mm @ 100 m |
| Keywords | Count | Centrality | Year |
|---|---|---|---|
| Construction industry | 334 | 0.13 | 2010 |
| Terrestrial laser scanning | 155 | 0.08 | 2009 |
| Building information modeling | 144 | 0.17 | 2012 |
| Point cloud | 117 | 0.12 | 2012 |
| Data processing | 87 | 0.20 | 2012 |
| Deformation monitoring | 87 | 0.18 | 2011 |
| Information technology | 64 | 0.37 | 2012 |
| Progress monitoring | 40 | 0.17 | 2013 |
| Finite element model | 33 | 0.23 | 2014 |
| Quality control | 32 | 0.14 | 2012 |
| Cited References | Count | Centrality | Year |
|---|---|---|---|
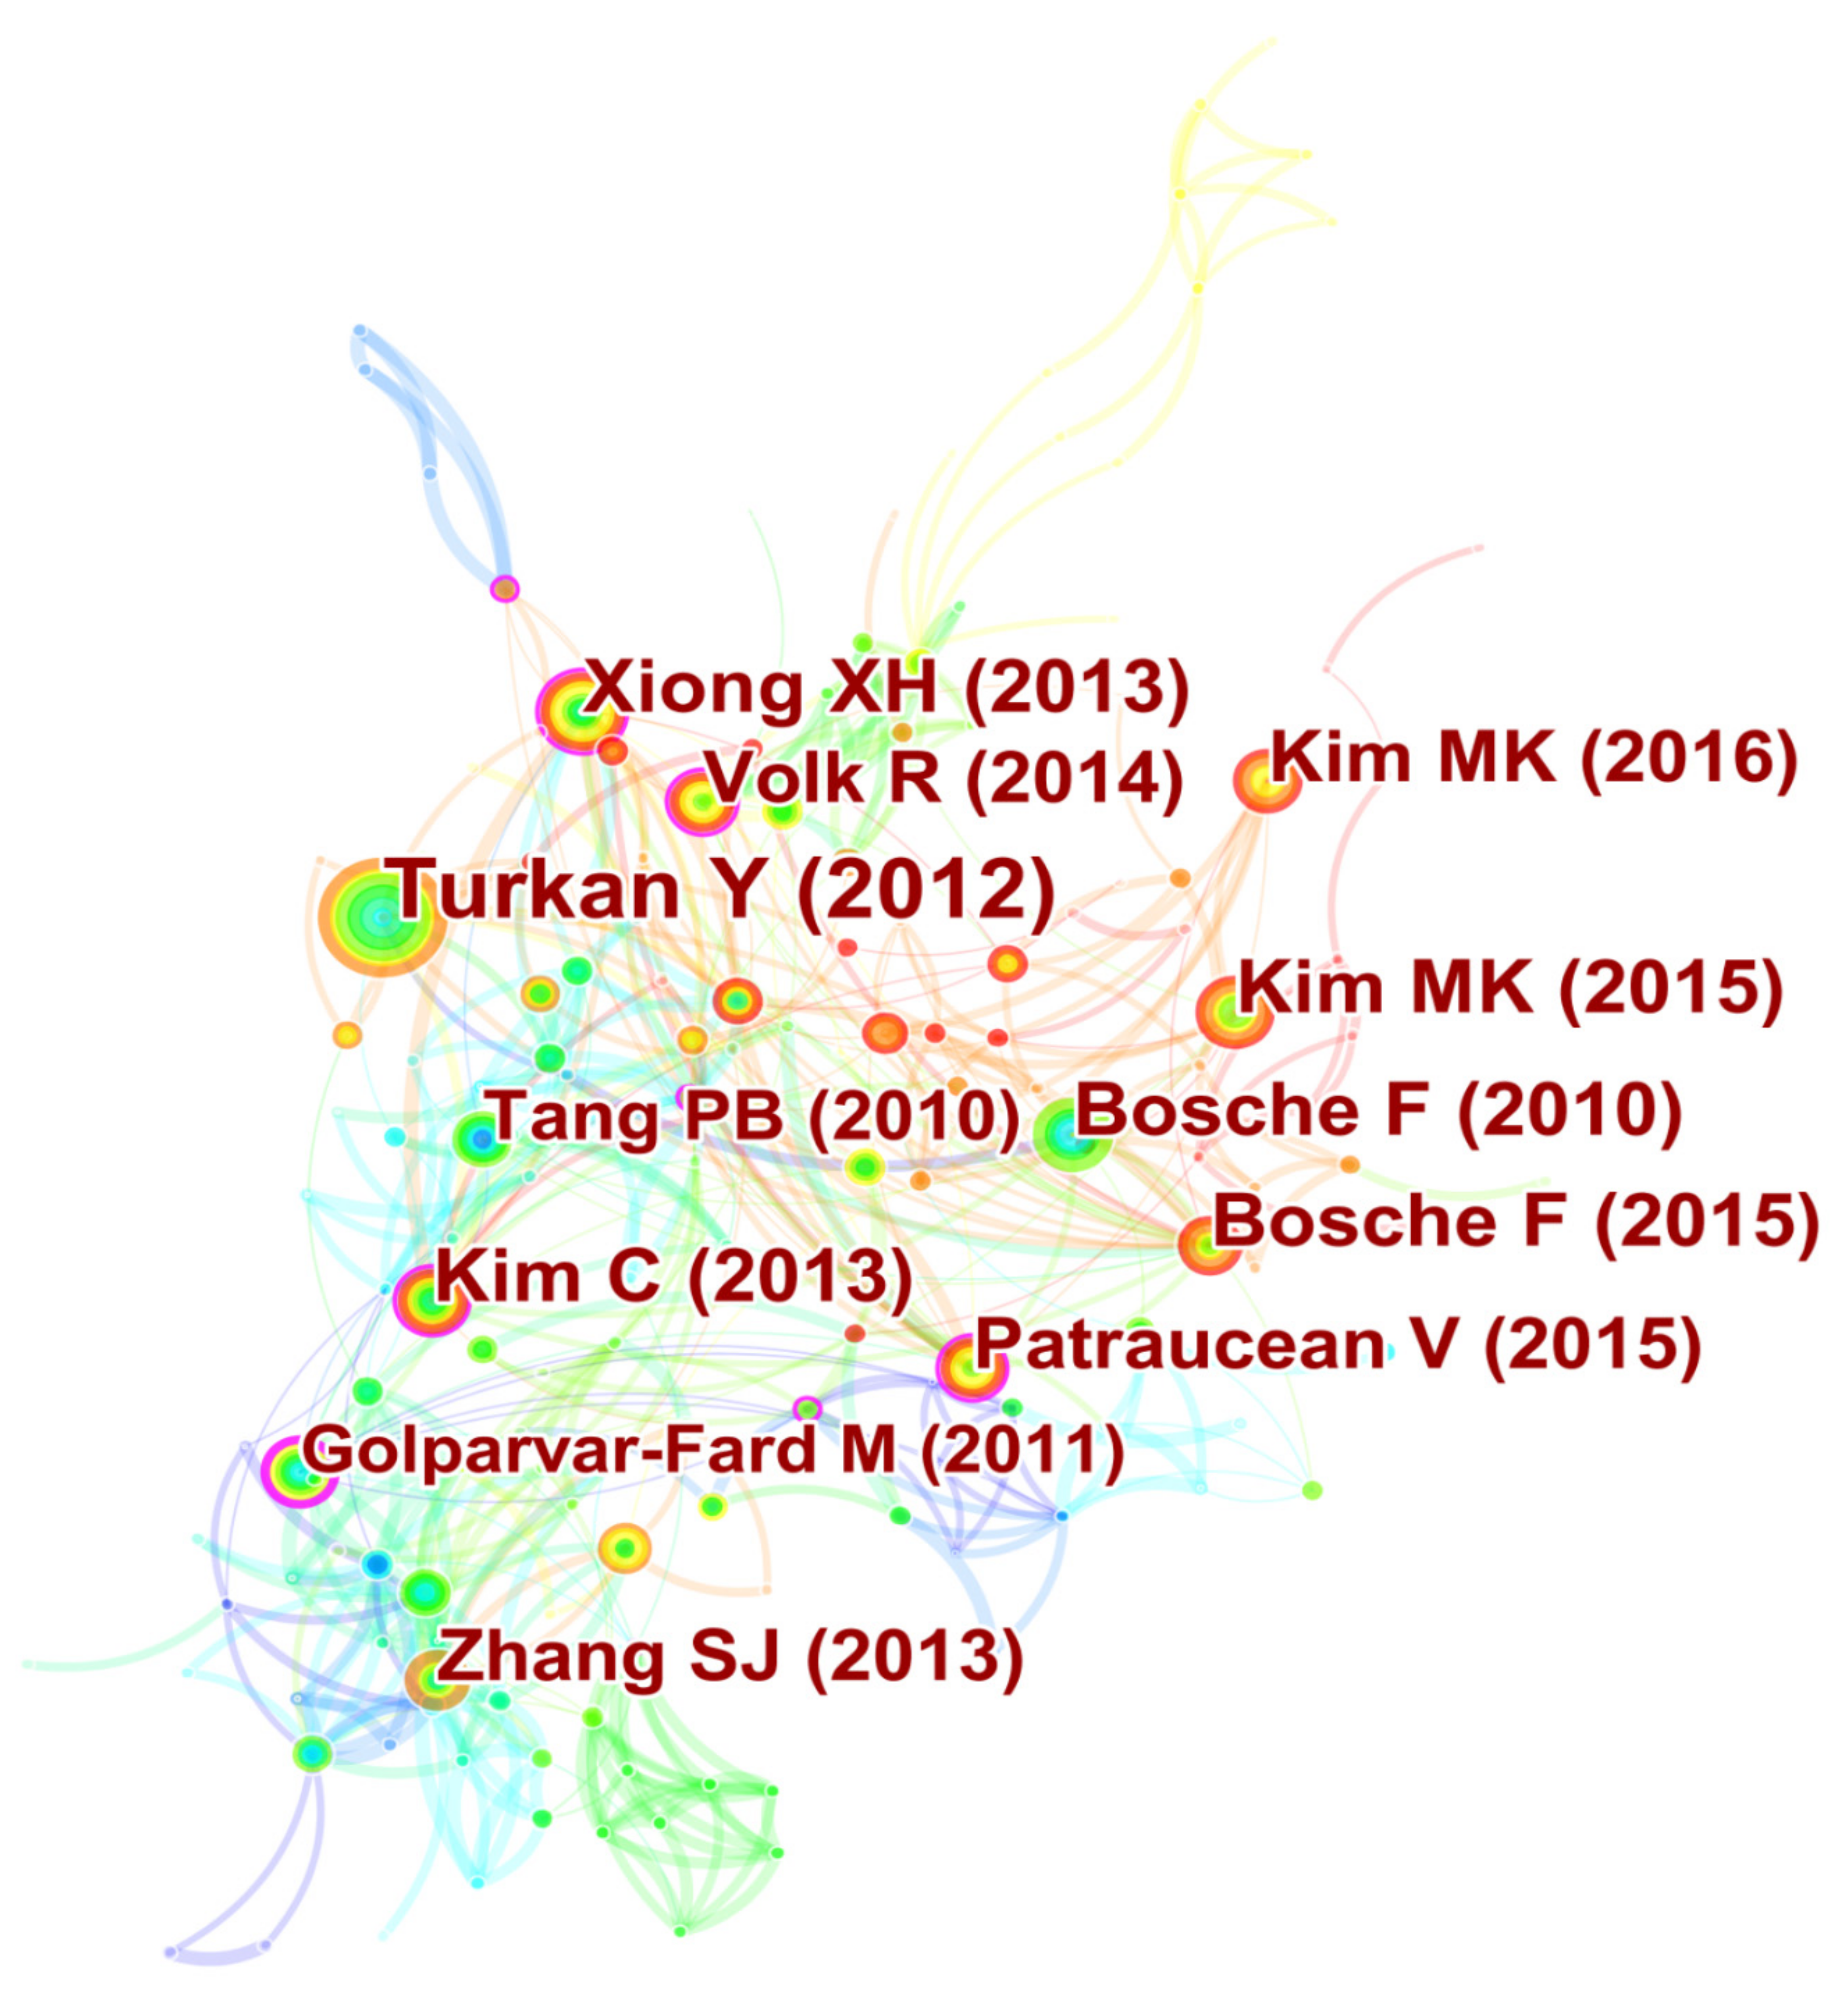
| Turkan Y [42] | 57 | 0.06 | 2012 |
| Xiong XH [46] | 37 | 0.16 | 2013 |
| Bosche F [47] | 37 | 0.07 | 2010 |
| Kim C [48] | 36 | 0.11 | 2013 |
| Kim MK [45] | 35 | 0.08 | 2015 |
| Bosche F [43] | 35 | 0.08 | 2015 |
| Cited References | Centrality | Count | Year |
|---|---|---|---|
| Golparvar-Fard M [39] | 0.27 | 25 | 2011 |
| Xiong XH [46] | 0.16 | 37 | 2013 |
| Volk R [40] | 0.13 | 33 | 2014 |
| Patraucean V [41] | 0.13 | 32 | 2015 |
| Fekete S [28] | 0.12 | 11 | 2010 |
| Applications | References | |
|---|---|---|
| 3D model reconstruction (MR) | BIM | [49,50,51,52,53,54,55,56,57,58,59,60,61,62,63,64,65,66,67,68,69,70,71,72,73,74,75,76,77,78,79] |
| FEM | [74,80,81,82,83,84,85,86] | |
| DEM | [87] | |
| object recognition (OR) | [42,44,47,57,68,70,75,78,88,89,90,91,92,93,94,95,96,97,98] | |
| deformation measurement (DM) | [52,59,80,84,85,99,100,101,102,103,104,105,106,107,108,109,110,111,112,113,114,115,116,117,118,119,120,121,122,123,124,125,126,127,128,129,130,131,132,133,134,135,136,137,138,139,140,141,142,143,144,145] | |
| quality assessment (QA) | construction quality Management | [74,131,146,147,148,149,150,151] |
| dimensional quality inspection | [45,47,56,64,66,71,79,92,152,153,154,155,156,157] | |
| surface quality inspection | [44,45,64,71,75,89,98,99,104,158,159,160,161,162,163,164,165,166,167,168,169,170,171,172,173,174,175] | |
| progress tracking (PT) | [42,53,54,88,92,176,177,178] | |
| Technology | Tools | Range (In General) | Accuracy (In General) | Cost (In General) |
|---|---|---|---|---|
| Laser scanning | TLS | Moderate | 0.5–10 mm | High |
| ALS | Long | >10 mm | High | |
| MLS | Moderate | >10 mm | High | |
| Photogrammetry | Smartphone-based | Close | >10 mm | Low |
| UAV-based | Moderate | >10 mm | Moderate | |
| Videogrammetry | Smartphone-based | Close | >10 mm | Low |
Publisher’s Note: MDPI stays neutral with regard to jurisdictional claims in published maps and institutional affiliations. |
© 2021 by the authors. Licensee MDPI, Basel, Switzerland. This article is an open access article distributed under the terms and conditions of the Creative Commons Attribution (CC BY) license (https://creativecommons.org/licenses/by/4.0/).
Share and Cite
Wu, C.; Yuan, Y.; Tang, Y.; Tian, B. Application of Terrestrial Laser Scanning (TLS) in the Architecture, Engineering and Construction (AEC) Industry. Sensors 2022, 22, 265. https://doi.org/10.3390/s22010265
Wu C, Yuan Y, Tang Y, Tian B. Application of Terrestrial Laser Scanning (TLS) in the Architecture, Engineering and Construction (AEC) Industry. Sensors. 2022; 22(1):265. https://doi.org/10.3390/s22010265
Chicago/Turabian StyleWu, Chao, Yongbo Yuan, Yang Tang, and Boquan Tian. 2022. "Application of Terrestrial Laser Scanning (TLS) in the Architecture, Engineering and Construction (AEC) Industry" Sensors 22, no. 1: 265. https://doi.org/10.3390/s22010265
APA StyleWu, C., Yuan, Y., Tang, Y., & Tian, B. (2022). Application of Terrestrial Laser Scanning (TLS) in the Architecture, Engineering and Construction (AEC) Industry. Sensors, 22(1), 265. https://doi.org/10.3390/s22010265