Article

Advanced Feature Extraction and Selection Approach Using Deep Learning and Aquila Optimizer for IoT Intrusion Detection System

by
Abdulaziz Fatani
1,2,
Abdelghani Dahou
3,
Mohammed A. A. Al-qaness
4,5,*,
Songfeng Lu
6,7,* and
Mohamed Abd Elaziz
8,9,10
1
School of Computer Science and Technology, Huazhong University of Science and Technology, Wuhan 430074, China
2
Computer Science Department, Umm Al-Qura University, Makkah 24381, Saudi Arabia
3
LDDI Laboratory, Faculty of Science and Technology, University of Ahmed DRAIA, Adrar 01000, Algeria
4
Faculty of Engineering, Sana’a University, Sana’a 12544, Yemen
5
State Key Laboratory for Information Engineering in Surveying, Mapping and Remote Sensing, Wuhan University, Wuhan 430079, China
6
School of Cyber Science & Engineering, Huazhong University of Science and Technology, Wuhan 430074, China
7
Shenzhen Huazhong University of Science and Technology Research Institute, Shenzhen 518057, China
8
Department of Mathematics, Faculty of Science, Zagazig University, Zagazig 44519, Egypt
9
Artificial Intelligence Research Center (AIRC), Ajman University, Ajman 346, United Arab Emirates
10
Faculty of Computer Science & Engineering, Galala University, Suze 435611, Egypt
*
Authors to whom correspondence should be addressed.
Sensors 2022, 22(1), 140; https://doi.org/10.3390/s22010140
Submission received: 27 November 2021 / Revised: 16 December 2021 / Accepted: 20 December 2021 / Published: 26 December 2021

Abstract

:
Developing cyber security is very necessary and has attracted considerable attention from academy and industry organizations worldwide. It is also very necessary to provide sustainable computing for the the Internet of Things (IoT). Machine learning techniques play a vital role in the cybersecurity of the IoT for intrusion detection and malicious identification. Thus, in this study, we develop new feature extraction and selection methods and for the IDS system using the advantages of the swarm intelligence (SI) algorithms. We design a feature extraction mechanism depending on the conventional neural networks (CNN). After that, we present an alternative feature selection (FS) approach using the recently developed SI algorithm, Aquila optimizer (AQU). Moreover, to assess the quality of the developed IDS approach, four well-known public datasets, CIC2017, NSL-KDD, BoT-IoT, and KDD99, were used. We also considered extensive comparisons to other optimization methods to verify the competitive performance of the developed method. The results show the high performance of the developed approach using different evaluation indicators.

1. Introduction

Internet applications help people and society in many fields, including teaching, electronic commerce (EC), electronic learning, entertainment, electronic communication, and others [1]. Along with these applications, cybersecurity issues have been raised due to the vulnerability of the internet applications due to the wide expansion of the networks and the massive emergence of malicious intrusion [1]. Therefore, building security systems is very necessary, and many industrial and academic organizations have developed different systems and solutions. Intrusion detection systems (IDS) are very important for the cybersecurity of the internet of things (IoT) architecture, including also cloud and fog computing.
Previously, different methods have been developed for intrusion detection systems (IDS) using traditional machine learning methods, such as k-means clustering [2,3], decision tree (DT) [4,5], k-nearest neighbor (kNN) [6,7], support vector machine (SVM) [8,9], and other traditional machine learning (ML) approaches. With the wide spread of the deep learning methods, in recent years thy are also adopted for IDS, such as multi-layered perceptron neural network [10], convolutional neural networks (CNN) [11], and deep recurrent neural network (RNN) [12]. However, deep leaning approaches required big size of features to achieve high classification accuracy rates.
Feature selection (FS) is a necessary preprocessing step in ML applications [13]. In literature, there are different approaches proposed for IDS by improving new FS methods that boosted the efficiency of the IDS. For example, grey wolf optimizer (GWO) [14,15], crow search algorithm (CSA) [16], genetic algorithm (GA) [17,18,19], whale optimization algorithm [20], random harmony search (RHS) [21], and also the well-known, particle swarm optimization (PSO) [22]. Although these approaches showed significant performance, they suffer from certain limitations. For instance, some of them may be stuck at local optima, which degrades the convergence rate and finally on the quality of find decision.
In the current study, we present an alternative FS approach for IDS using a recently proposed optimization algorithm called Aquila optimizer (AQU). The AQU was developed by Abualigah et al. [23], which mimics the behaviors of Aquila in nature. It was assessed with different engineering and optimization problems, and it illustrated competitive performance compared to traditional optimization algorithms. The AQU also received wide attention, as it was adopted to solve different problems, such as industrial engineering optimization problems [24], medical image processing [25], and others [26]. The traditional AQU suffers from slow convergence; thus, we use the binary version to boost its performance.
In this study, we first apply a light feature extraction approach based on CNN to obtain features from the used datasets. Thereafter, the developed AQU algorithm is utilized to select a subset of the optimal features that reflect the characteristics of the datasets. We use four public benchmark datasets including BoT-IoT, NSL-KDD, CIC2017, and KDD99, to evaluate the developed approach, which showed significant performance. In short, the contribution presented in this paper can be summarized as follows:
  • Using the combination of deep learning and Aquila optimizer (AQU) to enhance IoT security.
  • A feature extractor technique based on CNN is applied to extract relevant features from the datasets,
  • A binary version of the Aquila optimizer is adopted as an FS technique that is used to select optimal features and enhance the classification accuracy.
  • Extensive evaluation is carried out with four public datasets and extensive comparisons to other methods to confirm the quality of the developed approach.
The remaining parts of this paper are presented as: Section 2 summarizes several related studies presented in recent years. The basics of the used methods are described in Section 3, whereas the presented IoT approach is introduced in Section 4. Moreover, the evaluation experiments and results outcomes are described in Section 5. Section 6 presents the conclusion and future work.

2. Related Works

In this section, we summarize a number of previous approaches proposed for IDS in IoT and cloud. Shafiq et al. [27] presented an efficient feature selection technique for IoT malicious traffic identification using the Bot-IoT dataset. They used the objective soft set for feature extraction, and they developed a new feature selection method called, CorrACC. Haddadpajouh et al. [28] applied gray wolves optimization (GWO) to improve the multi-kernel SVM for IoT cloud-edge gateway malware detection. GWO is utilized as an FS method which enhanced the classification accuracy. It was evaluated and compared to previous methods, and it reached good results. A  wrapper-based FS method called, CorrAUC was developed by [29] for malicious traffic detection for IoT environments, using Bot-IoT datasets. This method was tested with four machine learning algorithms, and it showed significant performance in reducing feature seize and boosting classification accuracy. Davahli et al. [30] presented a hybrid FS technique using GWO and GA algorithms. This method was employed with the SVM classifier to detect anomalies in wireless sensor networks (WSNs). Mafarja et al. [31] developed a new wrapper feature selection method using an augmented Whale Optimization Algorithm (WOA) for IoT attacks identification. The augmented WOA was employed to handle the high dimensionality of the datasets and to enhance the classification accuracy. They used two transfer functions, S-shaped and V-shaped, into the WOA to boost its performance. The enhanced WOA showed better performance compared to the traditional WOA. Sekhar et al. [32] developed an IDS approach based on Fruitfly optimization with deep Autoencoder. They used fuzzy C-Means rough parameters for data processing to deal with the missing data from the used datasets. After that, the robust features can be extracted from Autoencoder with multi-hidden layers. Then, the extracted features are fed to the BPN (Back Propagation Neural Network) for attacks classification. The Fruitfly optimization algorithm is used to optimize the neurons in the Deep Autoencoder hidden layers. This method was evaluated with UNSW-NB15 and NSL-KDD datasets, and it showed competitive performance. Dwivedi [33] presented an alternative FS approach depending on the grasshopper optimization algorithm (GOA) for IDS. The main goal of this approach is to integrate GOA with the integration of ensemble feature selection (EFS) and creating a new method called EFSGOA. The EFS is used to rank the features to select the relevant features, and then the GOA is used for identifying the significant features. This approach was tested with KDD Cup 99 and NSL-KDD datasets, and it obtained high accuracy rates. Kan et al. [34] used the adaptive PSO and CNN for IDS in the IoT network. In this method, APSO-CNN is working by optimizing one-dimensional CNN structure parameters using the PSO algorithm. It was tested with comparison to other CNN-based methods, and the outcomes showed that the application of PSO has a significant impact on the performance of the CNN. The PSO was also adopted in other IDS systems, such as [35,36,37,38].

3. Background

Aquila Optimizer (AQU)

This section introduces the basic formulation of the Aquila Optimizer (AQU) [23]. In general, the AQU algorithm mimics Aquila’s social behavior in order to catch its prey. AQU is a population-based optimization technique, similar to other metaheuristic (MH) techniques, that begins by forming an initial population X with N agents. The following equation was used to carry out this procedure.
X i j = r 1 × ( U B j L B j ) + L B j , i = 1 , 2 , . . . . . , N j = 1 , 2 , , D i m
In Equation (1), U B j and L B j represent limits of the search space. r 1 [ 0 , 1 ] denotes a random value and D i m is the dimension of agent.
The AQU technique’s next step is to do either exploration or exploitation until the best solution is found. There are two ways for exploration and exploitation, according to [23].
The best agent X b and the average of agents ( X M ) are employed in the exploration, and its mathematical formulation is given as:
X i ( t + 1 ) = X b ( t ) × 1 t T + ( X M ( t ) X b ( t ) r a n d ) ,
X M ( t ) = 1 N i = 1 N X ( t ) , j = 1 , 2 , , D i m
The search during the exploration phase is controlled by 1 t T in Equation (2). The maximum number of generations is denoted by T.
The exploration phase employs the Levy flight ( L e v y ( D ) distribution and X b to update the solutions, and this is represented as:
X i ( t + 1 ) = X b ( t ) × L e v y ( D ) + X R ( t ) + ( y x ) r a n d ,
L e v y ( D ) = s × u × σ | υ | 1 β , σ = Γ ( 1 + β ) × s i n e ( π β 2 ) Γ ( 1 + β 2 ) × β × 2 ( β 1 2 )
In Equation (5), s = 0.01 and β = 1.5 . u and υ denotes the random values. X R stands for randomly chosen agent. In addition, y and x stands for two parameters used to simulate the spiral shape:
y = r × c o s ( θ ) , x = r × s i n ( θ )
r = r 1 + U × D 1 , θ = ω × D 1 + θ 1 , θ 1 = 3 × π 2
In Equation (7), ω = 0.005 and U = 0.00565 . r 1 [ 0 , 20 ] refers to a random value.
The first technique used in [23] to enhance the agents in the exploitation phase depends on X b and X M , similar to exploration, and it is formulated as:
X i ( t + 1 ) = ( X b ( t ) X M ( t ) ) × α r n d + ( U B × r n d + L B ) × δ
In Equation (8), U B = ( U B L B ) , α and δ stands for the exploitation adjustment parameters. r n d [ 0 , 1 ] is random value.
The agent can be updated using X b , L e v y , and the quality function Q F in the second exploitation strategy. This strategy’s mathematical definition is as follows:
X i ( t + 1 ) = Q F × X b ( t ) G X G 2 × L e v y ( D ) + r n d × G 1
G X = ( G 1 × X ( t ) × r n d )
Q F ( t ) = t 2 × r n d ( ) 1 ( 1 T ) 2
In addition, G 1 stands for the motions used to track the optimal individual solution, as seen in the following equation:
G 1 = 2 × r n d ( ) 1 , G 2 = 2 × ( 1 t T )
In Equation (11), r n d is a random value. Moreover, G 2 stands for parameter which decreasing from 2 to 0, and it is updated as:
G 2 = 2 × ( 1 t T )

4. Proposed Model

Figure 1 depicts the structure of an IDS security scheme for IoT systems. The suggested system is divided into two phases: a feature extraction phase using an efficient CNN based method and a feature selection phase based on the developed AQU algorithm. The presented AQU is based on improving the behavior of classical AQU to make it suitable for the FS problem by implementing its binary version. In the following sections, a description of each stage of the developed IoT security model is given.

4.1. Representation of Collect IoT Dataset

The fundamental representation of IoT traffic data that will be employed as input to the next stage of the proposed approach is presented in this section. Consider T S , which is a sample of IoT traffic and is written as:
T S = t f 11 t f 12 . . . t f 1 d t f 21 t f 22 . . . t f 2 d . . . . . . . . . . . . t f n 1 t f n 2 . . . t f n d
In Equation (15), T S i denotes the ith set of features of traffic (i.e., [ t f 11 , t f 12 m , t f 1 d ] ). d and n are the number of features and samples respectively. Thereafter, the dataset is normalized based on the minmax approach that defined:
D N i j = t f i j m i n ( T S j ) m a x ( T S j ) m i n ( T S j )
where t f i j stands for the jth feature of sample i.
Therefore, the normalization of TS is formulated as:
N T S = D N 11 D N 12 . . . D N 1 d D N 21 D N 22 . . . D N 2 d . . . . . . . . . . . . D N n 1 D N n 2 . . . D N n d
The next step is to extract the feature using DL model from N T S . The following process of extracting the feature using DL is given in the following section.

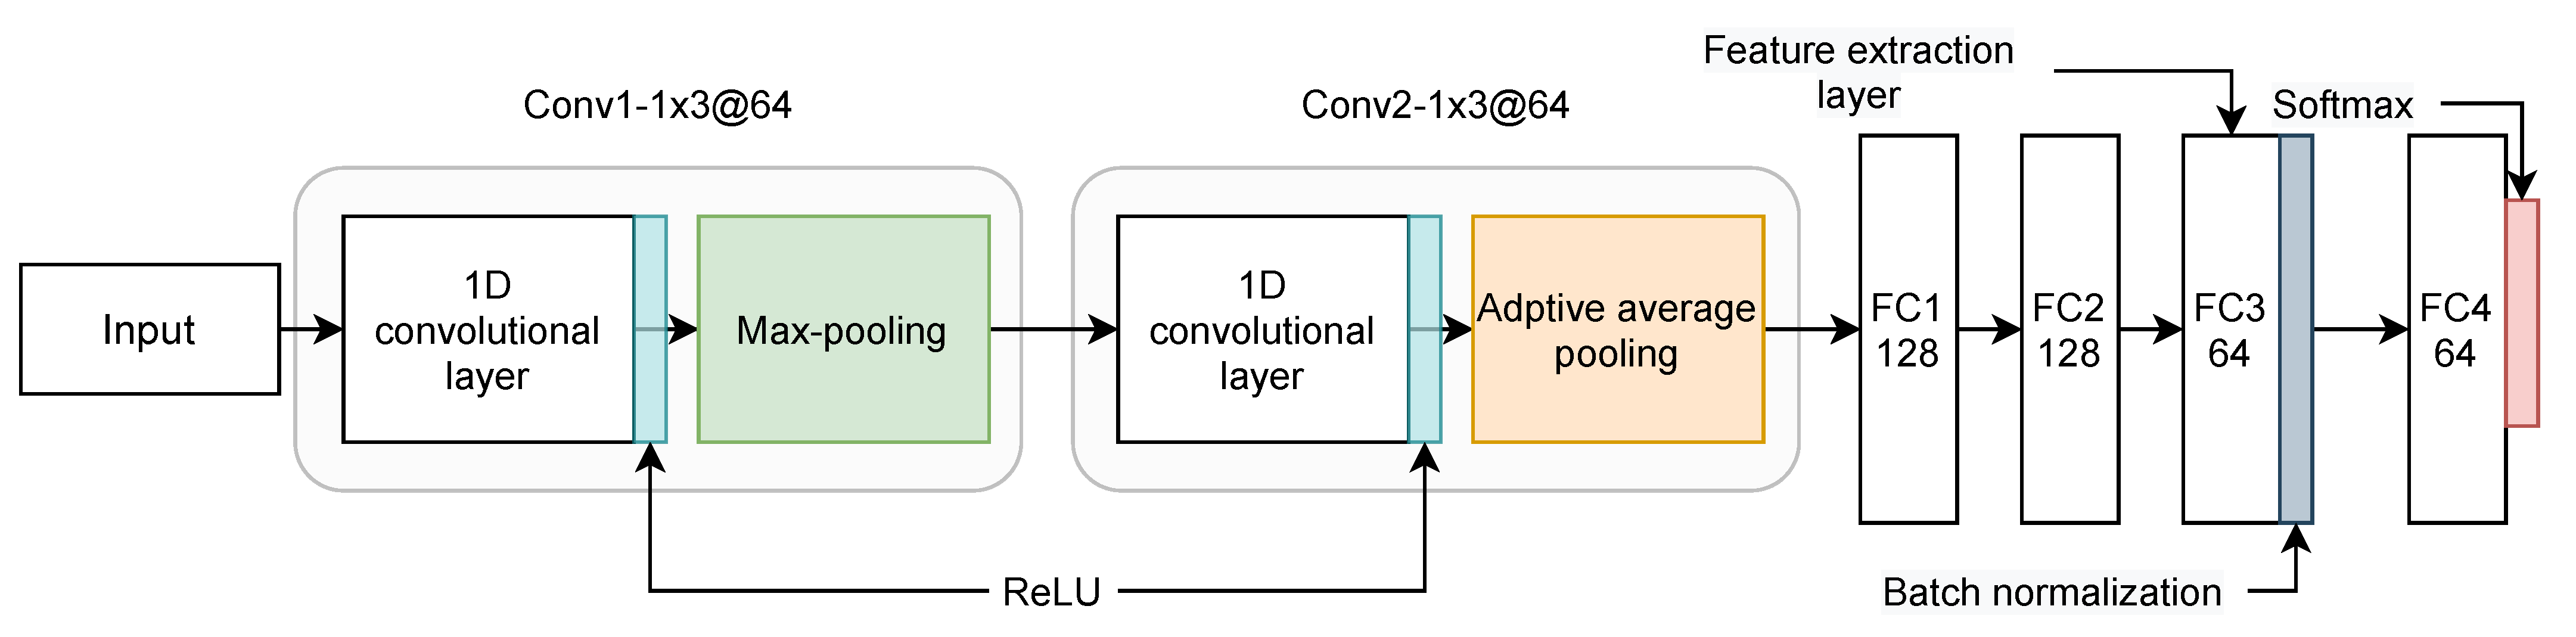
4.2. Convolutional Neural Network for Feature Extraction

Convolutional neural networks are well-known deep learning (DL) models applied to solve different problems in image classification, text classification, speech recognition, and object detection. CNN’s are commonly used in computer vision problems. However, CNN’s can be extended and employed in research fields tackling natural language processing [39,40,41], image processing [42,43], green computing [44,45], remote sensing [46,47], and others [48]. Unlike traditional machine learning algorithms that rely on handcrafted feature extraction, CNNs can automatically learn and represent complex features. Meanwhile, CNN’s based models can vary in terms of the type and number of convolution layers, kernel size and its initialization technique, pooling operation, and the fully connected layers.
At this stage, the main objective is to learn meaningful representations from the raw data, which helps maximize the overall framework’s recognition accuracy. After the learning phase using the CNN model, the feature selection algorithm is used to filter the extracted features by selecting the most important features only that maximize the classification accuracy. The CNNs are characterized by a core ability that shares weights between multiple layers to minimize the model complexity [49]. The proposed CNN architecture is illustrated in Figure 2, and it is composed of the following layers: (2) Convolutional layers (Conv), (2) Pooling layers, and (4) Fully connected layers (FC). The full network can be summarized as ( C o n v 1 1 × 3 @ 64 ) ( C o n v 2 1 × 3 @ 64 ) ( F C 1 128 ) ( F C 2 128 ) ( F C 3 64 ) ( B N 64 ) ( F C 4 64 ) where: (1) Conv1 is the first convolutional layer with 64 filters, kernel of size 3, stride of size 1. Conv1 uses the rectified linear unit (ReLU) [50] as a non-linear function followed by a dropout regularization with a rate equal to 0.5 and a max-pooling operation of size 2, (2) Conv2 is the second convolutional layer similar to Conv1 with the only difference is the usage of an adaptive average pooling layer [51] instead of max-pooling, (3) FC1, FC2, and FC3 are fully connected layer having 128, 128 and 64 neurons, respectively. FC1, FC2, and FC3 are used as feature extraction layers to output the learned features from the raw input, (4) BN stands for batch normalization operation, and (4) FC4 is the final FC layer to output the classification predictions.
The network uses a 1D convolution operation in each convolution layer to learn the raw data activation maps after applying a fixed kernel of size 1 × 3 and then uses a max-pooling operation to extract the most relevant features. The convolution operation can be represented as:
X j l = i M j x j l 1 k i j l + b j l
where x j l 1 is the output activation map of the previous layer l 1 . k i j l represents the kernel weights while b j l represents the bias value.
To learn complex feature representations from the input data, a non-linear function is applied in the convolution operation, which can be defined as in the following equation:
x j l = R e L U ( X j l )
where the l and j stands for the l layer and the j channel, respectively. The  x j l is the activation map extracted from the l layer. The ReLU function is introduced in Equation (18).
R e L U ( z ) = max ( 0 , z )
The final feature representation of each input sample is obtained after pooling together the generated activation maps. Two types of pooling operations have been employed in this architecture to extract the most relevant features and down-sampling the features space and learning parameters which helps the model train faster.
The final output from Conv2 is fed to a series of fully connected layers where FC3 is used to extract the features (input samples embeddings). The final output from FC3 is fed to FC4 which output the classification results. FC4 applies a Softmax function to generate the probabilities of an input sample to belong to a specific class. Batch normalization (BN) and dropout regularization techniques are used to overcome the network over-fitting and improve the training speed and convergence.

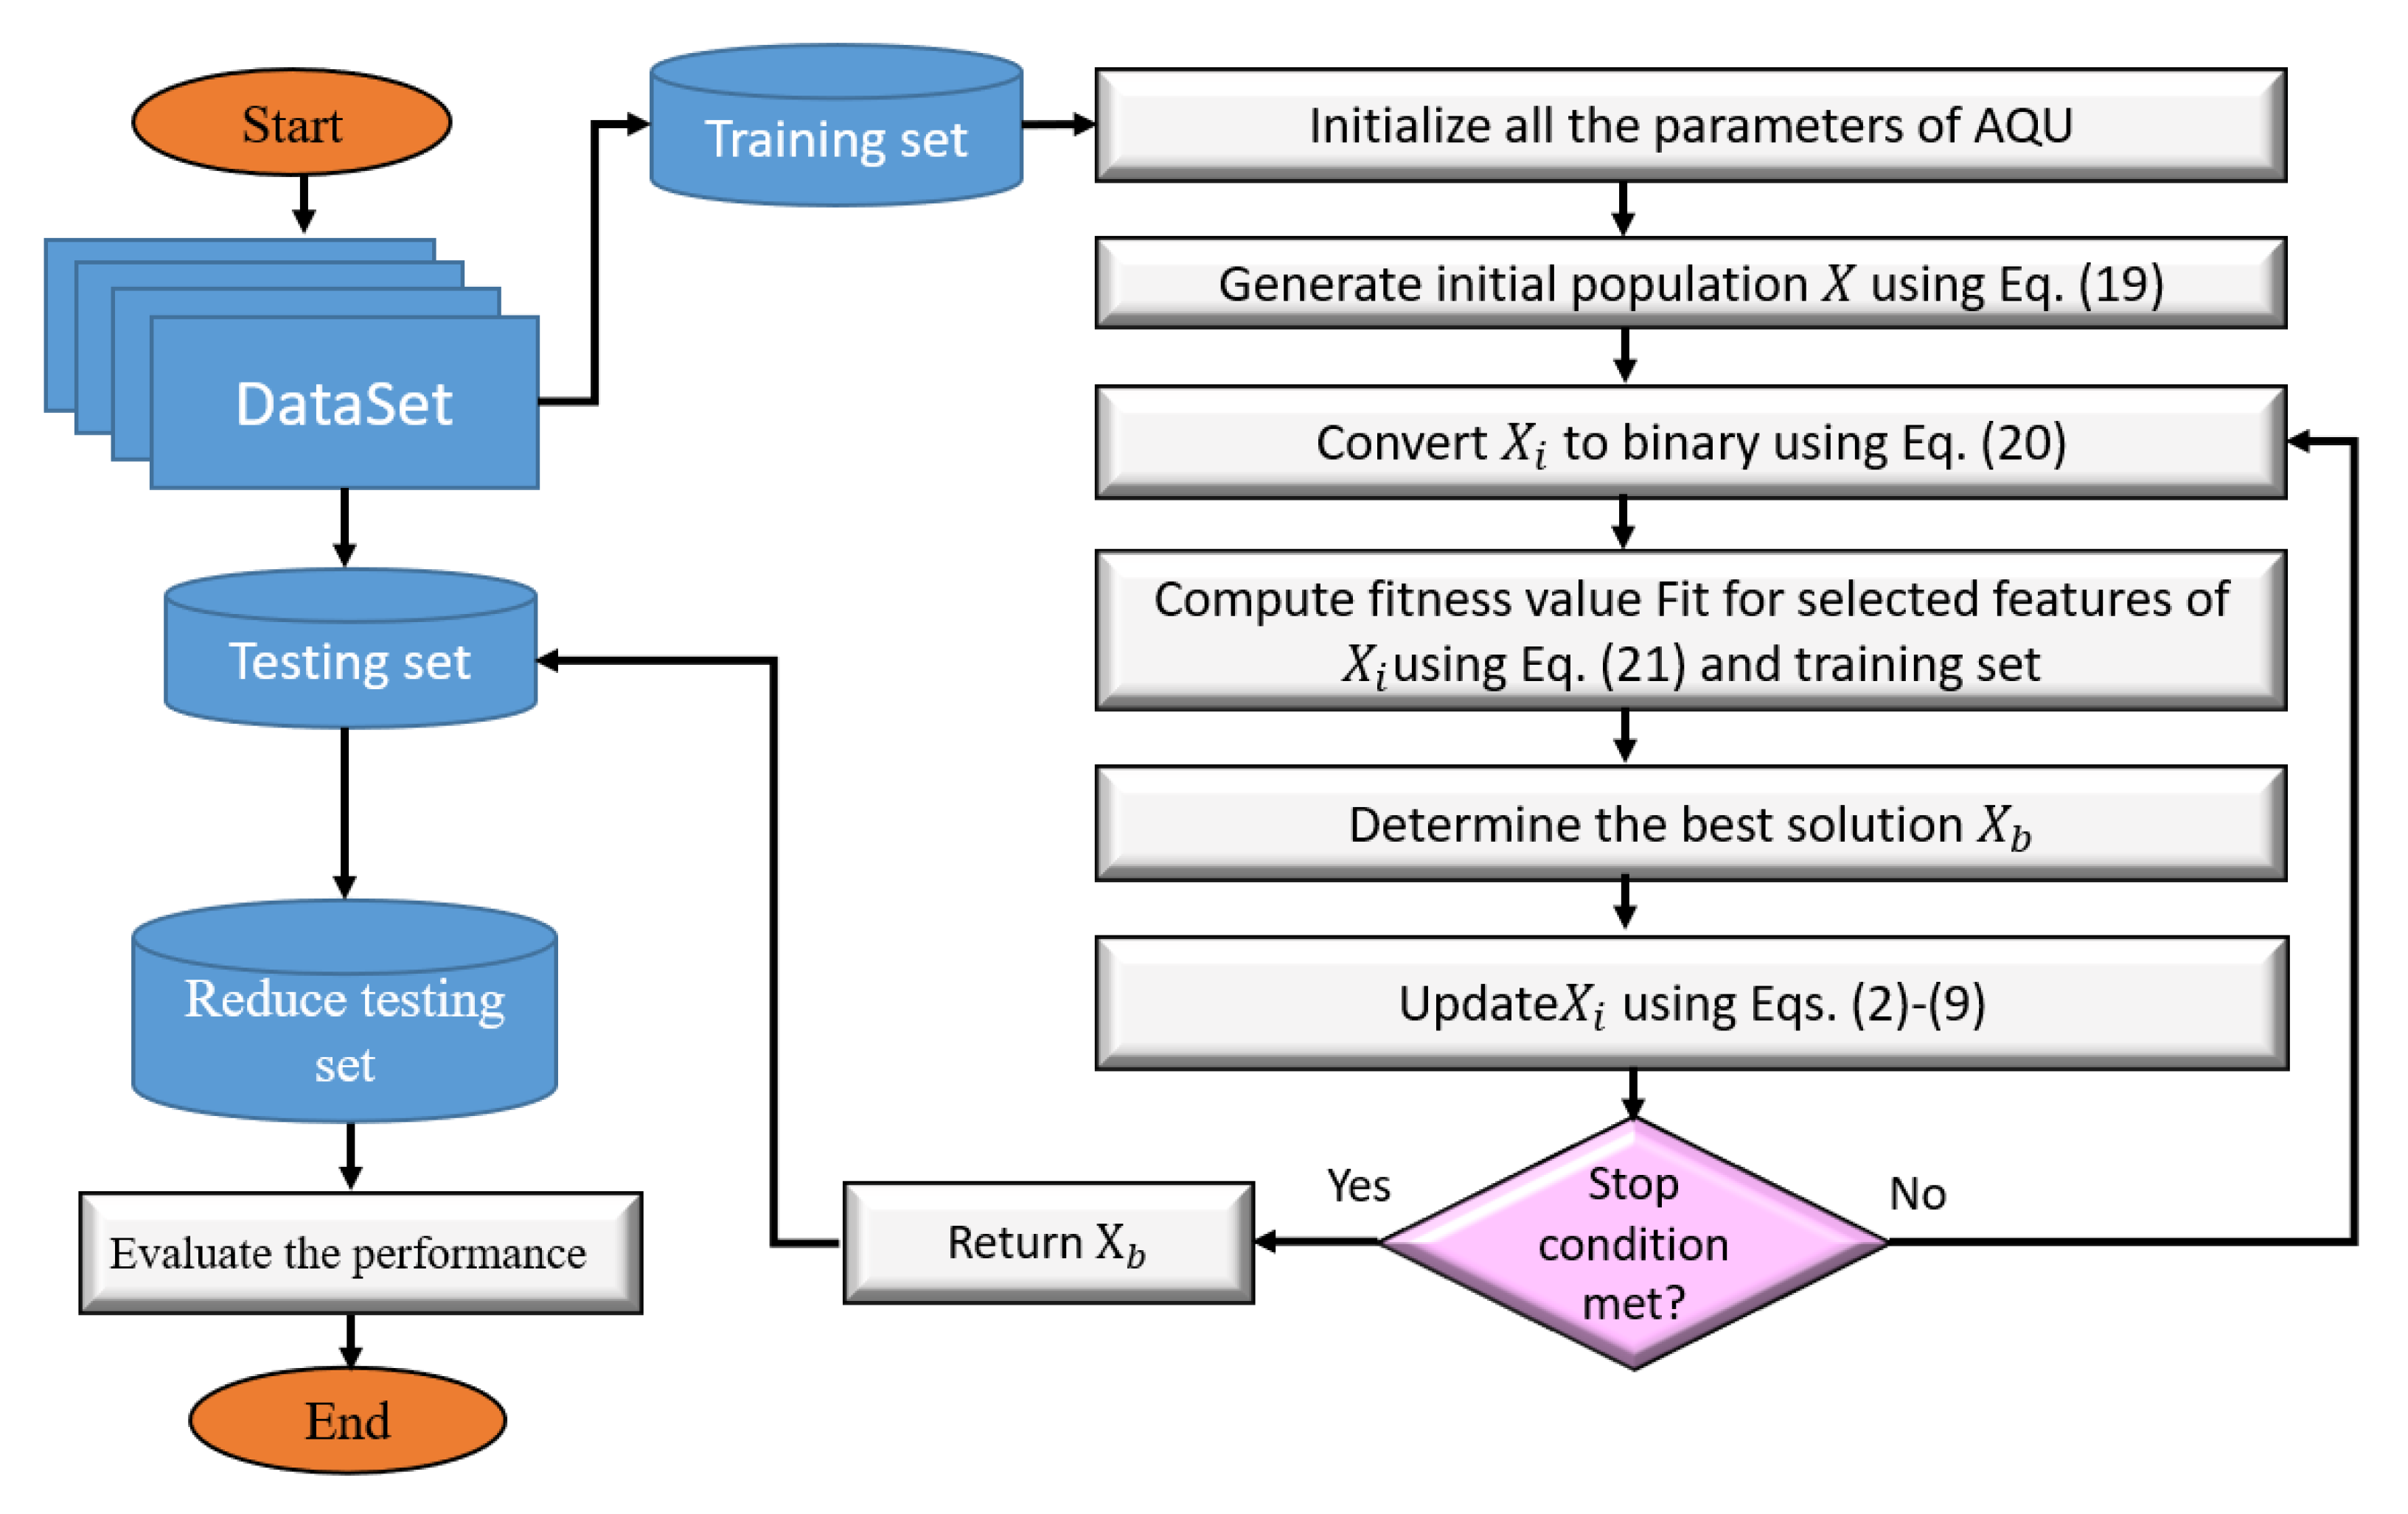
4.3. Feature Selection

The steps of the presented FS model (as in Figure 3) that are used to enhance the security in IoT environment are discussed in this section. In general, the main objective of these steps is to determine the important features that are chosen based on their quality. This is accomplished by the usage of a binary version of AQU. The presented FS approach, named AQU, begins by creating X initial population of N agents; after that, reducing the training data by selecting only the features that correspond to ones in the Boolean version of the current solution. The efficiency of the determined feature is then calculated using the KNN classifier’s error classification. Following that, the best agent with the smallest fitness value is assigned. The agents in the current population are updated based on this best agent and the AQU until they find the best solution.

4.3.1. Generation Initial Population

The presented AQU begins by splitting the tested benchmark data into 80% and 20% training and testing sets, respectively. The beginning population X that consists of N solutions is formed using Equation (19).
X i = L B + r a n d ( 1 , D ) × ( U B L B )
In Equation (19), D stands for the number of features. r a n d ( 1 , D ) represents a random vector with D values. L B and U B stand for the boundaries of the search space.

4.3.2. Updating Population

This stage starts with Equation (20) turning X i , i = 1 , 2 , , N into its Boolean value  B X i .
B X i j = 1 i f X i j > 0.5 0 o t h e r w i s e
Based on the output of Equation (20), the number of feature selection is reduced by ignoring the irrelevant features that corresponding zeros value in B X i . Then the fitness value is computed using Equation (21).
F i t i = λ × γ i + ( 1 λ ) × ( | B X i | D )
where λ [ 0 , 1 ] stands for the weights applied to control the balancing between the ratio of relevant features ( | B X i | D ) and error of classification γ i . In this study, the  γ i is computed based on the KNN classifier using the training set.
Thereafter, the best F i t and its corresponding agent X b (i.e., the best one) are determined. Then update the current agents with operators of AQU as discussed in Section 4.

4.3.3. Terminal Criteria

The stopping conditions are reviewed at this stage, and the updated stage is conducted again when these conditions are not met. Otherwise, the learning process is terminated, and  X b using as the output that is utilized to minimize the testing set in the next stage.

4.3.4. Validation Stage

To evaluate the presented AQU’s efficiency as an FS approach, the features of the testing set are reduced based on the binary of X b . Then several performance measures based on the decreased features are employed to compute the quality of the classification process. Algorithm 1 presents the whole description of the presented IoT technique to identify the intrusion.
Algorithm 1 Proposed FS For IoT security.
1:
Input: total number of generations (T), and  number of agents (N).
2:
Use Equation (14) to normalize the collected IoT data.
3:
Using proposed CNN technique to extract the features (as in Section 4.2).
4:
After extracting the features, divide the data into training and testing sets.
5:
Use Equation (19) to generate population X.
6:
Put  t = 1 .
7:
while  t < = T  do
8:
   Apply Equation (20) to generate the Binary version of X i .
9:
   Use Equation (21) to calculate the fitness value F i t i for X i .
10:
   Find the best agent X b .
11:
   Enhance X i as in Equations (2)–(9)
12:
    t = t + 1 .
13:
end while
14:
Remove irrelevant features from testing set that corresponding to zeros in X b .
15:
Output: Consider X b as output and the evaluate the performance.

5. Experiment Results and Discussion

In this section, the quality of the developed IoT security technique is evaluated using a set of different datasets.

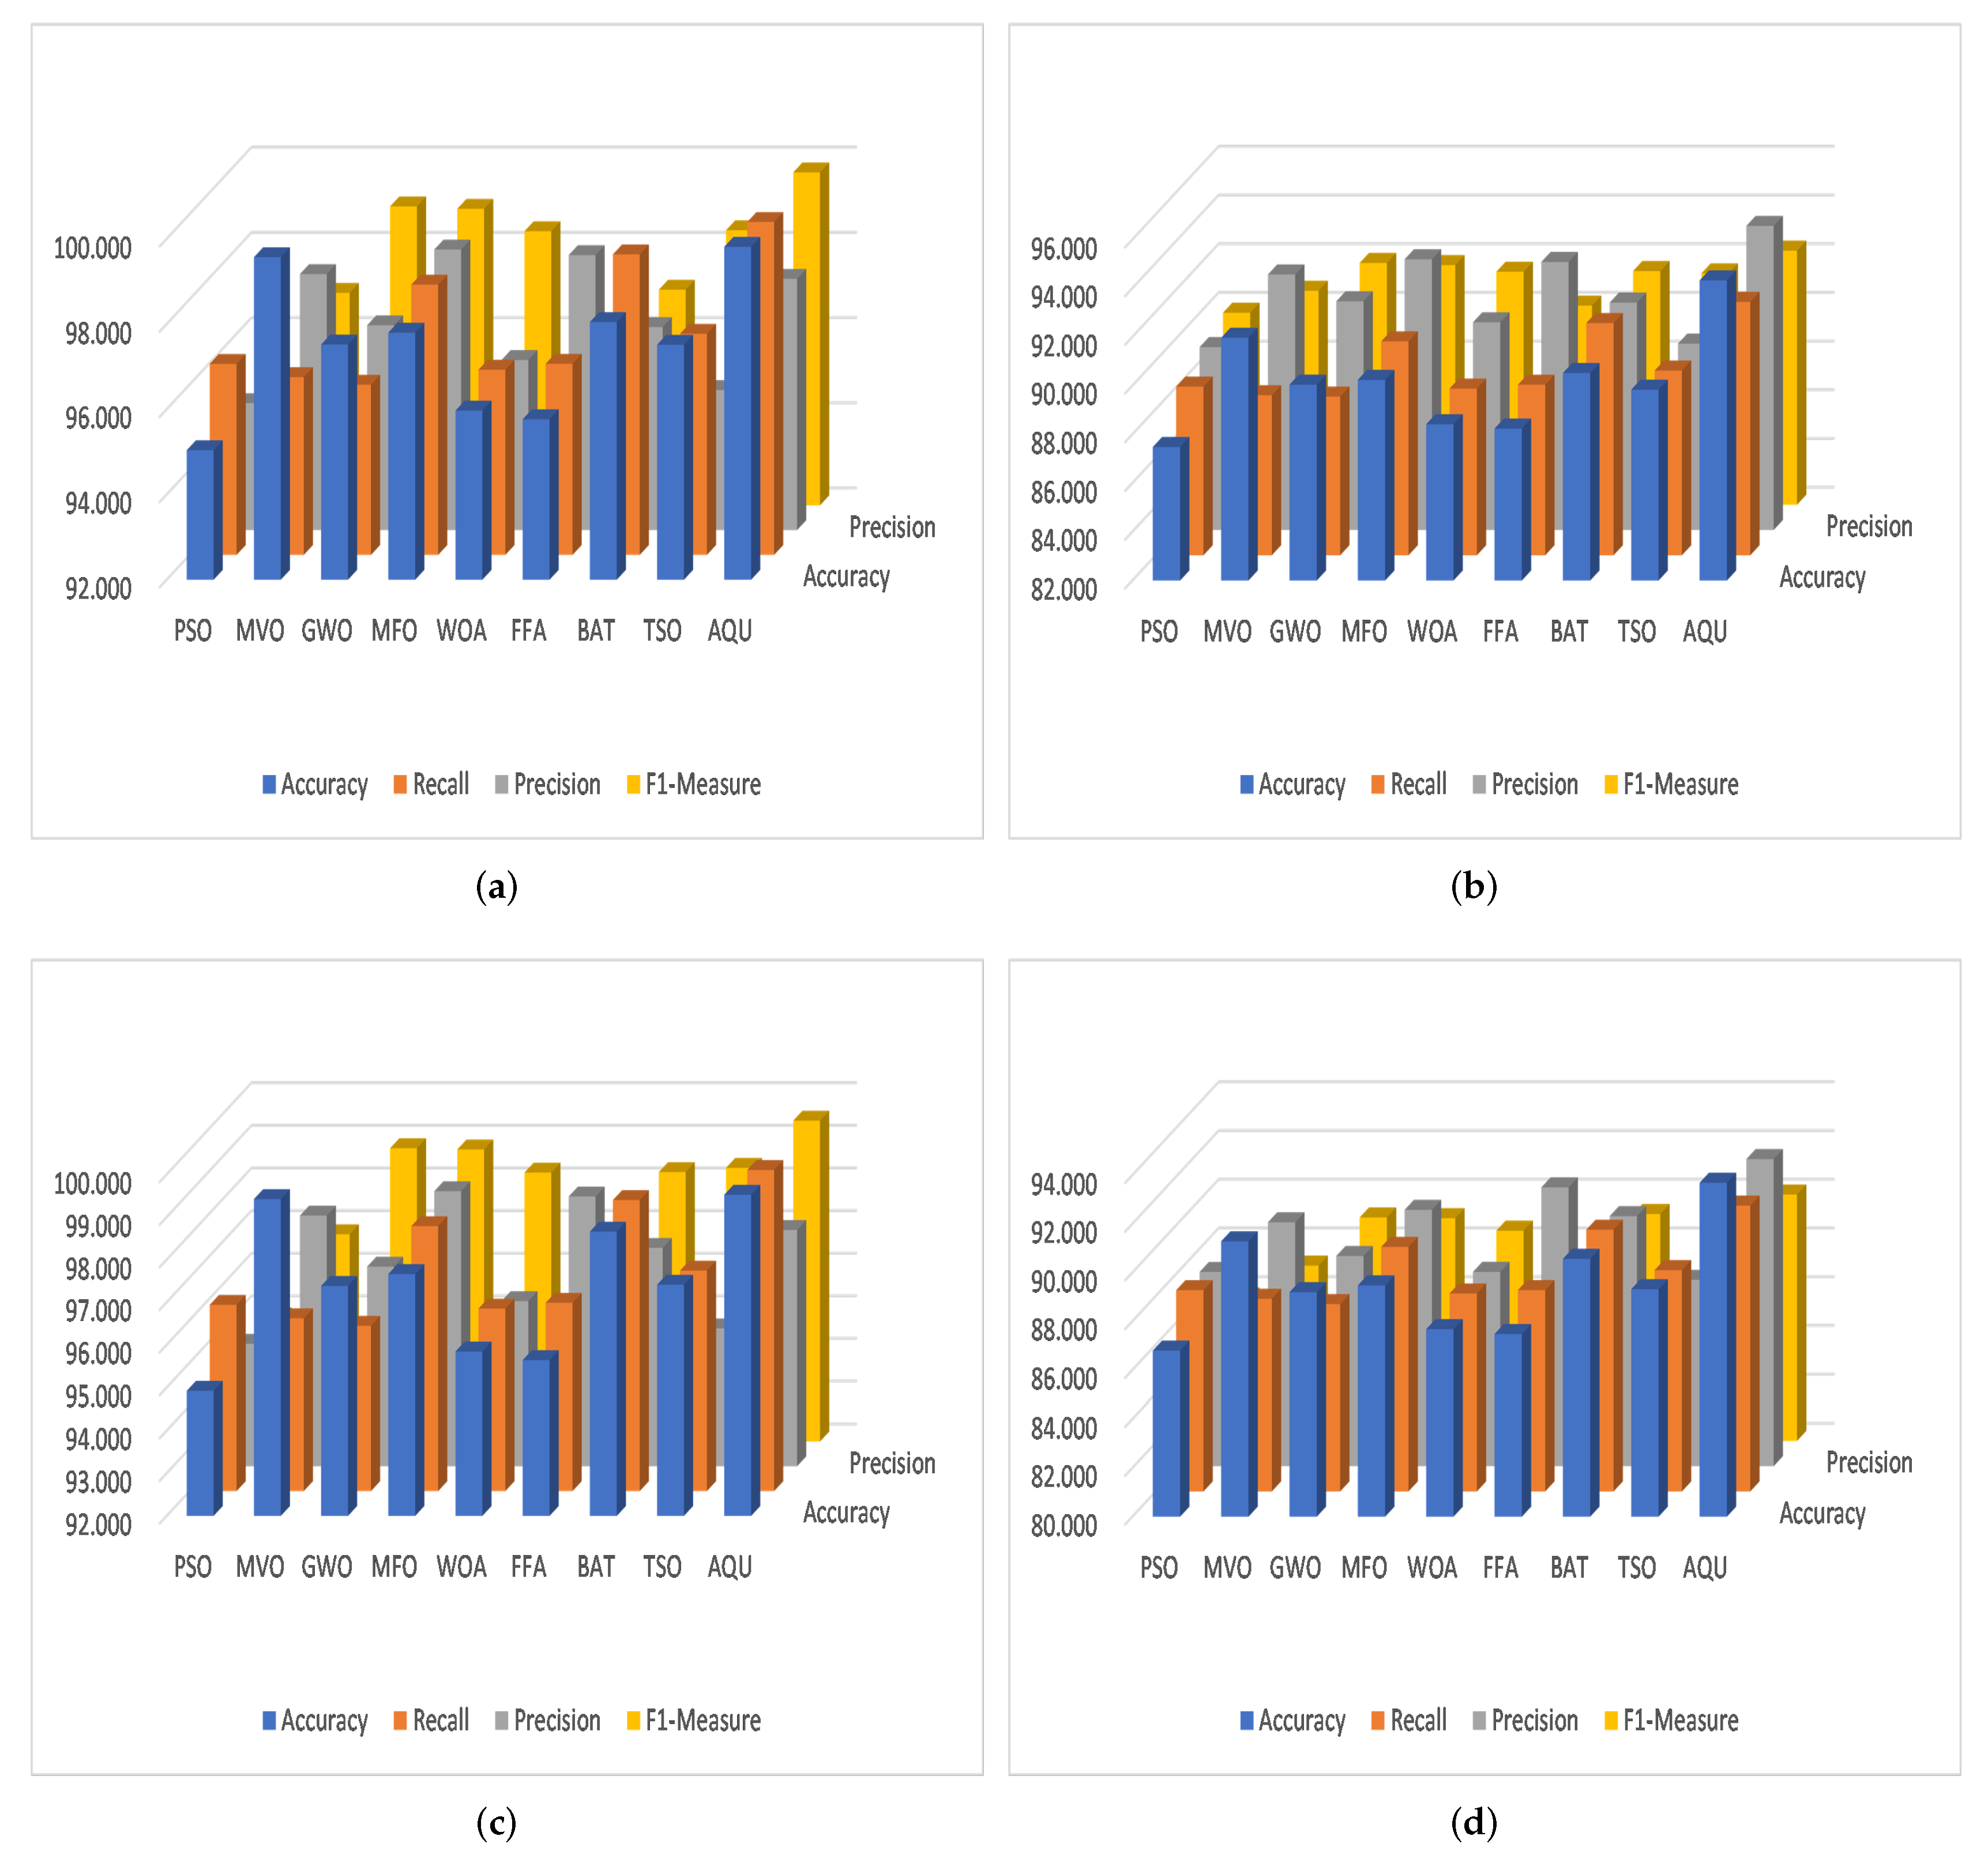
5.1. Performance Measures

In this study, we used a set of performance metrics to compute the efficiency of the developed IoT security method. These measures defined using the concept of confusion matrix (as in Table 1). These measure are given in the following.
  • Average accuracy ( A V A c c ) : The accuracy metric represents the rate of correct detection of the intrusion, and it is formulated as:
    A V A c c = 1 N r k = 1 N r A c c B e s t k ,
    A c c B e s t = T P + T N T P + F N + F P + T N
    in which N r = 30 refers to the iteration number(number of runs).
  • Average Recall ( A V S e n s ) : ( A V S e n s ) or true positive rate (TPR), represents the percentage of predicting positive intrusion. It can be computed as:
    A V S e n s = 1 N r k = 1 N r S e n s B e s t k , S e n s B e s t = T P T P + F N
  • Average Precision ( A V P r e c ) : this illustrates the percentage of true positive cases among all the the positive cases. The ( A V P r e c ) can be calculated as:
    A V P r e c = 1 N r k = 1 N r P r e c B e s t k , P r e c B e s t = T P F P + T P
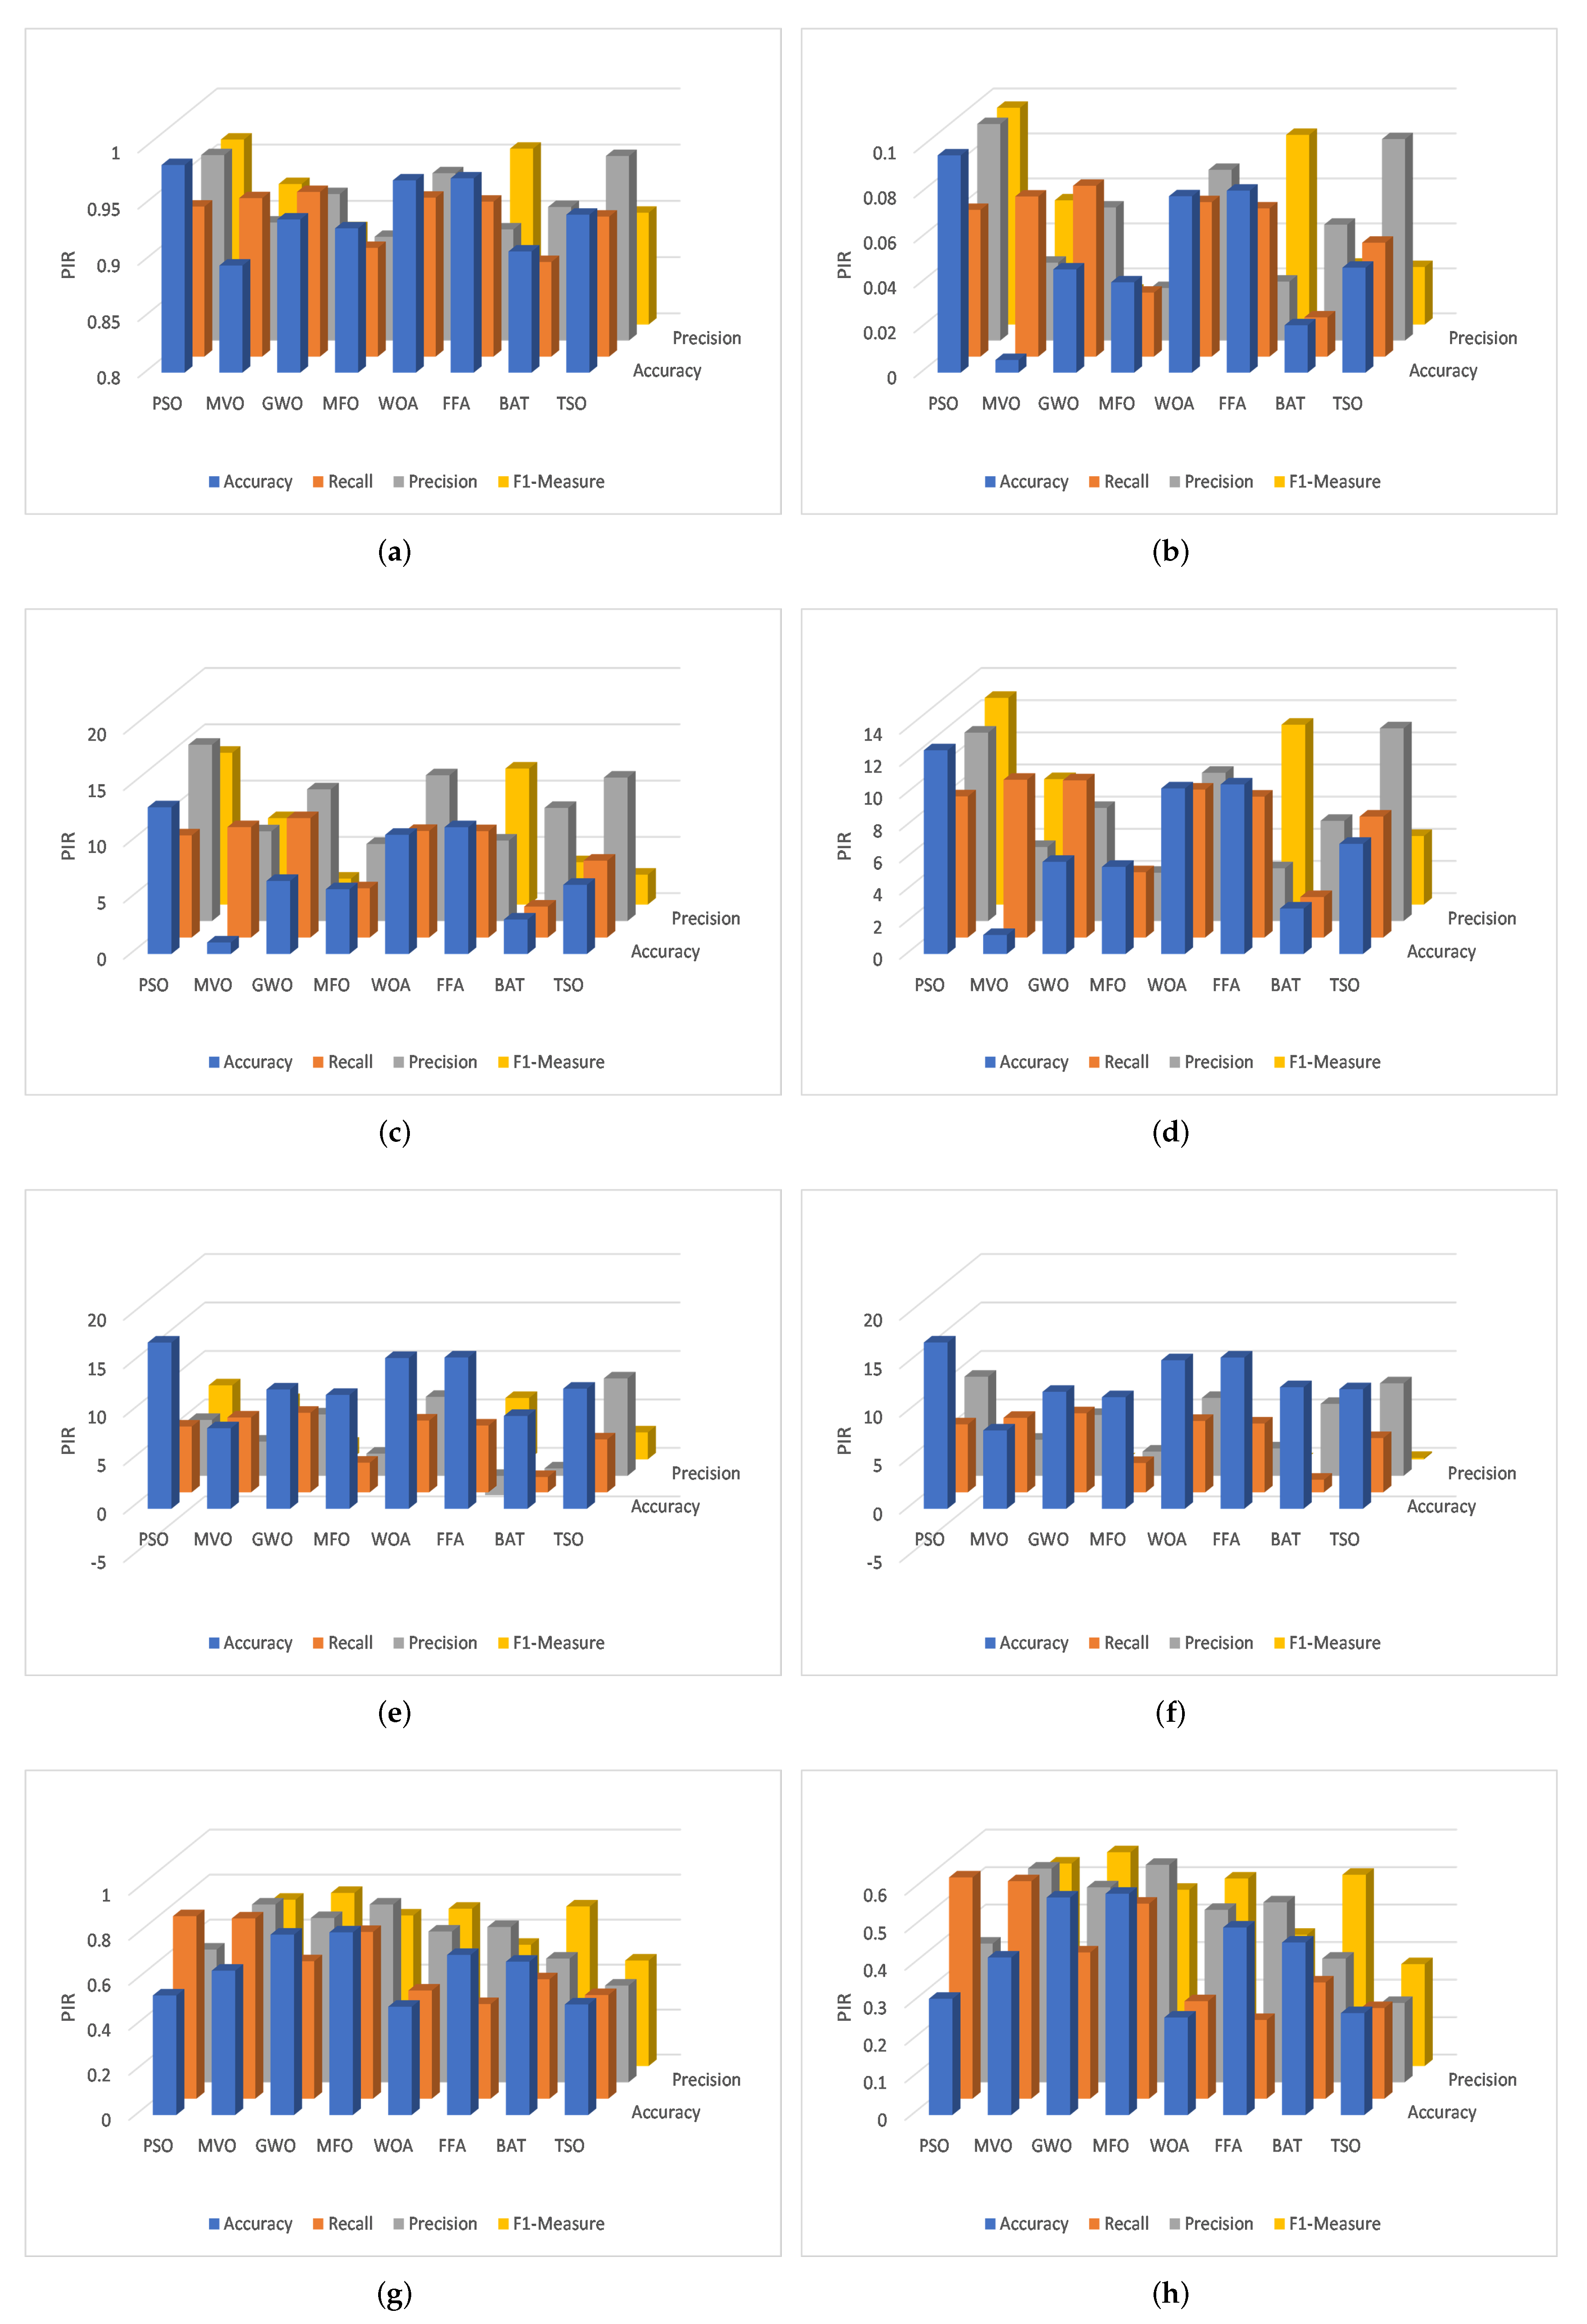
  • Performance Improvement Rate (PIR): This measure is applied to estimate the improvement rates obtained by the proposed technique. it can be computed as:
    P I R = M A Q U M A l g M A Q U × 100
    where M A Q U and M A l g refer to the value of measure (i.e., Precision, Accuracy, Recall, and F1-measure) of the proposed AQU and other algorithms, respectively.

5.2. Experimental Setup

In our experiments, Adam [52] optimizer is used to update the CNN model weights using a 0.005 learning rate. The CNN model was trained for 100 epochs using a 2024 batch size. Concerning the feature selection phase, we compared the proposed FS algorithm named AQU with existing MH techniques in the literature. The MH algorithms selected for comparison including Firefly algorithm (FFA) [53], particle swarm optimization (PSO) [54], whale optimization algorithm (WOA) [55], moth flame optimization (MFO) [56], traditional TSO, multiverse optimization algorithm (MVO) [57], Bat algorithm [58], and Grey wolf optimizer (GWO) [59]. Furthermore, we used the above mentioned MH algorithms with their default parameters based on the original implementation.

5.3. Dataset Description

In this section, we will illustrate in details the source and statistics of the datasets used to validate the proposed framework for the network intrusion detection task. We used four datasets, including KDDCup-99, and its refined version named NSL-KDD, Industrial IoT (IIoT) traffic data named BoT-IoT, and CICIDS-2017. The task is to detect network intrusions based on the extracted features using the CNN model as either intrusion, normal, or the attack type. The datasets are described in the following paragraphs.
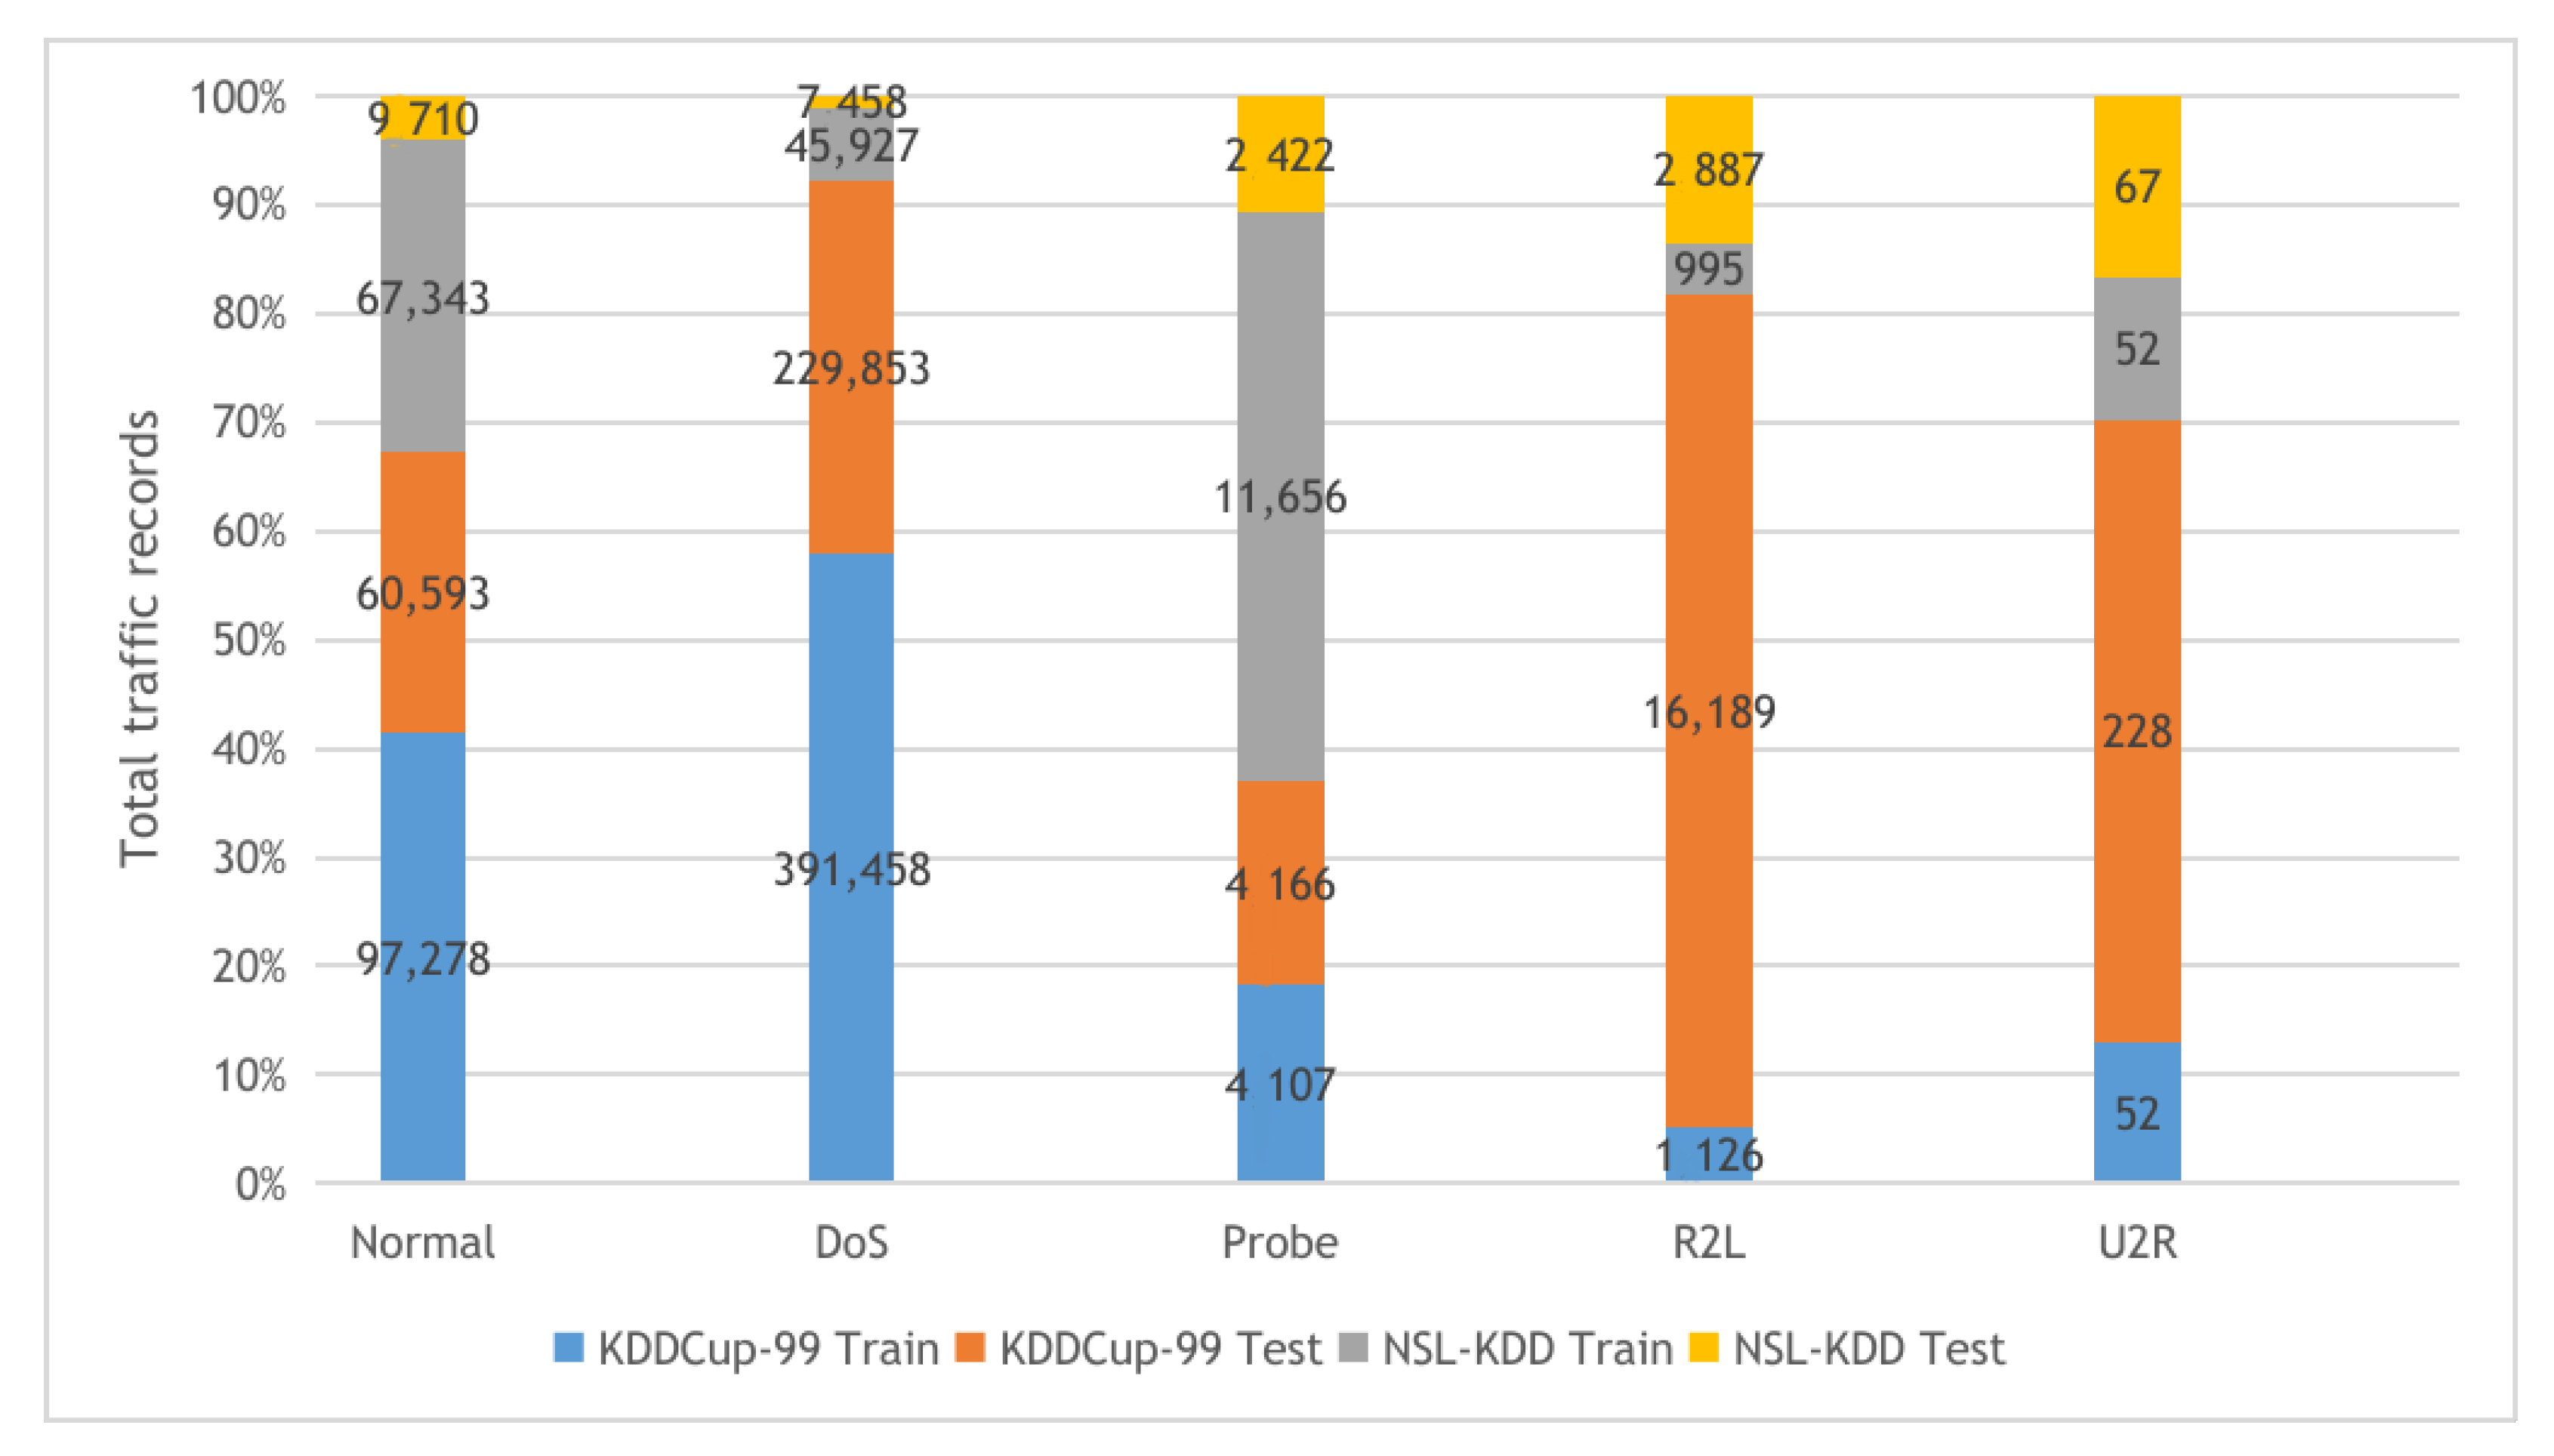
  • KDDCup-99 and NSL-KDD: The two datasets are described in Figure 4 with their detailed statistics. The first dataset is KDDCup-99, collected from the DARPA intrusion detection challenge (1998), incorporating 100’s users after monitoring the network traffic on 1000’s machines using UNIX operating system. The challenge period lasts for ten weeks by the MIT Lincon laboratory to store the collected traffic data in TCP dump format. Our experiments used 10% of the collected traffic data to build the KDDCup-99 dataset, which contains five attack types and 41 features. The KDDCup-99 dataset features are classified into three categories, including basic, content, and time-based traffic features. The second dataset is NSL-KDD, a derived copy from the full KDDCup-99 dataset after performing deduplication of the duplicated traffic records.
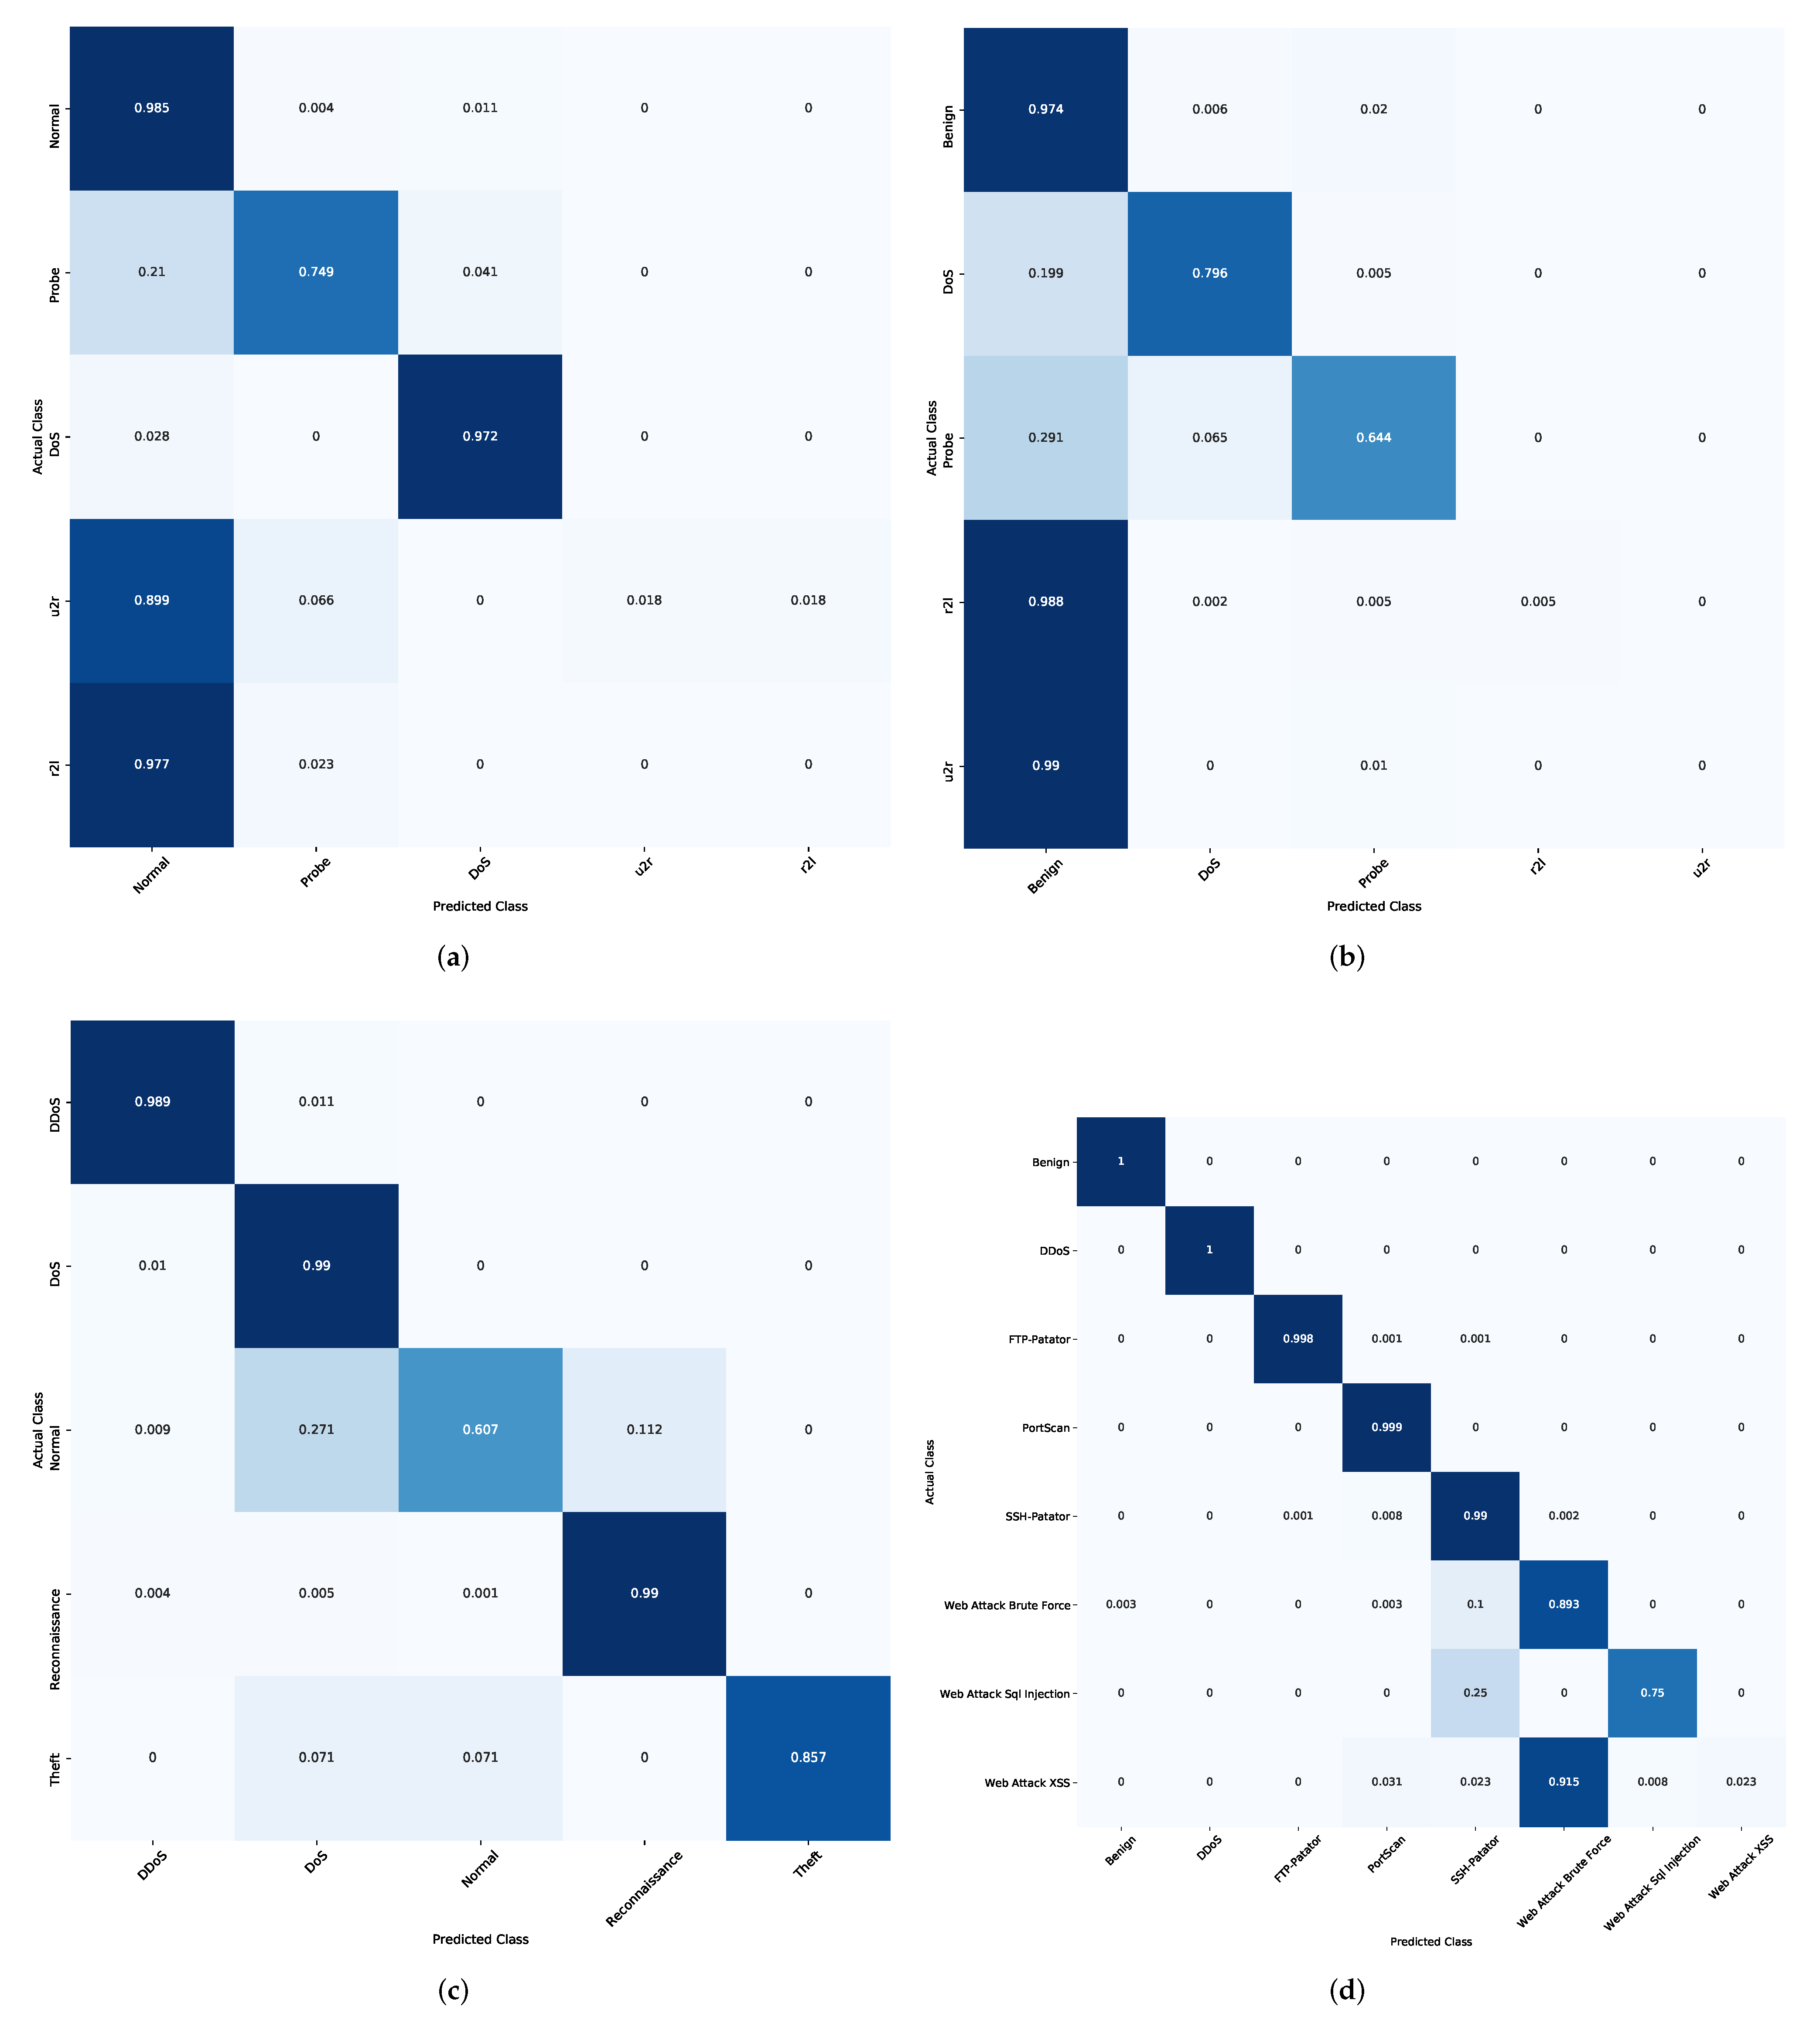
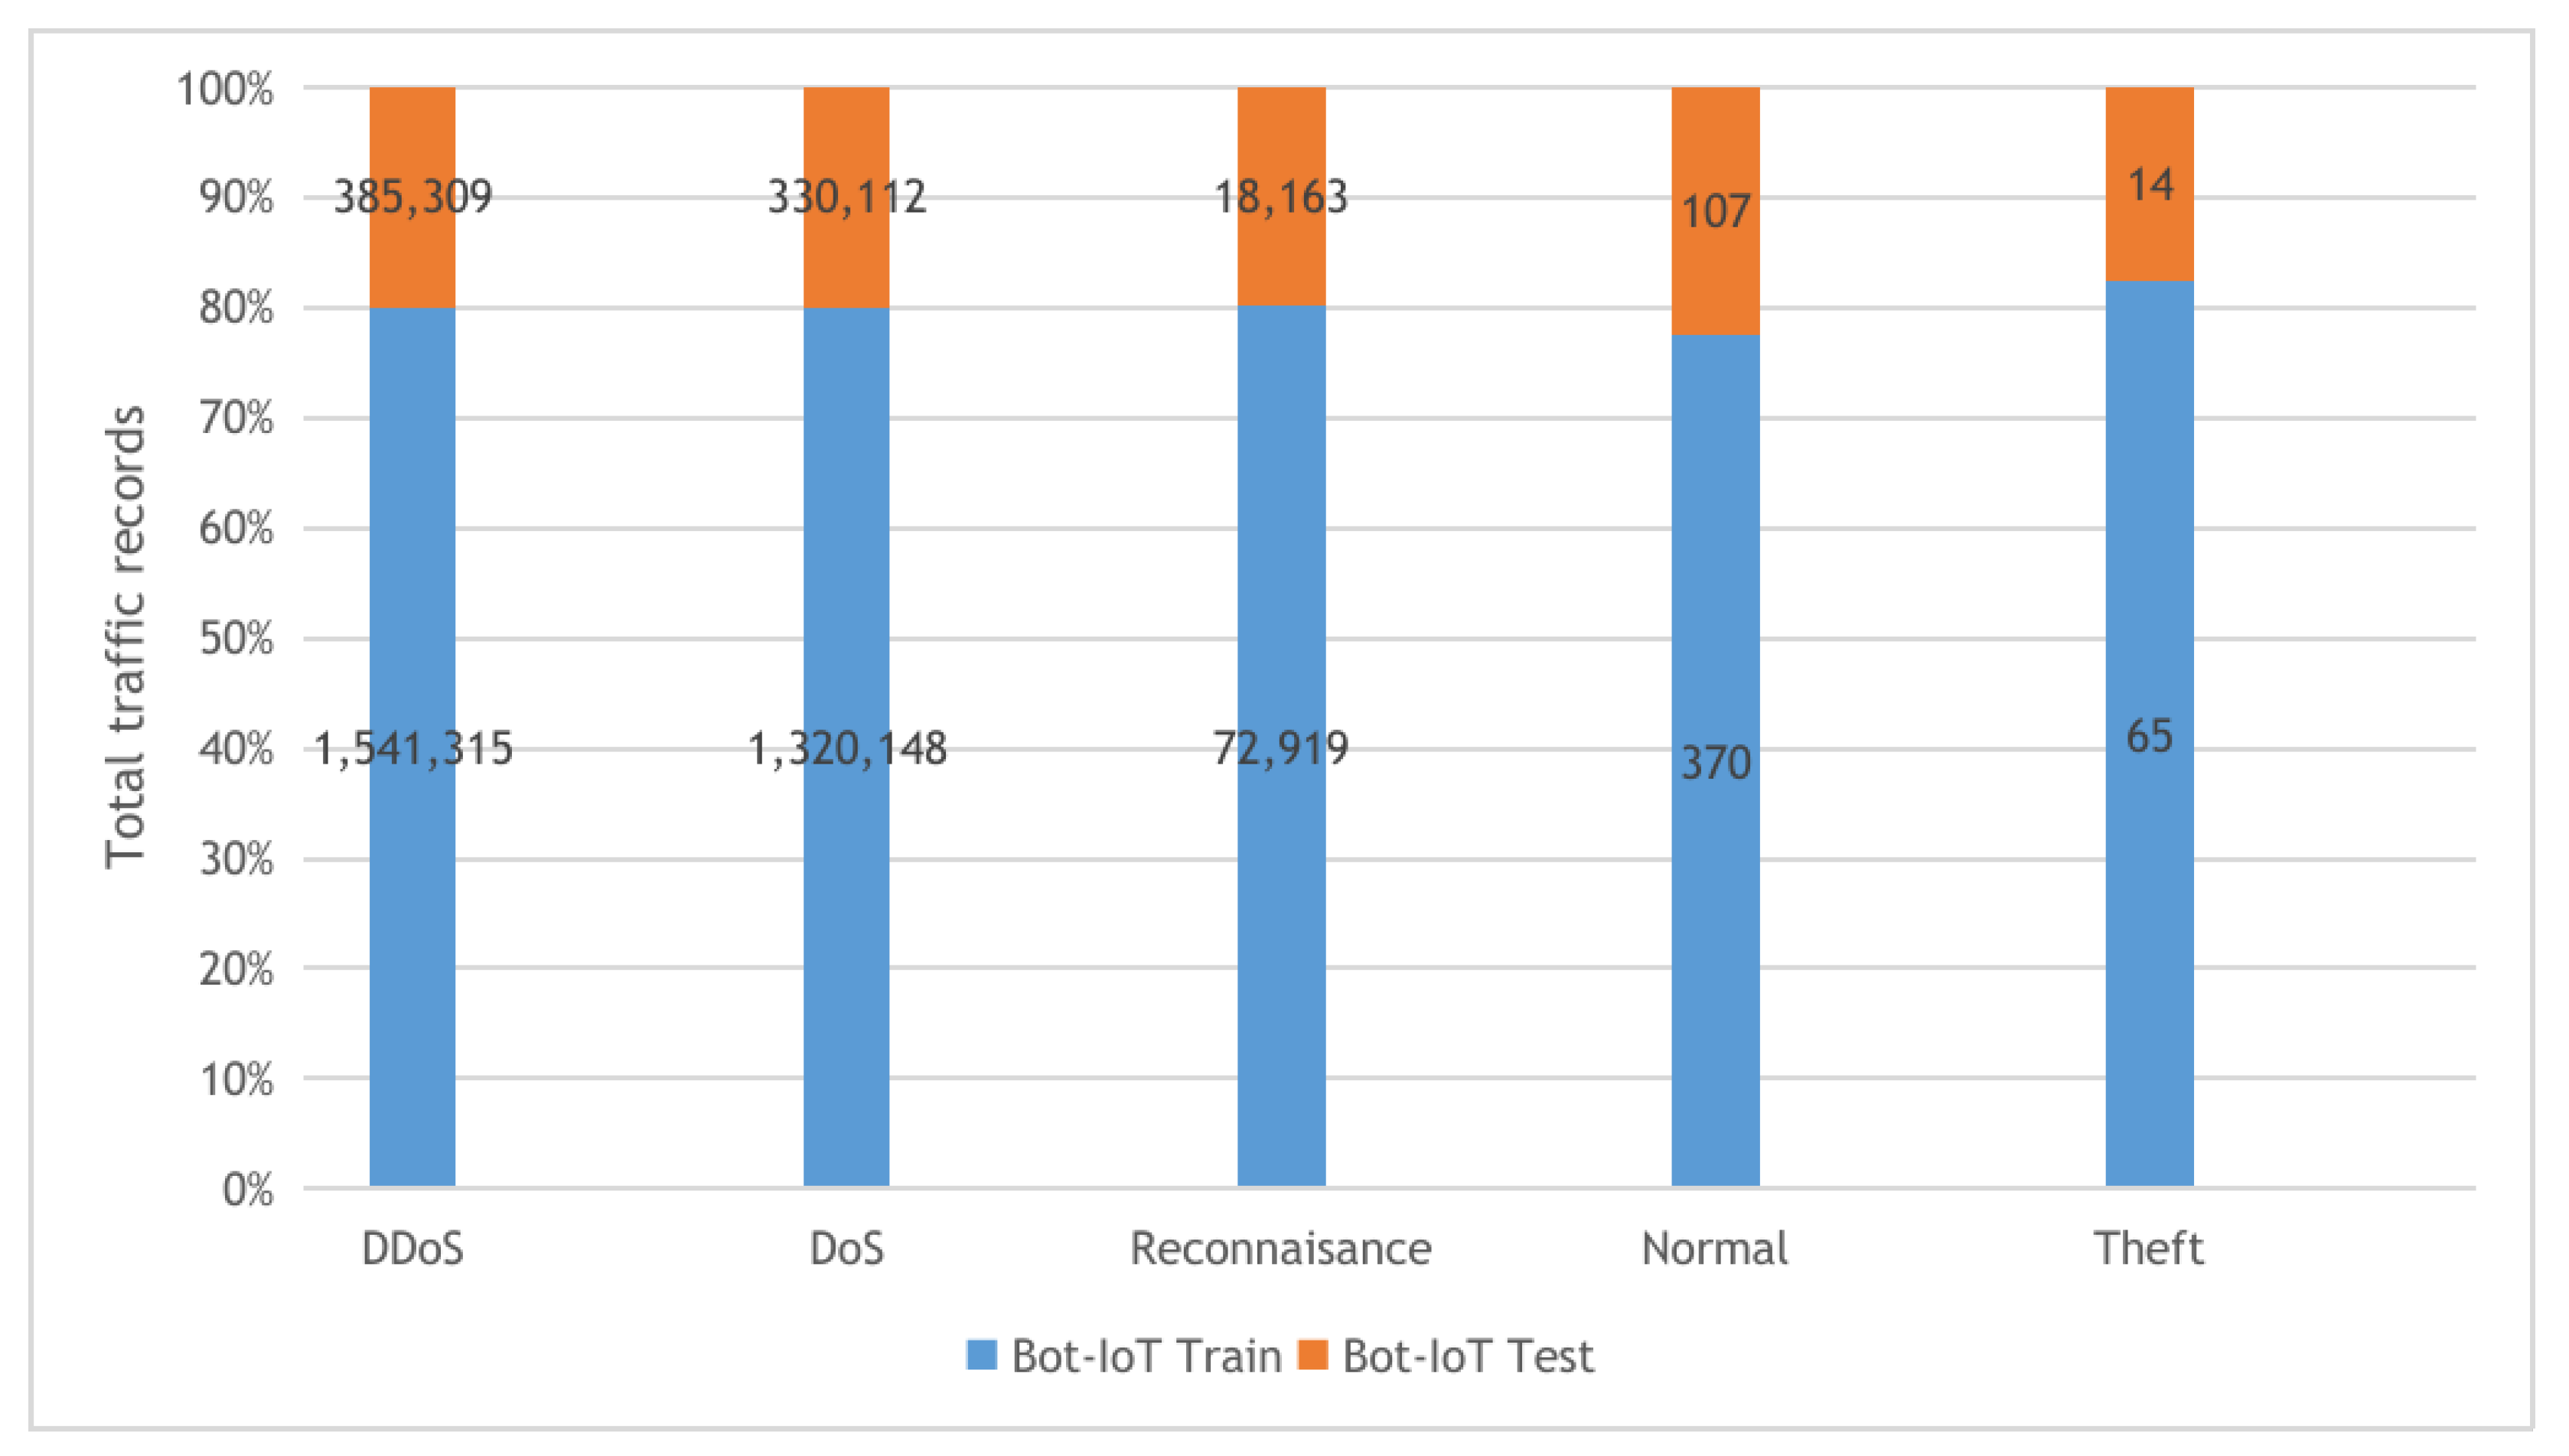
  • BoT-IoT: the Bot-IoT dataset [60] was collected in The center of UNSW Canberra Cyber using smart home appliances in a laboratory environment (the Cyber Range Lab). The dataset contains Industrial IoT (IIoT) traffic samples collected for IIoT experiments. The smart home appliances include weather monitoring systems, thermostats, kitchen appliances, and freezers and motion-controlled lights to record the traffic data. In our experiments, we used the 5% of the full Bot-IoT dataset, which consists of 3.6 million records, where the full dataset contains over 72 million records. The 5% of the entire dataset contains the best ten features extracted from the raw data and categorized into five main classes as described in Figure 5.
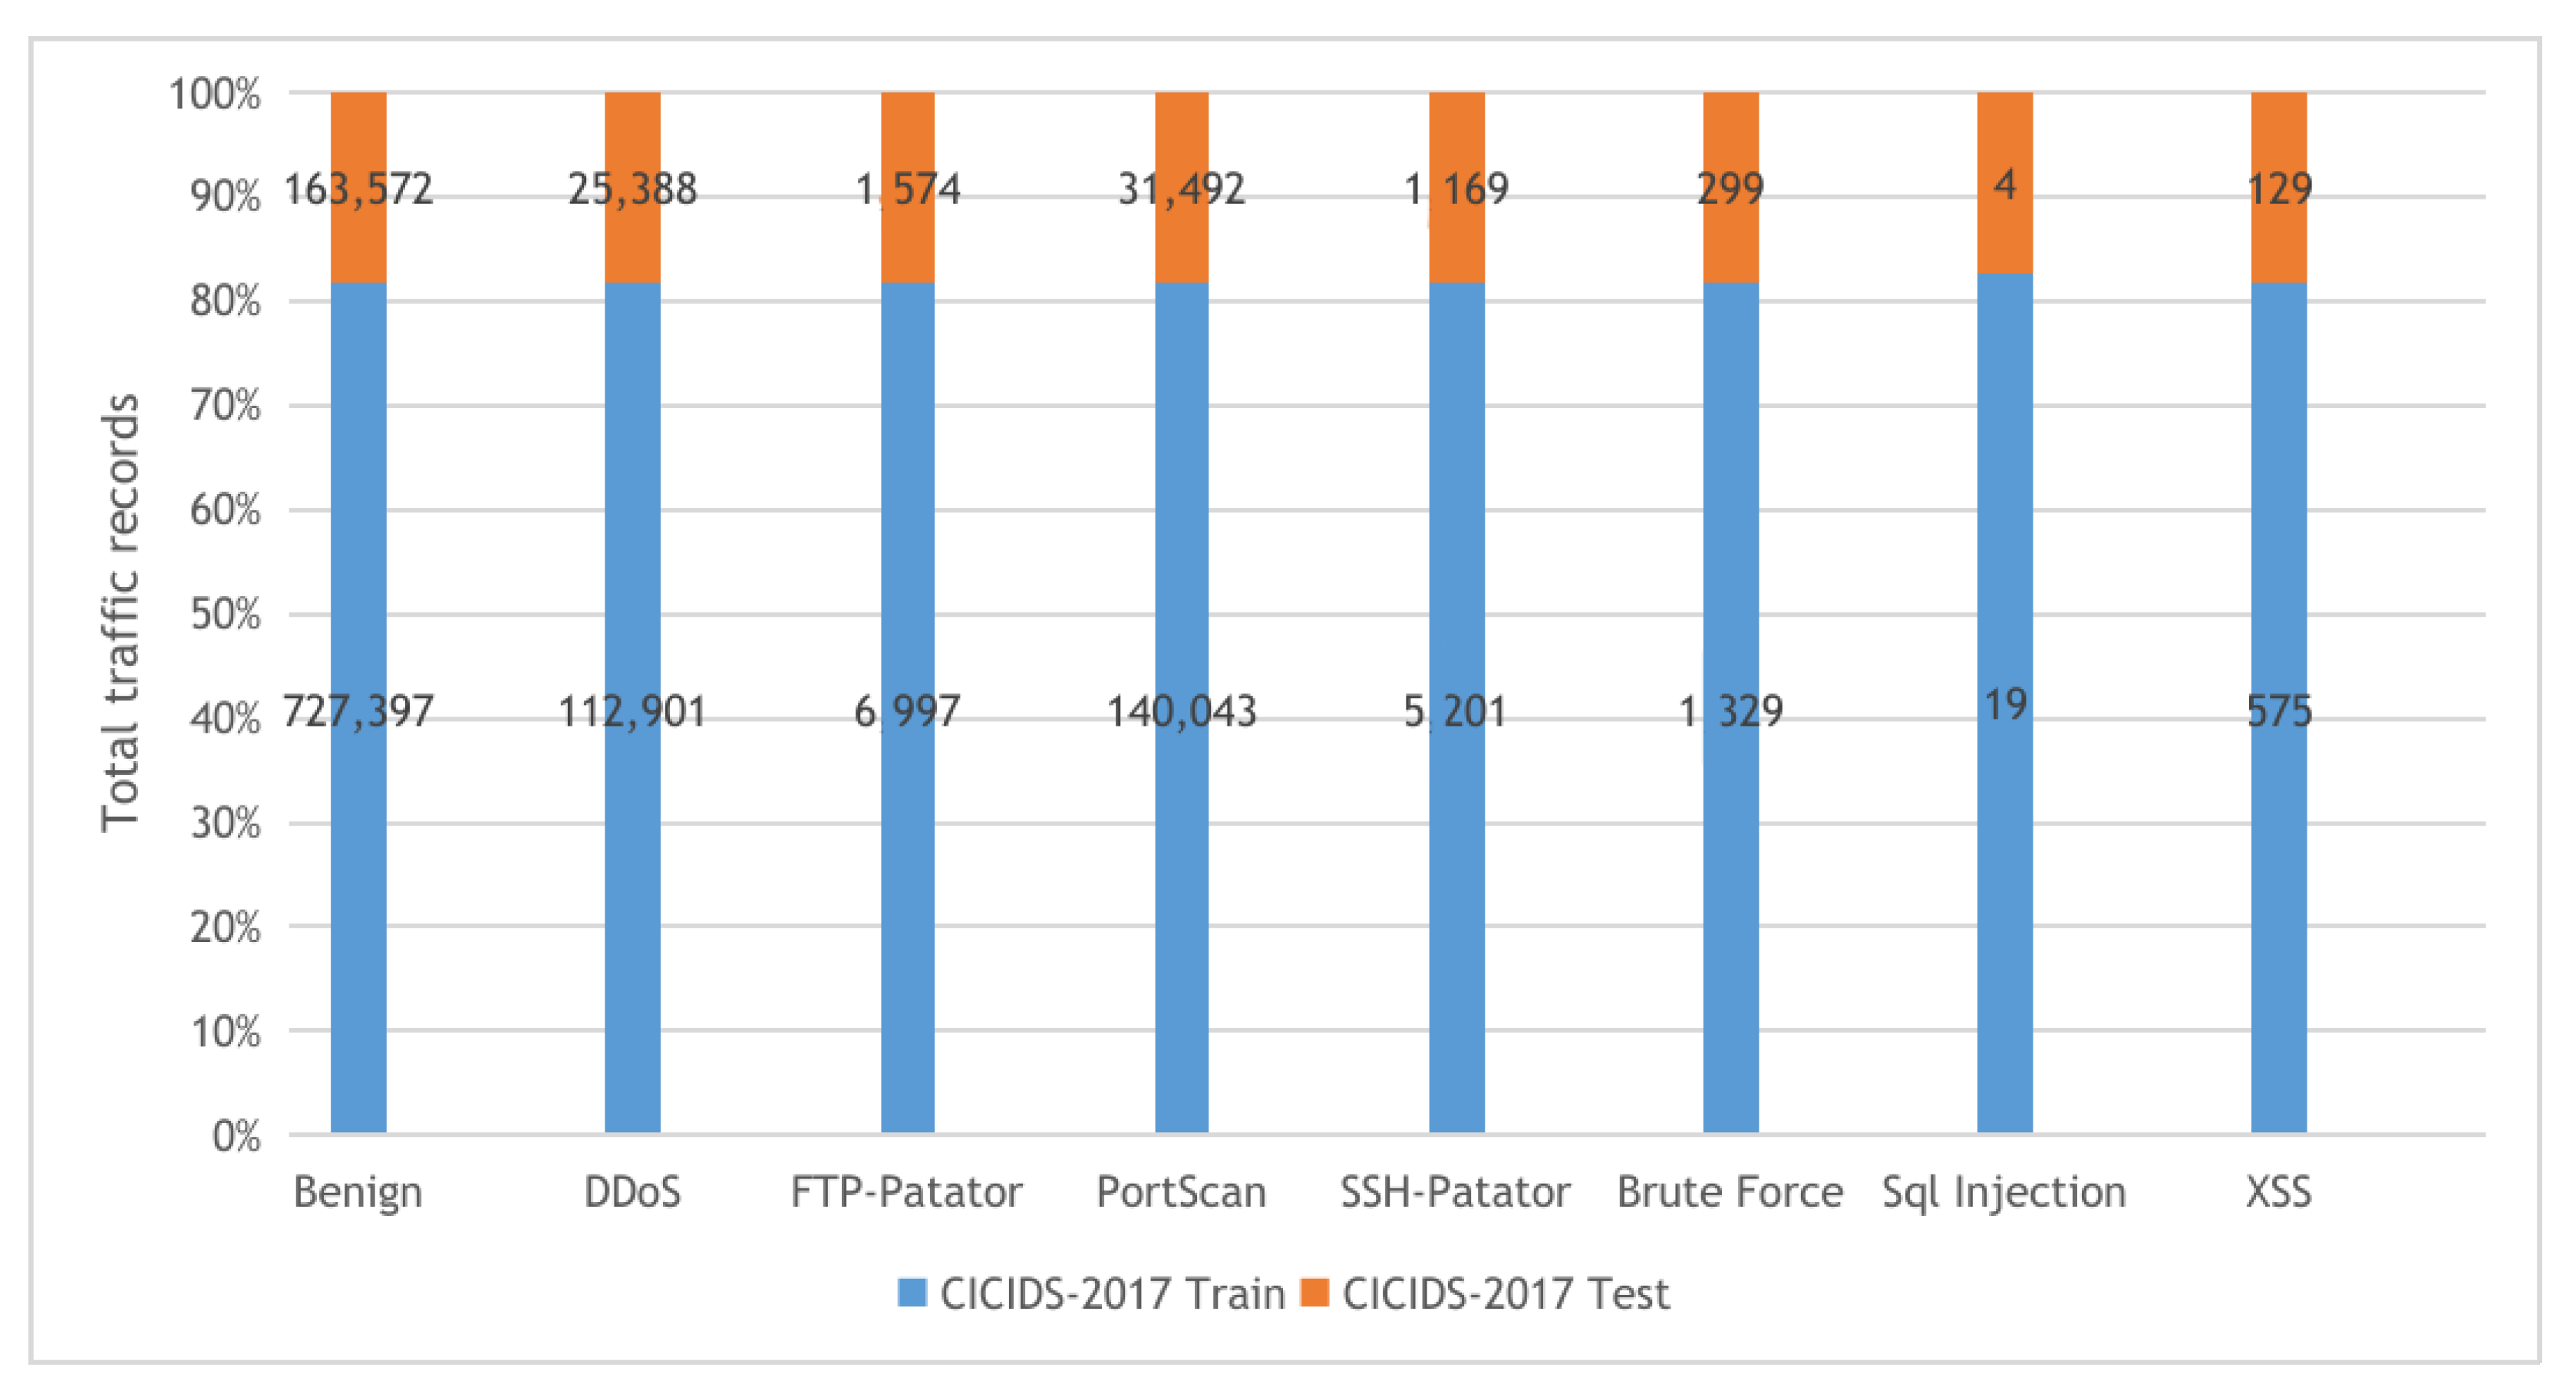
  • CICIDS-2017: The CICIDS-2017 [61] dataset is a collection of network traffic samples collected in CIC (The Canadian Institute for Cybersecurity at the University of New Brunswick.) for the intrusion detection task. The dataset consists of more than 1.5M PCAPs data simulating traffic data transferred in real-world using the CICFlowMeter software after analyzing 25 user behaviors covering various network protocols such as HTTP and SSH protocols. The collected data were categorized into eight main attack classes as described in Figure 6. Our experiments used the following collected CSV files: Tuesday-working hours, Friday-WorkingHours-Afternoon-PortScan, Friday-WorkingHours-Afternoon-DDos, and Thursday-WorkingHours-Morning-WebAttacks.

5.4. Results and Discussion

The findings of the comparison between the proposed AQU and the other MH approaches are discussed in this section. The average of the employed measures for all compared algorithms are shown in Table 2 and Table 3. For the multi-classification of the BoT-IoT, as shown in Table 2, the performance of most optimization approaches is practically similar during the training period. On the other hand, AQU, delivers excellent performance metrics. Furthermore, the developed AQU has the highest accuracy, specificity, and sensitivity, as well as the best F1-measure.
For the binary case of Bot-IoT, the AQU has better results in both the training and testing sets. Moreover, the P I R of the proposed AQU method and other optimization approaches is depicted in Figure 7a,b. For multi-classification variants, PIR ranges from 2.56 to 7.354 based on the value of accuracy, where it ranges from 1.080 to 4.410 based on the values of recall. Precision and F-measure range from 1.255 to 5.359 and 0.886 to 4.693, respectively. In binary classification case, the ranges are 2.496 to 0.0946, 0.941 to 4.210, 1.450 to 5.271, and 0.546 to 2.759, respectively.
Also, Table 2 and Figure 7c,d show the comparison results between the AQU and the compared algorithms using the NSL-KDD dataset; These results demonstrate the high performance of the proposed AQU over all compared approaches for both multi and binary classifications. As can be shown from performance measurements and the testing set results, the developed AQU behaves better in the learning phase than compared approaches. Furthermore, the developed AQU outperforms MVO with a difference of about 1.024%, and outperforms PSO with a difference of approximately 13.039%. The developed AQU outperforms existing models according to the value of recall, precision, and F-measure, with differences ranging from 2.75%, 6.85%, and 2.310% to 10.61%, 15.67%, 13.49% respectively.
For KDDCup-99, the results of the proposed AQU and all compared algorithms are shown in Table 2 (Figure 7e) and Table 3 (Figure 7f), respectively. We can see that for the multi-classification, the proposed AQU outperforms other approaches in the training stage. However, the BAT and FFA produce higher F1-measure and Precision values than other models. While AQU still outperforms MVO according to the value of accuracy, and there is only a 0.4 difference between the two. Furthermore, the advantage of AQU over binary KDDCup-99 can be seen in the comparison findings for all evaluation indicators. It achieved the best results using both training and testing datasets. Figure 8 shows the average of outcomes of all testing datasets for each algorithm. It can be seen that the AQU has a great ability to improve intrusion detection in both multi and binary classification instances.
In addition, the results of the competitive algorithms in case of CICIDS-2017 dataset are given in Table 2 and Table 3. It can be observed that the proposed AQU obtained the best results, especially in the multi-classification. Moreover, by comparing the results of AQU with the other model in FS case, it can be noticed that its PIR of accuracy variant from 0.260 to 0.590. However, the PIR of recall, Precision, and F1-Measure is 0.210 to 0.590, 0.212 to 0.580, and 0.210 to 0.570. The same observation can be reached from Figure 7g,h that illustrate the PIR for each algorithm using CICIDS-2017 dataset. Figure 9 depicts the confusion matrix of developed method over the tested datasets.
The Friedman test [62] is used to assess if there are significant differences between the presented technique and others to further analyze the results. There are two hypotheses in this test: the first, known as the null hypothesis, supposes that there are no differences between the compared algorithms and is accepted the case of the p-value ≥ 0.05. Otherwise, the alternative hypothesis (second one) is adopted which assume a considerable difference in techniques. In the two cases, Table 4 displays the mean rank of each algorithm for the four datasets (i.e., binary and multi-classifications). The proposed AQU obtained the highest mean rank for all applied performance indicators in both scenarios of multi-classification, as can be seen from the results. There is also a substantial distinction between AQU and other approaches.

6. Conclusions

In this paper, a new approach was proposed for the internet of things (IoT) intrusion detection system (IDS). We leveraged the advances of swarm intelligence (SI) and deep learning techniques. The proposed approach works as follows. First, a designed conventional neural network (CNN) based feature extraction method was applied to obtain the related features from the input datasets. Second, a new variant of the recently developed Aquila optimizer (AQU) was used to select appropriate features and to reduce data dimensionality. The main idea of the developed AQU is to use its binary version to overcome the limitations of the traditional AQU algorithm. To evaluate the developed approach, we used four well-known public datasets, namely, CIC2017, NSL-KDD, BoT-IoT, and KDD99. Moreover, extensive comparisons were carried out with several optimization algorithms, such as WOA, BAT, TSO, GWO, FFA, MVO, and MFO, using several evaluation measures, such as precision, recall, and F1-Measure. The outcomes have confirmed the superiority of the developed AQU against all compared methods. There are still some limitations in the developed method, such as AQU, which can be addressed in future work. Moreover, different swarm intelligence methods will be considered with different deep learning architectures for IDS in the IoT environment.

Author Contributions

Conceptualization, A.F. and S.L.; methodology, A.F. and A.D.; software, A.F.; validation, M.A.A.A.-q. and M.A.E.; formal analysis, M.A.A.A.-q. and M.A.E.; investigation, S.L.; resources, A.F.; data curation, A.F.; writing—original draft preparation, A.F., A.D.; writing—review and editing, M.A.A.A.-q. and M.A.E.; visualization, A.F.; supervision, S.L.; project administration, A.F.; funding acquisition, A.F. All authors have read and agreed to the published version of the manuscript.

Funding

This work is supported by the National Key R&D Program of China under Grand No. 2021YFB2012202 and the Hubei Provincial Science and Technology Major Project of China under Grant No. 2020AEA011 and the Key Research & Development Plan of Hubei Province of China under Grant No. 2021BAA171,2021BAA038 and the project of Science, Technology and Innovation Commission of Shenzhen Municipality of China under Grant No. JCYJ20210324120002006.

Institutional Review Board Statement

Not applicable.

Informed Consent Statement

Not applicable.

Data Availability Statement

Data used in this study are public datasets as mentioned in the main text.

Conflicts of Interest

The authors declare no conflict of interest.

References

  1. Zhou, Y.; Cheng, G.; Jiang, S.; Dai, M. Building an efficient intrusion detection system based on feature selection and ensemble classifier. Comput. Netw. 2020, 174, 107247. [Google Scholar] [CrossRef] [Green Version]
  2. Zhao, X.; Zhang, W. An anomaly intrusion detection method based on improved k-means of cloud computing. In Proceedings of the 2016 Sixth International Conference on Instrumentation & Measurement, Computer, Communication and Control (IMCCC), Harbin, China, 21–23 July 2016; pp. 284–288. [Google Scholar]
  3. Kumar, G.R.; Mangathayaru, N.; Narasimha, G. An improved k-Means Clustering algorithm for Intrusion Detection using Gaussian function. In Proceedings of the The International Conference on Engineering & MIS 2015, Istanbul, Turkey, 24–26 September 2015; pp. 1–7. [Google Scholar]
  4. Modi, C.; Patel, D.; Borisanya, B.; Patel, A.; Rajarajan, M. A novel framework for intrusion detection in cloud. In Proceedings of the fifth International Conference on Security of Information and Networks, Jaipur, India, 25–27 October 2012; pp. 67–74. [Google Scholar]
  5. Peng, K.; Leung, V.; Zheng, L.; Wang, S.; Huang, C.; Lin, T. Intrusion detection system based on decision tree over big data in fog environment. Wirel. Commun. Mob. Comput. 2018, 2018, 4680867. [Google Scholar] [CrossRef] [Green Version]
  6. Ghosh, P.; Mandal, A.K.; Kumar, R. An efficient cloud network intrusion detection system. In Information Systems Design and Intelligent Applications; Springer: Berlin/Heidelberg, Germany, 2015; pp. 91–99. [Google Scholar]
  7. Deshpande, P.; Sharma, S.C.; Peddoju, S.K.; Junaid, S. HIDS: A host based intrusion detection system for cloud computing environment. Int. J. Syst. Assur. Eng. Manag. 2018, 9, 567–576. [Google Scholar] [CrossRef]
  8. Wei, J.; Long, C.; Li, J.; Zhao, J. An intrusion detection algorithm based on bag representation with ensemble support vector machine in cloud computing. Concurr. Comput. Pract. Exp. 2020, 32, e5922. [Google Scholar] [CrossRef]
  9. Schueller, Q.; Basu, K.; Younas, M.; Patel, M.; Ball, F. A hierarchical intrusion detection system using support vector machine for SDN network in cloud data center. In Proceedings of the 2018 28th International Telecommunication Networks and Applications Conference (ITNAC), Sydney, NSW, Australia, 21–23 November 2018; pp. 1–6. [Google Scholar]
  10. Hodo, E.; Bellekens, X.; Hamilton, A.; Dubouilh, P.L.; Iorkyase, E.; Tachtatzis, C.; Atkinson, R. Threat analysis of IoT networks using artificial neural network intrusion detection system. In Proceedings of the 2016 International Symposium on Networks, Computers and Communications (ISNCC), Yasmine Hammamet, Tunisia, 11–13 May 2016; pp. 1–6. [Google Scholar]
  11. Wu, K.; Chen, Z.; Li, W. A novel intrusion detection model for a massive network using convolutional neural networks. IEEE Access 2018, 6, 50850–50859. [Google Scholar] [CrossRef]
  12. Almiani, M.; AbuGhazleh, A.; Al-Rahayfeh, A.; Atiewi, S.; Razaque, A. Deep recurrent neural network for IoT intrusion detection system. Simul. Model. Pract. Theory 2020, 101, 102031. [Google Scholar] [CrossRef]
  13. Al-qaness, M.A. Device-free human micro-activity recognition method using WiFi signals. Geo-Spat. Inf. Sci. 2019, 22, 128–137. [Google Scholar] [CrossRef]
  14. Seth, J.K.; Chandra, S. MIDS: Metaheuristic based intrusion detection system for cloud using k-NN and MGWO. In Proceedings of the International Conference on Advances in Computing and Data Sciences, Dehradun, India, 20–21 April 2018; Springer: Berlin/Heidelberg, Germany, 2018; pp. 411–420. [Google Scholar]
  15. RM, S.P.; Maddikunta, P.K.R.; Parimala, M.; Koppu, S.; Gadekallu, T.R.; Chowdhary, C.L.; Alazab, M. An effective feature engineering for DNN using hybrid PCA-GWO for intrusion detection in IoMT architecture. Comput. Commun. 2020, 160, 139–149. [Google Scholar]
  16. SaiSindhuTheja, R.; Shyam, G.K. An efficient metaheuristic algorithm based feature selection and recurrent neural network for DoS attack detection in cloud computing environment. Appl. Soft Comput. 2021, 100, 106997. [Google Scholar] [CrossRef]
  17. Nguyen, M.T.; Kim, K. Genetic convolutional neural network for intrusion detection systems. Future Gener. Comput. Syst. 2020, 113, 418–427. [Google Scholar] [CrossRef]
  18. Raman, M.G.; Somu, N.; Kirthivasan, K.; Liscano, R.; Sriram, V.S. An efficient intrusion detection system based on hypergraph-Genetic algorithm for parameter optimization and feature selection in support vector machine. Knowl.-Based Syst. 2017, 134, 1–12. [Google Scholar] [CrossRef]
  19. Malhotra, S.; Bali, V.; Paliwal, K. Genetic programming and K-nearest neighbour classifier based intrusion detection model. In Proceedings of the 2017 7th International Conference on Cloud Computing, Data Science & Engineering-Confluence, Noida, India, 12–13 January 2017; pp. 42–46. [Google Scholar]
  20. Al-qaness, M.A.; Ewees, A.A.; Abd Elaziz, M. Modified whale optimization algorithm for solving unrelated parallel machine scheduling problems. Soft Comput. 2021, 25, 9545–9557. [Google Scholar] [CrossRef]
  21. Mayuranathan, M.; Murugan, M.; Dhanakoti, V. Best features based intrusion detection system by RBM model for detecting DDoS in cloud environment. J. Ambient. Intell. Humaniz. Comput. 2019, 12, 3609–3619. [Google Scholar] [CrossRef]
  22. Ghosh, P.; Karmakar, A.; Sharma, J.; Phadikar, S. CS-PSO based intrusion detection system in cloud environment. In Emerging Technologies in Data Mining and Information Security; Springer: Berlin/Heidelberg, Germany, 2019; pp. 261–269. [Google Scholar]
  23. Abualigah, L.; Yousri, D.; Abd Elaziz, M.; Ewees, A.A.; Al-qaness, M.A.; Gandomi, A.H. Aquila Optimizer: A novel meta-heuristic optimization Algorithm. Comput. Ind. Eng. 2021, 157, 107250. [Google Scholar] [CrossRef]
  24. Wang, S.; Jia, H.; Abualigah, L.; Liu, Q.; Zheng, R. An Improved Hybrid Aquila Optimizer and Harris Hawks Algorithm for Solving Industrial Engineering Optimization Problems. Processes 2021, 9, 1551. [Google Scholar] [CrossRef]
  25. Abd Elaziz, M.; Dahou, A.; Alsaleh, N.A.; Elsheikh, A.H.; Saba, A.I.; Ahmadein, M. Boosting COVID-19 Image Classification Using MobileNetV3 and Aquila Optimizer Algorithm. Entropy 2021, 23, 1383. [Google Scholar] [CrossRef]
  26. AlRassas, A.M.; Al-qaness, M.A.; Ewees, A.A.; Ren, S.; Abd Elaziz, M.; Damaševičius, R.; Krilavičius, T. Optimized ANFIS model using Aquila Optimizer for oil production forecasting. Processes 2021, 9, 1194. [Google Scholar] [CrossRef]
  27. Shafiq, M.; Tian, Z.; Bashir, A.K.; Du, X.; Guizani, M. IoT malicious traffic identification using wrapper-based feature selection mechanisms. Comput. Secur. 2020, 94, 101863. [Google Scholar] [CrossRef]
  28. Haddadpajouh, H.; Mohtadi, A.; Dehghantanaha, A.; Karimipour, H.; Lin, X.; Choo, K.K.R. A Multikernel and Metaheuristic Feature Selection Approach for IoT Malware Threat Hunting in the Edge Layer. IEEE Internet Things J. 2020, 8, 4540–4547. [Google Scholar] [CrossRef]
  29. Shafiq, M.; Tian, Z.; Bashir, A.K.; Du, X.; Guizani, M. CorrAUC: A malicious bot-IoT traffic detection method in IoT network using machine-learning techniques. IEEE Internet Things J. 2020, 8, 3242–3254. [Google Scholar] [CrossRef]
  30. Davahli, A.; Shamsi, M.; Abaei, G. A lightweight Anomaly detection model using SVM for WSNs in IoT through a hybrid feature selection algorithm based on GA and GWO. J. Comput. Secur. 2020, 7, 63–79. [Google Scholar]
  31. Mafarja, M.; Heidari, A.A.; Habib, M.; Faris, H.; Thaher, T.; Aljarah, I. Augmented whale feature selection for IoT attacks: Structure, analysis and applications. Future Gener. Comput. Syst. 2020, 112, 18–40. [Google Scholar] [CrossRef]
  32. Sekhar, R.; Sasirekha, K.; Raja, P.; Thangavel, K. A novel GPU based intrusion detection system using deep autoencoder with Fruitfly optimization. SN Appl. Sci. 2021, 3, 1–16. [Google Scholar] [CrossRef]
  33. Dwivedi, S.; Vardhan, M.; Tripathi, S. Building an efficient intrusion detection system using grasshopper optimization algorithm for anomaly detection. Clust. Comput. 2021, 24, 1881–1900. [Google Scholar] [CrossRef]
  34. Kan, X.; Fan, Y.; Fang, Z.; Cao, L.; Xiong, N.N.; Yang, D.; Li, X. A novel IoT network intrusion detection approach based on Adaptive Particle Swarm Optimization Convolutional Neural Network. Inf. Sci. 2021, 568, 147–162. [Google Scholar] [CrossRef]
  35. Alimi, O.A.; Ouahada, K.; Abu-Mahfouz, A.M.; Rimer, S.; Alimi, K.O.A. Intrusion Detection for Water Distribution Systems based on an Hybrid Particle Swarm Optimization with Back Propagation Neural Network. In Proceedings of the 2021 IEEE AFRICON, Arusha, Tanzania, 13–15 September 2021; pp. 1–5. [Google Scholar]
  36. HajKacem, M.A.B.; Moslah, M.; Essoussi, N. Spark Based Intrusion Detection System Using Practical Swarm Optimization Clustering. In Artificial Intelligence and Blockchain for Future Cybersecurity Applications; Springer: Berlin/Heidelberg, Germany, 2021; pp. 197–216. [Google Scholar]
  37. Nandy, S.; Adhikari, M.; Khan, M.A.; Menon, V.G.; Verma, S. An intrusion detection mechanism for secured IoMT framework based on swarm-neural network. IEEE J. Biomed. Health Inform. 2021. [Google Scholar] [CrossRef]
  38. Talita, A.; Nataza, O.; Rustam, Z. Naïve Bayes Classifier and Particle Swarm Optimization Feature Selection Method for Classifying Intrusion Detection System Dataset. J. Phys. Conf. Ser. 2021, 1752, 012021. [Google Scholar] [CrossRef]
  39. Angel, J.; Aroyehun, S.T.; Tamayo, A.; Gelbukh, A. NLP-CIC at SemEval-2020 Task 9: Analysing sentiment in code-switching language using a simple deep-learning classifier. In Proceedings of the Fourteenth Workshop on Semantic Evaluation, Barcelona, Spain, 12–13 December 2020; pp. 957–962. [Google Scholar]
  40. Fan, H.; Du, W.; Dahou, A.; Ewees, A.A.; Yousri, D.; Elaziz, M.A.; Elsheikh, A.H.; Abualigah, L.; Al-qaness, M.A. Social Media Toxicity Classification Using Deep Learning: Real-World Application UK Brexit. Electronics 2021, 10, 1332. [Google Scholar] [CrossRef]
  41. Xu, L.; Ma, A. Coarse-to-fine waterlogging probability assessment based on remote sensing image and social media data. Geo-Spat. Inf. Sci. 2021, 24, 279–301. [Google Scholar] [CrossRef]
  42. AL-Alimi, D.; Shao, Y.; Feng, R.; Al-qaness, M.A.; Elaziz, M.A.; Kim, S. Multi-scale geospatial object detection based on shallow-deep feature extraction. Remote Sens. 2019, 11, 2525. [Google Scholar] [CrossRef] [Green Version]
  43. Sahlol, A.T.; Yousri, D.; Ewees, A.A.; Al-Qaness, M.A.; Damasevicius, R.; Abd Elaziz, M. COVID-19 image classification using deep features and fractional-order marine predators algorithm. Sci. Rep. 2020, 10, 15364. [Google Scholar] [CrossRef]
  44. Okewu, E.; Misra, S.; Maskeliūnas, R.; Damaševičius, R.; Fernandez-Sanz, L. Optimizing green computing awareness for environmental sustainability and economic security as a stochastic optimization problem. Sustainability 2017, 9, 1857. [Google Scholar] [CrossRef] [Green Version]
  45. Okewu, E.; Misra, S.; Fernandez, S.L.; Ayeni, F.; Mbarika, V.; Damaševičius, R. Deep neural networks for curbing climate change-induced farmers-herdsmen clashes in a sustainable social inclusion initiative. Probl. Ekorozwoju 2019, 14, 143–155. [Google Scholar]
  46. Heipke, C.; Rottensteiner, F. Deep learning for geometric and semantic tasks in photogrammetry and remote sensing. Geo-Spat. Inf. Sci. 2020, 23, 10–19. [Google Scholar] [CrossRef]
  47. Qi, Y.; Chodron Drolma, S.; Zhang, X.; Liang, J.; Jiang, H.; Xu, J.; Ni, T. An investigation of the visual features of urban street vitality using a convolutional neural network. Geo-Spat. Inf. Sci. 2020, 23, 341–351. [Google Scholar] [CrossRef]
  48. Al-qaness, M.A.; Abbasi, A.A.; Fan, H.; Ibrahim, R.A.; Alsamhi, S.H.; Hawbani, A. An improved YOLO-based road traffic monitoring system. Computing 2021, 103, 211–230. [Google Scholar] [CrossRef]
  49. Bochkovskiy, A.; Wang, C.Y.; Liao, H.Y.M. YOLOv4: Optimal Speed and Accuracy of Object Detection. arXiv 2020, arXiv:2004.10934. [Google Scholar]
  50. Nair, V.; Hinton, G.E. Rectified linear units improve restricted boltzmann machines. In Proceedings of the 27th International Conference on Machine Learning (ICML-10), Haifa, Israel, 21–24 June 2010; pp. 807–814. [Google Scholar]
  51. McFee, B.; Salamon, J.; Bello, J.P. Adaptive pooling operators for weakly labeled sound event detection. IEEE/ACM Trans. Audio Speech Lang. Process. 2018, 26, 2180–2193. [Google Scholar] [CrossRef] [Green Version]
  52. Kingma, D.P.; Ba, J. Adam: A method for stochastic optimization. arXiv 2014, arXiv:1412.6980. [Google Scholar]
  53. Yang, X.S.; He, X. Firefly algorithm: Recent advances and applications. Int. J. Swarm Intell. 2013, 1, 36–50. [Google Scholar] [CrossRef] [Green Version]
  54. Kennedy, J.; Eberhart, R. Particle swarm optimization. In Proceedings of the ICNN’95-International Conference on Neural Networks, Perth, WA, Australia, 27 November–1 December 1995; Volume 4, pp. 1942–1948. [Google Scholar]
  55. Mirjalili, S.; Lewis, A. The whale optimization algorithm. Adv. Eng. Softw. 2016, 95, 51–67. [Google Scholar] [CrossRef]
  56. Mirjalili, S. Moth-flame optimization algorithm: A novel nature-inspired heuristic paradigm. Knowl.-Based Syst. 2015, 89, 228–249. [Google Scholar] [CrossRef]
  57. Mirjalili, S.; Mirjalili, S.M.; Hatamlou, A. Multi-verse optimizer: A nature-inspired algorithm for global optimization. Neural Comput. Appl. 2016, 27, 495–513. [Google Scholar] [CrossRef]
  58. Yang, X.S. A new metaheuristic bat-inspired algorithm. In Nature Inspired Cooperative Strategies for Optimization (NICSO 2010); Springer: Berlin/Heidelberg, Germany, 2010; pp. 65–74. [Google Scholar]
  59. Mirjalili, S.; Mirjalili, S.M.; Lewis, A. Grey wolf optimizer. Adv. Eng. Softw. 2014, 69, 46–61. [Google Scholar] [CrossRef] [Green Version]
  60. Koroniotis, N.; Moustafa, N.; Sitnikova, E.; Turnbull, B. Towards the development of realistic botnet dataset in the internet of things for network forensic analytics: Bot-iot dataset. Future Gener. Comput. Syst. 2019, 100, 779–796. [Google Scholar] [CrossRef] [Green Version]
  61. Sharafaldin, I.; Lashkari, A.H.; Ghorbani, A.A. Toward generating a new intrusion detection dataset and intrusion traffic characterization. ICISSp 2018, 1, 108–116. [Google Scholar]
  62. Friedman, M. A comparison of alternative tests of significance for the problem of m rankings. Ann. Math. Stat. 1940, 11, 86–92. [Google Scholar] [CrossRef]
Figure 1. Structure of presented IoT security model.
Sensors 22 00140 g001
Figure 2. The feature extraction module based on a proposed CNN architecture.
Sensors 22 00140 g002
Figure 3. The FS approach using AQU algorithm.
Sensors 22 00140 g003
Figure 4. The KDDCup-99 and NSL-KDD datasets training and testing sets distribution.
Sensors 22 00140 g004
Figure 5. The Bot-IoT dataset training and testing sets distribution.
Sensors 22 00140 g005
Figure 6. The CICIDS-2017 dataset training and testing sets distribution.
Sensors 22 00140 g006
Figure 7. PIR for multi-classification of (a) Bot-IoT, (c) NSL-KDD, (e) KDDCup-99, and (g) CICIDS-2017 and binary classification of (b) Bot-IoT, (d) NSL-KDD, (f) KDDCup-99, (h) CICIDS-2017.
Sensors 22 00140 g007
Figure 8. The average among the four datasets for (a) Training Binary, (b) Testing Binary, (c) Training Multi-classification, and (d) Testing Multi-classification.
Sensors 22 00140 g008
Figure 9. Confusion Matrix of developed method. (a) KDDCup99, (b) NSL-KDD, (c) BoT-IoT, (d) CICIDS-2017.
Sensors 22 00140 g009
Table 1. The basic formulation of the confusion matrix, where TP represents true positive, FN indicates false negative, false positive is represented by FP, and TN represents true negative.
Predicted Label
Actual LabelPositiveNegative
PostiveTPFN
NegativeFPTN
Table 2. Results of developed AQUa for the datasets in case of multi-classification.
TrainingTesting
AV Acc AV Sens AV Prec F1 AV Acc AV Sens AV Prec F1
KDD99PSO90.44793.45890.35890.35882.78385.79384.64083.109
WOA92.27593.12692.41497.30484.37585.22582.50187.351
BAT98.00798.24794.84797.33790.34790.58789.13490.093
TSO95.43994.91991.02797.43787.53687.01680.79187.479
GWO95.51392.38394.06298.48287.61884.48884.13188.533
FFA91.98893.36897.32891.53884.31885.69891.60984.285
MVO99.51592.83596.48394.43391.61584.93586.64984.480
MFO96.07397.12397.63198.37188.17589.22587.76388.420
AQU99.92099.91797.54299.92099.91992.04289.82489.987
BIoTPSO99.48399.48399.48399.48398.94298.97298.94198.940
WOA99.47299.47299.47299.47298.95698.96498.95799.005
BAT99.47599.47599.47599.47499.01999.02198.98799.012
TSO99.46099.46099.45999.45998.98698.98198.94199.005
GWO99.47799.47799.47699.47698.99098.95998.97599.019
FFA99.47999.47999.47899.47898.95498.96899.00798.949
MVO99.46899.46899.46899.46899.03198.96499.00098.980
MFO99.48099.48099.48099.48098.99899.00999.01399.020
AQU98.92598.92598.90498.92598.92698.90498.90598.904
NSL-KDDPSO90.11893.12890.02090.01966.09269.10268.91361.940
WOA91.94792.79792.08096.96867.95168.80171.13168.907
BAT97.66997.90994.50196.98973.67173.91173.50168.905
TSO95.07894.55890.65797.06771.33070.81071.29869.697
GWO95.18292.05293.72498.14371.06667.93672.15169.948
FFA91.66093.04096.99191.20167.43768.81775.87362.944
MVO99.18292.50296.14594.09375.22468.54475.20066.098
MFO95.74596.79597.29798.03571.62672.67676.12269.844
AQU99.34499.34499.29899.31576.00276.00281.71971.602
CIC2017PSO99.65099.37099.59099.75099.38099.10099.32099.480
WOA99.69099.69099.49099.45099.43099.43099.24099.190
BAT99.49099.64099.63099.44099.23099.38099.36099.180
TSO99.68099.71099.75099.68099.42099.45099.48099.420
GWO99.37099.56099.43099.38099.11099.30099.18099.120
FFA99.45099.74099.48099.60099.20099.49099.22099.350
MVO99.53099.37099.39099.41099.27099.11099.12099.150
MFO99.36099.43099.37099.48099.10099.17099.12099.220
AQU99.91199.90999.88999.91099.91199.91099.91099.888
Table 3. Results of developed AQUa for the datasets in case of Binary.
TrainingTesting
AV Acc AV Sens AV Prec F1 AV Acc AV Sens AV Prec F1
KDD99PSO90.44993.45990.35990.35982.77585.78584.63892.702
WOA92.27893.12892.41897.30884.60885.45886.69992.705
BAT94.99298.66292.92291.78287.38491.05587.28092.751
TSO95.29894.59290.82597.33287.59387.09085.28092.541
GWO95.51892.38894.06898.48887.86084.73088.35792.716
FFA91.98793.36797.32791.53784.32785.70791.61492.713
MVO99.51992.83996.48994.43991.84485.16490.76592.701
MFO96.07997.12997.63998.37988.41389.46391.92292.710
AQU99.92299.92292.25699.92299.92292.25694.28392.683
BIoTPSO99.89999.92999.89899.89899.89899.92899.89699.896
WOA99.91899.92699.91999.96799.91699.92499.91699.965
BAT99.97599.97799.94399.96899.97399.97599.94199.966
TSO99.94999.94499.90599.96999.94799.94299.90399.967
GWO99.95099.91999.93599.97999.94899.91799.93399.977
FFA99.91599.92899.96899.91099.91399.92799.96699.908
MVO99.99099.92399.95999.93999.98999.92299.95899.937
MFO99.95699.96699.97199.97899.95499.96499.96999.976
AQU99.99599.99499.99399.99599.99499.99399.99299.992
NSL-KDDPSO90.13393.14390.04390.04367.57570.58573.88267.163
WOA91.95992.80992.09996.98969.40970.25975.97274.115
BAT97.69397.93394.53397.02375.19275.43278.47374.197
TSO95.09194.57190.68197.09172.07871.55873.65673.786
GWO95.20292.07293.75398.17272.94469.81477.80175.609
FFA91.67393.05397.01391.22369.21870.59880.94468.451
MVO99.19792.51796.16794.11776.46669.78679.83571.059
MFO95.76096.81097.32098.06073.18774.23781.17675.162
AQU99.34899.34899.35099.34877.38277.38283.69277.077
CIC2017PSO99.68799.40799.62799.38799.68799.40799.62799.787
WOA99.73099.53199.53799.47099.73799.73799.53799.497
BAT99.53799.64799.66799.47299.53799.68799.66799.487
TSO99.72499.65499.74499.43699.72599.75599.78599.725
GWO99.41799.60799.47799.42799.41799.60799.47799.427
FFA99.49799.60199.51799.47099.49799.78799.51799.647
MVO99.57799.41799.42799.45799.57799.41799.42799.457
MFO99.40799.47799.41799.42799.40799.47799.41799.527
AQU99.99699.99699.99699.99699.99799.99799.99799.997
Table 4. Results of algorithms using Friedman test.
PSOMVOGWOMFOWOAFFABATAQUTSO
Binary classification
Accuracy185.336.3332694.33
Recall4.661.661.33734.33896
Precision1.3364.338374.6691.66
F1-Measure1.662.667.666.334.333.336.3393.66
Multi classification
Accuracy184.66632794.33
Recall52.16172.834896
Precision2.165.663.667.332.337.665.668.661.83
F1-Measure137.3374.3326.58.665.16
Publisher’s Note: MDPI stays neutral with regard to jurisdictional claims in published maps and institutional affiliations.

