Abstract
Diabetes patients are at risk of having chronic wounds, which would take months to years to resolve naturally. Chronic wounds can be countered using the electrical stimulation technique (EST) by dielectrophoresis (DEP), which is label-free, highly sensitive, and selective for particle trajectory. In this study, we focus on the validation of polystyrene particles of 3.2 and 4.8 μm to predict the behavior of keratinocytes to estimate their crossover frequency (fXO) using the DEP force (FDEP) for particle manipulation. MyDEP is a piece of java-based stand-alone software used to consider the dielectric particle response to AC electric fields and analyzes the electrical properties of biological cells. The prototypic 3.2 and 4.8 μm polystyrene particles have fXO values from MyDEP of 425.02 and 275.37 kHz, respectively. Fibroblast cells were also subjected to numerical analysis because the interaction of keratinocytes and fibroblast cells is essential for wound healing. Consequently, the predicted fXO from the MyDEP plot for keratinocyte and fibroblast cells are 510.53 and 28.10 MHz, respectively. The finite element method (FEM) is utilized to compute the electric field intensity and particle trajectory based on DEP and drag forces. Moreover, the particle trajectories are quantified in a high and low conductive medium. To justify the simulation, further DEP experiments are carried out by applying a non-uniform electric field to a mixture of different sizes of polystyrene particles and keratinocyte cells, and these results are well agreed. The alive keratinocyte cells exhibit NDEP force in a highly conductive medium from 100 kHz to 25 MHz. 2D/3D motion analysis software (DIPP-MotionV) can also perform image analysis of keratinocyte cells and evaluate the average speed, acceleration, and trajectory position. The resultant NDEP force can align the keratinocyte cells in the wound site upon suitable applied frequency. Thus, MyDEP estimates the Clausius–Mossotti factors (CMF), FEM computes the cell trajectory, and the experimental results of prototypic polystyrene particles are well correlated and provide an optimistic response towards keratinocyte cells for rapid wound healing applications.
1. Introduction
Chronic wounds, which are injuries that have not matured through the normal cure phase, are visible for much longer than a month. Patients with diabetes are at risk of experiencing chronic wounds. An enormous majority of people with chronic open wounds usually have other substantial health issues. Around 400 million individuals globally live with diabetes [1]. In developed countries, the lifetime risk of diabetes is 45–64 years old. In 2030, developing countries are predicted to have 82 million more people above 65 years old with diabetes compared with 48 million people in developed countries [1]. The availability and quality of wound care are the major problems faced by patients with chronic wounds to recover faster. The absence of availability of advanced wound care results in amputations and a lack of work performance [2]. Generally, the human skin consists of successive layers. The epidermis, which is the epidermal layer keratinocyte membrane and the outermost layer of the skin, serves as a body shield to the outside world and acts as the first line of defense [3]. The keratinocyte is the building block of the skin epidermis and plays a crucial role in the proliferative wound healing process. The inner layer is the dermis, which consists of fibroblasts that are responsible for the synthesis of extracellular matrix (ECM) which supports wound migration [4]. The electrical stimulation technique (EST) addresses wound critical factors for example, reducing bacterial infection, improving capillary density and local perfusion, boosting wound oxygenation, promoting granulation and fibroblast development, and accelerating wound healing [5].
The alternating current in the EST techniques, with its benefits and drawbacks, is given in Table 1 [6,7,8]. EST therapy requires electrical transmission through wound tissues, which is usually done through electrodes. EST is tested specifically for diabetic foot wounds and pressure, venous, and vascular ulcers and shows promising effects on the rate of wound healing and recovery. Thus, the dielectrophoresis (DEP) method is more suitable for wound care, which falls under an alternating current by using the theory of the electrical kinetics model, is used [9]. The DEP technique is best suited for particle and cell manipulation using FDEP, which utilizes dielectric polarization. DEP is reliable and has good sensitivity and selectivity [10,11,12]. In 1951, Pohl first coined the word “Dielectrophoresis”, which is the phenomenon in which the alternating current of a nonuniform electric field is applied. The force on one charge will differ from the force on the other charge, resulting in a net force on the particle. The force is known as the FDEP [13]. DEP can be used for the manipulation, transport, separation, and sorting of various types of particles [14]. DEP is widely applied in the fields of medical diagnosis, drug discovery, cell therapy, and particle filtration [15]. The polystyrene particles have stable physicochemical properties and are used in the biochemical field because their size distribution is analogous to cells, including bacteria (2–4 µm) [16], red blood cells (7–8 µm) [17], liver cells (20–30 µm), and several cancer cells (10–30 µm) [18]. Moreover, polystyrene particles can provide potential factors for the manipulation of biomedical particles [15,19]. The keratinocyte cells are isolated from the human epidermis and have an average diameter of 7.96 μm approximately. However, the dermal layer of fibroblast cells is around 49 μm in size. The size of polystyrene particles is (2.5:10.2) µm decreased compared to standard keratinocyte and fibroblast cells, respectively, for effective particle manipulation and visualization. The polystyrene particle is subjected to EST to manipulate and synchronize the dispersed particle to the desired location.

Table 1.
Alternating current features in the electrical stimulation technique (EST).
The poor chronic wound heal scenario motivates us to incorporate a solution of DEP in diabetes rapid wounds healing. The DEP technique is used to manipulate and synchronize cells on human skin from the scattered position to the target location for the rapid healing of wounds. The keratinocyte cells play a crucial role in tissue repair through the EST. The prolonged application of EST can cause discomfort and even skin burns [20]. The aim of this study is therefore to investigate the short-term DEP effect of EST on wound healing.
Jonathan Cottet et al., in 2018, invented the new computational tool, MyDEP, which is a piece of stand-alone software (https://mydepsoftware.github.io, accessed on 11 January 2019) specially designed to study the dielectric particles and cell’s response to the AC electric field [21]. To investigate the electric field distributions and particle trajectory within the microchannel, a numerical model was solved using finite element analysis in COMSOL Multiphysics 5.5. (COMSOL Inc., Burlington, MA, USA). It is used to predict the DEP force (FDEP) exerted on the particles and cells [22]. Simulation results show how the cell trajectories change with the increasing frequency range. Microelectrodes with two-dimensional geometry were created for particle tracking. This study involved multiphysics such as AC/DC, fluid flow, and particle tracking for fluid flow. It allowed for the comparison of experimental and simulation results. As a result, the device’s performance should be predicted by these simulations [23,24]. The 2D/3D motion analysis software (DIPP-MotionV) software examines image tracking and analyses data from experimental DEP recorded video. As a result, the average speed, acceleration, and trajectory position of the cells are calculated.
In this present work, we have conducted the manipulation of 3.2 and 4.8 µm polystyrene particles by using DEP for the effective manipulation of alive keratinocyte cells. The results obtained from a polystyrene particle of 3.2 and 4.8 μm serve as a cross-reference to predict the behavior of keratinocytes to evaluate their crossover frequency (fXO) using the FDEP for cell manipulation. This is the significant reason for choosing the polystyrene particle. The prototypic polystyrene particles are widely used in the performance and quantitative evaluation of DEP systems to demonstrate the feasibility of the proposed highly sensitive biological cells. Furthermore, a numerical model involving MyDEP is performed, and its Clausius–Mossotti factors (CMF) and relevant particle orientation at various frequencies are determined. Additionally, the finite element method (FEM) is performed to track the particle mobility via applied input frequencies obtained from MyDEP. The numerically analyzed prototypic polystyrene particles of 3.2 and 4.8 μm have been practically tested. The particle trajectories are determined by applying an electric field to the tapered electrode based on its specific frequencies. In addition to target keratinocyte cells, the fibroblast cells are numerically investigated due to their different biophysical properties. In the case of keratinocyte and fibroblast cells, its corresponding frequencies were found from MyDEP and FEM. Thus, the evaluated frequencies from the MyDEP plot are well agreed with FEM computations for polystyrene particles, keratinocyte, and fibroblast cells. The prototypic polystyrene particles and alive keratinocyte cells are practically examined. The keratinocyte cells are analyzed in detail with DIPP-MotionV. Hence, this present study was attempted to manipulate alive keratinocyte cells for the development of quick wound healers based on the DEP technique.
2. Materials and Methods
The materials used during the experiment include fluorescent polymer microspheres, such as polystyrene beads of various sizes. The beads are purchased from Thermo Fisher Scientific (Fremont, CA, USA) and used in the preparation of all aqueous solutions. A mixture of 3.2 (20 µL) and 4.8 (20 µL) µm polystyrene particles in deionized (DI) water (60 µL) was prepared at a 1:1:3 ratio. Due to the low conductive suspension medium, it is directly applicable to DEP manipulation. Human Epidermal Keratinocytes (HEK) cells are cultured in a humidified incubator at 5% CO2 and 37 °C in Epilife suspension medium, which was purchased from (CTERM, HUKM, WP Kuala Lumpur, Malaysia).
This study focuses on the development of a rapid healer for chronic wounds. We have established the numerical simulation of polystyrene particles, keratinocyte, and fibroblast cells are analyzed using the MyDEP plot. The FEM analysis of polystyrene particles, keratinocyte, and fibroblast cells is executed in two different studies. The FEM findings include the electric field distribution, and the particle trajectories at different frequencies are analyzed. Furthermore, the 3.2 and 4.8 µm polystyrene particles and keratinocyte cells are manipulated by DEP using the fabricated tapered electrode. The keratinocyte cells are interpreted with DIPP-MotionV. Thus, the experimental results almost match the numerical data.
2.1. FDEP Theory
The FDEP, acting on a dielectric particle suspended in a medium in an electrical field, can be approximated as Equation (1) [25]
where εm is the medium relative permittivity surrounding the sphere, represents the particle radius of polystyrene particles, keratinocytes, and fibroblast cell, Erms is the root-mean-square of the applied electric field, and fCM is the CMF of the cells describing their polarization with respect to the surrounding medium. In this case, the selective manipulation and the separation of particles with equivalent sizes depend on the real part of the CMF. FDEP is equivalent to the real part of the CMF, which is the in-phase attribute of the electrical polarization induced by the particle and associated with the spatial nonuniformity including its electric field [26].
where and represent the complex permittivity of the particle and the medium, respectively, Equation (2) indicates that CMF depends on the electrical properties of the particle and the medium [27,28]. The CMF is determined based on the intrinsic dielectric properties of particles, which result in the fXO for each particle. The biological cell’s dielectric properties of capacitance and resistance reflect the plasma membrane composition, structure, cytoplasm, and nucleus of the cell. Each particle has different conductivity values. Thus, the polystyrene particles have sizes of 3.2 and 4.8 µm, which are calculated using the formula:
where σp indicates the particle’s electrical conductivity, σbulk denotes the bulk conductivity and Ks is the surface conductivity (i.e., polystyrene particles σbulk = 1 × 10⁻¹⁶ S/m, Ks = 2 × 10⁻⁹ S/m) [29]. Equation (3) indicates that the conductivity of particles is controlled by the surface conductivity and inversely proportional to the particle size. As such, the conductivity of the bulk becomes smaller than the conductivity of the surface and is ignored. The electrical conductivity values obtained for 3.2 and 4.8 µm polystyrene particles are 2.5 × 10⁻³ and 1.6 × 10⁻³ S/m, respectively.
The FDEP in Equation (1) is an easy and effective means of controlling particles. When the particle becomes more polarizable than the medium, the particle is believed to be attracted to the field as a positive DEP (PDEP). By contrast, whenever the particle becomes less polarizable than the medium that allows the particle to repel from high-field regions, this is known as negative DEP (NDEP). Theoretically, the FDEP direction should alternates at the crossover frequency (fXO) when the induced particle transforms from PDEP to NDEP or vice versa. When the net charge is set to PDEP = NDEP = 0. As the particles are in a static position, the particle (FDEP = 0).
2.2. MyDEP for Numerical Simulations
MyDEP is a piece of computational software, a stand-alone application written in Java (Version v1.0.1). Zenodo (http://doi.org/10.5281/zenodo.2537957 (accessed on 11 January 2019)) evaluates the CMF of particles and cells. It is useful for predicting particle and cell responses to an electric field. The main criteria for estimating the cell mobility response require the detailed electrical and geometric parameters of the particles as an input specification [21]. This approach is used to analyze the CMF of the real and the imaginary phase of both particles and the suspension medium. The basic terminology to simulate the CMF plot requires the three modes of parameters from the literature, such as the (a) dielectric properties of the conductive medium, (b) input frequency range, and the (c) model of the cells or particle geometry and its dielectric properties. The characteristics of the used cells are listed in Table 2 [30,31,32]. The subsequent step is to establish the input frequency from 1000 Hz to 1 GHz.
Table 2.
Characteristics of keratinocyte and fibroblast cells.
Cell modelling is an essential step in MyDEP, in which polystyrene particles are a homogenous mixture, and the biological cells, such as keratinocyte and fibroblast cells, are classified as the single shell. The single-shell model consists of a cytoplasm covered by a cell membrane. The geometry of the particle or cells, such as shape and size, are considered. The polystyrene particle, also known as polymer microspheres, has a spherical shape. The dielectric properties of the particle include (a) electrical conductivity and (b) relative permittivity. These properties are used from the past study to simulate the following plot. The CMF to determine the orientation of the FDEP is calculated from Equation (1) using the MyDEP plot.
In general, permittivity is different for various biological tissues, providing unique dielectric signatures. The dielectric properties of keratinocyte cells are studied using dielectric spectroscopy [30]. Additionally, the same is numerically evaluated using the finite element method. Whereas the fibroblast cells (HL-60 cells) [33] are used as a reference, their dielectric parameters are determined from electrorotation measurements. The membrane and cytoplasm layer conductivity and permittivity are shown in Table 6. Relative to polystyrene particles of a single homogeneous model, the biological cells usually show more complex DEP behavior due to the multi-layered membrane and intracellular structures. In the present study, biological cells such as the keratinocyte and fibroblast cells are approximated as a single-shell model, and it is presented in Figure 1. The keratinocyte, fibroblast cells, and polystyrene particles with their respective Re [fCM] are evaluated. Those formulas are provided in the Supplementary Materials.
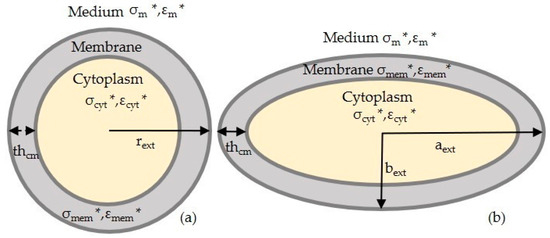
Figure 1.
Geometry of the single-shell model: (a) keratinocyte cell and (b) fibroblast cell. An asterisk (*) indicating complex permittivity.
2.3. FEM Simulation
This numerical model was performed by a commercial FEM package (COMSOL Multiphysics 5.5, www.comsol.com, accessed on 14 November 2019). The establishment of particle manipulation with a tapered DEP microelectrode uses two key steps.
- Study 1, the electrical current and the laminar flow interface are used. Electric current defines the electrical potential and it is conducted in a frequency domain (AC). The laminar flow is interlinked to the stationary study.
- Study 2 involves the particle tracing for fluid flow interface. This interface relies on the results from Study 1. The coupling was achieved by interlinking the frequency domain solution of Study 1 to solve the particle trajectory with FDEP. The coupled equation system of Study 2 was solved using the acquired Study 1 solution; therefore, Study 1 and 2 are interlinked. A time-dependent study was used to support this analysis.
The tapered electrode geometry is created in a two-dimensional model. We defined the material for the tapered electrode as aluminum, and for the fluidic channel we used low conductive DI water, while for the high conductive medium we used Dulbecco’s modified eagle medium/nutrient mixture F-12 (DMEM/F-12), and Dulbecco’s modified eagle medium (DMEM). The three kinds of the interface were chosen for particle trajectories in Figure 2 with its respective solver, and the governing equation is given. Firstly, the electric current interface solves a current conservation equation based on Ohm’s law. The continuity equation in Ec must be considered when handling stationary electrical currents in conductive media. The current conservation node adds the continuity equation for the electrical potential and provides an interface to define the electric conductivity (σ) as well as the relative permittivity (ε) for the displacement current and utilizes the equation in Ec. The initial values node acts as an initial condition for the electric potential (initial values = 0 V). In the electric insulation node, all boundaries are selected except electric potential edges and utilized boundary condition , where no electric current flows into the boundary. In the electric potential node, set the input voltage V0 to +10 V and −10 V using boundary condition V = V0. The value of the potential is defined at the edges of an electrode to solve electric potential.
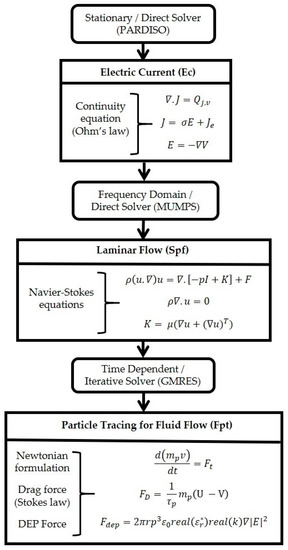
Figure 2.
Flowchart with governing equations and solver for each interface.
Secondly, the laminar flow interface is used to calculate the pressure fields for the flow of a single-phase fluid. The Navier–Stokes equations are for the conservation of momentum and the continuity equation for mass conservation in Figure 2, Spf being solved by the laminar flow interface. The fluid properties node adds the momentum and continuity equations and defines the density and viscosity of the fluid according to the conductive medium. The initial values for the velocity field u and the pressure p are specified zero. The pressure point constraint may be used to specify the pressure level. The relative pressure value is determined by specifying the boundary condition for pressure P = P0, where (P = 0 Pa), P0 represents the absolute pressure. The pressure for fluid flow is 0 Pa, considered to be negligible. The wall node contains a set of boundary conditions, U = 0, that describe fluid-flow conditions in the stationary study. By default, the no-slip wall condition is used.
Finally, the particle tracing for fluid flow interface is used to compute the motion of particles in a background fluid. Particle motion is driven by drag and FDEP, its wall condition stated as Freeze in V = Vc. Thus, after contact with the wall, the particle positions no longer change. Besides, specified particle properties such as charge number and particle velocity based on the Newtonian formulation in Fpt are given in Figure 2 [34]. The particles released from the grid node are used for locating the particle position in the tapered electrode and its initial coordinates for two types of particles/cells are in Table 3.
Table 3.
Particle release from grid with its initial coordinates.
During the experiment, the mixture of a particle is used in the region of interest (ROI). However, for a clear vision of FEM analysis, we have considered the 3.2 µm polystyrene particle or keratinocyte in the left and the 4.8 µm polystyrene particle or fibroblast in the right of the tapered electrode using boundary condition Q = Q0 and V = V0. The polystyrene particles, keratinocyte, and fibroblast cells are released from the grid node in the ROI. Furthermore, drag force has been calculated in Fpt using the Stokes law, which specifies the velocity field and material properties for particle motion in a laminar flow. The FDEP equation expressed in Fpt Figure 2 and specified the particle and fluid properties. The FDEP node is used to exert a force on the particles. The force is specified via an electric field. The influence of the FDEP on the particles depends on the difference in permittivity between the particles and the fluid. When εp > εm, the particles are attracted to regions where the absolute electric field is strong. When the εp < εm, the particles are attracted to regions where the absolute electric field is weak.
Particle velocity is obtained from Drags law given in Fpt, shown in Figure 2. The drag law used and the rarefaction effects applied to the drag force determine the particle velocity response time, where τp is the particle velocity response time. The forces acting on each particle are verified from the external fields using a pre-solved electric field in the angular frequency method each time the solver takes a step. Later, chosen particles to affect the list, are used to apply the force to particle position. Additionally, piecewise polynomial recovery is used for specific particles. Added shell subnodes, due to a single shell, are used on specific particles. Added shell subnodes are due to a single-shell model of biological cells. In the case of polystyrene particles, no shell subnodes are added, and the particle is treated as a homogeneous sphere for computing FDEP.
The two-dimensional geometry of the modelling microelectrode device is presented in Figure 3a. Furthermore, the microelectrode device consists of an ROI that contains a structure of tapered electrodes of alternating polarity that regulates the particle trajectories. The fluid medium is considered an ROI, where the material is added as a droplet in the practical study. While in the DEP experiment, the particles or cells are dispersed to the top of the microelectrode surface using a droplet technique, the volume of the sample distribution is assumed to be similar to the FEM analysis. A non-uniform electric field is applied to the tapered electrode, resulting in higher field intensity on the top and bottom edges of the microelectrodes are presented in Figure 3b. In the case of PDEP, the input electrical field is applied, which in turn generates a lateral force in the microelectrode and causes the particles or cells to be drawn to high field intensity. While in NDEP the input field generates a lateral force, in the electrode this leads to the particles or cells in that region traveling up to the top of the electrode. The electrode dimensions, such as the width (W), height (H), an inclination of 75°, and the angles A2 that indicate the inclination of 15° in a rectangle, make the electrode tapered. The ROI has a total width (W4) of 280 µm and height (H3) of 80 µm and all the dimensions are presented in Table 4. The meshing element size is normal and the user-controlled sequence type is used throughout the simulation.
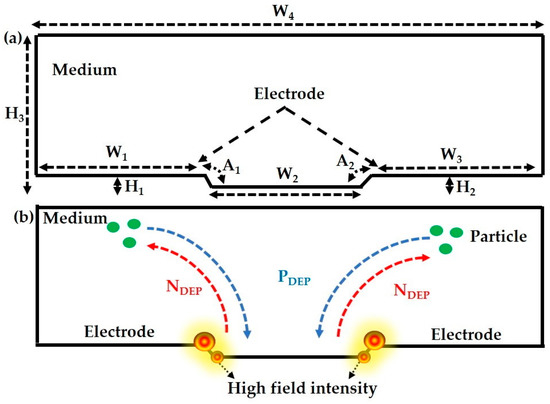
Figure 3.
Tapered microelectrode geometry with specifications: (a) 2D geometry of a tapered microelectrode device; (b) illustration of a particle trajectory sequence in a tapered microelectrode.
Table 4.
Tapered microelectrode dimensions.
2.4. Fabrication of a Microelectrode
The tapered aluminum microelectrode arrays (TAMA) are fabricated using the CMOS processing approach and implemented on a Si substrate. The initial step requires a plasma-enhanced chemical vapor deposition (PECVD) method for the deposition of 1.15 µm SiO2 as an insulator layer upon the uppermost part of the Si substrate, followed by the deposition of a thin titanium/titanium nitride (Ti/TiN) adhesion layer with a thickness of 60/30 nm. Furthermore, the following step involves Ti/TiN deposition of a 4.0 m thick aluminum/silicon/copper layer (Al/Si/Cu-98 wt.%/1 wt.%/1 wt.%) using physical properties. To transfer the square array design to the Al/Si/Cu layer, UV curing for photoresist hardness is used. Finally, Al/Si/Cu is etched using an inductively coupled plasma (ICP) etcher for metal etching via an advanced plasma-resistant stripe. An additional resist tapered profile formation step is implemented before the final Al/Si/Cu etch step. The new combination of resistant profile process and etching technology provides the desired tapered angle of profile for microelectrodes. Resist plasma etching through reactive ion etching (RIE) and metal etching by ICP methods can be used together to develop a desired tapered microelectrode profile [35,36,37].
2.5. DEP Experimental Setup
The pictorial perspective of the experimental design is illustrated in Figure 4a. The experimental manipulation process of polystyrene particles is carried out using a trinocular microscope (MOTIC-BA400) installed with a conventional microscope. An additional eyepiece microscope camera (Dino-Eye, AM7025X) is fixed to the eyepiece microscope for video recording. The Dino-Capture 2.0 software supports the image processing investigation to predict the particle DEP effect. The camera recorder is connected to the system to monitor and record the movement of particles, while the manipulation of keratinocyte cells is performed using a fluorescence microscope (OLYMPUS-BX53M). Visual monitoring of the keratinocyte cell DEP effect is supported by the cellSens standard software. The input sinusoidal electrical signals from a function generator (Teledyne LeCroy-WaveStation, 2022; 20 V peak to peak, 15 MHz) are directly connected to the prober, and its positive and negative terminals are linked to supply a voltage of different frequencies to the microelectrode.
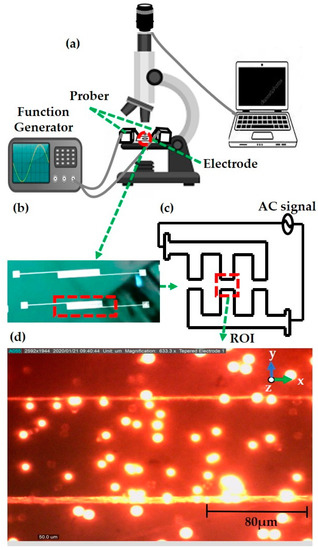
Figure 4.
Overview of the dielectrophoresis (DEP) framework: (a) pictorial view of the experimental setup; (b) fabricated tapered electrode; (c) top view of the tapered microelectrode; (d) region of interest (ROI)—particle in a tapered electrode.
A droplet of the prepared mixture of polystyrene particles or cultured keratinocyte cells (0.2–0.5 µL) is dispersed on the top of the tapered microelectrode surface later covered with a glass slip to visualize the FDEP behavior. Proper filter selection is the key to use successful fluorescence microscopy. Barrier filters are filters designed to suppress or block (absorb) the wavelengths of excitation and allow only selected wavelengths of emission to pass to the eye or other detector. In the polystyrene particles experiment, the green excitation filter is used, which covers an excitation wavelength range between 510 and 560 nm, while the keratinocyte cells are visualized in bright field mode.
The different magnification ranges are focused. Microelectrode identification is performed by initially viewing at 4×, 10×, and 40× for the visualization of enlarged particles. However, the electrode length is calibrated to 80 µm. In the case of polystyrene particles, a total of 22 tests are performed using the same input voltage of 10 voltage peak to peak (VPP) with the applied frequency in the range of 100–500 kHz, and 20 kHz increment steps are applied to the microelectrode for up to 30 s for every test run. In the keratinocyte cell experiment, 15 tests were conducted with 10 VPP applied voltage at a frequency of 100–900 kHz, 1–25 MHz, 100 kHz, and 5 MHz, respectively, with progressive changes applied to the tapered electrode at the 30s per test. The illustrative view of the fabricated tapered electrode is indicated in Figure 4b. The overall top view of the TAMA layout is represented in Figure 4c and the region of interest (ROI, Figure 4d). The FDEP behavior is experimentally measured, and the lateral attraction or repulsion is observed at the ROI. The space gap on each side is 80 μm, and microelectrodes with a square array display 1100 × 1100 µm.
2.6. DIPP-MotionV Motion Analysis
2D/3D motion analysis software (DIPP-MotionV) investigates the image tracking and data analysis of keratinocyte cells. As an outcome, this analysis generates the average speed, acceleration, and trajectory position of the cells to be interpreted based on the experimental keratinocyte cell measurement movie. The motion analysis has been done using the desired recorded video from the experiment, and the step-by-step procedure for motion analysis is elaborated in the Supplementary Materials.
3. Results
3.1. Numerical Analysis by MyDEP
Simulation is widely used to define an optimized design to improve particle or cell capture. Thus, MyDEP is used to estimate the CMF and fXO of polystyrene particles of various sizes, keratinocytes, and fibroblast cells and in their conductive medium. Particles experience a PDEP or NDEP effect based on the polarity of the real part , which varies from +1 to −1/2 and −3/4 for the imaginary part [13]. Notably, the CMF is plotted only for the real part because it is the only contribution to DEP (the imaginary part relates to electrorotation, another AC electrokinetic effect). Table 5 includes the dielectric properties of low and high conductive media, such as DI water, DMEM/F-12, and DMEM. The effective dielectric values and sizes of 3.2 and 4.8 μm polystyrene particles, keratinocytes, and fibroblast skin cells are shown in Table 6.
Table 5.
Dielectric properties of high and low conductive medium.
Table 6.
Specifications of polystyrene particles with sizes of 3.2 and 4.8 µm, epidermal layer keratinocytes, and dermal layer fibroblast cells.
3.1.1. Modelling of Polystyrene Particles
Polystyrene particles are usually homogeneous in nature and spherical in shape. The polystyrene particles work well in DI water, a low conductive medium. MyDEP software is used to accurately model the resulting graph by incorporating Table 6 dielectric values. At zero baselines, the curves transition from PDEP to NDEP is recognized as fXO. The CMF curve of the polystyrene particles is shown in Figure 5. It shows that the above zero baselines correspond to a PDEP region, which is the movement of particles attracted to a high field intensity.
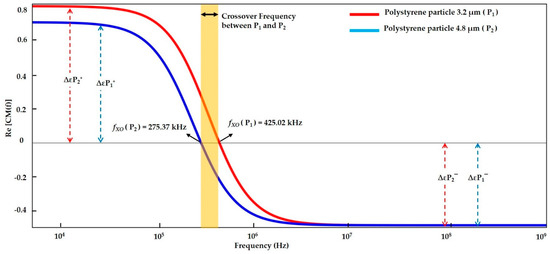
Figure 5.
Clausius–Mossotti factors (CMF) of polystyrene particles with sizes of 3.2 and 4.8 µm.
The particles are attracted to the electrode, whereas below zero baselines are considered to be an NDEP region, which means that the particle is repelled from a high field intensity, and the majority of the particles accumulate in the low-field intensity region. The total crossover range reflects that the mobility of particles within this range is static and lies dynamically between two fXO. The equilibrium state is reflected by PDEP = NDEP = 0 net charge.
The polarization factors of the 3.2 and 4.8 μm polystyrene particles are observed to have fXO values of 425.02 and 275.37 kHz, respectively. The simulation findings show that the smallest size of polystyrene 3.2 μm particle tends to have a high fXO of 425.02 kHz. By contrast, the 4.8 μm polystyrene particle has a large particle size with a low fXO of 275.37 kHz.
3.1.2. Modelling of Keratinocyte and Fibroblast Cells in a Low Conductive Medium
The basic internal characteristics for the epidermal layer keratinocytes and the dermal layer fibroblast cells for the MyDEP simulation to examine the CMF and the fXO of biological skin cells are summarized in Table 6. The manipulation of the cells is accomplished through the influence of dielectric properties and it can distinguish various cell types.
The keratinocyte and fibroblast cell’s behavior to the frequency in a low conductive medium are presented in Figure 6. The fXO is indicated for the defined medium, and the transition from the PDEP to the NDEP regime is 28.10 and 510.53 MHz, respectively. The two cells can be manipulated between these frequencies based on their electrical properties. Thus, MyDEP analysis estimates that the small-sized epidermal keratinocyte cell has fXO at 510.53 MHz, and the fibroblast cell of the largest size tends to have fXO at 28.10 kHz. Each particle has a distinct atomic structure, creating different polarization factors for each particle. Through this design, the orientation of the FDEP is determined.

Figure 6.
CMF result for epidermal layer keratinocyte and dermal layer fibroblast cells in low conductive medium.
3.1.3. Modelling of Keratinocyte and Fibroblast Cells in a High Conductive Medium
The CMF curve of the keratinocyte and fibroblast cells in the high conductive medium of DMEM/F-12 and DMEM, respectively, are shown in Figure 7. It could theoretically and experimentally be proven in the literature that cells exhibit exclusively NDEP if suspended in highly conductive media. Therefore, the particles/cells can be repelled from surfaces by appropriate arrangements of electrodes that can easily be manipulated in free solution [42]. From the plot at all frequency ranges, the keratinocyte and the fibroblast cells experience NDEP. The cell is repelled from the high field intensity compared to the fibroblast cell, the keratinocyte cell experiences strong NDEP due to its high electrical conductivity value and the same is demonstrated in Section 3.2.4.
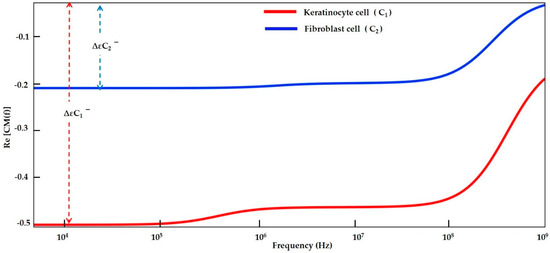
Figure 7.
CMF plot for keratinocyte and fibroblast cells in dulbecco’s modified eagle medium/nutrient mixture F-12 (DMEM/F-12) and dulbecco’s modified eagle medium (DMEM) in high conductive medium.
3.1.4. Numerical Result Evaluation of Polystyrene Particles and Biological Skin Cells
The data from the MyDEP plot in Figure 5, Figure 6 and Figure 7 is analyzed and reported in Figure 8. The polystyrene particles with sizes of 3.2 and 4.8 µm in the low conductive medium have a PDEP in the range of 0 to 275.37 kHz, where the particles are assumed to be attracted to a high field intensity. By contrast, the particles greater than 425.02 kHz are NDEP, which causes the movement of particles repelled from high field intensity, whereas the polystyrene particle 4.8 μm is fXO in the range of 275.37 kHz and the polystyrene particle 3.2 μm is fXO at 425.02 kHz. Thus, the particles experience an equilibrium state and are almost static. The MyDEP plot is calculated based on its dielectric properties to estimate their particle mobility and orientation of the FDEP. Relative to the polystyrene particle, the keratinocyte and fibroblast cells in the low conductive medium have a PDEP response from 10 kHz to 28.10 MHz. NDEP is predicted to be above 510.53 MHz, and an fXO response is in a wide range of 28.10 MHz and 510.53 MHz for the keratinocyte and fibroblast cells, respectively. Similarly, for the keratinocyte and fibroblast cells in high conductive medium, DMEM/F-12 and DMEM are observed. At an entire frequency range from 10 kHz to 750 MHz, the keratinocyte and fibroblast cells exhibit NDEP. Based on the interpretation of MyDEP data, the predicted frequency is proven in the Section 3.2 FEM analysis. Similarly, the experiment of the keratinocyte cell in high conductivity medium and the obtained DEP behavior is demonstrated in Section 3.3.2.
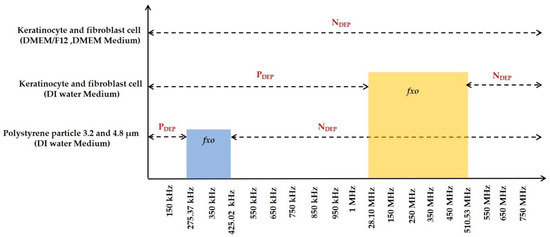
Figure 8.
Performance analysis from the MyDEP simulation of polystyrene particles, epidermal layer keratinocyte, and dermal layer fibroblast cells.
3.2. FEM Analysis
The steady-state or stationary study and frequency domain (AC) are solved to evaluate the distribution of electric potential in the channel. A time-dependent study is done using a pre-solved solution from the frequency domain in an electric field. The particle trajectories of 3.2 µm polystyrene particle or keratinocyte and 4.8 µm polystyrene particle or fibroblast cells under the influence of DEP and drag forces are used to estimate particle tracing. The main idea of this simulation is based on these three different effects: When the applied frequency is fixed below the fXO, the particle or cells are displaced toward the region of maximum field intensity, which is referred to as PDEP. When the applied frequency is higher than the fXO magnitude, the particles are forced to move towards the regions of minimum field intensity, which is referred to as NDEP. At the fXO, the particles are in an equilibrium state.
3.2.1. Electric Current
Particle trajectory is controlled by the applied electric potential of 10 V to +10 V in the tapered electrode. Study 1 is used for the stationary and frequency domain, which solves the pressure, and AC electric potential. The geospatial electric potential of the microelectrode is indicated in Figure 9. In the initial step of the simulation, we have applied a non-uniform electric field to the electrode. The FDEP is acquired on the positive electrodes (+10 V) and the negative electrodes (−10 V) with the contour of an electric field in Figure 9a. The particle tracking is established on the respective frequency varies based on the stationary study of the tapered electrode edges with a high field intensity spot. This phenomenon leads to particle attraction or repulsion from the electrodes [43]. The tapered electrode edge with two high field intensity spots is illustrated in Figure 9b with its enlarged view.
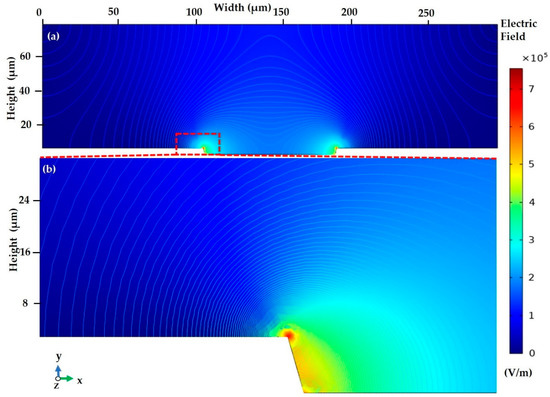
Figure 9.
At stationary study: (a) spectral change in electrical field in the tapered microelectrode with contour plot; (b) the enlarged view of the high field intensity spot at the edges of the microelectrode.
3.2.2. FEM of Polystyrene Particles
The FEM analysis for 3.2 and 4.8 µm polystyrene particles is implemented using a similar methodology as keratinocyte and fibroblast cells. Furthermore, the exploration of the polystyrene particles using FEM is elaborated as follows. The particle tracking for fluid flow (fpt) is computed, which generates three different cases of particle/cell analysis, and its relevant computation results are shown below.
Case 1: The polystyrene particles of 3.2 and 4.8 µm experience PDEP at a low frequency and are attracted to a high field intensity spot, near the electrode edges. In Figure 10a, the particles at the initial step at 0 s in the microelectrode were spread uniformly in the ROI. Particle tracing with the applied frequency at 140 kHz is implemented, and the majority of cells move towards the high field and get attracted to the electrode in a lateral direction and experience PDEP with its instantaneous particle velocity, as is presented in Figure 10b. Thus, at 140 kHz, both the 3.2 and 4.8 µm polystyrene particles experience a significantly larger magnitude of PDEP, and their corresponding particle velocity is high, which reaches the designated tapered electrode within a short timescale. As a result of the strong PDEP response at a low frequency, the trajectory particle is very straight and outside the maximum intensity spot.
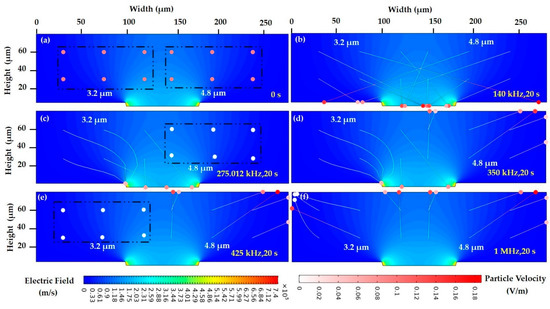
Figure 10.
Particle trajectories at (a) the initial stage at 0 s with an initial particle velocity of 0 m/s, (b) 140 kHz, 20 s, 3.2 and 4.8 µm—PDEP, (c) 275.012 kHz, 20 s, 3.2 µm—PDEP, 4.8 µm—fXO, (d) 350 kHz, 20 s, 3.2 µm—PDEP, 4.8 µm—NDEP, (e) 425 kHz, 20 s, 3.2 µm—fXO, 4.8 µm—NDEP, and (f) 1 MHz, 20 s, 3.2 and 4.8 µm—NDEP. The color gradient of the trajectory line indicates the instantaneous particle velocity u ranging from 0 m/s (white) to 0.16 m/s (dark red). The contour and intensity of the electric field are indicated by the background blue color.
Case 2: The polystyrene particles acquire the equilibrium position in two separate fXO. However, in the intermediate frequency, the 4.8 µm polystyrene particles undergo NDEP, and the 3.2 µm polystyrene particles are attracted to high field intensity PDEP. At an applied frequency of 275.012 kHz, the 3.2 µm polystyrene particles get accumulated to high field intensity through lateral force, i.e., PDEP. The 4.8 µm particles are almost static with a velocity of 0 m/s, as is presented in Figure 10c. The fXO is achieved through PDEP = NDEP = 0 [44]. The intermediate frequency applied between the two fXO ranges at 350 kHz. Thus, the 3.2 μm polystyrene particles are attracted towards the high field intensity, PDEP and the 4.8 µm particles are repelled from the high field, and NDEP is presented in Figure 10d. Its particle’s orientation and migration are displayed in trajectory lines. The 3.2 µm polystyrene particle is very close to the crossover frequency range of 425 kHz, resulting in a slightly lower magnitude of PDEP response than at 140 kHz, which resembles the CMF plot in Figure 5. Hence, Figure 10c at 275.012 kHz and Figure 10d at 350 kHz, which depict PDEP, show curved trajectories near the maximum intensity spot. In Figure 10e, the 4.8 µm particles at 425 kHz are shifted to a low field spot; meanwhile, the 3.2 µm polystyrene particles are stagnant without large movement with a particle velocity of 0 m/s.
Case 3: Both cells are repelled from high field intensity, and the particle exhibits NDEP. At 1 MHz, both particles got repelled to high field intensity, i.e., NDEP. Thus, the 3.2 and 4.8 µm polystyrene particles reach the low field spot with a short-time interval due to their different particle properties. Thus, FEM simulation estimates that 4.8 µm particles are attracted more rapidly than 3.2 µm polystyrene particles. In Figure 10f, the particle that appears in the white color indicates 0 m/s velocity, and the red color indicates 0.16 m/s. The 4.8 µm polystyrene particles are attracted rapidly with their velocity of approximately 0.06 m/s compared to the 3.2 µm polystyrene particle (three particles in 0 m/s).
3.2.3. FEM of Biological Cells in a Low Conductive Medium
The particle trajectory in the low conductive medium, for keratinocyte and fibroblast cells, experiences three different cases.
Case 1: The keratinocyte and fibroblast cells experience PDEP and are attracted to high field intensity, near the tapered electrode. At 15 MHz, the cells were distributed evenly at 0 s in the ROI, as shown in Figure 11a. The majority of cells move towards a high field intensity and get attracted to the electrode in a lateral direction and experience PDEP at 20 s, as shown in Figure 11b. Keratinocytes cells have a greater force and are more deflected and their instantaneous particle velocity is presented with different color levels.
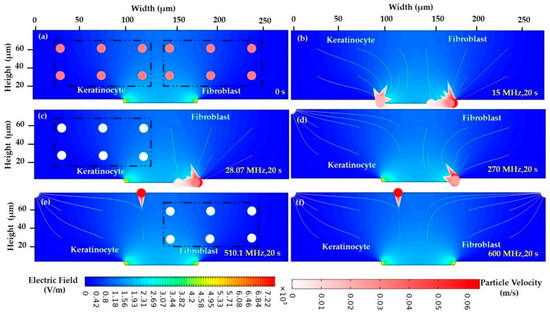
Figure 11.
Particle trajectories in low conductive medium at (a) the initial stage at 0 with an initial particle velocity of 0 m/s, (b) 15 MHz, 20 s, keratinocyte and fibroblast—PDEP, (c) 28.07 MHz, 20 s, keratinocyte—PDEP, fibroblast—fXO, (d) 270 MHz, 20 s, fibroblast—PDEP, keratinocyte—NDEP, (e) 510.1 MHz, 20 s, fibroblast—fXO, keratinocyte—NDEP, and (f) 600 MHz, 20 s, keratinocyte and fibroblast—NDEP. The color gradient of the trajectory line indicates the instantaneous particle velocity u ranging from 0 m/s (white) to 0.6 m/s (dark red). The contour and intensity of the electric field are indicated by the background blue color.
Case 2: The fXO for both cells is attained in a specific frequency and the cell has no response and is in a static position, while in the intermediate frequency, the keratinocyte cell undergoes NDEP, and the fibroblast cell moves towards the electrode, attracted to high field intensity, i.e., PDEP. At 28.07 MHz, the fibroblast cell is attracted to high field intensity through lateral force, i.e., PDEP, whereas the keratinocyte cell is stable and inactive with a particle velocity of 0 m/s, as presented in Figure 11c. In this condition, PDEP = NDEP = 0, the keratinocyte cell of 270 MHz (in-between range of 28.07 and 510.1 MHz). Thus, the fibroblast cells are moved towards the high field intensity, PDEP, and the keratinocyte cells are repelled from the high field, NDEP, as presented in Figure 11d. Its cell’s orientation and migration are displayed in trajectory lines. In Figure 11e, most of the keratinocyte cells are attracted to low field intensity, NDEP. Meanwhile, the fibroblast cells are static in an equilibrium position with a particle velocity of 0 m/s at 510.1 MHz.
Case 3: Both cells are repelled from high field intensity, and the cells encounter NDEP. At 600 MHz, the keratinocyte and fibroblast cells are shifted to the low field intensity with instantaneous particle velocity, as presented in Figure 11f. The keratinocyte and fibroblast cells are repelled to high field intensity experiences, NDEP.
3.2.4. FEM of Biological Cells in a Highly Conductive Medium
The DEP technique is most suitable for low conductive samples. Biological cells such as keratinocyte and fibroblast cells are usually cultured in high conductive media (DMEM/F-12, DMEM). The difficult aspect is that living cells in a low conductive medium are very sensitive. However, the alive keratinocyte cells in a high conductive medium are experimentally manipulated and exhibit NDEP.
Case 1: In a high conductive medium, the particle trajectory response is indicated in Figure 12. At the early stage of 15 and 600 MHz, in 0 s, the cells are placed equally in the ROI, as shown in Figure 12a. In the 20 s, the keratinocyte and fibroblast cells are migrated to the low field intensity, NDEP. The fibroblast cells, which are greater than the keratinocytes in size, have a greater force and are more deflected in a short time compared to the keratinocyte cell. The keratinocyte cell has an instantaneous particle velocity of 0 m/s, whereas the fibroblast has a velocity of 46 m/s, as presented in Figure 12b.
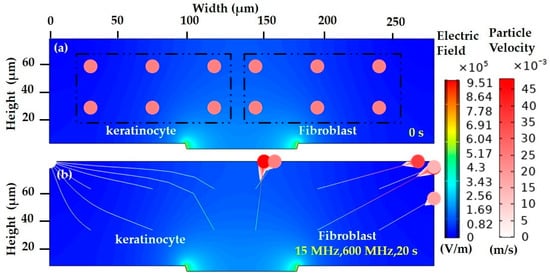
Figure 12.
Particle trajectory in high conductive medium at (a) the initial stage at 0 with an initial particle velocity of 0 m/s and (b) 15 and 600 MHz, 20 s, keratinocyte and fibroblast—NDEP. The color gradient of the trajectory line indicates the instantaneous particle velocity u ranging from 0 m/s (white) to 46 m/s (dark red). The contour and intensity of the electric field are indicated by the background blue color.
3.3. DEP Experiment
The manipulation of DEP at two separate drive directions is illustrated in Figure 13. This experimental research is intended to estimate the FDEP at its respective frequency and constant applied voltage of varying sizes of polystyrene particles. FDEP is categorized as PDEP and NDEP. PDEP is the lateral attraction to the upper surface of the microelectrodes, and NDEP is the lateral repulsion between the two microelectrodes. This research consequently introduces perspective advancements for the lateral manipulation of 3.2 and 4.8 μm polystyrene particles by using tapered DEP microelectrodes for the accumulation of two various particles of different sizes. Besides, alive keratinocyte cells are also manipulated in their respective medium. This research is considered to be essential for the further development of a rapid wound healer and is shown in Figure 14.
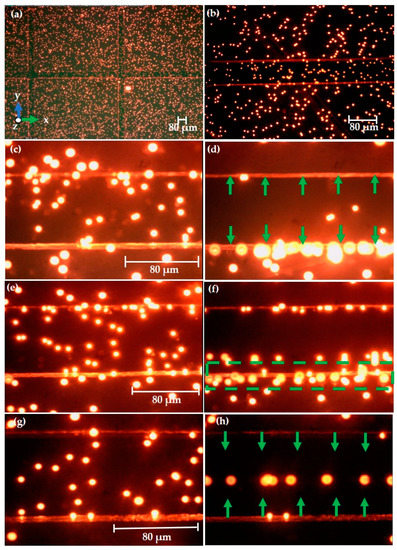
Figure 13.
Fluorescence microscopy observations of 3.2 and 4.8 µm polystyrene particles in deionized water conductive medium for effective FDEP: (a) 4× and (b) 10× magnifications of microelectrode with polystyrene particles; (c) initial 0 VPP at 200 kHz; (d) final 10 VPP–PDEP force at 200 kHz; (e) initial 0 VPP at 350 kHz; (f) final 10 VPP–intermediate frequency at 350 kHz; (g) initial 0 VPP at 460 kHz; (h) final 10 VPP–NDEP force at 460 kHz.
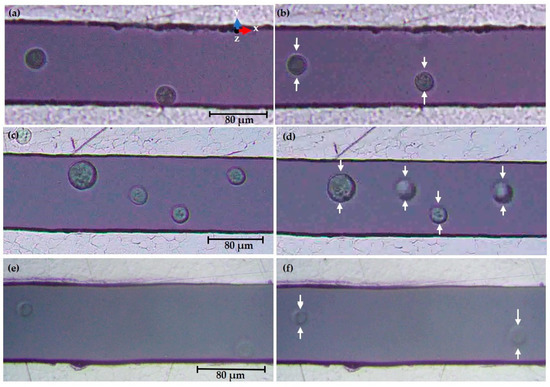
Figure 14.
Fluorescence microscopy observations of keratinocyte cells in DMEM/F-12 conductive medium for effective FDEP: (a) initial 0 VPP at 300 kHz; (b) final 10 VPP–NDEP at 300 kHz; (c) initial 0 VPP at 800 kHz; (d) final 10 VPP–NDEP at 800 kHz; (e) initial 0 VPP at 15 MHz; (f) final 10 VPP–NDEP force at 15 MHz.
3.3.1. Experimental Observation of Polystyrene Particles
The magnified views of microelectrodes at 4× and 10× are presented in Figure 13a,b, respectively. For future measurement of the DEP effect, the 40× magnification is used for improved visualization of particles. The capturing action is performed as per the following time frame. Initially, almost all the microelectrode measuring areas are filled with suspended particles. The particle movement is tracked for 5 s after applying a desired electrical field and observing for 20 s. The applied field is turned off, and the particle mobility is eventually observed for 5 s. Figure 13c displays the voltage without being applied, i.e., 0 VPP indicates that no electric field is applied. The particle is in a scattered state, and the alternating current of 10 VPP is applied. The sudden particle drift is observed when the voltage is applied, and the variable frequency from 100 to 260 kHz is monitored. Particles attempt to attract to the high-field intensity electrode region, and most of the particles are not located in the middle of the low-field intensity region due to the more polarized particles than the conductive medium. The FDEP is dominant and experiences the PDEP effect. In Figure 13d, the resulting particle is observed to encounter a PDEP by tuning the voltage of 10 VPP and the frequency of 200 kHz.
Figure 13e implies the particle without the application of an electrical field, i.e., at 0 VPP, the particle is distributed in the region of interest (ROI). After applying a voltage of 10 VPP, the frequency range from 260 to 420 kHz is tuned, and the magnitude of PDEP to NDEP is equal at this alternating current at fXO. the charges are in a balanced state, and the particles are static. In that case, no dominant FDEP is observed. Likewise, the equilibrium line location is determined by the respective values of the two counteracting FDEP values, which are regulated externally by the electrical signal applied to the metal electrode. The applied voltage of 10 VPP and frequency set at 350 kHz reveal the particle in an intermediate state a 3.2 µm particle is PDEP and a 4.8 µm particle experiences NDEP in Figure 13f. In other words, the highlighted region suggests that, in this frequency range, the particle adheres to a two-force (PDEP and NDEP). Figure 13g depicts the particle in a dispersed state without an applied field (0 VPP). The applied field and frequency are 10 VPP and 460 kHz, respectively.
The FDEP drives cells in liquid due to the interaction between a polarizable particle and a non-uniform electrical field. A close observation reveals that the polystyrene particles build up between the microelectrode. The phenomenon is known as NDEP. This result confirms that the FDEP is dominant. The applied voltage of 10 VPP at a 460 kHz frequency indicates that the majority of particles are repelled from the electrode, and particles are aligned in the middle, as indicated in Figure 13h. Table 7 simplifies the data of the DEP experiment and the subsequent particle mobility depending on the input frequency. The 3.2 and 4.8 µm polystyrene particle manipulation is compatible with simulated data. Hence, good performance is obtained.
Table 7.
Data interpretation from the experimental study and the resulting mobility of the polystyrene particles dependent on the applied input frequency.
3.3.2. Experimental Observation of Keratinocyte Cells
The droplet of 0.5 μL keratinocyte cells is added to the microelectrode at the early stage and focuses on the cells in the 20× magnification lens. The movement of the cell is tracked and observed in the time frame of 20 s after applying the desired electrical field. Figure 14a displays the alive keratinocyte cells at a random position even without voltage being applied, i.e., 0 VPP at the 300 kHz frequency. When the alternating current of 10 VPP at 300 kHz is applied, the keratinocyte cells are eventually shifted to the low field intensity spot at the middle of the electrode encounter NDEP and it is included in Figure 14b.
The keratinocyte cells are situated in the ROI without applying an electrical field, as represented in Figure 14c, i.e., at 0 VPP, 800 kHz. The frequency was tuned to 800 kHz and applied the input voltage of 10 VPP. The keratinocyte cells are repelled from the high field intensity and the cells accumulate in the middle and experience NDEP, as shown in Figure 14d. If the exposure to the electric field is too long, the cells move out of the ROI.
Similarly, in Figure 14e, the cells are located in a scattered location at 0 VPP and 15 MHz. The keratinocyte cell experiences the repulsion force and accumulates in the middle of the ROI after applying the voltage, as presented in Figure 14f. Throughout this experiment, in all of the above three cases, keratinocyte cells experience NDEP at 300 kHz, 800 kHz, and 15 MHz due to a high conductive medium. This result confirms that the FDEP is dominant and that the FDEP is dependent on the intrinsic dielectric properties and is consistent with the MyDEP simulated data. Due to the Joule heating effect, an improvement in the sinusoidal input signal is not desirable, however. This phenomenon affects the physical and biological properties of the test sample. The potential damage is due to the structure and molecular interactions of the cell membrane, affecting stress-related biological functions and activating membrane-bound proteins [30].
When a high voltage of 15–25 Vpp was applied, the production of such strong electric fields heats the surrounding medium due to the Joule heating, which was observed in the form of the electrothermal effect [45]. When an external electrical field was applied across an electrode, Joule heating creates temperature gradients near the electrode, which induces permittivity and conductivity gradients. A bulk electrical force has been generated and results in the interaction between the electric field and the gradient, which causes fluid motion. To dominant DEP force in a highly conductive medium, the DEP experiment on cell migration is carried out at 10 Vpp to prevent the electrothermal effect. Lower voltages were applied on samples with higher conductivities to avoid electrolysis and bubble formation.
It is essential to consider when operating at highly conductive samples. Initially, the electrothermal force and fluid velocity are both strongly voltage dependent on the applied voltage. Furthermore, a high temperature could cause sample degradation and other undesirable electrothermal effects. When frequencies greater than 100 MHz were used for DEP manipulations, the cells experienced a more substantial diminishment due to the thermal effect. As the frequency rises, so does the dissipated energy, which is absorbed by the media and cells. Thermal stroke may have an impact on cell genetic expression [46].
3.4. DIPP-MotionV Motion Analysis for Keratinocyte Cells
As discussed above in Section 3.3.2, DIPP-MotionV motion analysis is used to analyze experimentally manipulated keratinocyte cells at three different frequencies. The purpose of this analysis is to determine the average cell velocity, acceleration, and position of the coordinate. 2D/3D motion analysis software (DIPP-MotionV) enables the target cells to be labelled. The initial and final positions of the cells, as well as the speed and acceleration of cell movement, will be interpreted. The coordinate position is useful for determining the movement of cells with a linear or non-linear velocity. The data are shown in Table 8.
Table 8.
Average values of speed, acceleration and coordinate position of keratinocyte cell trajectory.
At 300 kHz in Figure 14b, two cells are labelled as C1 and C2 and followed the tracking procedure as indicated in the Supplementary Materials. The interpreted data indicate that C2 moves quickly after the applied electrical field and accumulates at the center position of the ROI, while C1 does not have a large movement due to the cell already located near the low field region. The trajectory is based on XY coordinates. The cells have a linear velocity. For keratinocyte cells at 800 kHz in Figure 14d, four cells are marked as C1, C2, C3, C4 to be tracked. If an electrical field is applied, the cells near the electrode move to the middle of the ROI and exhibit NDEP. After long field exposure, the cells moved out of the ROI. The XY coordinates reveal that cells have a velocity in linear. In Figure 14f at 15 MHz, the cells are assigned as C1 and C2 and the movement from the initial to the final position is not exceeded by a large distance because the two cells are almost near the low field intensity area and experience the linear movement towards the electrode.
4. Discussion
The results from FEM and the MyDEP are illustrated in Table 9. The comparison list from Table 7 shows that FEM frequency values are very close to the experimental and MyDEP data of 3.2 and 4.8 μm polystyrene particles. Even though a polystyrene particle is homogenous and exhibits a different DEP response than cells, the potential benefits of polystyrene particles are demonstrated as an experimental proof-of-concept for cell migration before the use of keratinocyte cells in this practical study [10]. Our aim is to validate the model with numerical analyses and ensure that the experimental setup is working as expected for cell synchronization. Experimental data for polystyrene particles are considerably remarkable frequency responses with simulation based on tabulated values. The results from MyDEP and FEM of 3.2 and 4.8 μm polystyrene particles are almost similar in PDEP, fXO, and the NDEP ranges. In high conductive medium, keratinocyte and fibroblast cells use DMEM/F-12 and DMEM, respectively. With the evaluated MyDEP plot at all possible frequencies, the cells experience only NDEP and the cells are attracted to the low field intensity, which is proven from both the estimated MyDEP and FEM and practically manipulated the alive keratinocyte cells. Additionally, from the literature, it is cross-verified and reported that for high conductive medium usually the NDEP is mostly possible [47]. Thus, for keratinocyte and fibroblast cells in both high and low conductive medium, numerical evaluated data are well matched with the FEM analytical values. Moreover, Table 10 reported the obtained theoretical results for keratinocyte and fibroblast cells with the available experimental data in the literature. In 2007, Broche et al. have investigated the early detection of oral squamous cell carcinoma (cancer detection). By applying a frequency signal between 5 and 10 kHz, DEP can be used to isolate cancer cells from more normal epithelial cells. Cancer cells are collected, since cells trapped by DEP are retained and it can also provide an initial determination of the presence of oral cancer cells. They investigated the transformed normal skin keratinocytes and oral keratinocytes from a tumor [48]. The novelty in this research is that living skin keratinocyte cells are manipulated using the DEP technique for wound healing application for diabetic sufferers by applying an electric field.
Table 9.
The overall comparative data analysis of the experimental and the computational results of particles/cells in various frequency ranges.
Table 10.
Reported studies based on the keratinocyte and fibroblast cells using DEP.
Increases in medium conductivity above a certain threshold may induce immunity in the DEP forces response, resulting in no negative or positive DEP detected between 100 Hz and 100 MHz. Thus, in the high conductive medium, the PDEP is not detected in this study [46]. It is crucial when working with living microorganisms, although using low-conductivity buffers frequently results in a high mortality rate of microorganisms due to osmotic stress [1]. Another method for trapping targets from a high conductivity medium is to use NDEP, which repels particles toward local electric field minima [42]. Although all cells experience NDEP in a high conductivity medium, we consider only a selected frequency to produce a stronger NDEP force, causing the cells to migrate faster for keratinocyte cell alignment in the wound site for rapid recovery [49].
This study attempted to use EST in DEP wound healing applications. Keratinocyte cells appear early in the skin and secrete both platelet-derived growth factor (PDGF) and transforming growth factor-beta (TGF-β), which stimulates dermal fibroblasts in scattered positions. In this stage, the DEP microelectrode is activated, and the keratinocyte cell can migrate to the low field region and align the keratinocytes in the wound site based on the applied frequency. Further, the cells are synchronized, allowing for wound contraction using DEP-assisted wound therapy. Hence, the NDEP force is used to manipulate each keratinocyte cell from a random location to the wound site, causing them to align at the target position and expedite wound closure.
5. Future Perspective for Wound Healing Application
Diabetic chronic wounds are predicted to be a great issue in the future. Therefore, more research is needed to find an effective solution for rapid chronic wound diagnosis. In this work, the DEP technique is implemented to develop a rapid wound healer. In this research, the polystyrene particles are used to predict the migration behavior of keratinocyte cells. The low conductive medium is adequate for particle mobility for polystyrene particles. Although, it is crucial to use a highly conductive medium in the DEP experiment due to the effect of joule heating and electrolysis. In this study, keratinocyte cells are cultured in the highly conductive suspension medium and manipulated using the DEP technique. As a result, due to the presence of high salt concentration in the culture medium, most of the frequencies experience an NDEP effect. Subsequently, the culture medium would be replaced by a low conductivity DEP buffer medium, which will be less polarizable than the cells providing the necessary osmotic balance to the cells, which will be used as a DEP buffer medium to enhance PDEP strength [55]. A low conductivity DEP buffer is used to produce PDEP and trap cells.
The wound healing stages are further elaborated below to understand the mechanism. A wound in the skin transfers to a deeper layer. The initial step is the activation of the platelet and the formation of a blood clot. Epidermis layer cells such as neutrophils, macrophages and lymphocytes provide cell immunity and simulate the growth factors. The mechanism of keratinocyte and fibroblast cells produces angiogenesis and myofibroblast for proliferation and activation. Further keratinocytes and fibroblast cells are generated and dispersed at different locations during the proliferation process in the epidermal and dermal layers. The wound is rebuilt with new tissue made of collagen and ECM [56].
At this stage, the DEP microelectrode activates to speed up the alignment of keratinocytes and fibroblasts in their respective layers for faster wound recovery. Cell mobility and synchronization to epidermal and dermal layers are achieved via the implementation of DEP. This improves the wound contraction and reorientation of the keratinocyte cells to the target site for wound care. The alignment duration has been improved based on the DEP, and cell restorative tissue recovers rapidly without delay. The final product is then assumed to be a quick wound healer using an EST, mimics the natural current of injury, and accelerates the healing process.
6. Conclusions
The interactions of molecules either repulsive or attractive are primarily dependent on the applied frequency. In this research, the molecular interactions of both polystyrene particles of 3.2 and 4.8 µm and alive keratinocyte cells are explored. The computational modelling of prototypic polystyrene particles of 3.2 and 4.8 μm is used to predict the behavior of keratinocyte cells. The MyDEP technique is compatible with FEM analysis with its calculated crossover frequency. The numerical method estimates that 28.10 and 510.53 MHz are the fXO of the keratinocyte and fibroblast cells, respectively. The prototypic 3.2 and 4.8 μm polystyrene particles’ fXO range is 425.02 and 275.37 kHz, respectively. Besides, the FEM is used to evaluate the electric field intensity as well as the particle trajectory. The particle trajectory is carried out by controlling the input frequency, and its respective particle mobility was observed for polystyrene particles in the low conductive medium. The trajectories of keratinocyte and fibroblast cells have been estimated in high and low conductive media. Experimental testing with polystyrene particles of different sizes is in good agreement with the research based on simulation results. From this study, the keratinocyte cells are successfully manipulated in a highly conductive medium and the same validated with numerical model MyDEP and FEM and analyzed with DIPP MotionV for rapid wound healer application.
Supplementary Materials
The following are available online at https://www.mdpi.com/article/10.3390/s21093007/s1, Video S1: Figure 12a,b, Video S2: Figure 13c,d, Video S3: Figure 14a,b. The supplementary text document includes cell modelling formula and the 2D/3D motion analysis software DIPP-MotionV procedure for Section 2.6.
Author Contributions
Conceptualization, M.R.B. and M.A.M.; methodology, M.R.B., M.F.M.R.W., R.D.; software, M.R.B., M.F.M.R.W., R.D.; validation, M.R.B., M.F.M.R.W., R.D.; formal analysis, M.R.B., R.D., N.N.M.M.; investigation, M.R.B., R.D., N.N.M.M.; resources, R.D., M.R.B.; data curation, R.D., M.R.B.; writing—original draft preparation, R.D.; writing—review and editing, M.R.B., M.F.M.R.W., R.D., M.A.M.; visualization, M.R.B., M.A.M.; supervision, M.R.B., M.A.M.; project administration, M.R.B., M.A.M.; funding acquisition, M.R.B., M.A.M. All authors have read and agreed to the published version of the manuscript.
Funding
This research is funded by Trans-disciplinary Research Grant Scheme (TRGS), grant number TRGS/1/2019/UKM/02/1/1 by the Ministry of Higher Education (MOHE), Malaysia, and the part of this research is funded by Geran Universiti Penyelidikan (GUP), grant number GUP-2020-071 Universiti Kebangsaan Malaysia (UKM).
Institutional Review Board Statement
The study was conducted according to the guidelines of the Declaration of Helsinki, and approved by (UKM) Research ethics committee (protocol code UKM PPI/111/8/JEP-2020-152 and 12 March 2020).
Informed Consent Statement
Not applicable.
Data Availability Statement
The data presented in this study are available within this article.
Acknowledgments
The author gratefully acknowledges the TRGS, grant number TRGS/1/2019/UKM/02/1/1 funded by the Ministry of Higher Education (MOHE), Malaysia, and the part of this research is supported by the GUP, grant number GUP-2020-071 Universiti Kebangsaan Malaysia (UKM). The author is thankful to Mohd Fauzi Bin Mh Busra, CTERM, UKM, for provided the cultured keratinocyte cells.
Conflicts of Interest
The authors declare no conflict of interest.
References
- Sen, C.K. Human Wounds and Its Burden: An Updated Compendium of Estimates. Adv. Wound Care 2019, 8, 39–48. [Google Scholar] [CrossRef] [PubMed]
- Hunckler, J.; de Mel, A. A current affair: Electrotherapy in wound healing. J. Multidiscip. Healthc. 2017, 10, 179–194. [Google Scholar] [CrossRef] [PubMed]
- Yang, S.; Sun, Y.; Geng, Z.; Ma, K.; Sun, X.; Fu, X. Abnormalities in the basement membrane structure promote basal keratinocytes in the epidermis of hypertrophic scars to adopt a proliferative phenotype. Int. J. Mol. Med. 2016, 37, 1263–1273. [Google Scholar] [CrossRef]
- Sun, Y.S.; Peng, S.W.; Cheng, J.Y. In vitro electrical-stimulated wound-healing chip for studying electric field-assisted wound-healing process. Biomicrofluidics 2012, 6, 034117. [Google Scholar] [CrossRef]
- Thakral, G.; LaFontaine, J.; Najafi, B.; Talal, T.K.; Kim, P.; Lavery, L.A. Electrical stimulation to accelerate wound healing. Diabet. Foot Ankle 2013, 4, 22081. [Google Scholar] [CrossRef]
- Ashrafi, M.; Alonso-Rasgado, T.; Baguneid, M.; Bayat, A. The efficacy of electrical stimulation in lower extremity cutaneous wound healing: A systematic review. Exp. Dermatol. 2017, 26, 171–178. [Google Scholar] [CrossRef]
- Ramadan, A.; Elsaidy, M.; Zyada, R. Effect of low-intensity direct current on the healing of chronic wounds: A literature review. J. Wound Care 2008, 17, 292–296. [Google Scholar] [CrossRef]
- Houghton, P.E. Electrical stimulation therapy to promote healing of chronic wounds: A review of reviews. Chronic Wound Care Manag. Res. 2017, 4, 25–44. [Google Scholar] [CrossRef]
- Ud-Din, S.; Bayat, A. Electrical Stimulation and Cutaneous Wound Healing: A Review of Clinical Evidence. Healthcare 2014, 2, 445–467. [Google Scholar] [CrossRef]
- Chen, Q.; Yuan, Y.J. A review of polystyrene bead manipulation by dielectrophoresis. RSC Adv. 2019, 9, 4963–4981. [Google Scholar] [CrossRef]
- Rahman, N.A.; Ibrahim, F.; Yafouz, B. Dielectrophoresis for Biomedical Sciences Applications: A Review. Sensors 2017, 17, 449. [Google Scholar] [CrossRef]
- Li, M.; Li, W.H.; Zhang, J.; Alici, G.; Wen, W. A review of microfabrication techniques and dielectrophoretic microdevices for particle manipulation and separation. J. Phys. D Appl. Phys. 2014, 47, 063001. [Google Scholar] [CrossRef]
- Pethig, R. Dielectrophoresis: An assessment of its potential to aid the research and practice of drug discovery and delivery. Adv. Drug Deliv. Rev. 2013, 65, 1589–1599. [Google Scholar] [CrossRef] [PubMed]
- Buyong, M.R.; Kayani, A.A.; Hamzah, A.A.; Majlis, B.Y. Dielectrophoresis manipulation: Versatile lateral and vertical mechanisms. Biosensors 2019, 9, 30. [Google Scholar] [CrossRef] [PubMed]
- Qian, C.; Huang, H.; Chen, L.; Li, X.; Ge, Z.; Chen, T.; Yang, Z.; Sun, L. Dielectrophoresis for bioparticle manipulation. Int. J. Mol. Sci. 2014, 15, 18281–18309. [Google Scholar] [CrossRef]
- Buyong, M.R.; Larki, F.; Caille, C.E.; Takamura, Y.; Hamzah, A.A.; Majlis, B.Y. Determination of lateral and vertical dielectrophoresis forces using tapered microelectrode array. Micro Nano Lett. 2018, 13, 143–148. [Google Scholar] [CrossRef]
- Derakhshan, R.; Ramiar, A.; Ghasemi, A. Numerical investigation into continuous separation of particles and cells in a two-component fluid flow using dielectrophoresis. J. Mol. Liq. 2020, 310, 113211. [Google Scholar] [CrossRef]
- Chen, Q.; Cao, Z.; Yuan, Y.J. Study on non-bioparticles and: Staphylococcus aureus by dielectrophoresis. RSC Adv. 2020, 10, 2598–2614. [Google Scholar] [CrossRef]
- Punjiya, M.; Nejad, H.R.; Mathews, J.; Levin, M.; Sonkusale, S. A flow through device for simultaneous dielectrophoretic cell trapping and AC electroporation. Sci. Rep. 2019, 9, 1–11. [Google Scholar] [CrossRef]
- Sari, Y.; Hartono; Sutrisna, E.; Saryono. The effect of short duration of electrical stimulation on wound healing in acute wound in a rat model. Wound Med. 2019, 24, 36–44. [Google Scholar] [CrossRef]
- Cottet, J.; Fabregue, O.; Berger, C.; Buret, F.; Renaud, P.; Frénéa-Robin, M. MyDEP: A New Computational Tool for Dielectric Modeling of Particles and Cells. Biophys. J. 2019, 116, 12–18. [Google Scholar] [CrossRef]
- Martínez-López, J.I.; Moncada-Hernández, H.; Baylon-Cardiel, J.L.; Martínez-Chapa, S.O.; Rito-Palomares, M.; Lapizco-Encinas, B.H. Characterization of electrokinetic mobility of microparticles in order to improve dielectrophoretic concentration. Anal. Bioanal. Chem. 2009, 394, 293–302. [Google Scholar] [CrossRef] [PubMed]
- Islam, M.; Natu, R.; Larraga-Martinez, M.F.; Martinez-Duarte, R. Enrichment of diluted cell populations from large sample volumes using 3D carbon-electrode dielectrophoresis. Biomicrofluidics 2016, 10. [Google Scholar] [CrossRef]
- Kinio, S.; Mills, J.K. Design of electrode topologies for dielectrophoresis through the use of genetic optimization with COMSOL Multiphysics. In Proceedings of the 2015 IEEE International Conference on Mechatronics and Automation, ICMA 2015, Beijing, China, 2–5 August 2015; pp. 1019–1024. [Google Scholar] [CrossRef]
- Tang, S.Y.; Zhang, W.; Baratchi, S.; Nasabi, M.; Kalantar-Zadeh, K.; Khoshmanesh, K. Modifying dielectrophoretic response of nonviable yeast cells by ionic surfactant treatment. Anal. Chem. 2013, 85, 6364–6371. [Google Scholar] [CrossRef]
- Pethig, R. Dielectrophoresis: Status of the theory, technology, and applications. Biomicrofluidics 2010, 4, 022811. [Google Scholar] [CrossRef]
- Rosenthal, A.; Voldman, J. Dielectrophoretic Traps for Single-Particle Patterning. Biophys. J. 2005, 88, 2193–2205. [Google Scholar] [CrossRef]
- Khoshmanesh, K.; Nahavandi, S.; Baratchi, S.; Mitchell, A.; Kalantar-zadeh, K. Dielectrophoretic platforms for bio-microfluidic systems. Biosens. Bioelectron. 2011, 26, 1800–1814. [Google Scholar] [CrossRef]
- Pethig, R. Review—Where Is Dielectrophoresis (DEP) Going? J. Electrochem. Soc. 2017, 164, B3049–B3055. [Google Scholar] [CrossRef]
- Ter Horst, B.; Chouhan, G.; Moiemen, N.S.; Grover, L.M. Advances in keratinocyte delivery in burn wound care. Adv. Drug Deliv. Rev. 2018, 123, 18–32. [Google Scholar] [CrossRef]
- Nilforoushzadeh, M.A.; Ahmadi Ashtiani, H.R.; Jaffary, F.; Jahangiri, F.; Nikkhah, N.; Mahmoudbeyk, M.; Fard, M.; Ansari, Z.; Zare, S. Dermal Fibroblast Cells: Biology and Function in Skin Regeneration. J. Ski. Stem Cell 2017, 1–5, in press. [Google Scholar] [CrossRef]
- Stunova, A.; Vistejnova, L. Dermal fibroblasts—A heterogeneous population with regulatory function in wound healing. Cytokine Growth Factor Rev. 2018, 39, 137–150. [Google Scholar] [CrossRef]
- Simeonova, M.; Wachner, D.; Gimsa, J. Cellular absorption of electric field energy: Influence of molecular properties of the cytoplasm. Bioelectrochemistry 2002, 56, 215–218. [Google Scholar] [CrossRef]
- Guo, J.; Kang, Y.; Ai, Y. Radiation dominated acoustophoresis driven by surface acoustic waves. J. Colloid Interface Sci. 2015, 455, 203–211. [Google Scholar] [CrossRef]
- Buyong, M.R.; Larki, F.; Faiz, M.S.; Hamzah, A.A.; Yunas, J.; Majlis, B.Y. A tapered aluminium microelectrode array for improvement of dielectrophoresis-based particle manipulation. Sensors 2015, 15, 10973–10990. [Google Scholar] [CrossRef]
- Buyong, M.R.; Yunas, J.; Hamzah, A.A.; Yeop Majlis, B.; Larki, F.; Abd Aziz, N. Design, fabrication and characterization of dielectrophoretic microelectrode array for particle capture. Microelectron. Int. 2015, 32, 96–102. [Google Scholar] [CrossRef]
- Buyong, M.R.; Larki, F.; Takamura, Y.; Majlis, B.Y. Tapered microelectrode array system for dielectrophoretically filtration: Fabrication, characterization, and simulation study. J. Micro/Nanolithogr. MEMS MOEMS 2017, 16, 044501. [Google Scholar] [CrossRef]
- Khoshmanesh, K.; Zhang, C.; Nahavandi, S.; Tovar-Lopez, F.J.; Baratchi, S.; Mitchell, A.; Kalantar-Zadeh, K. Size based separation of microparticles using a dielectrophoretic activated system. J. Appl. Phys. 2010, 108, 034904. [Google Scholar] [CrossRef]
- Ojo, K.O. Development of Sensors for Detection of Magnesium Metal Corrosion. Ph.D. Dissertation, University of Cincinnati, Cincinnati, OH, USA, 2016. [Google Scholar]
- Huang, Y.; Wang, X.B.; Becker, F.F.; Gascoyne, P.R.C. Introducing dielectrophoresis as a new force field for field-flow fractionation. Biophys. J. 1997, 73, 1118–1129. [Google Scholar] [CrossRef]
- Huclova, S.; Erni, D.; Fröhlich, J. Modelling and validation of dielectric properties of human skin in the MHz region focusing on skin layer morphology and material composition. J. Phys. D Appl. Phys. 2012, 45, 025301. [Google Scholar] [CrossRef]
- Park, S.; Koklu, M.; Beskok, A. Particle trapping in high-conductivity media with electrothermally enhanced negative dielectrophoresis. Anal. Chem. 2009, 81, 2303–2310. [Google Scholar] [CrossRef]
- Abd Samad, M.I.; Buyong, M.R.; Kim, S.S.; Yeop Majlis, B. Dielectrophoresis velocities response on tapered electrode profile: Simulation and experimental. Microelectron. Int. 2019, 36, 45–53. [Google Scholar] [CrossRef]
- Adekanmbi, E.O.; Srivastava, S.K. Dielectrophoretic applications for disease diagnostics using lab-on-a-chip platforms. Lab Chip 2016, 16, 2148–2167. [Google Scholar] [CrossRef]
- Tang, S.Y.; Zhang, W.; Soffe, R.; Nahavandi, S.; Shukla, R.; Khoshmanesh, K. High resolution scanning electron microscopy of cells using dielectrophoresis. PLoS ONE 2014, 9, 3–10. [Google Scholar] [CrossRef]
- Nerguizian, V.; Stiharu, I.; Al-Azzam, N.; Yassine-Diab, B.; Alazzam, A. The effect of dielectrophoresis on living cells: Crossover frequencies and deregulation in gene expression. Analyst 2019, 144, 3853–3860. [Google Scholar] [CrossRef] [PubMed]
- Ren, Q.; Meng, F.; Chan, C.L. Cell transport and suspension in high conductivity electrothermal flow with negative dielectrophoresis by immersed boundary-lattice Boltzmann method. Int. J. Heat Mass Transf. 2019, 128, 1229–1244. [Google Scholar] [CrossRef]
- Broche, L.M.; Bhadal, N.; Lewis, M.P.; Porter, S.; Hughes, M.P.; Labeed, F.H. Early detection of oral cancer—Is dielectrophoresis the answer? Oral Oncol. 2007, 43, 199–203. [Google Scholar] [CrossRef] [PubMed]
- Pethig, R. Limitations of the Clausius-Mossotti function used in dielectrophoresis and electrical impedance studies of biomacromolecules. Electrophoresis 2019, 40, 2575–2583. [Google Scholar] [CrossRef]
- Das, D.; Biswas, K.; Das, S. Dielectrophoresis based microfluidic chip for continuous label-free separation of cells. In Proceedings of the 2015 9th International Conference on Sensing Technology (ICST), Auckland, New Zealand, 8–10 December 2015; pp. 728–732. [Google Scholar] [CrossRef]
- Douglas, T.A.; Alinezhadbalalami, N.; Balani, N.; Schmelz, E.M.; Davalos, R.V. Separation of Macrophages and Fibroblasts Using Contactless Dielectrophoresis and a Novel ImageJ Macro. Bioelectricity 2019, 1, 49–55. [Google Scholar] [CrossRef]
- Ling, S.H.; Lam, Y.C.; Chian, K.S. Continuous cell separation using dielectrophoresis through asymmetric and periodic microelectrode array. Anal. Chem. 2012, 84, 6463–6470. [Google Scholar] [CrossRef]
- Kaler, K.V.; Jones, T.B. Dielectrophoretic spectra of single cells determined by feedback-controlled levitation. Biophys. J. 1990, 57, 173–182. [Google Scholar] [CrossRef]
- Dalili, A.; Montazerian, H.; Sakthivel, K.; Tasnim, N.; Hoorfar, M. Dielectrophoretic manipulation of particles on a microfluidics platform with planar tilted electrodes. Sens. Actuators B Chem. 2020, 129204. [Google Scholar] [CrossRef]
- Huan, Z.; Ma, W.; Xu, M.; Zhong, Z.; Li, X.; Zhu, Z. Cell patterning via optimized dielectrophoretic force within hexagonal electrodes in vitro for skin tissue engineering. Int. J. Adv. Manuf. Technol. 2019, 105, 4899–4907. [Google Scholar] [CrossRef]
- Werner, S.; Krieg, T.; Smola, H. Keratinocyte-fibroblast interactions in wound healing. J. Investig. Dermatol. 2007, 127, 998–1008. [Google Scholar] [CrossRef] [PubMed]


Publisher’s Note: MDPI stays neutral with regard to jurisdictional claims in published maps and institutional affiliations. |
© 2021 by the authors. Licensee MDPI, Basel, Switzerland. This article is an open access article distributed under the terms and conditions of the Creative Commons Attribution (CC BY) license (https://creativecommons.org/licenses/by/4.0/).