Customer Segmentation through Path Reconstruction
Abstract
1. Introduction
- The clustering algorithm: we do not let the clustering process deal with spatial constraints. We take care of the process of conversion between detection points and valid trajectories, which are generated based on the lists of detection points, before performing any other calculation.
- Our method does not divide data into different subsets according to the time length of the paths. The user decides the maximum number of clusters they are interested in, and customers are then segmented according to all the numeric data that we can collect from their trajectories, with the length of the path being one of the variables used by the clustering algorithm.
2. Our Case Study
2.1. Physical Environment
2.2. WiFi Positioning
- is Path Loss at distance d
- n is the signal decay exponent
- d is the distance between transmitter and receiver
- is the reference distance. For us this value is 1 m
- is the wavelength of signal (2 Ghz = 0.125 m)
- is the Fade Margin. It is system specific and has to be empirically calculated for each site. For buildings such as the the one we are testing our system in a common value of is 10 dBm.
2.3. The Data
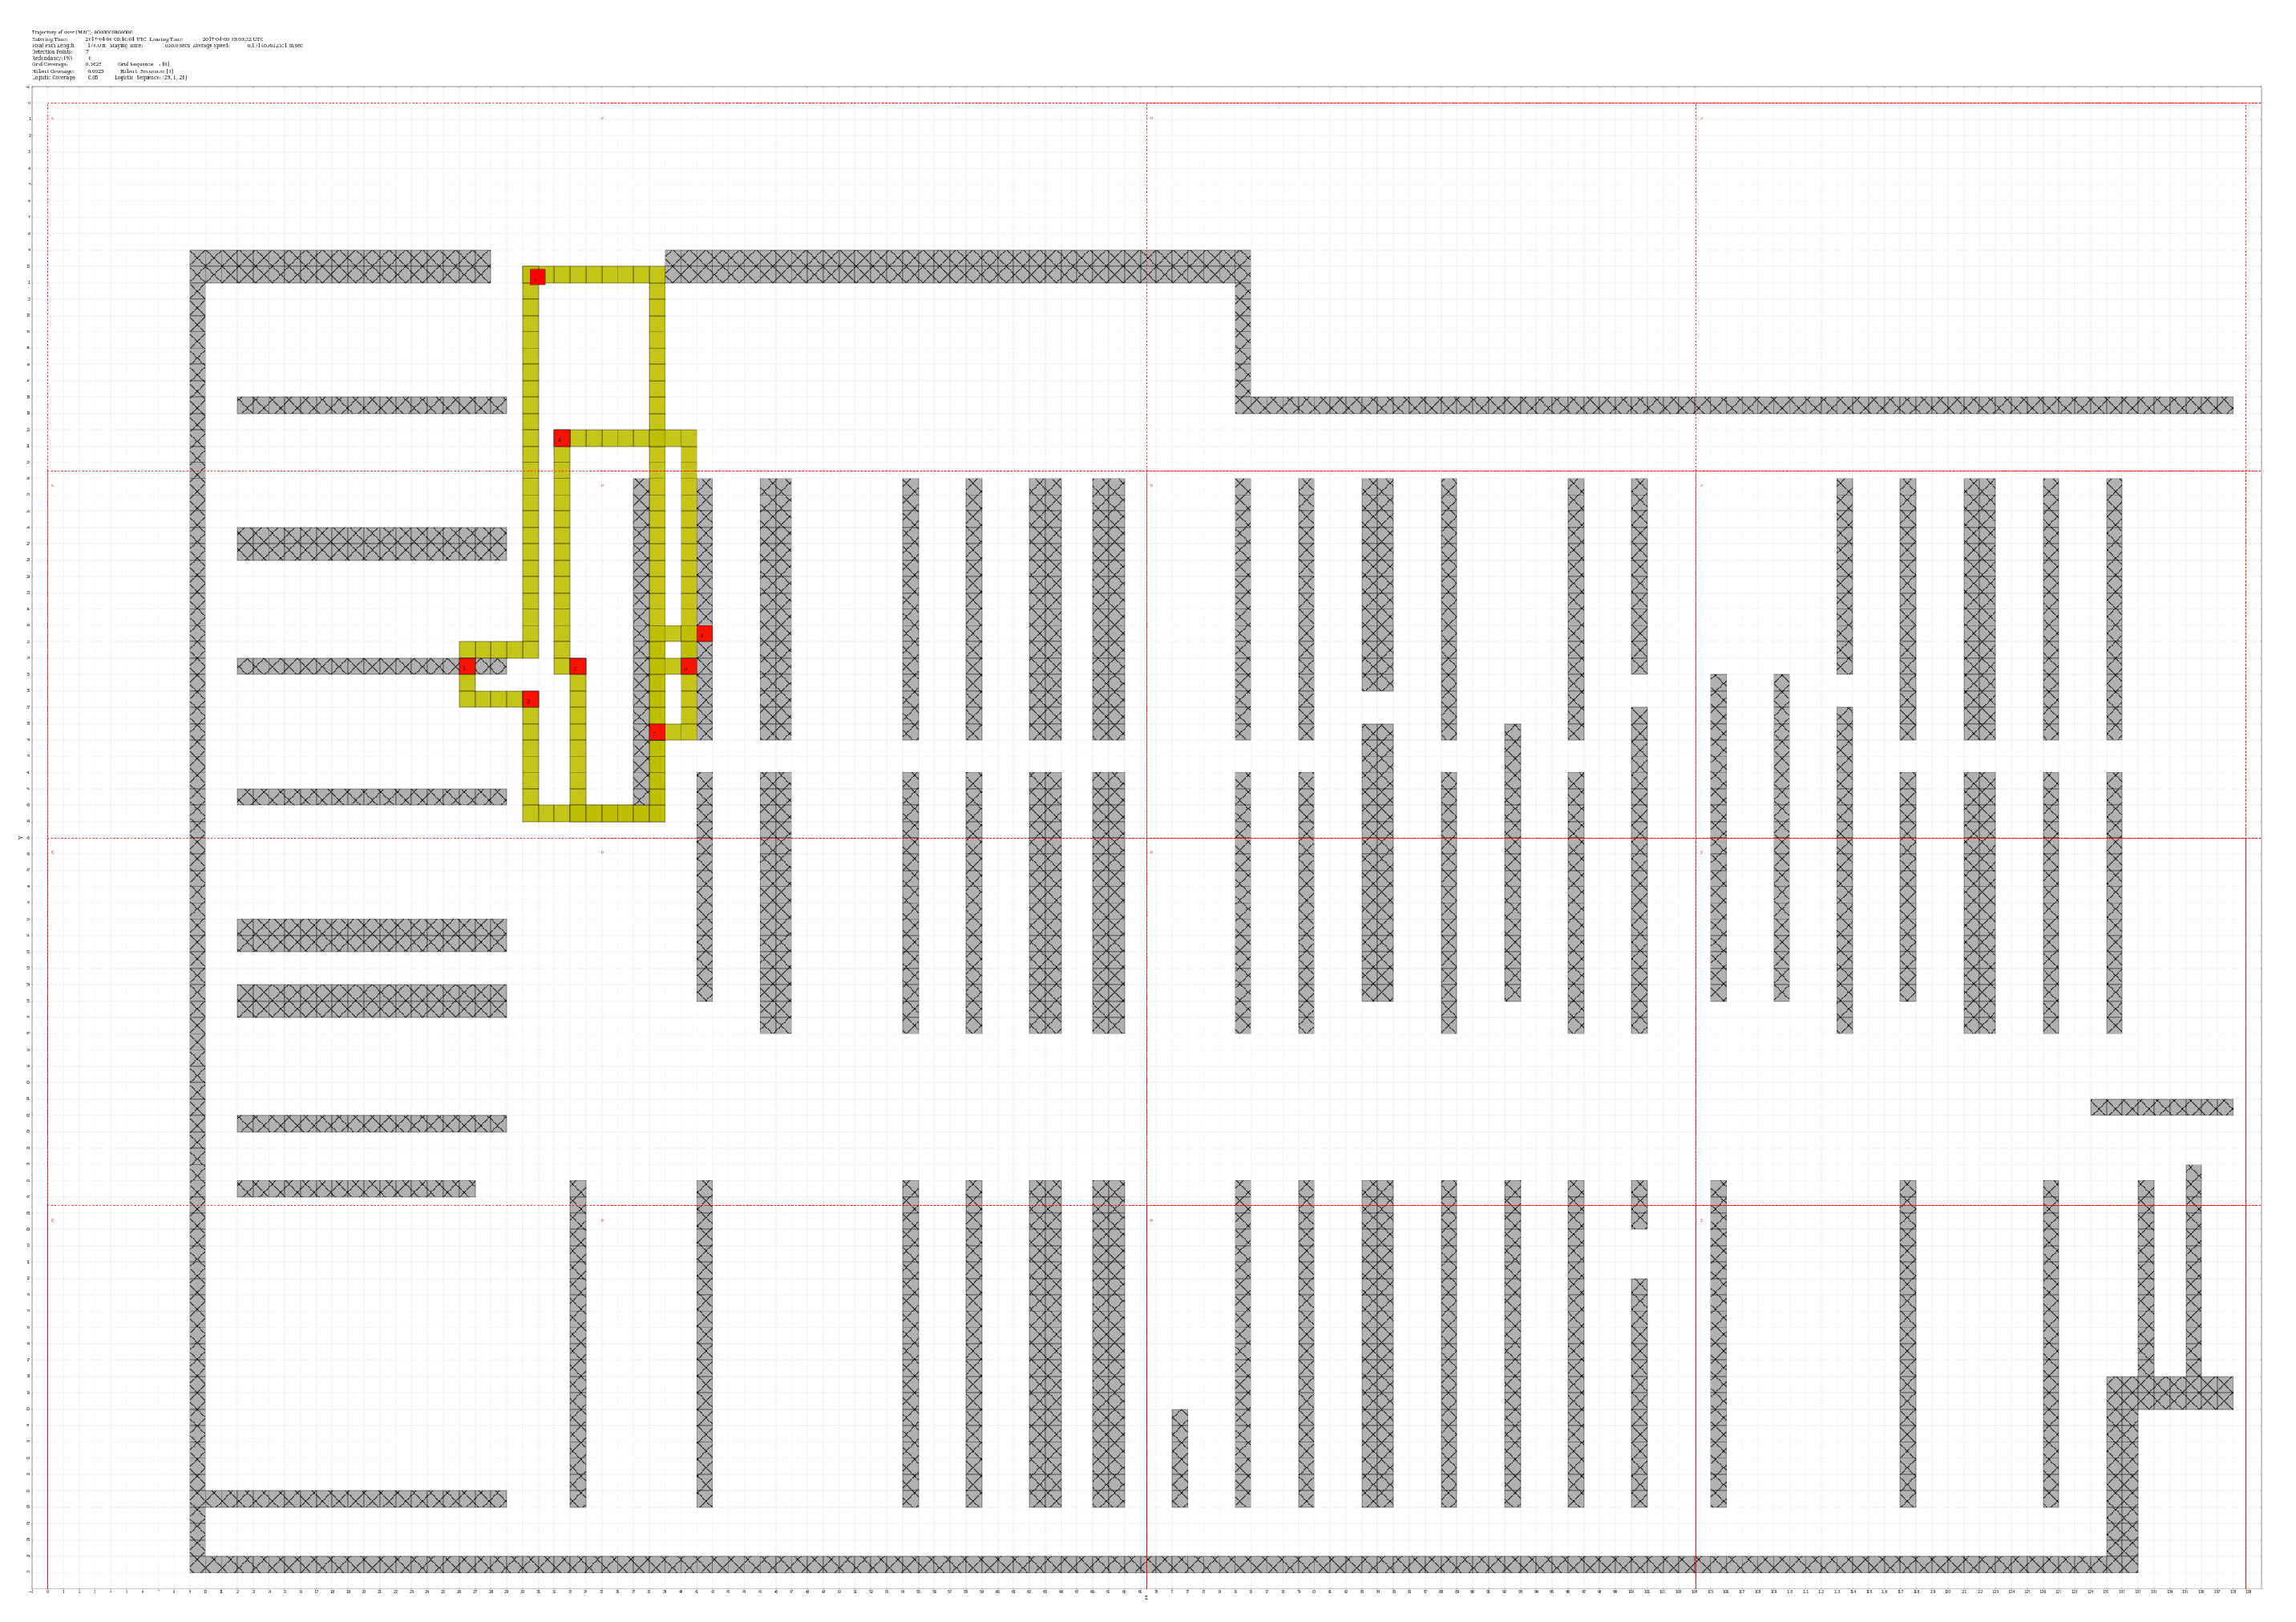
- MAC_ADDRESS_0,2020-04-06 08:46:04 UTC,26.0,34.0,1
- MAC_ADDRESS_0,2020-04-06 08:48:00 UTC,30.0,36.0,1
- MAC_ADDRESS_0,2020-04-06 08:49:03 UTC,40.0,34.0,1
- MAC_ADDRESS_0,2020-04-06 08:51:16 UTC,32.0,20.0,1
- MAC_ADDRESS_0,2020-04-06 08:53:18 UTC,33.0,34.0,1
- MAC_ADDRESS_0,2020-04-06 08:59:19 UTC,41.0,32.0,1
- MAC_ADDRESS_0,2020-04-06 09:03:22 UTC,38.0,38.0,1
- Entering Time
- Directly extracted from the file and expressed in Coordinated Universal Time (UTC).
- Leaving Time
- Directly extracted from the file. Same format.
- Staying Time
- Calculated as the difference, in seconds, between Entering and Leaving Times.
- Total Path Length
- Defined as the number of red squares (detection points) plus the number of yellow squares (those generated by Lee’s Algorithm). Each tile is a 1 square meter space. See Figure 5.
- Average Speed
- Total Path Length, in meters, divided by Staying Time.
- Detection Points
- Number of red squares in Figure 5. This represents the number of times a customer was detected before leaving the shop.
- Redundancy
- Percentage of times that the customer steps on the same square. Calculated as the Total Path Length minus the number of times a user steps on a unique 1 × 1 m tile forming the trajectory, divided by Total Path Length.
- Logistic Coverage
- Percentage of Logistic Sections visited by a customer. A Logistic Section is each one of the areas labeled with a different name (i.e., CYCLING, RUNNING, etc.). If the customer visits 6 sections out of 30, this value would be equal to 0.2.
- Logistic Sequence
- We map the list of (x,y) coordinates describing the full path obtained by Lee’s algorithm into a list of Logistic Sections that represents the ordered list of sections that the customer visits, allowing repetition. A full trajectory is then converted into something like
- [1,1,3,6,7,7,7,7,7,1]
meaning that the user stepped twice on section one, once on sections three and six, five times on section seven, and once again on section one during the walk through the shop. This variable is not used by the clustering algorithm, but it is used to calculate the value of the variable named Logistic Stayings, described as - Logistic Stayings
- From the Logistic Sequence we obtain a list of percentages that is an estimation of the relative amount of time spent by the customer inside each Logistic Section. The list represented above would generate something like
- [0,30,0,10,0,0,10,50,0,0, .......,0]
- Collapsed Logistic Sequence
- Converting LogisticSequence into a list without consecutive duplicates, we obtain, for the same example, the following.[1,3,6,7,1]
3. Clustering
3.1. Clustering Algorithm Alternatives
3.1.1. K-Means Clustering
3.1.2. Mean-Shift Clustering
- The selection of the window size can be non-trivial in some cases.
- It is computationally expensive( ).
3.1.3. Density-Based Spatial Clustering of Applications with Noise (DBSCAN)
- It does not require a preconfigured number of clusters.
- It can sometimes identify outliers as noise, unlike mean-shift which puts them into a separate cluster no matter how different the points are.
- It does not perform well when dealing with clusters of varying density. In [36], a variant of this algorithm has recently been presented to solve this problem, but it is computationally expensive.
- It is not well equipped to deal with high-dimensional data.
- Depending on implementation details, complexity can vary from to .
3.1.4. Expectation–Maximization (EM) Clustering Using Gaussian Mixture Models (GMM)
3.1.5. Agglomerative Hierarchical Clustering (AHC)
3.2. Clustering Process
- Select variables on which to cluster. We used the variables described in Section 2.3.
- Select a Similarity Measure and scale the variables. We used Euclidean Distance, and normalized all the variables using Z-score. A Z-score is a measure of how many standard deviations below or above the population mean a raw score is, and is frequently used prior to any Data Mining Technique ([41]). This prevents the inherent differences in the absolute values between variables from skewing the analysis.
- Select a clustering method. In our case the k-means method was chosen, for the following reasons:
- (a)
- Ease of implementation.
- (b)
- Scalability. Its linear complexity allows us to use the same methodology with larger datasets.
- (c)
- Guaranteed convergence.
- (d)
- It can be easily adapted to new examples. In the case of identifying new variables that may be of use in the clustering process, the adaptation of the algorithm is straightforward.
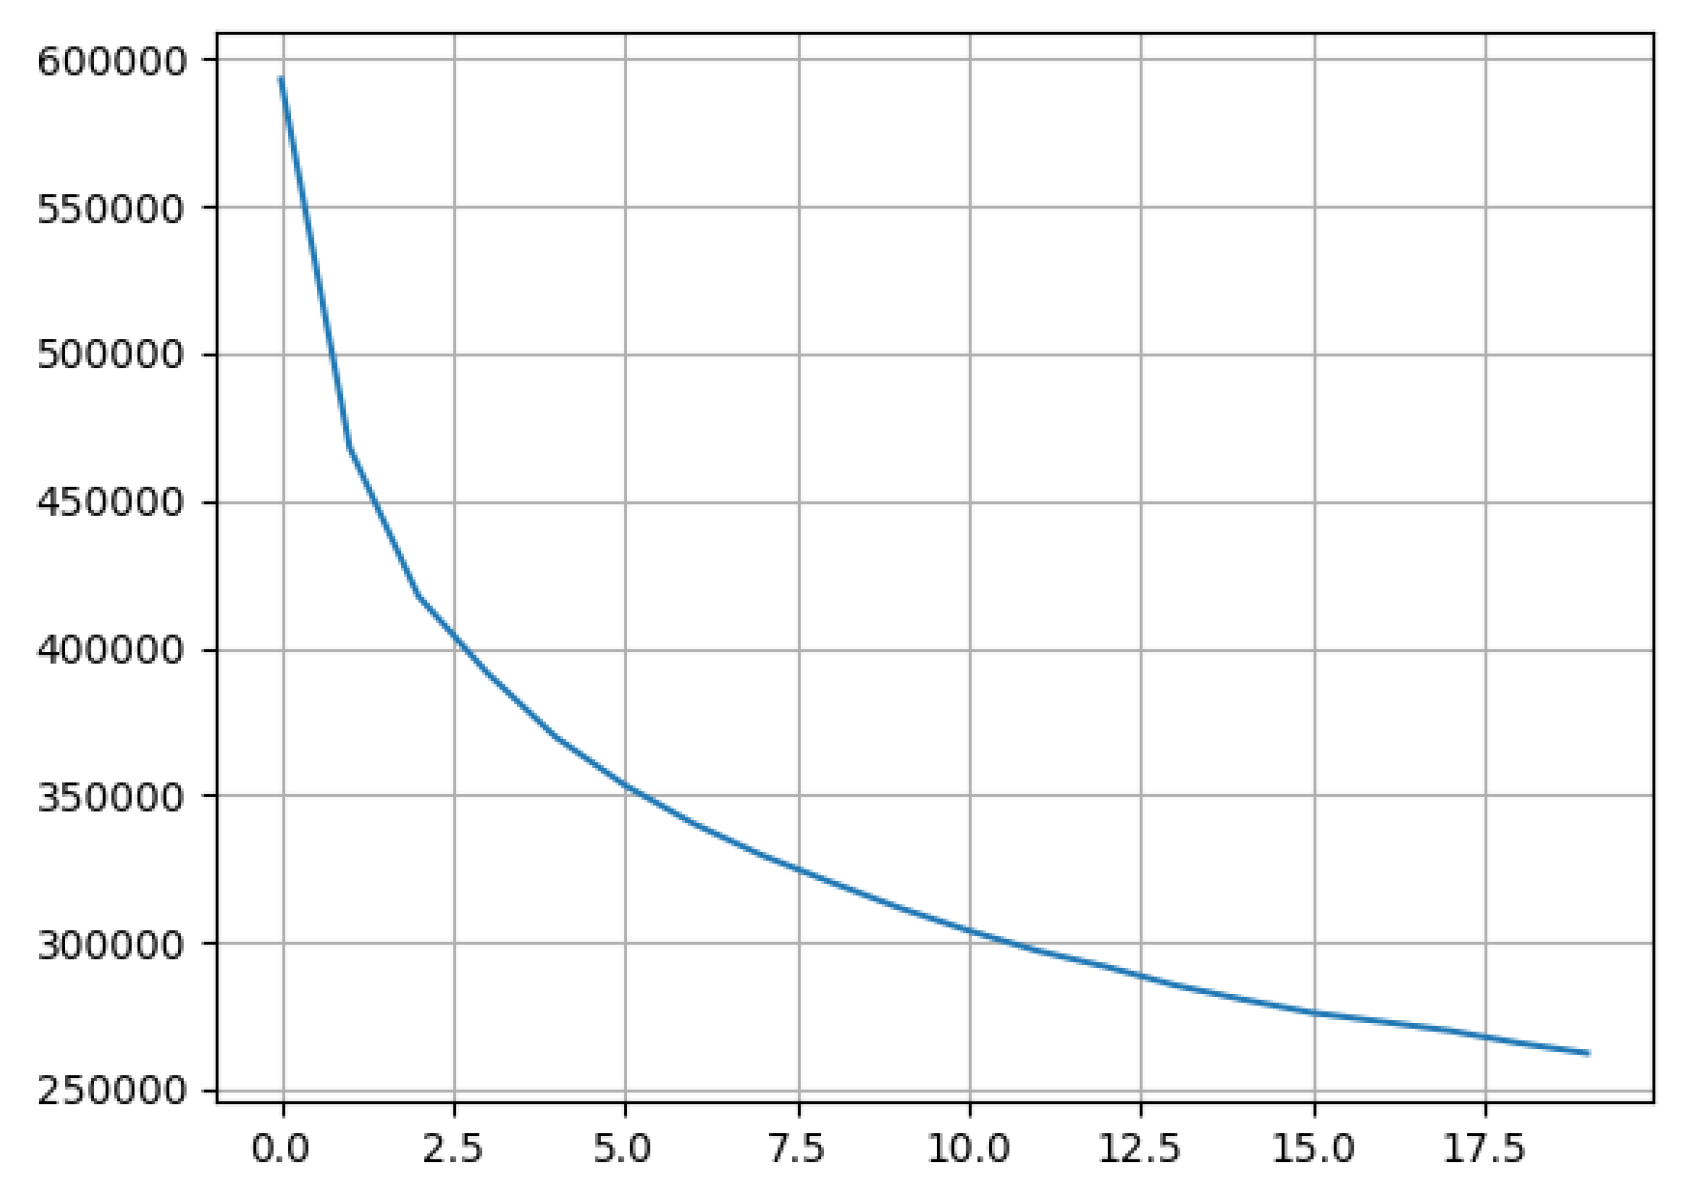
- Determine the number of clusters. Using K-means Algorithm permits the automatic determination of the optimal number of clusters using one of two methods. We have used both in the past, choosing the Silhouette Method [42] only when the results obtained from the Elbow Method were not acceptable. In this work we used the Elbow Method, as described in [17,33].
- Conduct the Cluster Analysis, interpret the results, and apply them.
3.3. K-Means Algorithm
- Specify the desired number of clusters, k. Suppose a data set D contains n objects in Euclidean space. Objects need to be distributed into k clusters, .
- Randomly assign each data point to a cluster.
- Compute cluster centroids. A centroid based partitioning technique uses the centroid of a cluster, , to represent that cluster. The centroid can be defined in various ways such as by the mean or medoid of the objects assigned to the cluster.
- Re-assign each point to the closest cluster centroid. The difference between an object p belonging to and , the representative of the cluster, is measured by , where is the Euclidean distance between two points, x and y.
- Re-compute cluster centroids.
- Repeat steps 4 and 5 until no improvements are possible. If not explicitly mentioned, when there is no switching of objects between two clusters for two successive repeats, the algorithm has finished.
3.4. Automatic Determination of the Number of Clusters
4. Results
- Visual analysis of the clusters that the system has identified.
- Numerical analysis of the characteristics of each cluster.
- Heat Map:
- A heat map is a two-dimensional representation of information with the help of colors. In our case, each point representing a 1 × 1 square meter in the shop is plotted proportionally as red as how many times a user stepped on it, according to the paths generated by Lee’s Algorithm. We will use heat maps as a tool to visually identify the areas of the shop that attract more interest over a fixed period.
4.1. Visual Interpretation of Heat Maps
4.1.1. Non Clustered Heat Maps
4.1.2. Detailed Heat Maps after Clustering
4.2. Numerical Study of the Clustered Data
5. Discussion
- Determination of Store Operational Requirements by scheduling and assigning employees. By analyzing the pattern of visits at specific periods, it is possible to reallocate personnel to respond to possible peaks in the activity.
- All the knowledge that can be extracted about customer behavior patterns is of great value in personnel selection and training processes.
- Identification of current and future customer requirements. The use of our tool on an ongoing basis allows early detection of changes in customer behavior.
6. Conclusions and Future Work
7. Materials and Methods
Funding
Institutional Review Board Statement
Informed Consent Statement
Data Availability Statement
Conflicts of Interest
Abbreviations
| AHC | Agglomerative Hierarchical Clustering |
| AP | Access Points |
| DBSCAN | Density-Based Spatial Clustering of Applications with Noise |
| EM | Expectation–Maximization |
| FSPL | Free Space Path Loss |
| GMM | Gaussian Mixture Models |
| KDE | Kernel Density Estimation |
| MAC | Media Access Control |
| RSSI | Received Signal Strength Indication |
| SSE | Sum of Squared Errors |
| VLSI | Very Large Scale Integrated circuit |
| WPS | WiFi Positioning System |
References
- Gabellini, P.; D’Aloisio, M.; Fabiani, M.; Placidi, V. A Large Scale Trajectory Dataset for Shopper Behaviour Understanding. In New Trends in Image Analysis and Processing–ICIAP 2019; Cristani, M., Prati, A., Lanz, O., Messelodi, S., Sebe, N., Eds.; Springer International Publishing: Cham, Swiitzerland, 2019; pp. 285–295. [Google Scholar]
- Sorensen, H.; Bogomolova, S.; Anderson, K.; Trinh, G.; Sharp, A.; Kennedy, R.; Page, B.; Wright, M. Fundamental patterns of in-store shopper behavior. J. Retail. Consum. Serv. 2017, 37, 182–194. [Google Scholar] [CrossRef]
- Nagai, R.; Togawa, T.; Hiraki, I.; Onzo, N. Shopper Behavior and Emotions: Using GPS Data in a Shopping Mall: An Abstract. In Marketing Transformation: Marketing Practice in an Ever Changing World; Rossi, P., Krey, N., Eds.; Springer International Publishing: Cham, Swiitzerland, 2018; pp. 307–308. [Google Scholar]
- Improving Shopping Experience of Customers using Trajectory Data Mining. Int. J. Comput. Sci. Netw. Secur. 2017, 17, 170–180.
- Devi Prasad, K. Impact of Store Layout Design on Customer Shopping Experience: A Study of FMCG Retail Outlets in Hyderabad, India. In Proceedings of the Annual Australian Business and Social Science Research Conference, Gold Coast, QLD, Austra, 26–27 September 2016; Volume 1, pp. 10–25. [Google Scholar]
- Cho, J.Y.; Lee, E.J. Impact of Interior Colors in Retail Store Atmosphere on Consumers’ Perceived Store Luxury, Emotions, and Preference. Cloth. Text. Res. J. 2017, 35, 33–48. [Google Scholar] [CrossRef]
- Jain, A.K.; Dubes, R.C. Algorithms for Clustering Data; Prentice Hall: Upper Saddle River, NJ, USA, 1988. [Google Scholar]
- Han, J.; Kamber, M. Data Mining: Concepts and Techniques; Morgan Kaufmann: San Francisco, CA, USA, 2000. [Google Scholar]
- Rousseeuw, L.K.P.J. Introduction to Data Mining, 1st ed.; Pearson Addison Wesley: Boston, MA, USA, 2005. [Google Scholar]
- Gianfranco Chicco, R.; Napoli, P.P.; Cornel, T. Customer Characterization Options for Improving the Tariff Offer. IEEE Trans. Power Syst. 2003, 18, 129–132. [Google Scholar]
- Stephenson, P.; Paun, M. Consumer advantages from half-hourly metering and load profiles in the United Kingdom, competitive electricity market. In Proceedings of the DRPT2000, International Conference on Electric Utility Deregulation and Restructuring and Power Technologies. Proceedings (Cat. No.00EX382), London, UK, 4–7 April 2000; pp. 35–40. [Google Scholar]
- Panapakidis, I.P.; Alexiadis, M.; Papagiannis, G. Electricity customer characterization based on different representative load curves. In Proceedings of the 9th International Conference on the European Energy Market (EEM), Florence, Italy, 10–12 May 2012; Volume 1, pp. 1–8. [Google Scholar]
- Kashwan, K.R.; Velu, C.M. Customer segmentation using clustering and data mining techniques. Int. J. Comput. Theory Eng. 2013, 5, 856–861. [Google Scholar] [CrossRef]
- Merad, D.; Aziz, K.E.; Iguernaissi, R.; Fertil, B.; Drap, P. Tracking multiple persons under partial and global occlusions: Application to customers’ behavior analysis. Pattern Recognit. Lett. 2016, 81, 11–20. [Google Scholar] [CrossRef]
- Oosterlinck, D.; Benoit, D.F.; Baecke, P.; de Weghe, N.V. Bluetooth tracking of humans in an indoor environment: An application to shopping mall visits. Appl. Geogr. 2017, 78, 55–65. [Google Scholar] [CrossRef]
- Larson, J.S.; Bradlow, E.T.; Fader, P.S. An exploratory look at supermarket shopping paths. Int. J. Res. Market. 2005, 22, 395–414. [Google Scholar] [CrossRef]
- Dhanachandra, N.; Kaufman, L.; Rousseeuw, P.J. Finding Groups in Data: An Introduction to Cluster Analysis, 1st ed.; Wiley: Hoboken, NJ, USA, 1990. [Google Scholar]
- Wu, Y.; Wang, H.-C.; Chang, L.-C.; Chou, S.-C. Customer’s flow analysis in physical retail store. In 6th International Conference on Applied Human Factors and Ergonomics; Elsevier: Hoboken, NJ, USA, 2015; pp. 3506–3513. [Google Scholar]
- Dogan, O.; Bayo-Monton, J.L.; Fernandez-Llatas, C.; Oztaysi, B. Analyzing of Gender Behaviors from Paths Using Process Mining: A Shopping Mall Application. Sensors 2019, 19, 557. [Google Scholar] [CrossRef] [PubMed]
- Dogan, O.; Fernandez-Llatas, C.; Oztaysi, B. Segmentation of indoor customer paths using intuitionistic fuzzy clustering: Process mining visualization. J. Intell. Fuzzy Syst. 2019, 38, 675–684. [Google Scholar] [CrossRef]
- Nakano, S.; Kondo, F.N. Customer segmentation with purchase channels and media touchpoints using single source panel data. J. Retail. Consum. Serv. 2018, 41, 142–152. [Google Scholar] [CrossRef]
- Hwang, I.; Jang, Y.J. Process Mining to Discover Shoppers’ Pathways at a Fashion Retail Store Using a WiFi-Base Indoor Positioning System. IEEE Trans. Autom. Sci. Eng. 2017, 14, 1786–1792. [Google Scholar] [CrossRef]
- Lee, C.Y. An Algorithm for Path Connections and Its Applications. IRE Trans. Electron. Comput. 1961, 2, 346–365. [Google Scholar] [CrossRef]
- Kotsiantis, S.B. Supervised Machine Learning: A Review of Classification Techniques. In Proceedings of the 2007 Conference on Emerging Artificial Intelligence Applications in Computer Engineering: Real Word AI Systems with Applications in eHealth, HCI, Information Retrieval and Pervasive Technologies; IOS Press: Amsterdam, The Netherlands, 2007; pp. 3–24. [Google Scholar]
- Alpaydın, E. Introduction to Machine Learning, 2nd ed.; MIT Press: Cambridge, MA, USA, 2010. [Google Scholar]
- Khumanthem, M.; Yambem, J. Image Segmentation Using K-means Clustering Algorithm and Subtractive Clustering Algorithm. Procedia Comput. Sci. 2015, 54, 764–771. [Google Scholar]
- Shamir, L.; Delaney, J.D.; Orlov, N.; Eckley, D.M.; Goldberg, I.G. Pattern Recognition Software and Techniques for Biological Image Analysis. PLoS Comput. Biol. 2010, 6, e1000974. [Google Scholar] [CrossRef]
- Drushku, K.; Aligon, J.; Labroche, N.; Marcel, P.; Peralta, V.; Dumant, B. User Interests Clustering in Business Intelligence Interactions. In CAiSE 2017: 29th International Conference on Advanced Information Systems Engineering; Springer: Cham, Switzerland, 2017; pp. 144–158. [Google Scholar]
- Liu, X.; Croft, W.B. Cluster-based Retrieval Using Language Models. In Proceedings of the 27th Annual International ACM SIGIR Conference on Research and Development in Information Retrieval; SIGIR ’04; ACM: New York, NY, USA, 2004; pp. 186–193. [Google Scholar]
- McKeown, K.R.; Barzilay, R.; Evans, D.; Hatzivassiloglou, V.; Klavans, J.L.; Nenkova, A.; Sable, C.; Schiffman, B.; Sigelman, S. Tracking and Summarizing News on a Daily Basis with Columbia’s Newsblaster. In HLT ’02: Proceedings of the Second International Conference on Human Language Technology Research; Morgan Kaufmann Publishers Inc.: San Francisco, CA, USA, 2002; pp. 280–285. [Google Scholar]
- Lloyd, S.P. Least squares quantization in pcm. IEEE Trans. Inf. Theory 1982, 28, 129–137. [Google Scholar] [CrossRef]
- MacQueen, J.B. Some Methods for Classification and Analysis of MultiVariate Observations. In Berkeley Symposium on Mathematical Statistics and Probability; Cam, L.M.L., Neyman, J., Eds.; University of California Press: Berkeley, CA, USA, 1967; Volume 1, pp. 281–297. [Google Scholar]
- Tibshirani, R.; Walther, G.; Hastie, T. Estimating the number of data clusters via the Gap statistic. J. R. Stat. Soc. B 2001, 63, 411–423. [Google Scholar] [CrossRef]
- Fukunaga, K.; Hostetler, L. The Estimation of the Gradient of a Density Function, with Applications in Pattern Recognition. IEEE Trans. Inf. Theory 2006, 21, 32–40. [Google Scholar] [CrossRef]
- Ester, M.; Kriegel, H.P.; Sander, J.; Xu, X. A Density-Based Algorithm for Discovering Clusters in Large Spatial Databases with Noise. In KDD’96: Proceedings of the Second International Conference on Knowledge Discovery and Data Mining; AAAI Press: Menlo Park, CA, USA, 1996; pp. 226–231. [Google Scholar]
- Kim, J.H.; Choi, J.H.; Yoo, K.H.; Nasridinov, A. AA-DBSCAN: An Approximate Adaptive DBSCAN for Finding Clusters with Varying Densities. J. Supercomput. 2019, 75, 142–169. [Google Scholar] [CrossRef]
- Hartley, H. Maximum Likelihood Estimation from Incomplete Data. Biometrics 1958, 14, 174–194. [Google Scholar] [CrossRef]
- Dempster, A.; Laird, N.; Rubin, D. Maximum Likelihood from Incomplete Data via the EM Algorithm. J. R. Stat. Soc. Ser. B 1977, 39, 1–38. [Google Scholar]
- Mc Lachlan, G.; Krishnan, T. The EM Algorithm and Extensions, 1st ed.; Willey and Sons: Hoboken, NJ, USA, 1997. [Google Scholar]
- Zepeda-Mendoza, M.L.; Resendis-Antonio, O. Hierarchical Agglomerative Clustering. In Encyclopedia of Systems Biology; Dubitzky, W., Wolkenhauer, O., Cho, K.H., Yokota, H., Eds.; Springer: New York, NY, USA, 2013; pp. 886–887. [Google Scholar] [CrossRef]
- Clark-Carter, D. z Scores; John Wiley and Sons, Ltd.: Hoboken, NJ, USA, 2014. [Google Scholar]
- Rousseeuw, P. Silhouettes: A Graphical Aid to the Interpretation and Validation of Cluster Analysis. J. Comput. Appl. Math. 1987, 20, 53–65. [Google Scholar] [CrossRef]
- Mantini, P.; Shah, S.K. Human Trajectory Forecasting In Indoor Environments Using Geometric Context. In ICVGIP ’14: Proceedings of the 2014 Indian Conference on Computer Vision Graphics and Image Processing; Association for Computing Machinery: New York, NY, USA, 2014. [Google Scholar] [CrossRef]
- Hasan, I.; Setti, F.; Tsesmelis, T.; Belagiannis, V.; Amin, S.; Del Bue, A.; Cristani, M.; Galasso, F. Forecasting People Trajectories and Head Poses by Jointly Reasoning on Tracklets and Vislets. IEEE Trans. Pattern Anal. Mach. Intell. 2019, 43, 1267–1278. [Google Scholar] [CrossRef] [PubMed]
- Wang, P.; Wu, S.; Zhang, H.; Lu, F. Indoor Location Prediction Method for Shopping Malls Based on Location Sequence Similarity. ISPRS Int. J. Geo-Inf. 2019, 8, 517. [Google Scholar] [CrossRef]
- Sadeghian, A.; Kosaraju, V.; Gupta, A.; Savarese, S.; Alahi, A. TrajNet: Towards a Benchmark for Human Trajectory Prediction. arXiv 2018. [Google Scholar]



| Readings | Detection Points per Visit | Trajectories | |
|---|---|---|---|
| 40,408 | min:11 | max:64 | 1368 |
| Class | Whole Set | Week Days | Weekends |
|---|---|---|---|
| 0 | 24% | 21% | 33% |
| 1 | 19% | 19% | 15% |
| 2 | 25% | 27% | 24% |
| 3 | 16% | 16% | 15% |
| 4 | 13% | 15% | 12% |
| Class | Whole Set | Week Days | Weekends |
|---|---|---|---|
| 0 | 2445 | 2237 | 2346 |
| 1 | 4089 | 4095 | 4004 |
| 2 | 3475 | 3564 | 3429 |
| 3 | 2055 | 1990 | 2242 |
| 4 | 2449 | 2674 | 3065 |
| Class | Whole Set | Week Days | Weekends |
|---|---|---|---|
| 0 | 24% | 23% | 24% |
| 1 | 28% | 25% | 25% |
| 2 | 28% | 29% | 25% |
| 3 | 22% | 22% | 21% |
| 4 | 22% | 22% | 22% |
Publisher’s Note: MDPI stays neutral with regard to jurisdictional claims in published maps and institutional affiliations. |
© 2021 by the author. Licensee MDPI, Basel, Switzerland. This article is an open access article distributed under the terms and conditions of the Creative Commons Attribution (CC BY) license (http://creativecommons.org/licenses/by/4.0/).
Share and Cite
Carbajal, S.G. Customer Segmentation through Path Reconstruction. Sensors 2021, 21, 2007. https://doi.org/10.3390/s21062007
Carbajal SG. Customer Segmentation through Path Reconstruction. Sensors. 2021; 21(6):2007. https://doi.org/10.3390/s21062007
Chicago/Turabian StyleCarbajal, Santiago García. 2021. "Customer Segmentation through Path Reconstruction" Sensors 21, no. 6: 2007. https://doi.org/10.3390/s21062007
APA StyleCarbajal, S. G. (2021). Customer Segmentation through Path Reconstruction. Sensors, 21(6), 2007. https://doi.org/10.3390/s21062007


