Article

EEG-Based Sleep Staging Analysis with Functional Connectivity

1
School of Computer Science and Technology, Hangzhou Dianzi University, Hangzhou 310018, China
2
Key Laboratory of Brain Machine Collaborative Intelligence of Zhejiang Province, Hangzhou Dianzi University, Hangzhou 310018, China
3
Sleep and NeuroImaging Center, Faculty of Psychology, Southwest University, Chongqing 400715, China
4
Key Laboratory of Cognition and Personality, Ministry of Education, Chongqing 400715, China
5
School of Automation, Hangzhou Dianzi University, Hangzhou 310018, China
*
Author to whom correspondence should be addressed.
Sensors 2021, 21(6), 1988; https://doi.org/10.3390/s21061988
Submission received: 29 December 2020 / Revised: 26 February 2021 / Accepted: 8 March 2021 / Published: 11 March 2021
(This article belongs to the Special Issue Intelligent Biosignal Analysis Methods)

Abstract

:
Sleep staging is important in sleep research since it is the basis for sleep evaluation and disease diagnosis. Related works have acquired many desirable outcomes. However, most of current studies focus on time-domain or frequency-domain measures as classification features using single or very few channels, which only obtain the local features but ignore the global information exchanging between different brain regions. Meanwhile, brain functional connectivity is considered to be closely related to brain activity and can be used to study the interaction relationship between brain areas. To explore the electroencephalography (EEG)-based brain mechanisms of sleep stages through functional connectivity, especially from different frequency bands, we applied phase-locked value (PLV) to build the functional connectivity network and analyze the brain interaction during sleep stages for different frequency bands. Then, we performed the feature-level, decision-level and hybrid fusion methods to discuss the performance of different frequency bands for sleep stages. The results show that (1) PLV increases in the lower frequency band (delta and alpha bands) and vice versa during different stages of non-rapid eye movement (NREM); (2) alpha band shows a better discriminative ability for sleeping stages; (3) the classification accuracy of feature-level fusion (six frequency bands) reaches 96.91% and 96.14% for intra-subject and inter-subjects respectively, which outperforms decision-level and hybrid fusion methods.

1. Introduction

With social pressure increasing in this high-speed development era, more and more people are faced with deep sleeping problems. The chronic lack of sleep or getting poor-quality sleep is a risk factor for cognitive disorders, mood disorders, and diseases such as high blood pressure, cardiovascular disease, diabetes, depression, and obesity [1,2]. Sleep staging is the basis of sleep quality evaluation, and plays an important role in the early diagnosis and intervention of sleep disorders. In 1968, R&K [3] identified sleep staging into awake, rapid eye movement (REM) and non-rapid eye movement (NREM) stages, and NREM is further subdivided into four stages: S1, S2, S3, and S4. Since S3 and S4 are similar in many aspects, American Academy of Sleep Medicine (AASM) [4] revised the R&K rules and used N1, N2, N3 to represent different sub-stages for NREM stage, combining both S3 and S4 into N3 stage.
In practice, clinical sleep staging is still based on visual inspection by sleep experts for decades according to the duration and proportion of special brain waves. Such waves during sleep include delta waves, alpha waves, sleep spindle waves and K-complex waves. Delta waves are slow waves, mainly appearing in N2 and N3 stages with different proportions. The frequency range of the alpha wave (8–13 Hz) and sleep spindle wave (12.5–15.5 Hz) is partially overlapping. Alpha waves generally appears in the REM stage. Both frequency band range and the occurring brain area of sleep spindle waves are different between N2 and N3 stage. The k-complex waves are the combination of apical waves and sleep spindle waves. The types and spatial distributions of these waves are different during sleep stages, see Table 1 for more details. Therefore, frequency bands should be considered in sleep staging analysis.
However, such manual sleep staging judgment by sleep experts easily brings problems of low efficiency, long time consuming, and subjective errors. Chapotot et al. [5] show that the average same judgment accuracy between two experts in labeling sleep-wake stage scores is only about 83%. Therefore, a more accurate and objective method for sleep staging is very required. Moreover, sleep is a complex and dynamic process, so that humans always hope to have a better understand of the brain mechanisms of sleep for human health. With the help of the signal recording technology, several sleep physiological signals acquisition methods are existed. For instance, polysomnography is a powerful tool for sleep signal acquisition including electroencephalography (EEG), electromyography (EMG), functional magnetic resonance imaging (fMRI), and electrooculography (EOG). Herein, EEG has advantages of low cost, high temporal resolution and easy operation which result in the wide application in sleep stages research [6,7]. Afterwards, sleep-related researchers take use of the recorded signals to conduct sleep staging research.
For computational sleep staging research, the main objective of this area is to find out discriminative features and good-performing classification strategies. Currently, EEG-based sleep staging research has brought out many desirable results such as most of the features are extracted from the single channel and end-to-end classifier models [8,9,10,11,12,13,14]. For instance, Ahmed et al. [15] designed a 34-layer deep residual neural network to classify the raw single-channel EEG sleep staging data and obtained the improved accuracy of 6.3%. This end-to-end classifier usually has a good classification performance, but it lacks the exploration of sleep mechanisms. On the other hand, Thiago et al. [16] proposed a feature extraction method based on wavelet domain, which increases the classification performance nearly 25% compared to the temporal and frequency domains; Zhang et al. [17] proposed a feature selection method based on metric learning to find out the optimal features. However, existing feature extraction methods (temporal, frequency and temporal-frequency domains) are difficult to explore the sleep staging information from a global level [18,19,20] since the calculation is performed on single-channel separately. [21,22] also pointed out that the amount of information obtained through a single channel does not fully characterize the changes in brain activity during sleep.
Brain functional network is a relative new measurement to characterize the information exchanging between brain region through calculating the temporal correlation or coherence between brain areas. It is verified that each sleep stage is associated with a specific functional connectivity pattern in fMRI studies [23,24,25]. EEG-based brain functional connectivity has been employed in sleep research [26,27,28] to distinguish the sleep disease and health groups. We would use functional connectivity to explore the synchronization mechanisms between different brain regions and the classification accuracy for sleep staging.
In summary, in addition to pursuing the higher classification accuracy, we also want to, within different frequency bands, explore the information exchanging between brain areas for sleep staging. Specifically, this paper analyzed the sleep stage with single-band functional connectivity and then used the bi-serial correlation coefficient method to evaluate the frequency bands. Based on the evaluation results, features from frequency band are fused at the feature-level, decision-level and hybrid-level, respectively. Furthermore, we also investigated the mutual influence between frequency bands to identify the sleep stages. The remaining parts of this paper are organized as follows. Section 2 describes the materials and our method. Section 3 indicates all results. Section 4 and Section 5 provides the discussions and summarizes the future work, respectively.

2. Materials and Methods

2.1. Dataset Description

The data analyzed in this manuscript is from the public CAP Sleep Database [29,30]. The database was built to facilitate sleep research that includes 108 polysomnographic recordings provided by the Sleep Disorders Center of the Ospedale Maggiore of Parma, Italy. There are 16 healthy subjects without any neurological disorders and drug problems. The number of EEG channels varies from 3 to 12 and the data with the number of channels as more as possible are needed for functional brain connectivity calculation, therefore, we selected the subjects (namely n3, n5, n10, n11 respectively) who were recorded with 12 EEG channels, aging between 23 and 35 (mean 30.25) years old. According to the International 10–20 System, the placements of the bipolar electrodes were Fp2-F4, F4-C4, C4-P4, P4-O2, F8-T4, T4-T6, Fp1-F3, F3-C3, C3-P3, P3-O1, F7-T3, and T3-T5, shown in Figure 1. The sampling rate is set at 512 Hz. For each subject, the continuous recorded sleep EEG lasted about 9 h (from 10:30 p.m. to 7:30 a.m.).
The experts labeled sleep stages based on the standard rules by R&K every 30 s and sleep is a cyclical process, the duration of a cycle is about 90 to 110 min, humans generally experience 4 to 5 sleep cycles per night [3]. Since the N1 accounts for 5–10% or less of the total sleep duration (only lasts about 1–7 min) [31], we selected the other three sleep stages including the REM and N2, N3 during non-REM.

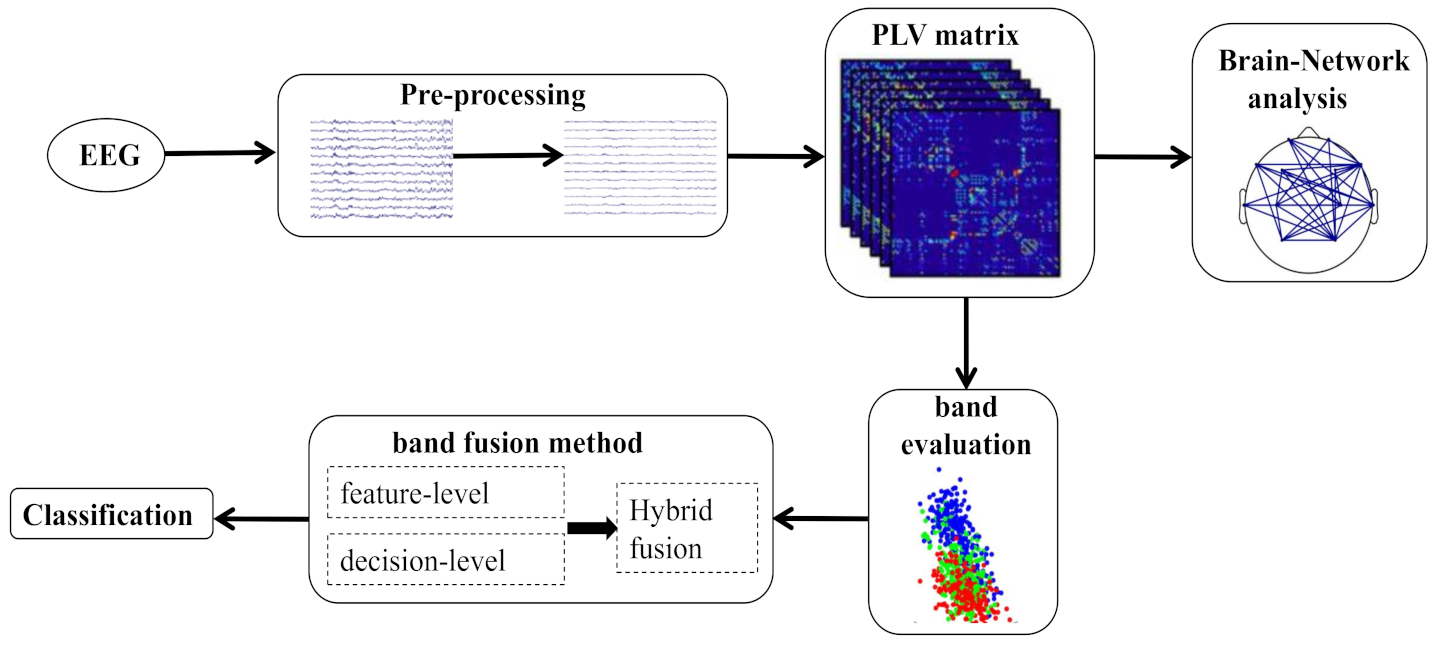
2.2. Framework of Our Method

In this study, we first perform data preprocessing, then calculated the brain functional connectivity for different frequency bands to compare the characteristics of brain mechanism during sleep stages. Moreover, bi-serial correlation coefficient was adopted to evaluate brain connectivity features across different frequency bands. Then, we used three fusion strategies for frequency band fusion to classify the sleep stages based on the findings in the frequency band evaluation results. The framework of our method was depicted in Figure 2.

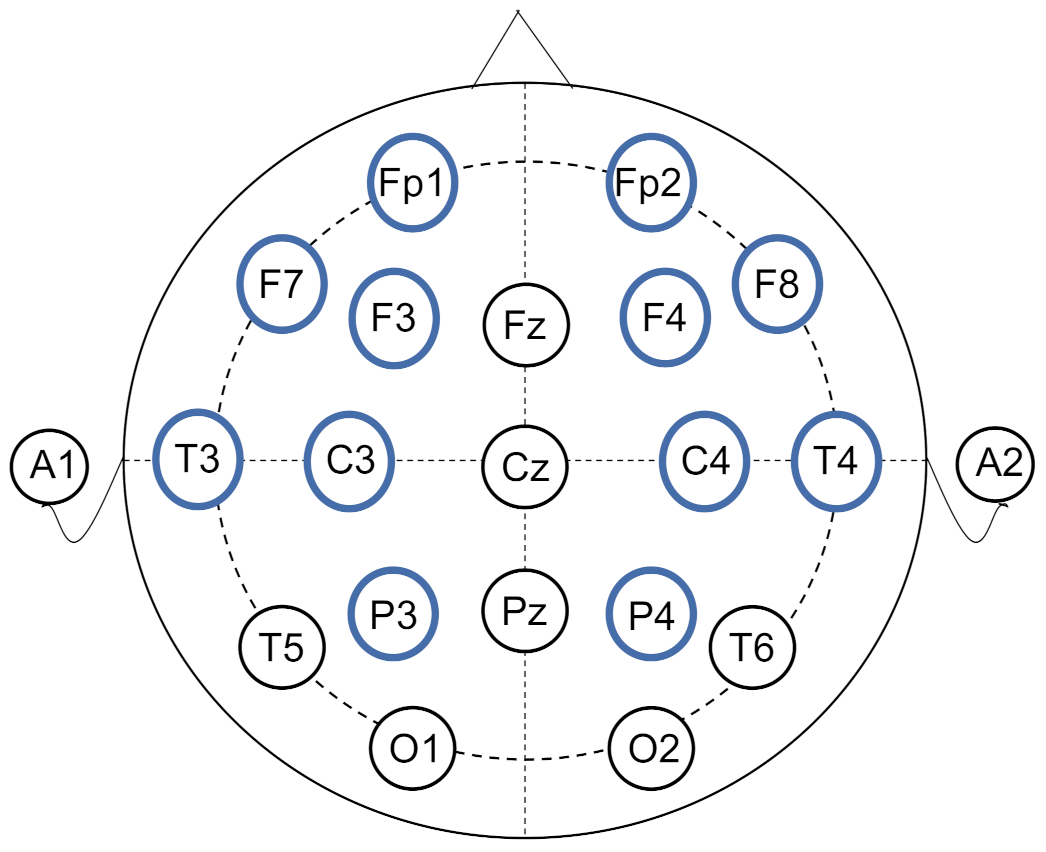
2.2.1. Data Preprocessing

It is difficult to draw clear boundaries between different sleep stages because the stage usually changes gradually and continuously. To confirm the sampling with the exact sleeping stage label, we delete the following three kinds of data that:
  • belonging to the same stage, but duration is too short (such as only 2 to 3 min).
  • the unusual waking duration (tens of seconds) and its before and after 30 s duration during a certain sleep stage.
  • the beginning 30 s and the last 30 s of a certain sleep stage.
After that, we segmented the EEG into 30 s epochs as analyzed samples without overlapping. Note: for sleep staging, the adopted 30 s epoch is derived from the R&K and AASM rules [32], and related works also revealed that 30 s length of epoch is viable to characterize intrinsic brain activity [33,34]. The total number of samples with sleep staging labels REM, N2 and N3 is 801, 900, and 1001, respectively. Herein, the number of samples from subjects n3, n5, n10, n11 is 651, 639, 559 and 853, respectively.
For data preprocessing, we adopted common average reference (CAR) [35] to minimize the uncorrelated noise among channels, then we removed the artifacts with independent component analysis (ICA) [36] and Adjust plugin which is realized in EEGLAB [37] followed by the band-pass filtering with a passband from 0.5 to 40 Hz. Furthermore, we filtered the denoised EEG into six frequency bands: delta (0.5–4 Hz), theta (4–8 Hz), alpha (8–13 Hz), beta1 (13–22 Hz), beta2 (22–30 Hz), and gamma (30–40 Hz).

2.2.2. Phase-Locked Value

We estimated brain functional connectivity with phase-locked value (PLV). The PLV [38] was proposed to measure the phase synchronization between two signals which is only sensitive to phase but not to amplitude. Compared with other synchronization measures, PLV is simple to operate and can maintain the same information level as other more complex indicators [39]. Here, the PLV is used to analyze the phase synchronization between two channels of EEG in specific frequency, defined as follow:
P L V n = 1 N | k = 1 N e i ( ϕ ( t , k ) ψ ( t , k ) ) |
where N represent the number of epochs, ϕ ( t , k ) and ψ ( t , k ) indicates the phase values of channel ϕ and ψ for the epoch n at the time t. Specifically, we used HERMES toolbox [40] to obtain PLV matrices. In our case, 12 channels of EEG were used, which resulted in 12 × 12 symmetric matrix for each epoch. Each entry in matrix stood for synchronization of a pair of channels. This synchronization calculation was done for six frequency bands of each subject. The one-way ANOVA was used to assess differences between sleep stages or frequency bands of the PLV for REM, N2 and N3 stages. The observed returning values of ANOVA is p-value and lower p-value means more significant difference.
In addition, we also compared the brain network analysis between sleep stages with PLV matrices. We averaged the PLV matrix for each sleep stage and constructed the brain networks based on a threshold. The threshold is selected from the maximum value at which no isolated points appearing in the network.

2.2.3. Band Evaluation

We use bi-serial correlation coefficient as an indicator to measure the ability of features to classify classes. The bi-serial correlation coefficient, r 2 , is a measurement to evaluate the performance of one feature in distinguishing various classes. For a two-classes classification scenario (class 1, 2), the bi-serial correlation coefficient is defined as:
r X 2 = [ N + × N × [ m e a n ( X + ) m e a n ( X ) ] ( N + × N ) × s t d ( X + X ) ] 2
where X + and X represent all samples of class 1 and class 2, respectively. The N + and N indicate the number of two class samples [41]. The r 2 is ranging from 0 to 1 and its bigger value means more discriminate between the two classes. We calculated the bi-serial correlation coefficient between every two sleep stages (REM and N2, REM and N3, and N2 and N3) for PLV feature matrices. In total, we sorted the 3 × 66 × 6 (sleep stages × PLV × frequency bands) r 2 values to evaluate the features across different frequency bands. We also defined the discriminative ratio as setting a threshold t to represent the number of features, calculating the sum of the first sorted t r 2 between every two sleep stages and then obtaining the ratio of each frequency band. In our case, t is set to 36.

2.2.4. Classifier

We adopted support vector machine (SVM) with the Gaussian kernel function, which is implemented in the LIBSVM library [42]. The way to achieve multi-class classification is used the One-against-one strategy. We evaluated classification performance in terms of accuracy for single frequency band and the three level strategies fusion between frequency bands. The 75% samples were used for model training and the remaining 25% samples were used as testing data.

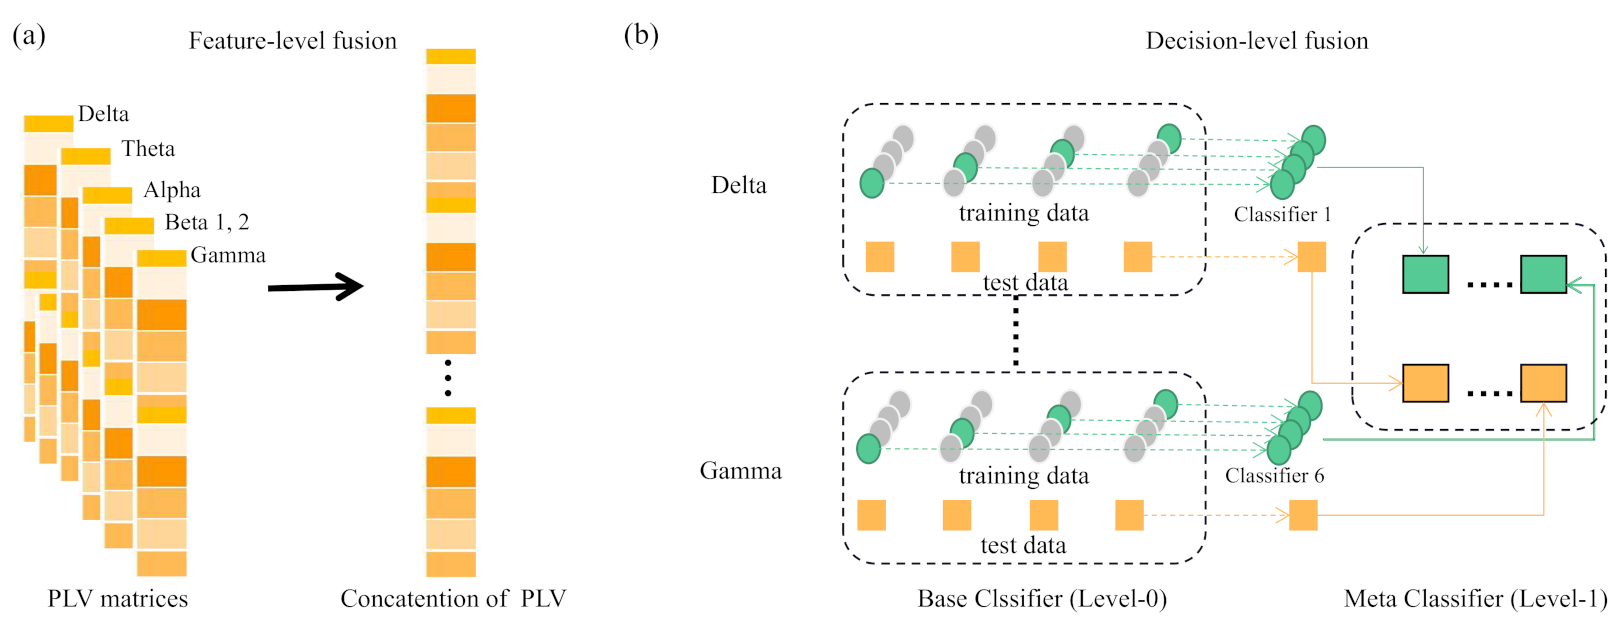
2.2.5. Frequency Band Fusion Strategy

Based on the evaluation of brain functional connectivity across different frequency bands, we used three band fusion strategies to integration of multiple information sources for classification. The multiple information sources refer to the brain functional connectivity features of different frequency bands and the three fusion strategies are feature-level fusion, decision-level fusion, and hybrid-level fusion. The graphical description of feature-level and decision-level fusion strategies are shown in Figure 3.
For feature-level fusion, we concatenated the PLV features of six frequency bands before feeding into classifier; For decision fusion using stacking [43], we constructed individual classifiers for PLV features of a single frequency band separately, namely base classifier and then a meta classifier learns to use the predictions of each base classifier to obtain a target decision result. For hybrid fusion, we combined feature-level and decision-level fusions, which includes two steps: first constructing individual classifiers for specific groups of selected two frequency bands based on the band evaluation result and then conducting ensemble classifier of these individual classifiers. Hereinafter, ‘C’, ‘E’ and ’E(C)’ represent the classification result obtained by using the feature after feature-level fusion, decision-level fusion and hybrid fusion strategy, respectively.

3. Results

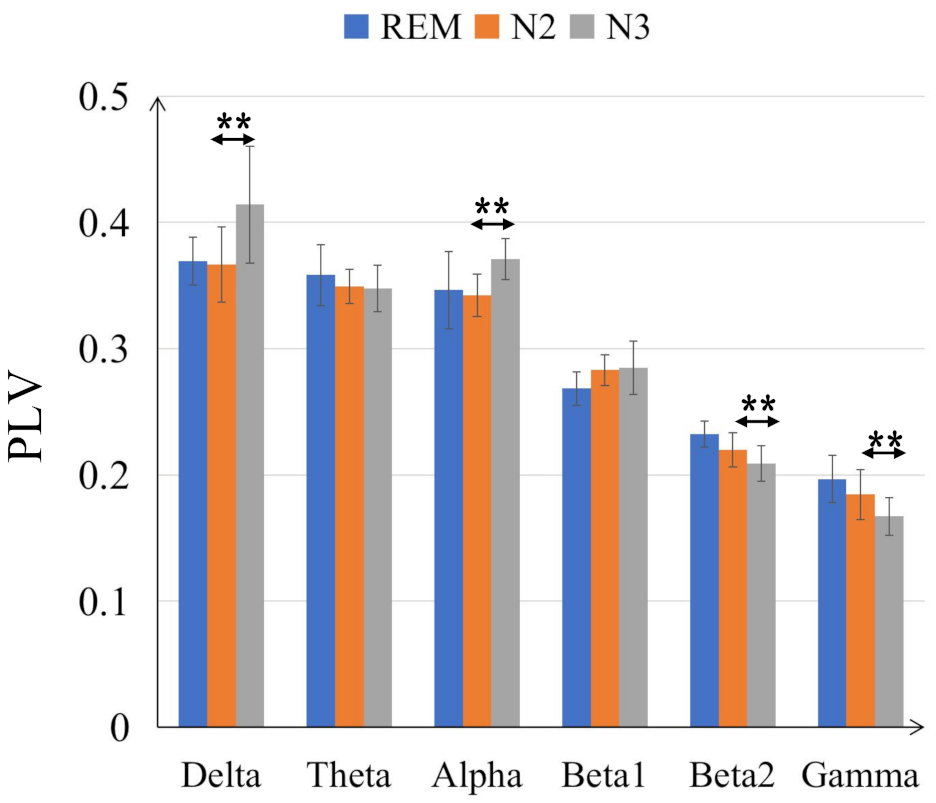
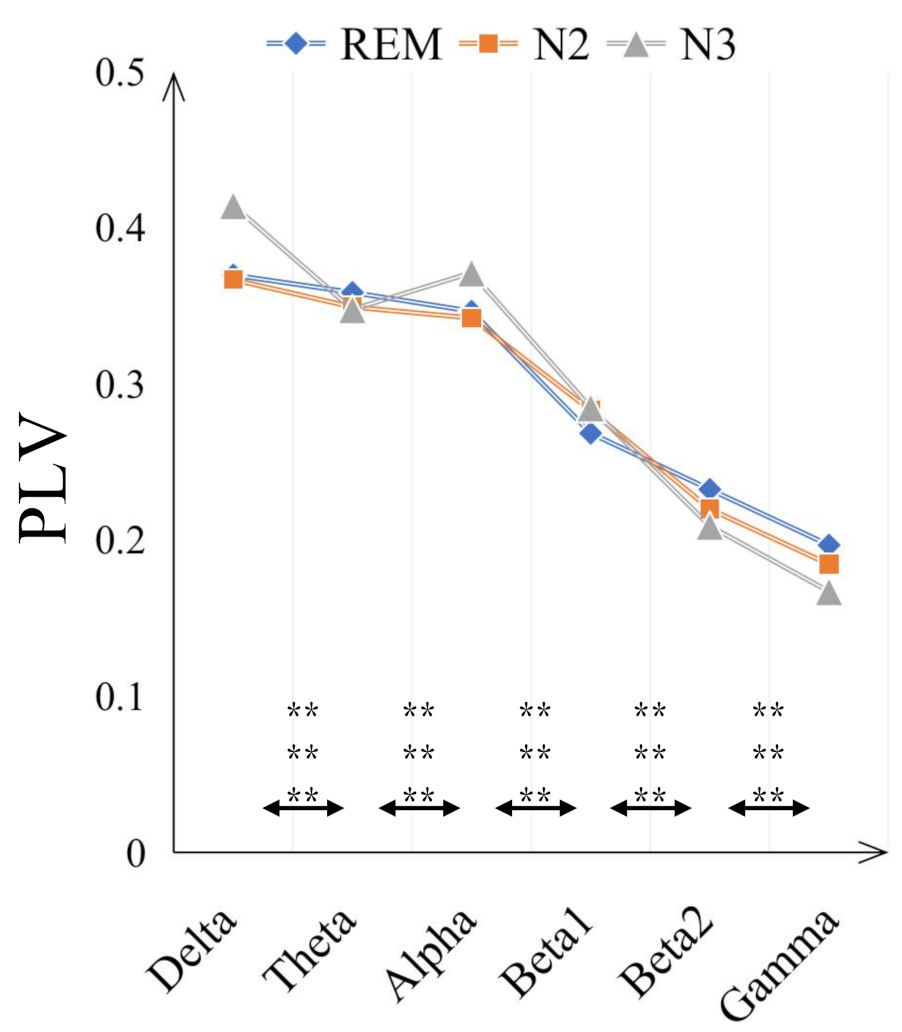
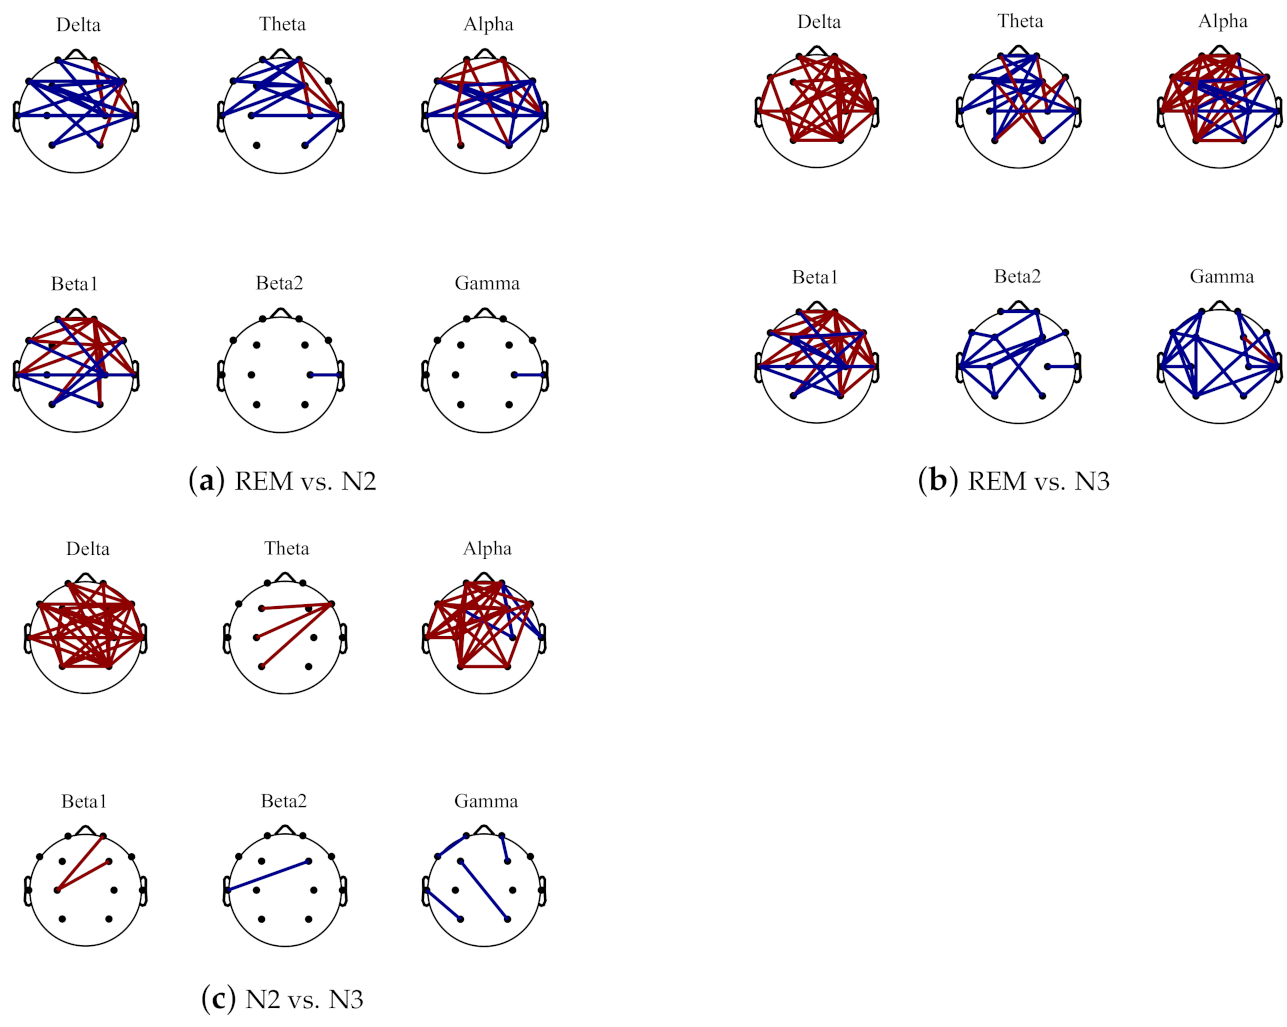
3.1. PLV Values between Six Frequency Bands for Different Sleep Stages

The comparisons on average PLV between six frequency bands for three sleep stages are in Figure 4. In some low frequency bands, delta and alpha bands, the PLV values are increased from N2 to N3 sleep stages while in high frequency bands, beta2 and gamma bands, the PLV values are decreased. Moreover, compared with N2 sleep stage, the PLV value for N3 is significantly bigger (with p < 0.001) in delta and alpha bands but smaller in beta 2 and gamma bands. Generally, the PLV values are significantly decreased as the frequency bands increase, from delta to gamma bands for REM, N2 and N3 sleep stages. Only the PLV value of alpha is significantly bigger than theta band, shown in Figure 5. Figure 6 displays the differences between sleep stages for brain network analysis from which the spatial distributions of PLV differences can be observed.

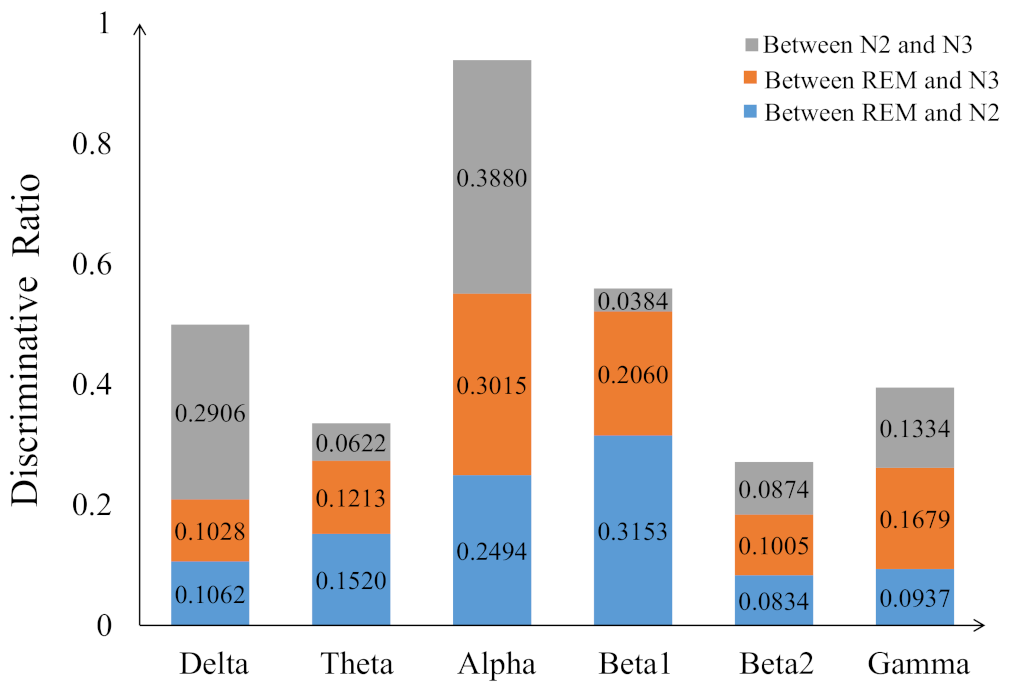
3.2. Evaluation of Different Frequency Bands

Figure 7 displays the percentage of corresponding frequency bands within the first 95 and 140 sorted r 2 values cases. Alpha band shows the largest percentage in both cases, accounting for 49.74% and 45.00% and followed by beta1, accounting for 30.79% and 27.14%, respectively. The smallest percentage is beta2 band with only 0.26% and 1.79%. The 2-D figure of PLV feature visualization for each frequency band is shown in Figure 8. The ’Feature 1’ and ’Feature2’ are the features with first two largest r 2 ¯ and the r 2 ¯ is averaged through the three r 2 obtained between each two classes. We can see that the PLV features extracted from alpha band shows a better discriminate ability. Figure 9 reveals the discriminative ratio of frequency bands for sleep staging. Alpha band also shows the higher ratio than other bands which is consistent with the Figure 7 as well as the following Table 2. The discriminative ratios are different for a certain frequency band (such as delta and beta1 bands) in distinguishing different paired sleep stages. For instance, the ratio is not high in distinguishing REM and N2, REM and N3 while it reaches 29.06% in distinguishing N2 and N3.

3.3. Classification

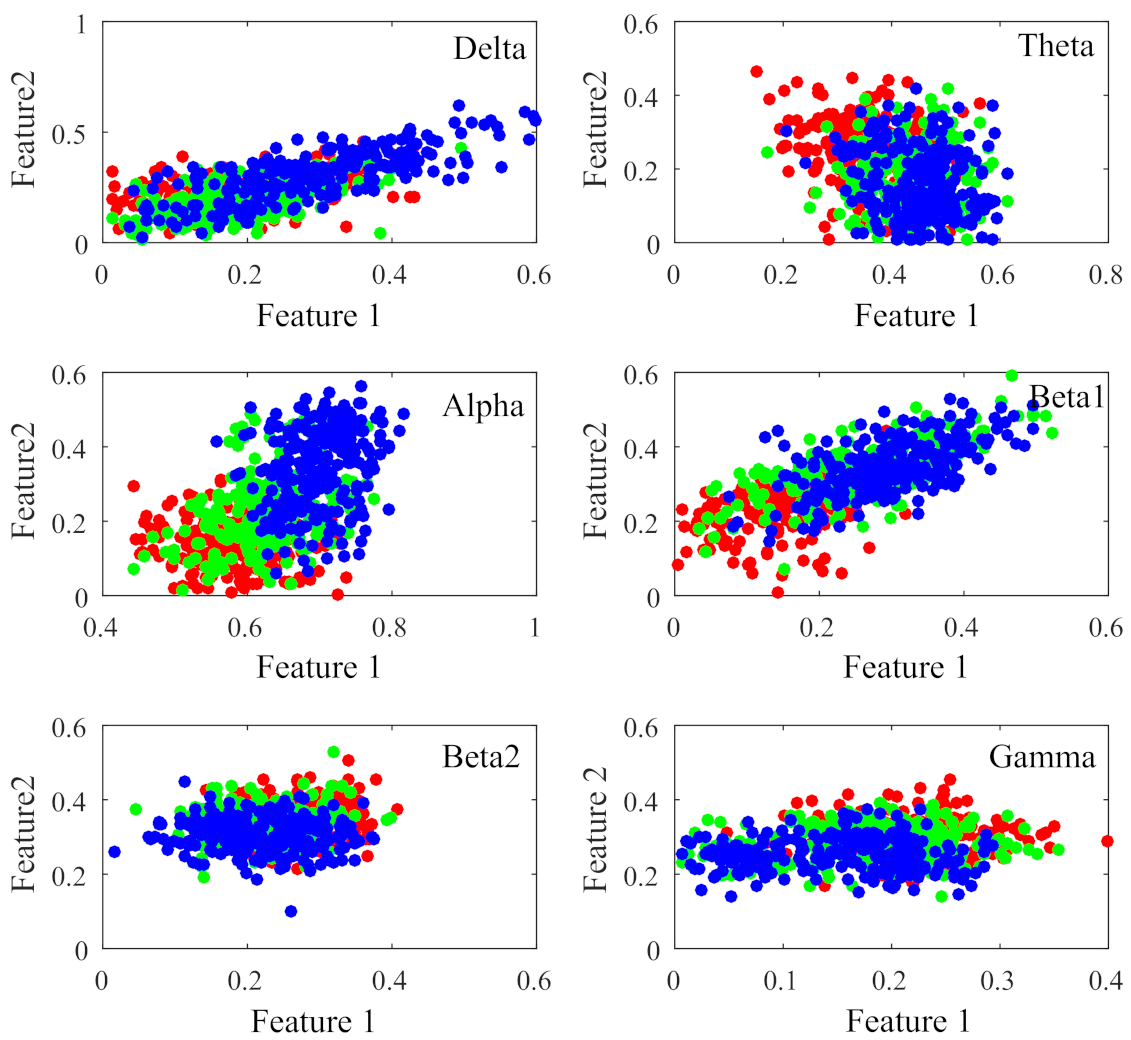
3.3.1. Classification Performance of Single-Band Feature

The average classification accuracy of PLV with single-band for intra-subject and inter-subject are shown in Table 2. For intra-subject case, alpha band outperforms other bands except for subject n5 and the best classification accuracy reaches 94.96% followed by beta1 band 92.81% (from subject n10). For inter-subject case, alpha band also outperforms other bands. The best classification accuracy reaches 90.86% followed by delta 86.86%; There is a special result that the accuracy of beta1 reaches 92.81% from subject n10, while the accuracy is only 82.86% in inter-subject case. The true positive rates for N2 and N3 are 76.57% and 81.07%, respectively and they are smaller than other bands.

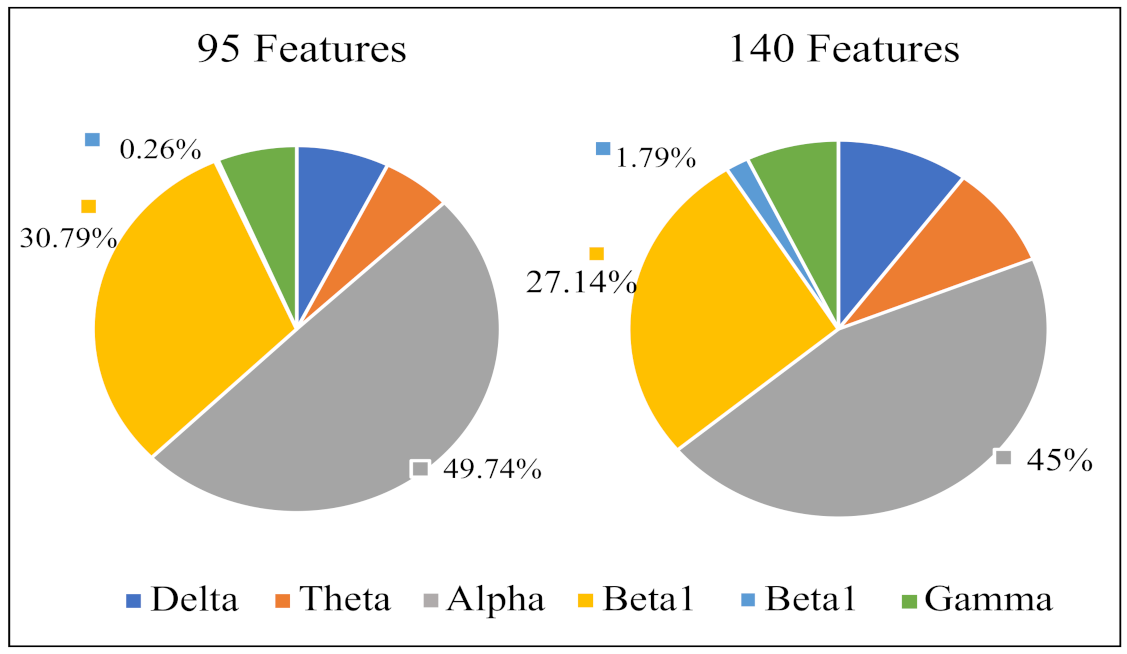
3.3.2. Classification Performance for Bands Fusion

Based on the results of different frequency bands evaluation (Section 3.2), we explored the three band fusion strategies for sleep staging. The two, three and four frequency bands are selected according to the r 2 values, respectively. Specifically, we combined ’delta and beta1’, ’theta and gamma’ and ’alpha and beta2’ since the delta band is complementary to beta1, the beta2 matches the best discriminative alpha, and theta and gamma are combined to make the three splicing results all good. For three frequency bands fusion case, the alpha, beta1 and delta frequency bands are selected according to Figure 7 and Figure 9 and further gamma frequency band is added to the four frequency bands fusion case. Finally, six frequency bands are used in feature-level, decision-level and hybrid-level fusions.
The classification performance of feature-level is better than decision-level and hybrid-level. Among the results of the fusion of six frequency bands, the best single subject is n3, with the accuracy rate of 96.91%, and the accuracy of inter-subjects is 96.14%. Note, compared with intra-subject and inter-subject cases, we can infer that there are not so big individual differences in sleep staging. The Table 3 shows detailed classification result.

4. Discussion

4.1. The Dominant Role of Alpha Band in Sleep Staging

The assessment of sleep staging is based on specific EEG frequencies and on the recognition of corresponding sleep-related EEG patterns [44]. For instance, the amount of alpha decreases and an increase of EEG in alpha range can be found during REM sleep while the alpha frequency is 1 to 2 Hz lower compared with wakefulness during non-REM sleep [45,46]. More Other related works also revealed that alpha band shows important role in sleep staging. Dkhil et al. [47] proposed the importance of alpha band in the evaluation of drowsiness. Knaut et al. [48] finds the changes in alpha oscillations reflect different brain states associated with different levels of wakefulness and thalamic activity. Specifically, in our study, alpha band shows dominant role in sleep staging since the PLV values are decreased as the frequency band increased, but alpha band is higher than theta band (see Figure 5); in the frequency band evaluation section (Section 3.2), alpha band shows higher discriminative ratio revealed by bi-serial correlation and 2-D feature topoplot also shows alpha band has the less overlapping area than other bands; for classification results (see Section 3.3), alpha band outperforms other bands in both intra-subject (except for subject n5) and inter-subject cases.

4.2. Inconsistency between Frequency Band Evaluation and the Classification Accuracy of Beta1 Band

EEG beta activity represents a marker of cortical arousal [49]. The conventional power spectrum shows a significant increase of EEG in beta band of patients with primary insomnia during N2 stage [50] while a decrease of patients with idiopathic REM sleep behavior disorder during phasic REM [51] compared with sleep health people. In our study, we observed the inconsistency between frequency band evaluation and the classification accuracy of EEG functional connectivity pattern in beta1 frequency band. In frequency band evaluation, the number of selected features of beta1 band is only less than alpha band (see Figure 7) and discriminative ratios of beta1 between ’REM and N2’ and ’REM and N3’ are very high, but the classification accuracy is generally low. We can also observe that the discriminative ratios of beta1 between ’N2 and N3’ is lowest in all bands (see Figure 9) and the true positive rate of the N2 and N3 stages is lower than other frequency bands (see Table 2). This may explain the inconsistency of the beta1 frequency band between band evaluation and classification accuracy. The special result from subject n10 shows achieved a high accuracy rate of 92.81% in beta1, while only 74.74–82.86% for other cases. Tracking the original data of subject n10, we found that there is no S3 stage which results in the deceasing decision error between N2 and N3.

4.3. Comparisons with Start-of-Arts Works

We compared our method with the start-of-arts in sleep staging classification research, shown in Table 4. Sors et al. [52] designed an end-to-end convolutional neural network(CNN) to classify the sleep stages using the raw signals and obtained the accuracy of 90.74%. Sharma et al. [53] used classical three time-domain features: log energy, signal fractal dimension, and signal sample entropy and multi-class SVM as the classifier and the ACC(N1 U N2, N3, REM) is 81.13%. Lajnef et al. [54] extracted 102 features covering the time-domain, frequency-domain and non-linear features. The accuracy of three classifications (REM, N2, N3) is 87.06% obtained by decision-tree-based multi-SVM; Michielli et al. [55] also combined feature extraction and deep learning and the ACC(REM U N1, N2, N3) is 90.6%. We also used their method on the CAP data set. Our method shows a better accuracy result compared with these related works. Hopefully, this method would be applied for automatic sleep staging and medical intervention of sleep disorders. For instance, in chronic insomnia, using transcranial direct current stimulation in N2 can increase the duration of N3 and sleep efficiency and the probability of transition from N2 to N3 [56] which requires more accurate separation of N2 and N3.

5. Conclusions

In this paper, we proposed a method to classify sleep stages with brain functional connectivity. We analyzed the characteristics of brain network during different sleep stages and explored the influences of frequency bands for sleep staging classification. After applying a simple machine learning method (multi-class SVM) and a series of analysis, we obtained that:
1.
For brain functional connectivity values, the average PLV increases in the delta and alpha band, while decreases in the high frequency beta2 and gamma band during non-REM periods;
2.
Different frequency bands have different discriminative abilities for distinguishing between sleep stages. Herein, alpha band show the dominant role in sleeping stage. Beta1 band shows good performance for classifying ’REM and N2’ and ’REM and N3’ but higher classification error rate for ’N2 and N3’.
3.
The classification performance of PLV is better than state-of-art studies. The best accuracy is 96.91% and 96.14% for intra-subject and inter-subject cases, respectively. We also replicated time-domain, frequency-domain and non-linear features on the data set used in our paper and results show the better performance of PLV.
In the future, we plan to develop on online brain computer interface for automatic sleep staging monitoring combined with this approach and graph convolution network.

Author Contributions

Conceptualization, L.Z. (Li Zhu); methodology, H.H., L.Z. (Li Zhu), J.Z.; programming, H.H., J.T., G.L.; writing, L.Z. (Li Zhu), H.H.; revising and writing-editing, L.Z. (Li Zhu), H.H., W.K., X.L., L.Z. (Lei Zhu); visualization, H.H., L.Z. (Lei Zhu); founding acquisition, L.Z. (Lei Zhu), W.K. All authors have read and agreed to the published version of the manuscript.

Funding

The work was supported by the National Natural Science Foundation of China (No.61633010) and Key Research and Development Project of Zhejiang Province (2020C04009, 2018C04012) and National Key Research & Development Project (2017YFE0116800), Fundamental Research Funds for the Provincial Universities of Zhejiang (GK209907299001-008), Joint Funds of the National Natural Science Foundation of China (U1609218) and was also supported by Laboratory of Brain Machine Collaborative Intelligence of Zhejiang Province (2020E10010).

Data Availability Statement

The data used in the manuscript is a public dataset, namely CAP Sleep Database, please see the link https://www.physionet.org/content/capslpdb/1.0.0/, accessed on 9 November 2018. We conform to the terms of the specified license.

Acknowledgments

We would like to thank all the reviewers for their constructive comments.

Conflicts of Interest

The authors declare that there is no conflict of interest regarding the publication of this paper.

References

  1. Altevogt, B.M.; Colten, H.R. Sleep Disorders and Sleep Deprivation: An Unmet Public Health Problem; Washington: National Academies Press, 2006. [Google Scholar]
  2. Younes, M. The Case for Using Digital EEG Analysis in Clinical Sleep Medicine. Sleep Sci. Pract. 2017, 1, 1–15. [Google Scholar] [CrossRef]
  3. Rechtschaffen, A. A Manual of Standardized Terminology, Techniques and Scoring System for Sleep Stages of Human Subjects; Public Health Service: Washington, DC, USA, 1968. [Google Scholar]
  4. Iber, C.; Ancoli-Israel, S.; Chesson, A.L.; Quan, S.F. The AASM Manual for the Scoring of Sleep and Associated Events: Rules, Terminology and Technical Specifications; American Academy of Sleep Medicine: Westchester, IL, USA, 2007; Volume 1. [Google Scholar]
  5. Chapotot, F.; Becq, G. Automated Sleep-Wake Staging Combining Robust Feature Extraction, Artificial Neural Network Classification, and Flexible Decision Rules. International Journal of Adaptive Control and Signal Processing. 2010, 24, 409–423. [Google Scholar] [CrossRef]
  6. Acharya, U.R.; Sree, S.V.; Swapna, G.; Martis, R.J.; Suri, J.S. Automated EEG Analysis of Epilepsy: A Review. Knowledge-Based Systems 2013, 45, 147–165. [Google Scholar] [CrossRef]
  7. Aydın, S.; Tunga, M.A.; Yetkin, S. Mutual Information Analysis of Sleep EEG in Detecting Psycho-physiological Insomnia. J. Med. Syst. 2015, 39, 43. [Google Scholar] [CrossRef]
  8. Liu, Y.; Yan, L.; Zeng, B.; Wang, W. Automatic Sleep Stage Scoring Using Hilbert-Huang Transform with BP Neural Network. In Proceedings of the 2010 4th International Conference on Bioinformatics and Biomedical Engineering, Chengdu, China, 18–20 June 2010. [Google Scholar]
  9. Gao, Q.; Zhou, J.; Ye, B.; Wu, X. Automatic Sleep Staging Method Based on Energy Features and Least Squares Support Vector Machine Classifier. Journal of Biomedical Engineering 2015, 32, 531–536. [Google Scholar]
  10. Yuce, A.B.; Yaslan, Y. A Disagreement Based Co-active Learning Method for Sleep Stage Classification. In Proceedings of the 2016 International Conference on Systems, Signals and Image Processing (IWSSIP), Bratislava, Slovak, 23–25 May 2016. [Google Scholar]
  11. Diykh, M.; Li, Y.; Wen, P. EEG Sleep Stages Classification Based on Time Domain Features and Structural Graph Similarity. IEEE Trans. Neural Syst. Rehabil. Eng. 2016, 24, 1159–1168. [Google Scholar] [CrossRef]
  12. Diykh, M.; Li, Y.; Wen, P.; Li, T. Complex Networks Approach for Depth of Anesthesia Assessment. Measurement 2018, 119, 178–189. [Google Scholar] [CrossRef]
  13. Phan, H.; Andreotti, F.; Cooray, N.; Chèn, Y.O.; De Vos, M. DNN Filter Bank Improves 1-max Pooling CNN for Single-channel EEG Automatic Sleep Stage Classification. In Proceedings of the 2018 40th Annual International Conference of the IEEE Engineering in Medicine and Biology Society (EMBC), Honolulu, HI, USA, 17–21 July 2018; pp. 453–456. [Google Scholar]
  14. Zhou, J.; Tian, Y.; Wang, G.; Liu, J.; Hu, Y. Automatic Sleep Stage Classification with Single Channel EEG Signal Based on Two-layer Stacked Ensemble Model. IEEE Access 2020, 8, 57283–57297. [Google Scholar] [CrossRef]
  15. Humayun, A.I.; Sushmit, A.S.; Hasan, T.; Bhuiyan, M.I.H. End-to-end Sleep Staging with Raw Single Channel EEG using Deep Residual ConvNets. In Proceedings of the 2019 IEEE EMBS International Conference on Biomedical & Health Informatics (BHI), Chicago, IL, USA, 19–22 May 2019; pp. 1–5. [Google Scholar]
  16. da Silveira, T.L.; Kozakevicius, A.J.; Rodrigues, C.R. Single-channel EEG Sleep Stage Classification Based on a Streamlined set of statistical features in wavelet domain. Med. Biol. Eng. Comput. 2017, 55, 343–352. [Google Scholar] [CrossRef]
  17. Zhang, T.; Jiang, Z.; Li, D.; Wei, X.; Guo, B.; Huang, W.; Xu, G. Sleep Staging Using Plausibility Score: A Novel Feature Selection Method Based on Metric Learning. IEEE J. Biomed. Health Inform. 2020, 25, 577–590. [Google Scholar] [CrossRef] [PubMed]
  18. Liang, S.F.; Kuo, C.E.; Hu, Y.H.; Cheng, Y.S. A Rule-based Automatic Sleep Staging Method. J. Neuroence Methods 2012, 205, 169–176. [Google Scholar] [CrossRef]
  19. Liu, X.; Shi, J.; Tu, Y.; Zhang, Z. Joint Collaborative Representation Based Sleep Stage Classification with Multi-channel EEG Signals. In Proceedings of the 2015 37th Annual International Conference of the IEEE Engineering in Medicine and Biology Society (EMBC), Milan, Italy, 5–29 August 2015. [Google Scholar]
  20. Patrick, K.; Achim, S.; Judith, B.; Konstantin, T.; Claus, M.; Holger, S.; Maximilian, T. Analysis of Multichannel EEG Patterns During Human Sleep: A Novel Approach. Front. Hum. Neurosci. 2018, 12, 121. [Google Scholar]
  21. Zhu, G.; Li, Y.; Wen, P.P. Analysis and Classification of Sleep Stages Based on Difference Visibility Graphs From a Single-Channel EEG Signal. IEEE J. Biomed. Health Inform. 2014, 18, 1813–1821. [Google Scholar] [CrossRef] [PubMed]
  22. Gopika, G.K.; Prabhu, S.S.; Sinha, N. Sleep EEG Analysis Utilizing Inter-channel Covariance Matrices. Biocybern. Biomed. Eng. 2020, 40, 527–545. [Google Scholar]
  23. Stevner, A.B.A.; Vidaurre, D.; Cabral, J.; Rapuano, K.; Nielsen, S.F.V.; Tagliazucchi, E.; Laufs, H.; Vuust, P.; Deco, G.; Woolrich, M.W.A. Discovery of Key Whole-brain Transitions and Dynamics during Human Wakefulness and Non-REM Sleep. Nat. Commun. 2019, 10, 1035. [Google Scholar] [CrossRef] [PubMed]
  24. Tagliazucchi, E.; Wegner, F.V.; Morzelewski, A.; Brodbeck, V.; Laufs, H. Breakdown of Long-range Temporal Dependence in Default Mode and Attention Networks during Deep Sleep. Proc. Natl. Acad. Sci. USA 2013, 110, 15419–15424. [Google Scholar] [CrossRef] [PubMed] [Green Version]
  25. Enzo Tagliazucchi, H.L. Decoding Wakefulness Levels from Typical FMRI Resting-state Data Reveals Reliable Drifts between Wakefulness and Sleep. Neuron 2014, 82, 695–708. [Google Scholar] [CrossRef] [Green Version]
  26. Landwehr, R.; Volpert, A.; Jowaed, A. A Recurrent Increase of Synchronization in the EEG Continues from Waking throughout NREM and REM Sleep. ISRN Neurosci. 2014, 2014, 756952. [Google Scholar]
  27. Lv, J.; Liu, D.; Ma, J.; Wang, X.; Zhang, J. Graph Theoretical Analysis of BOLD Functional Connectivity during Human Sleep without EEG Monitoring. PLoS ONE 2015, 10, e0137297. [Google Scholar] [CrossRef] [PubMed]
  28. Marie-Ve, D.; Julie, C.; Jean-Marc, L.; Maxime, F.; Nadia, G.; Jacques, M.; Antonio, Z. EEG Functional Connectivity Prior to Sleepwalking: Evidence of Interplay Between Sleep and Wakefulness. Sleep 2017, 40. [Google Scholar]
  29. Terzano, M.G.; Parrino, L.; Sherieri, A.; Chervin, R.; Chokroverty, S.; Guilleminault, C.; Hirshkowitz, M.; Mahowald, M.; Moldofsky, H.; Rosa, A.; et al. Atlas, Rules, and Recording Techniques for the Scoring of Cyclic Alternating Pattern (CAP) in human sleep. Sleep Med. 2002, 2, 537. [Google Scholar] [CrossRef]
  30. Goldberger, A.L.; Luis, A.N.; Amaral, L.G. PhysioBank, PhysioToolkit, and PhysioNet: Components of a New Research Resource for Complex Physiologic Signals. Circulation 2000, 101, 215–220. [Google Scholar] [CrossRef] [PubMed] [Green Version]
  31. Ohayon, M.M.; Carskadon, M.A.; Christian, G.; Vitiello, M.V. Meta-Analysis of Quantitative Sleep Parameters From Childhood to Old Age in Healthy Individuals: Developing Normative Sleep Values Across the Human Lifespan. Sleep 2004, 27, 1255–1273. [Google Scholar] [CrossRef] [PubMed]
  32. Berry, R.B.; Budhiraja, R.; Gottlieb, D.J.; Gozal, D.; Iber, C.; Kapur, V.K.; Marcus, C.L.; Mehra, R.; Parthasarathy, S.; Quan, S.F.A. Rules for Scoring Respiratory Events in Sleep: Update of the 2007 AASM Manual for the Scoring of Sleep and Associated Events. J. Clin. Sleep Med. 2012, 8, 597–619. [Google Scholar] [CrossRef] [PubMed] [Green Version]
  33. Brignol, A.; Al-Ani, T.; Drouot, X. EEG-based Automatic Sleep-wake Classification in Humans Using Short and Standard Epoch Lengths. In Proceedings of the 2012 IEEE 12th International Conference on Bioinformatics & Bioengineering (BIBE), Larnaca, Cyprus, 11–13 November 2012. [Google Scholar]
  34. Wilson, R.S.; Mayhew, S.D.; Rollings, D.T.; Goldstone, A.; Przezdzik, I.; Arvanitis, T.N.; Bagshaw, A.P. Influence of Epoch Length on Measurement of Dynamic Functional Connectivity in Wakefulness and Behavioural Validation in Sleep. Neuroimage 2015, 112, 169–179. [Google Scholar] [CrossRef]
  35. Ludwig, K.A.; Miriani, R.M.; Langhals, N.B.; Joseph, M.D.; Anderson, D.J.; Kipke, D.R. Using a Common Average Reference to Improve Cortical Neuron Recordings from Microelectrode Arrays. J. Neurophysiol. 2009, 101, 1679–1689. [Google Scholar] [CrossRef]
  36. Lee, T.W. Independent Component Analysis; Springer: Berlin, Germany, 1998; pp. 27–66. [Google Scholar]
  37. Mognon, A.; Jovicich, J.; Bruzzone, L.; Buiatti, M. ADJUST: An Automatic EEG Artifact Detector Based on the Joint Use of Spatial and Temporal Features. Psychophysiology 2011, 48, 229–240. [Google Scholar] [CrossRef]
  38. Lachaux, J.P.; Rodriguez, E.; Martinerie, J.; Varela, F.J.J. Measuring Phase Synchrony in Brain Signals. Hum. Brain Mapp. 2015, 8, 194–208. [Google Scholar] [CrossRef] [Green Version]
  39. Quiroga, R.Q.; Kraskov, A.; Kreuz, T.; Grassberger, P. Performance of Different Synchronization Measures in Real Data: A Case Study on Electroencephalographic Signals. Phys. Rev. E 2002, 65, 041903. [Google Scholar] [CrossRef] [Green Version]
  40. Niso, G.; Bruña, R.; Pereda, E.; Gutiérrez, R.; Bajo, R.; Maestú, F.; Del-Pozo, F. HERMES: Towards an Integrated Toolbox to Characterize Functional and Effective Brain Connectivity. Neuroinformatics 2013, 11, 405–434. [Google Scholar] [CrossRef] [Green Version]
  41. Blankertz, B.; Dornhege, G.; Krauledat, M.; Müller, K.R.; Curio, G. The Non-invasive Berlin Brain-Computer Interface: Fast acquisition of Effective Performance in Untrained Subjects. NeuroImage 2007, 37, 539–550. [Google Scholar] [CrossRef]
  42. Chang, C.C.; Lin, C.J. LIBSVM: A Library for Support Vector Machines. ACM Trans. Intell. Syst. Technol. 2011, 2, 27. [Google Scholar] [CrossRef]
  43. Breiman, L. Stacked Regressions. Mach. Learn. 1996, 24, 49–64. [Google Scholar] [CrossRef] [Green Version]
  44. Rodenbeck, A.; Binder, R.; Geisler, P.; Danker-Hopfe, H.; Lund, R.; Raschke, F.; Weeß, H.G.; Schulz, H. A Review of Sleep EEG Patterns. Part I: A Compilation of Amended Rules for their Visual Recognition According to Rechtschaffen and Kales. Somnologie 2006, 10, 159–175. [Google Scholar] [CrossRef]
  45. Cantero, J.L.; Atienza, M.; Salas, R.M. Spectral Features of EEG Alpha Activity in Human REM Sleep: Two Variants with Different Functional Roles? Sleep N. Y. 2000, 23, 746–754. [Google Scholar] [CrossRef]
  46. Carskadon, M.A.; Rechtschaffen, A. Monitoring and Staging Human Sleep. Princ. Pract. Sleep Med. 2011, 5, 16–26. [Google Scholar]
  47. Ben Dkhil, M.; Chawech, N.; Wali, A.; Alimi, A.M. Towards an Automatic Drowsiness Detection System by Evaluating the Alpha Band of EEG Signals. In Proceedings of the IEEE International Symposium on Applied Machine Intelligence & Informatics, Herl’any, 26–28 January 2017; pp. 000371–000376. [Google Scholar]
  48. Knaut, P.; von Wegner, F.; Morzelewski, A.; Laufs, H. EEG-correlated FMRI of Human Alpha (De-) synchronization. Clin. Neurophysiol. 2019, 130, 1375–1386. [Google Scholar] [CrossRef] [PubMed]
  49. Riemann, D.; Spiegelhalder, K.; Feige, B.; Voderholzer, U.; Berger, M.; Perlis, M.; Nissen, C. The Hyperarousa Model of Insomnia: A Review of the Concept and its Evidence. Sleep Med. Rev. 2010, 14, 19–31. [Google Scholar] [CrossRef] [PubMed]
  50. Spiegelhalder, K.; Regen, W.; Feige, B.; Holz, J.; Piosczyk, H.; Baglioni, C.; Riemann, D.; Nissen, C. Increased EEG Sigma and Beta Power during NREM Sleep in Primary Insomnia. Biol. Psychol. 2012, 91, 329–333. [Google Scholar] [CrossRef] [PubMed]
  51. Sunwoo, J.S.; Cha, K.S.; Byun, J.I.; Kim, T.J.; Jun, J.S.; Lim, J.A.; Lee, S.T.; Jung, K.H.; Park, K.I.; Chu, K.; et al. Abnormal Activation of Motor Cortical Network during Phasic REM Sleep in Idiopathic REM Sleep Behavior Disorder. Sleep 2019, 42, zsy227. [Google Scholar] [CrossRef]
  52. Sors, A.; Bonnet, S.; Mirek, S.; Vercueil, L.; Payen, J.F. A Convolutional Neural Network for Sleep Stage Scoring from Raw Single-channel EEG. Biomed. Signal Process. Control. 2018, 42, 107–114. [Google Scholar] [CrossRef]
  53. Sharma, M.; Goyal, D.; Pv, A.; Acharya, U.R. An Accurate Sleep Stages Classification System Using a New Class of Optimally Time-frequency Localized Three-band Wavelet Filter Bank. Comput. Biol. Med. 2018, 98, 58–75. [Google Scholar] [CrossRef] [PubMed]
  54. Lajnef, T.; Chaibi, S.; Ruby, P.; Aguera, P.E.; Eichenlaub, J.B.; Samet, M.; Kachouri, A.; Jerbi, K. Learning Machines and Sleeping Brains: Automatic Sleep Stage Classification Using Decision-tree Multi-class Support Vector Machines. J. Neurosci. Methods 2015, 250, 94–105. [Google Scholar] [CrossRef]
  55. Michielli, N.; Acharya, U.R.; Molinari, F. Cascaded LSTM Recurrent Neural Network for Automated Sleep Stage Classification Using Single-channel EEG Signals. Comput. Biol. Med. 2019, 106, 71–81. [Google Scholar] [CrossRef] [PubMed]
  56. Saebipour, M.R.; Joghataei, M.T.; Yoonessi, A.; Sadeghniiat-Haghighi, K.; Khalighinejad, N.; Khademi, S. Slow Oscillating Transcranial Direct Current Stimulation during Sleep has A Sleep-stabilizing Effect in Chronic Insomnia: A Pilot Study. J. Sleep Res. 2015, 24, 518–525. [Google Scholar] [CrossRef] [PubMed]
Figure 1. The layouts of EEG electrodes. The electrodes used in this study are labeled in blue circles.
Sensors 21 01988 g001
Figure 2. The flow diagram of the proposed method.
Sensors 21 01988 g002
Figure 3. Schematic diagram of fusion strategy. (a) indicates the feature-level fusion and (b) is the decision-level fusion using stacking.
Sensors 21 01988 g003
Figure 4. Comparisons of the average PLV values between six frequency bands for three sleep stages. The double-asterisk ‘**’ indicates that there is a significant difference of p < 0.001 by ANOVA test.
Sensors 21 01988 g004
Figure 5. The averaged PLV value of three sleep stages in six frequency bands to observe the PLV distribution in different frequency bands. The double-asterisk ‘**’ indicates that there is a significant difference of p < 0.001 by ANOVA test and three rows represent the significant difference result between two frequency bands for ’REM and N2’, ’REM and N3’ and ’REM and N2’ respectively.
Sensors 21 01988 g005
Figure 6. The brain network difference topoplot between REM and N2 (shown in (a)), REM and N3 (shown in (b)) and N2 and N3 (shown in (c)) for different frequency bands. The red line represents the increase area, and the blue line indicates the decrease area.
Sensors 21 01988 g006
Figure 7. Percentage (%) of PLV features from different frequency bands in the features with first 95 and 140 sorted r 2 values.
Sensors 21 01988 g007
Figure 8. 2-D figure of PLV feature visualization for each frequency band. The Feature 1 and Feature 2 are the selected features with the first two largest r 2 ¯ values, respectively. The dots represent different sleep stages (red:REM, green:N2, blue:N3).
Sensors 21 01988 g008
Figure 9. The discriminative ratio of per frequency band for distinguish two sleep stages (blue: REM and N2, orange: REM and N3, grey: N2 and N3).
Sensors 21 01988 g009
Table 1. Types and spatial distributions of brain waves during stages of sleep, ‘/’ means no appearance.
N1/S1N2/S2N3REM
S3S4
delta waves/<20%25∼50% 0.75∼3 Hz>50%/
alpha waves<50%///mainly in
Occipital lobe
sleep spindle waves/12.5∼15.5 Hz,
occur in central,
bilateral frontal,
parietal, forehead,
temporal lobes
about 12 Hz
gradually reduce,
mainly in
frontal lobe
6–10 Hz,
gradually
disappear,
mainly in
frontal lobe
/
K-complex waves/
occur mainly
in frontal lobe

evoked by
external stimuli

evoked by
strong stimuli
/
Table 2. Classification accuracy (%) of PLV value with single-band. For inter-subject case, the true positive rate of each class is also given.
Bandn3n5n10n11Inter-Subjects
REMN2N3ACC
delta85.8089.3189.2184.9884.8687.8787.6586.86
theta82.1085.5374.8282.1686.2481.8787.2484.86
alpha88.2786.7994.9688.7393.5888.7090.5390.86
beta176.5474.7492.8182.6391.7476.5781.0782.86
beta285.8079.2587.0578.8781.1980.7586.0182.71
gamma82.7275.4776.9885.9285.7879.5085.1983.43
Table 3. Classification accuracy (%) of PLV value with band fusion strategies. For inter-subject case, the true positive rate of each class is given.
n3n5n10n11Inter-Subjects
REMN2N3ACC
Two bandsC(delta+beta1)87.6593.0891.3791.0892.2088.7088.4889.71
C(theta+gamma)88.2788.6889.9388.7393.5887.0393.4291.29
C(alpha+beta2)91.3688.6895.3788.2694.0488.7091.7791.43
Three bandsC(alpha+beta1+delta)94.4193.0892.8194.3793.1292.0595.0693.43
E(alpha+beta1+delta)91.3091.1994.9692.4996.3392.8995.8893.43
Four bandsC(alpha+beta1+
delta+gamma)
96.8994.3492.8194.3794.9594.1495.4794.86
E(alpha+beta1+
delta+gamma)
93.7991.1994.9693.9096.3392.8995.8895.00
Six bandsConcatenation96.9195.6094.2496.7196.3394.9897.1296.14
Ensemble95.0692.4593.5393.9096.3393.7295.8895.29
E(C)93.2193.0894.9693.9095.8794.9895.4795.43
Table 4. Comparison of state-of-the-art studies.
AuthorsFeaturesDatabaseClassifierResults (%)
REM (+N1)N2 (+N1)N3ACC
Sors et al.
[52] 2018
raw signal
samples
SSH-1CNN90.5485.892.4890.74
Sharma et al.
[53] 2018
time-domainSleep-EDFMulti-class
SVM
71.8182.5784.4881.13
CAPMulti-class
SVM
84.4084.1085.6084.71
Lajnef et al.
[54] 2015
frequency-domainDyCog
Lab’PSD
records
D-SVM89.1381.6387.8887.06
CAPMulti-class
SVM
87.6182.8590.9587.14
Michielli et al.
[55] 2019
statistical
features and
spectral features  
Sleep-EDFLSTM
-RNN
91.5989.5592.0990.60
CAPMulti-class
SVM
96.7986.6193.4292.14
Proposed
method
PLVCAPMulti-class
SVM
96.3394.9897.1296.14
Publisher’s Note: MDPI stays neutral with regard to jurisdictional claims in published maps and institutional affiliations.

