
Fabrication of Carbon Disulfide Added Colloidal Gold Colorimetric Sensor for the Rapid and On-Site Detection of Biogenic Amines


 , and
, and 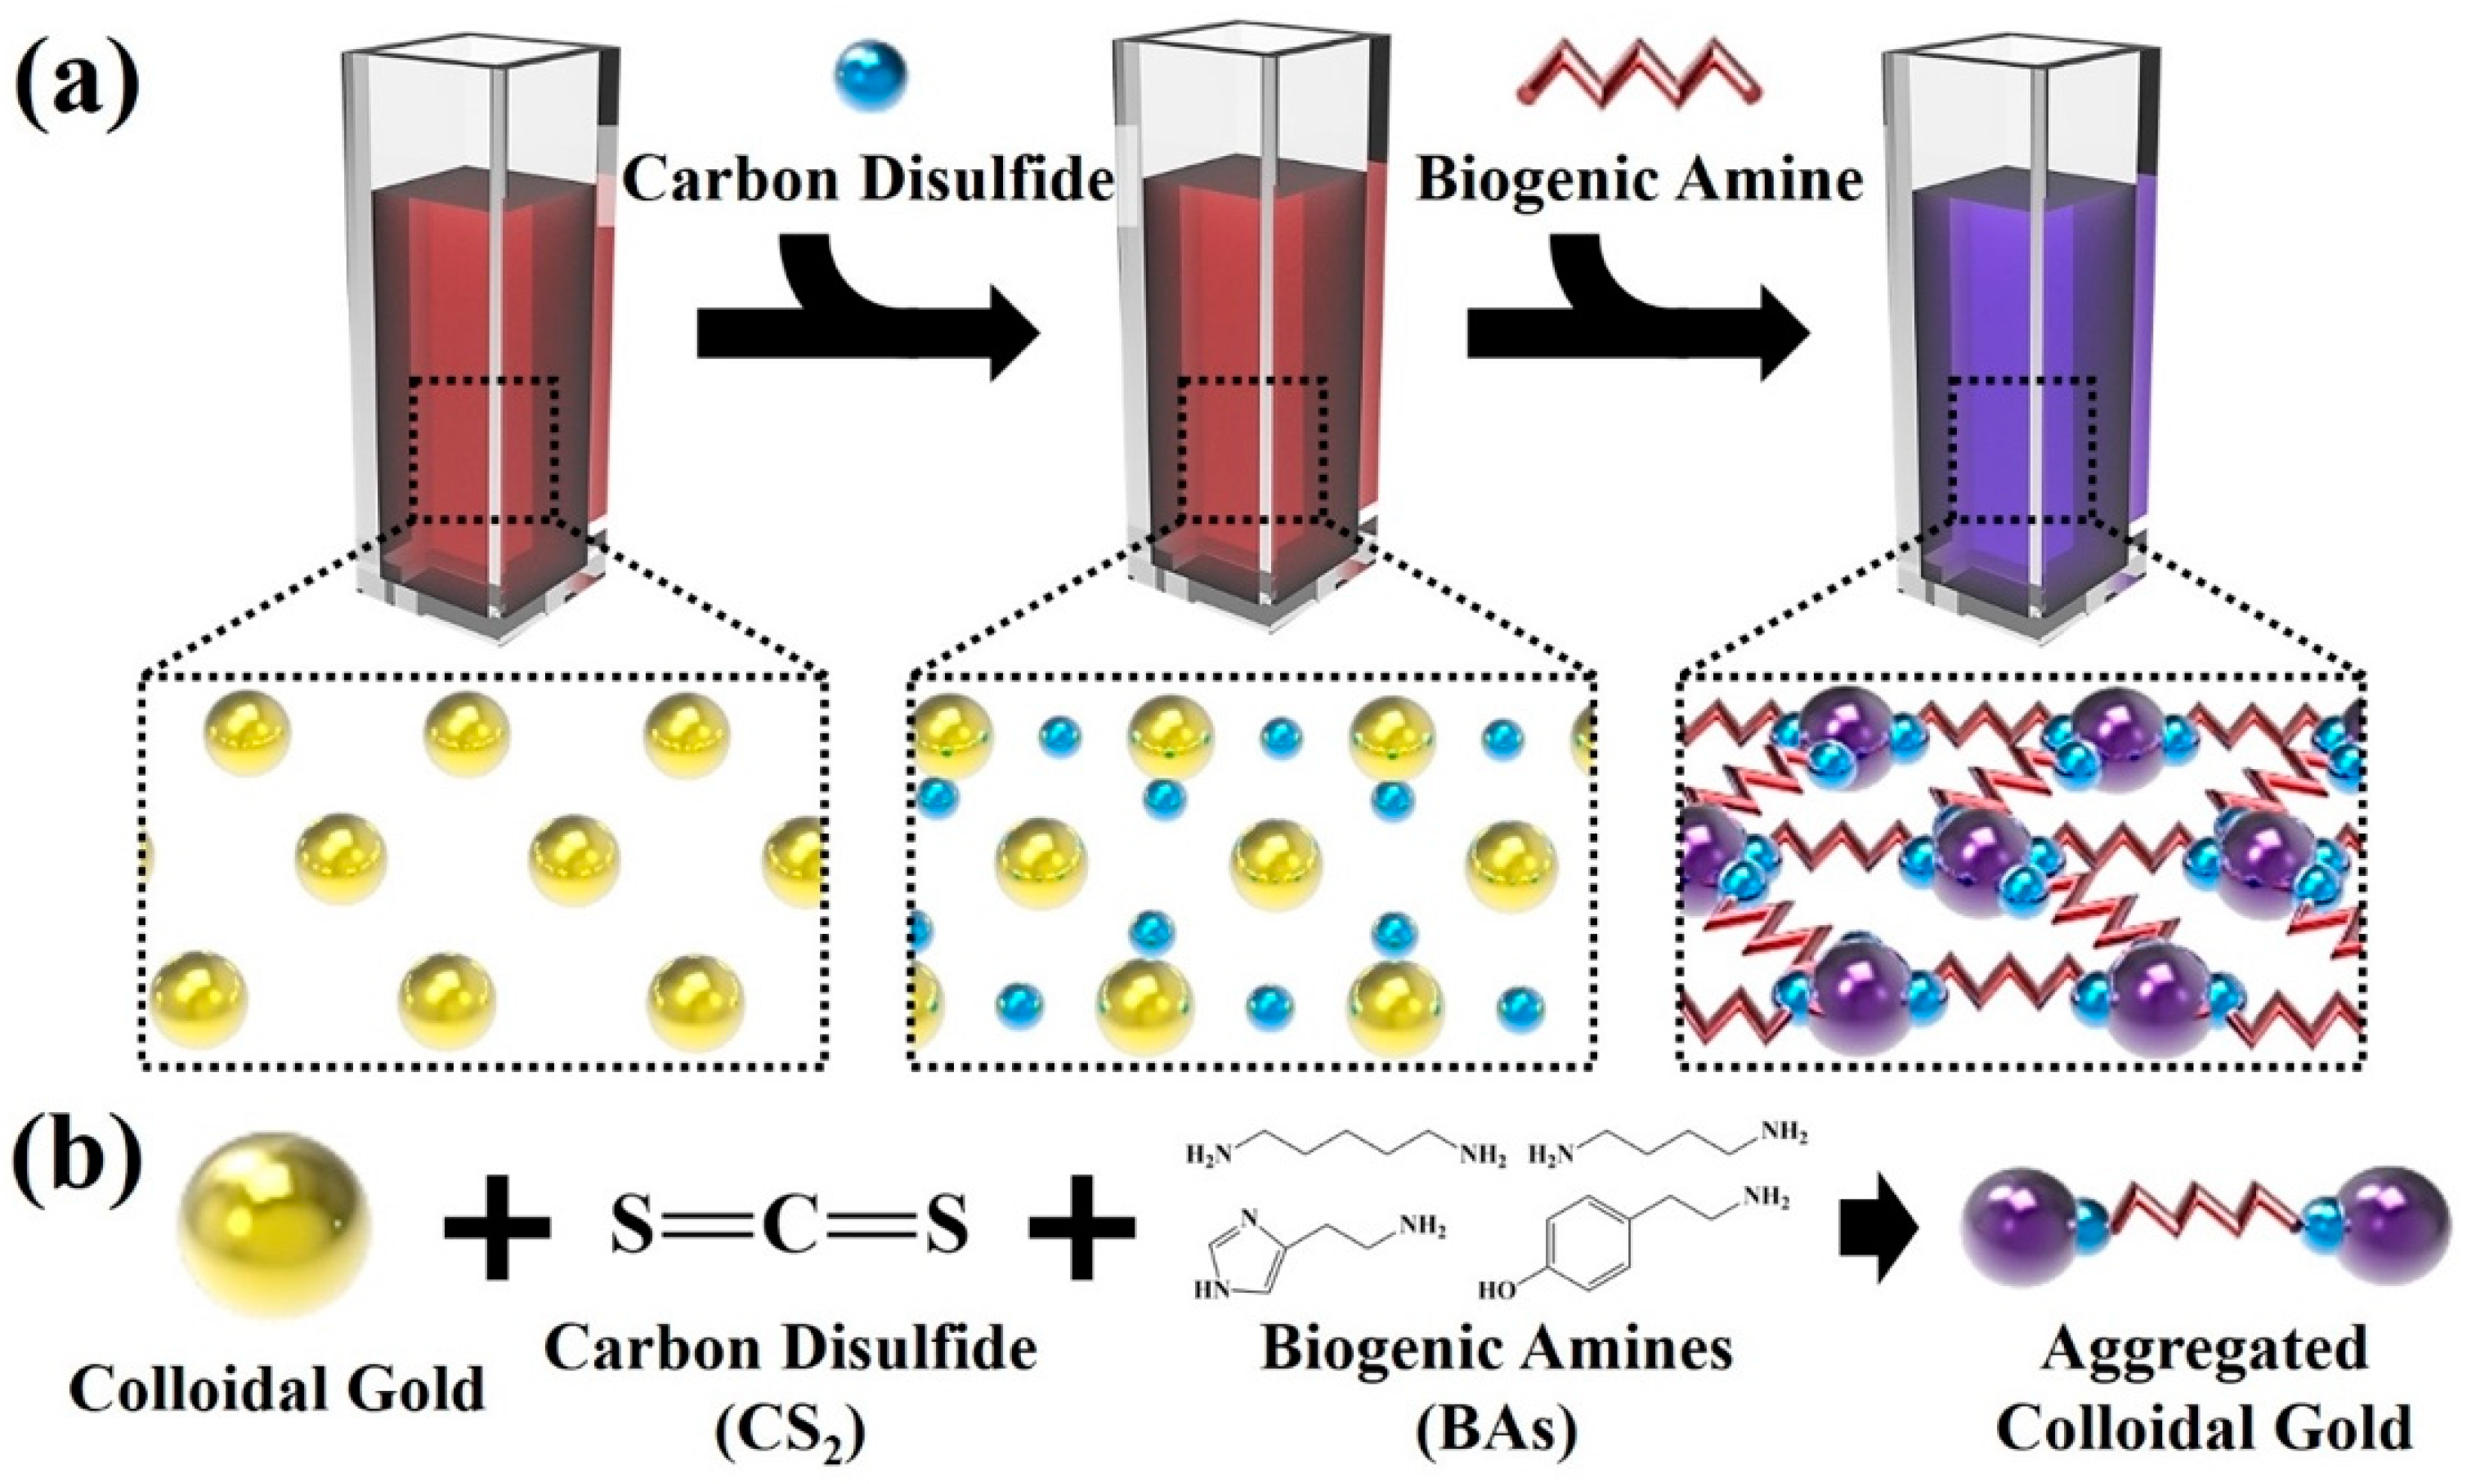
Abstract
1. Introduction
2. Materials and Methods
2.1. Materials
2.2. Synthesis of Colloidal Gold Solution
2.3. Functionalization of Colloidal Gold Nanoparticles-Based Colorimetric Sensor with Carbon Disulfide
2.4. Colorimetric Sensing of Biogenic Amines in Distilled Water
2.5. Characterization
3. Results
3.1. Fabrication of Colloidal Gold-Based Colorimetric Sensors
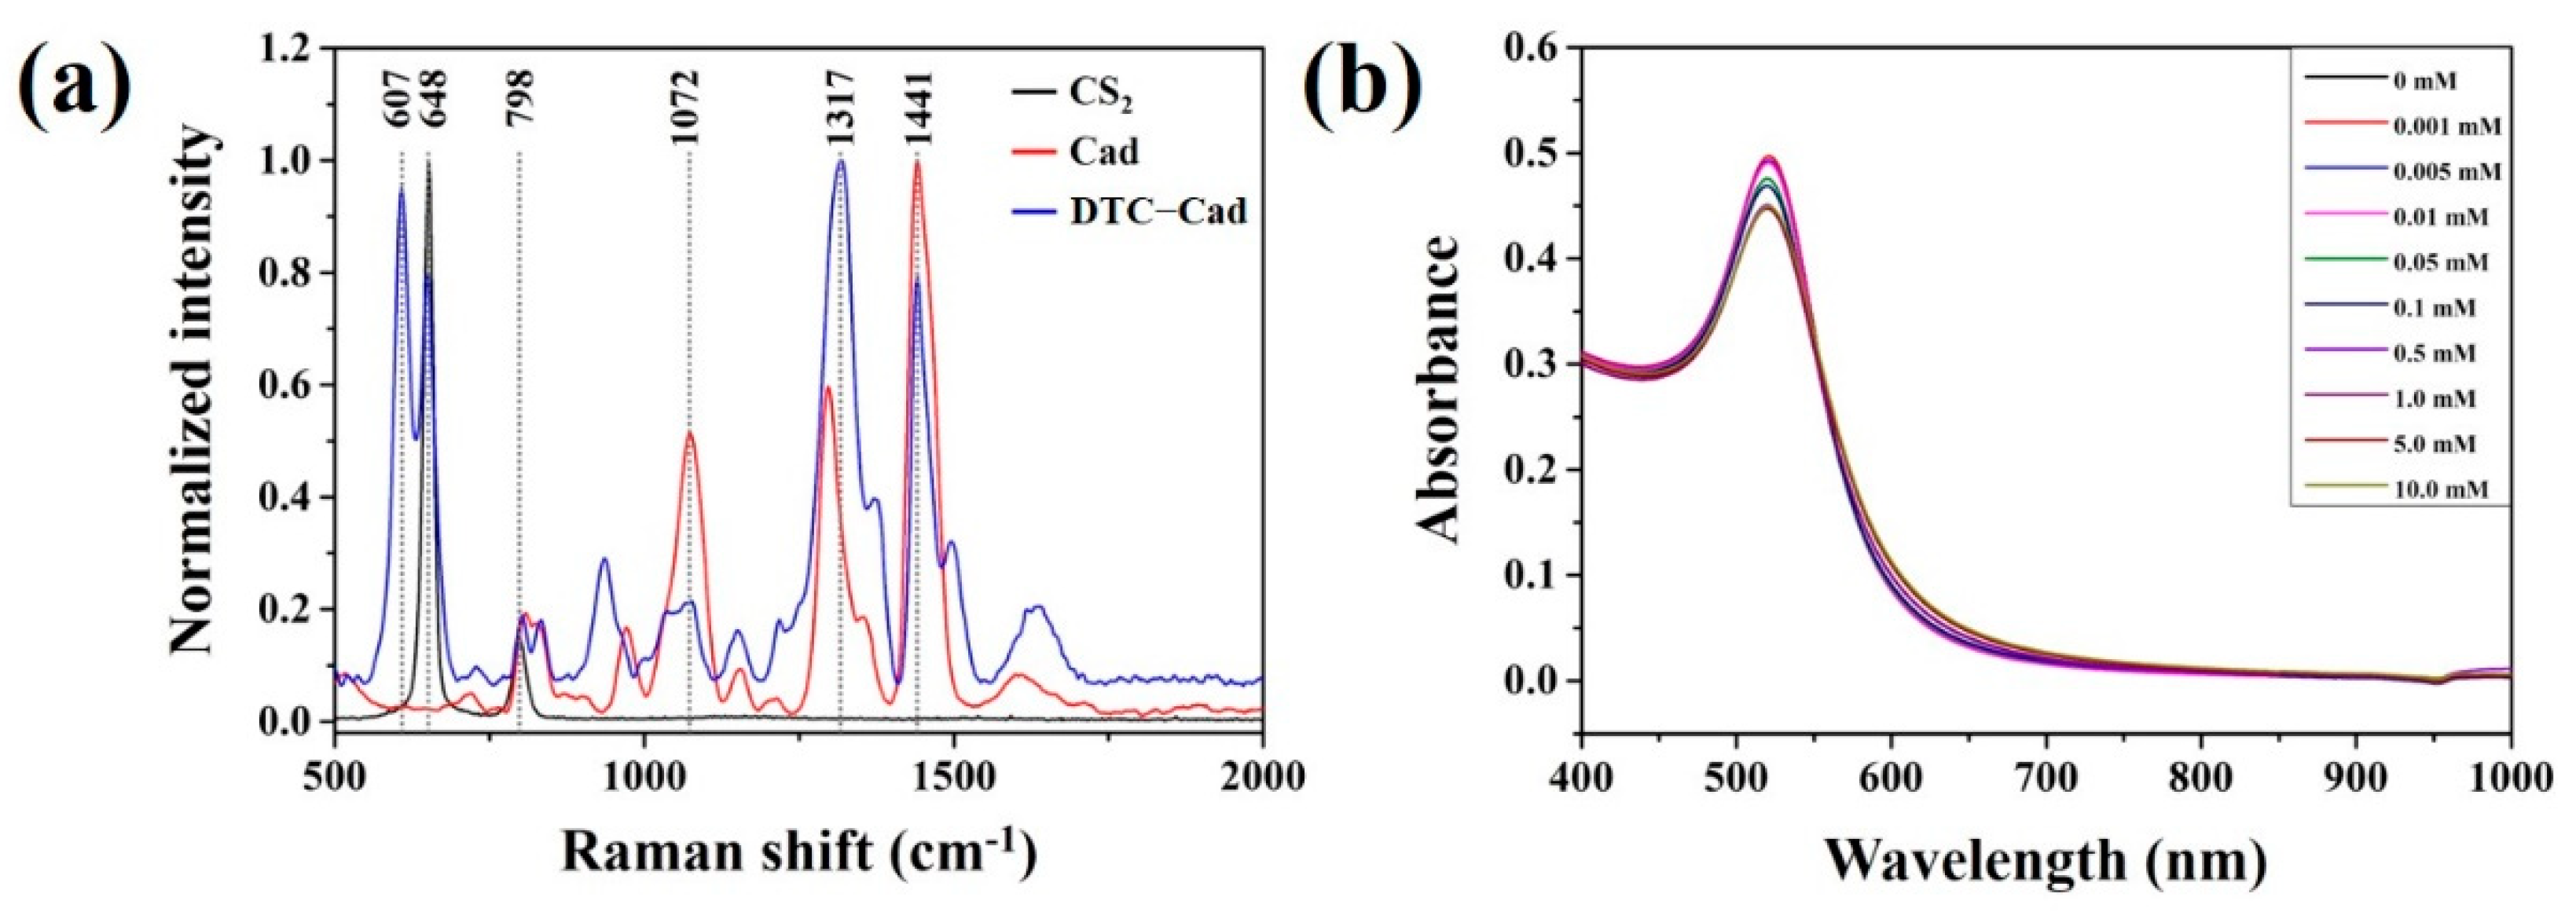
3.2. Reactivity between Carbon Disulfide and Colloidal Gold Solution
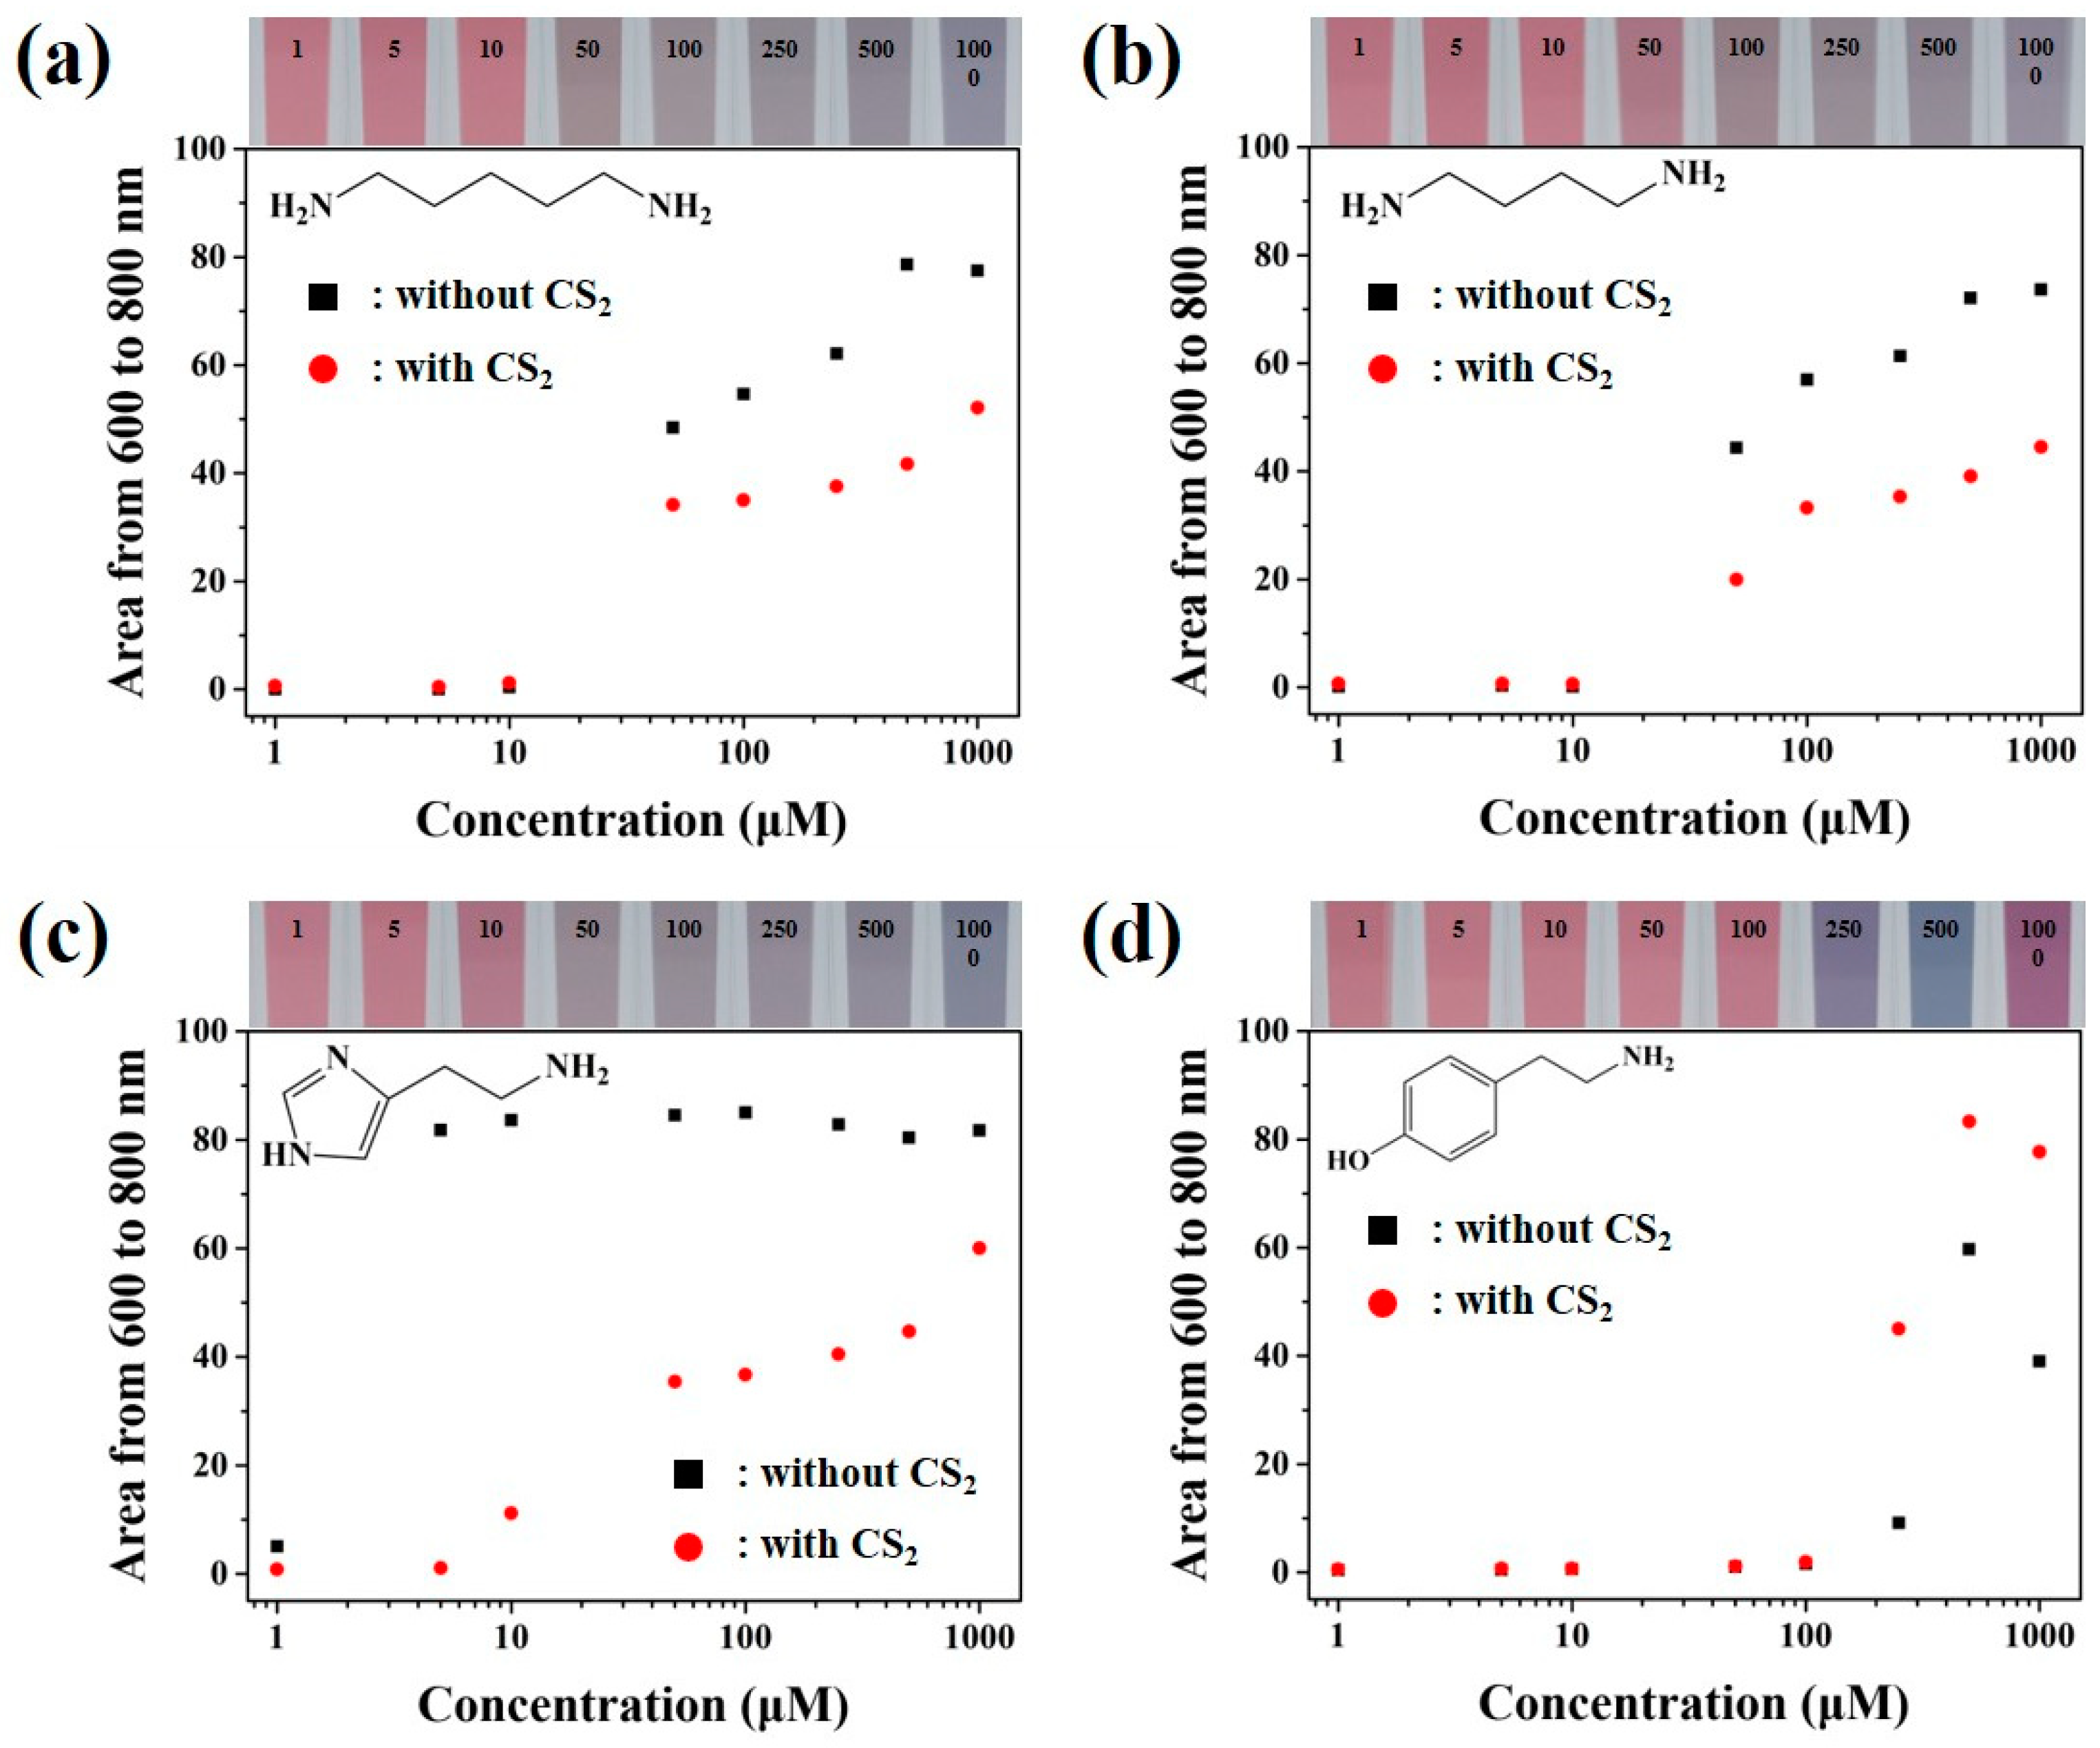
3.3. Colorimetric Sensing of Biogenic Amines through the Developed Colloidal Gold Nanoparticles Based Sensors
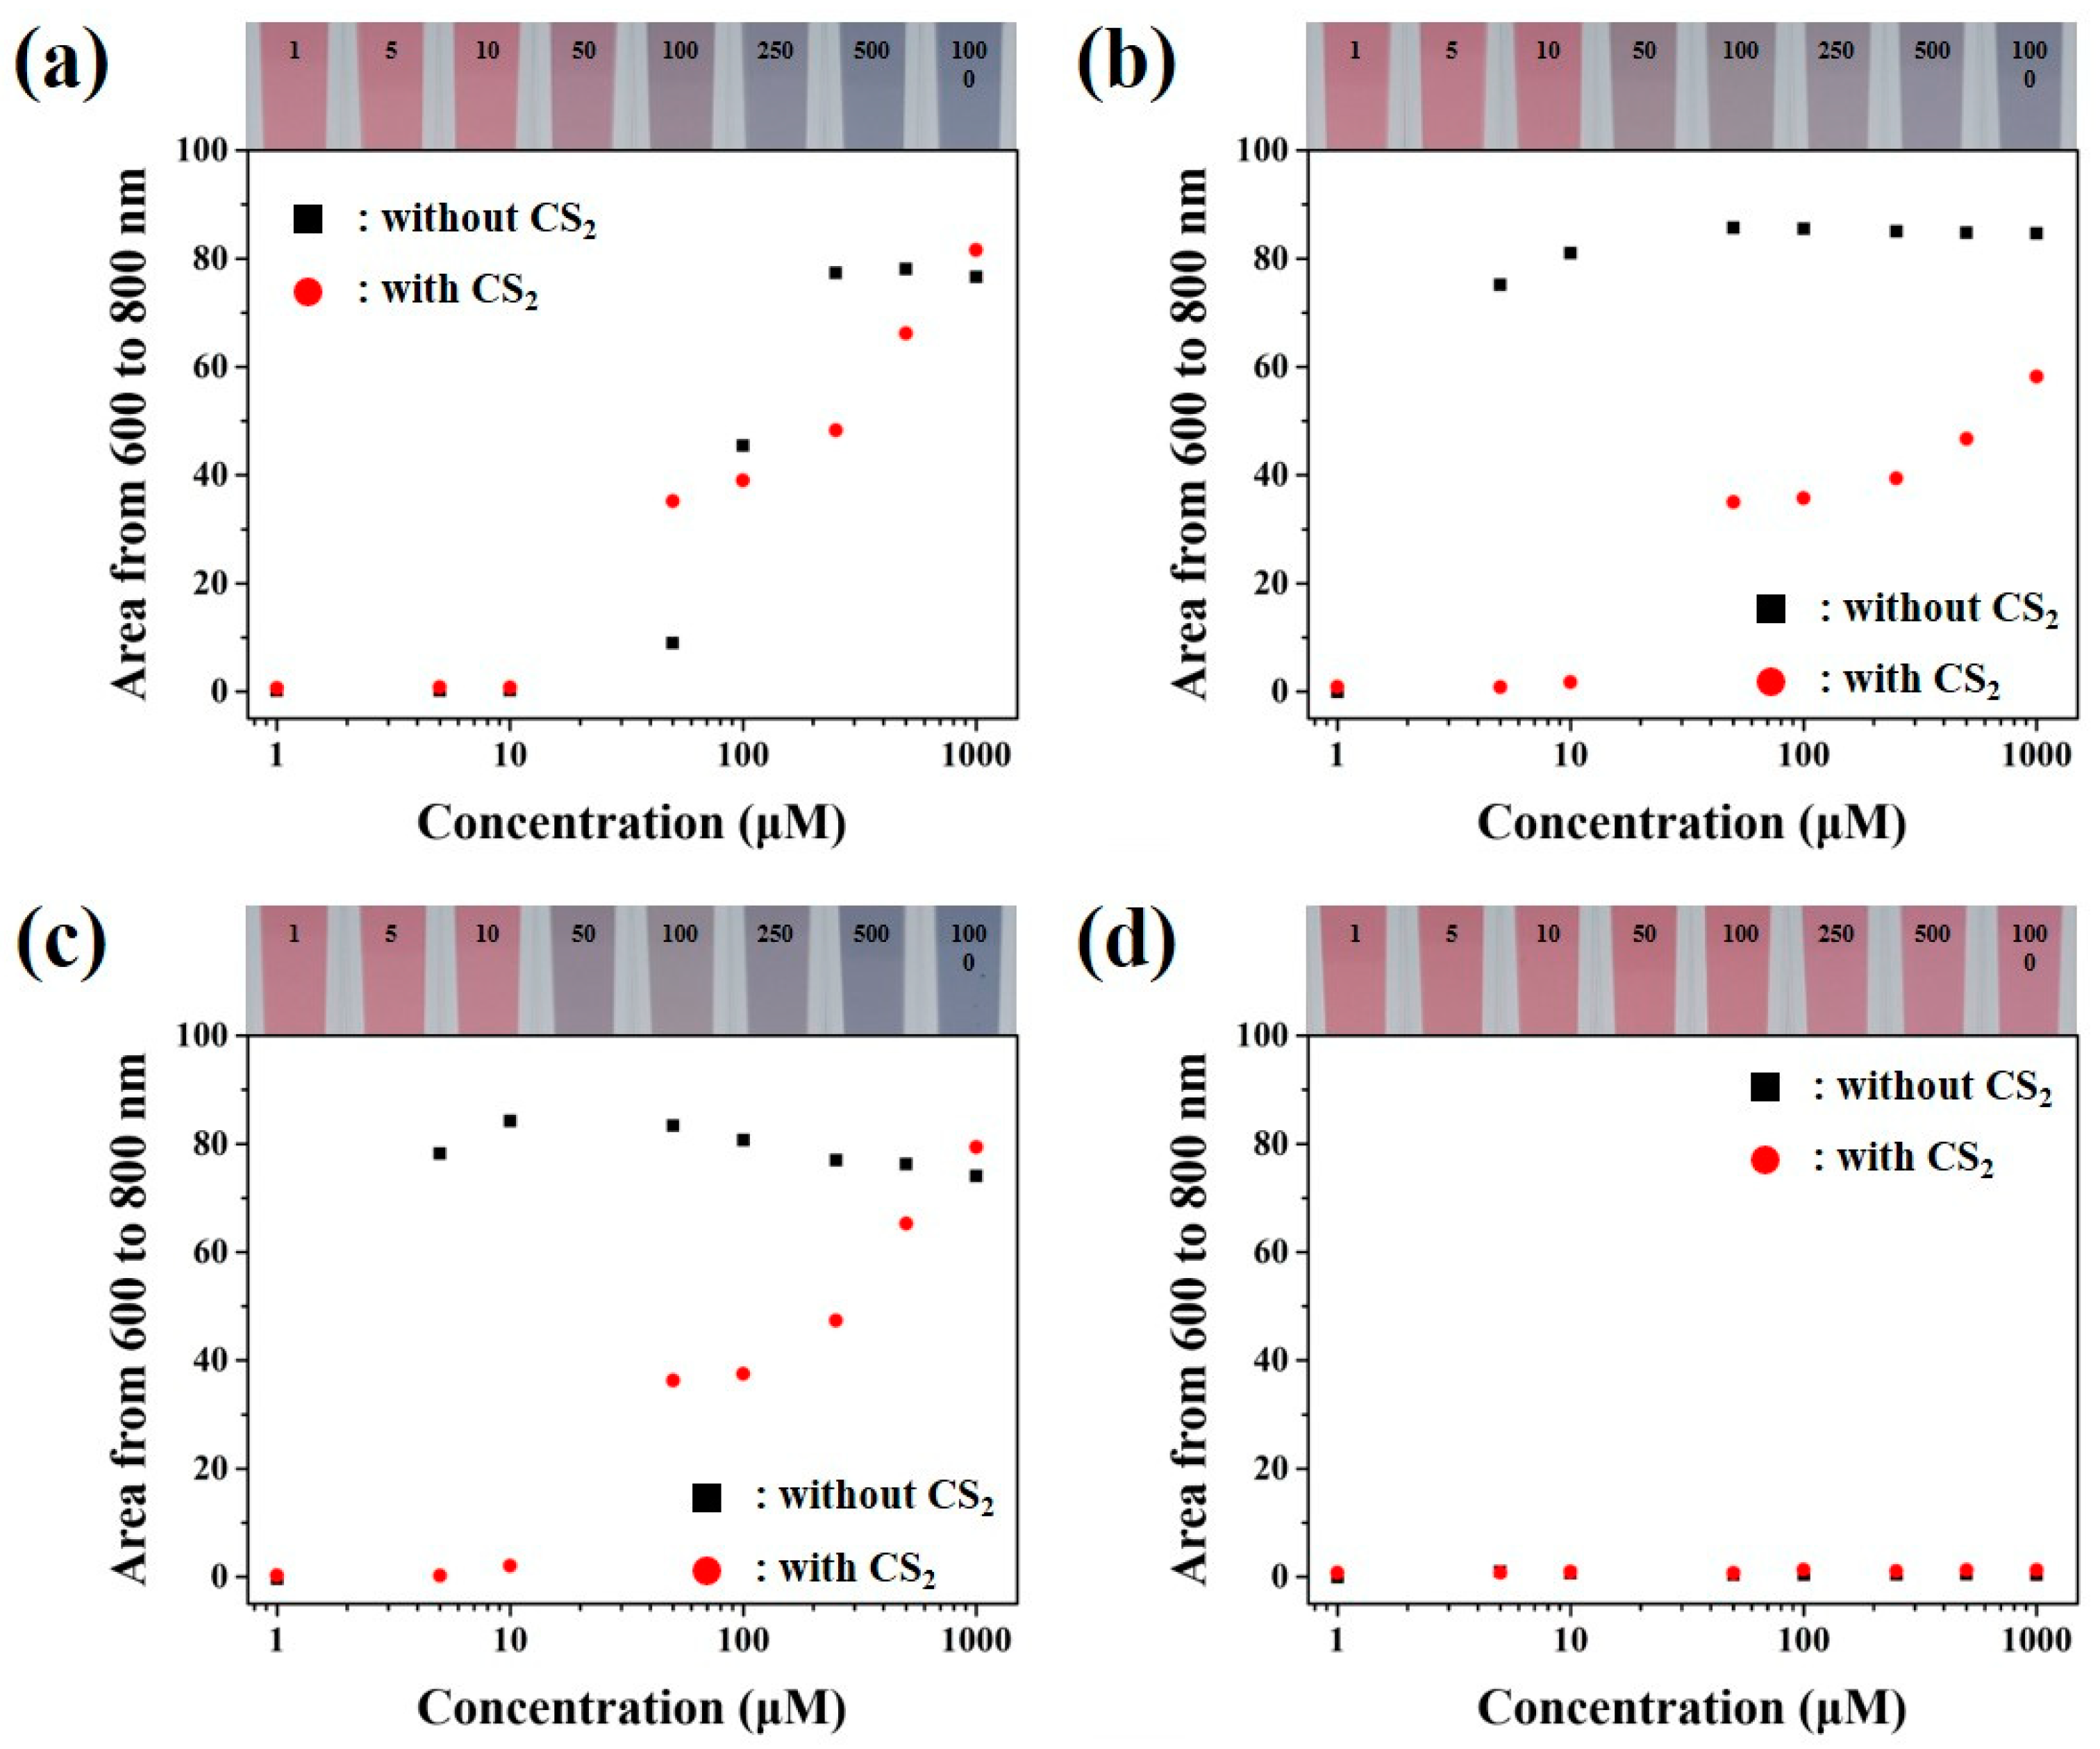
3.4. Colorimetric Sensing of Mixed Biogenic Amines through Colloidal Gold Nanoparticles Based Sensors
4. Conclusions
- (i)
- The fabrication of the sensor is very simple.
- (ii)
- The developed colorimetric sensor detected the BAs within 10 min.
- (iii)
- The developed sensor can be efficiently used for the on-site analysis of BAs.
- (iv)
- The colorimetric sensor can be easily manufactured on the laboratory scale.
- (v)
- Mass production of the colorimetric sensor will be highly possible at the industrial scale.
- (vi)
- Notably, the developed sensor detects the multiple BAs at a single time.
Supplementary Materials
Author Contributions
Funding
Institutional Review Board Statement
Informed Consent Statement
Data Availability Statement
Conflicts of Interest
Correction Statement
References
- Bryant, C.; van Nek, L.; Rolland, N. European markets for cultured meat: A comparison of Germany and France. Foods 2020, 9, 1152. [Google Scholar] [CrossRef] [PubMed]
- Deoula, M.S.; El Kinany, K.; Huybrechts, I.; Gunter, M.J.; Hatime, Z.; Boudouaya, H.A.; Benslimane, A.; Nejjari, C.; El Abkari, M.; Badre, W. Consumption of meat, traditional and modern processed meat and colorectal cancer risk among the Moroccan population: A large-scale case–control study. Int. J. Cancer 2020, 146, 1333–1345. [Google Scholar] [CrossRef]
- Lin, D.; Yan, M.; Lin, S.; Chen, S. Increasing prevalence of hydrogen sulfide negative Salmonella in retail meats. Food Microbiol. 2014, 43, 1–4. [Google Scholar] [CrossRef]
- Cavaleiro, A.; Ferreira, T.; Pereira, F.; Tommaso, G.; Alves, M. Biochemical methane potential of raw and pre-treated meat-processing wastes. Bioresour. Technol. 2013, 129, 519–525. [Google Scholar] [CrossRef]
- Wei, F.X.; Hu, X.F.; Sa, R.N.; Liu, F.; Li, S.; Sun, Q. Antioxidant capacity and meat quality of broilers exposed to different ambient humidity and ammonia concentrations. Genet. Mol. Res. 2014, 13, 3117–3127. [Google Scholar] [CrossRef] [PubMed]
- Ruiz-Capillas, C.; Jiménez-Colmenero, F. Biogenic amines in meat and meat products. Crit. Rev. Food Sci. Nutr. 2005, 44, 489–599. [Google Scholar] [CrossRef]
- Gardini, F.; Özogul, Y.; Suzzi, G.; Tabanelli, G.; Özogul, F. Technological factors affecting biogenic amine content in foods: A review. Front. Microbiol. 2016, 7, 1218. [Google Scholar] [CrossRef] [PubMed]
- Barbieri, F.; Montanari, C.; Gardini, F.; Tabanelli, G. Biogenic amine production by lactic acid bacteria: A review. Foods 2019, 8, 17. [Google Scholar] [CrossRef] [PubMed]
- Pessione, E.; Mazzoli, R.; Giuffrida, M.G.; Lamberti, C.; Garcia-Moruno, E.; Barello, C.; Conti, A.; Giunta, C. A proteomic approach to studying biogenic amine producing lactic acid bacteria. Proteomics 2005, 5, 687–698. [Google Scholar] [CrossRef] [PubMed]
- Park, Y.K.; Lee, J.H.; Mah, J.-H. Occurrence and reduction of biogenic amines in traditional Asian fermented soybean foods: A review. Food Chem. 2019, 278, 1–9. [Google Scholar] [CrossRef] [PubMed]
- Del Rio, B.; Redruello, B.; Linares, D.M.; Ladero, V.; Ruas-Madiedo, P.; Fernandez, M.; Martin, M.C.; Alvarez, M.A. The biogenic amines putrescine and cadaverine show in vitro cytotoxicity at concentrations that can be found in foods. Sci. Rep. 2019, 9, 1–7. [Google Scholar] [CrossRef]
- Visciano, P.; Schirone, M.; Paparella, A. An overview of histamine and other biogenic amines in fish and fish products. Foods 2020, 9, 1795. [Google Scholar] [CrossRef]
- Lázaro, C.A.; Conte-Júnior, C.A.; Cunha, F.L.; Mársico, E.T.; Mano, S.B.; Franco, R.M. Validation of an HPLC methodology for the identification and quantification of biogenic amines in chicken meat. Food Anal. Methods 2013, 6, 1024–1032. [Google Scholar] [CrossRef]
- Wojnowski, W.; Namieśnik, J.; Płotka-Wasylka, J. Dispersive liquid-liquid microextraction combined with gas chromatography–mass spectrometry for in situ determination of biogenic amines in meat: Estimation of meat’s freshness. Microchem. J. 2019, 145, 130–138. [Google Scholar] [CrossRef]
- Kovács, Á.; Simon-Sarkadi, L.; Ganzler, K. Determination of biogenic amines by capillary electrophoresis. J. Chromatogr. A 1999, 836, 305–313. [Google Scholar] [CrossRef]
- Han, Y.D.; Chun, H.J.; Yoon, H.C. Low-cost point-of-care biosensors using common electronic components as transducers. BioChip J. 2020, 14, 358–368. [Google Scholar] [CrossRef]
- Shin, J.-W.; Yoon, J.; Shin, M.; Choi, J.-W. Electrochemical dopamine biosensor composed of silver encapsulated MoS2 hybrid nanoparticle. Biotechnol. Bioeng. 2019, 24, 135–144. [Google Scholar] [CrossRef]
- Fernández García, M.; Linares, D.M.; Del Río, B.; Martín, M.C.; Álvarez González, M.Á. Real-Time polymerase chain reaction for quantitative detection of histamine-producing bacteria: Use in cheese production. J. Dairy Sci. 2006, 89, 3763–3769. [Google Scholar] [CrossRef]
- Hungerford, J.; Wu, W.-H. Comparison study of three rapid test kits for histamine in fish: BiooScientific MaxSignal enzymatic assay, Neogen Veratox ELISA, and the Neogen Reveal Histamine Screening test. Food Control 2012, 25, 448–457. [Google Scholar] [CrossRef]
- Homola, J.; Yee, S.S.; Gauglitz, G. Surface plasmon resonance sensors. Sensors Actuat. B Chem. 1999, 54, 3–15. [Google Scholar] [CrossRef]
- Bong, J.-H.; Kim, T.-H.; Jung, J.; Lee, S.J.; Sung, J.S.; Lee, C.K.; Kang, M.-J.; Kim, H.O.; Pyun, J.-C. Pig Sera-derived Anti-SARS-CoV-2 antibodies in surface plasmon resonance biosensors. Biochip J. 2020, 14, 358–368. [Google Scholar] [CrossRef]
- Heo, N.S.; Oh, S.Y.; Ryu, M.Y.; Baek, S.H.; Park, T.J.; Choi, C.; Huh, Y.S.; Park, J.P. Affinity peptide-guided plasomonic biosenosor for detection of noroviral protein and human norovirus. Biotechnol. Bioeng. 2019, 24, 318–325. [Google Scholar]
- Homola, J. Present and future of surface plasmon resonance biosensors. Anal. Bioanal. Chem. 2003, 377, 528–539. [Google Scholar] [CrossRef]
- Ghosh, S.K.; Pal, T. Interparticle coupling effect on the surface plasmon resonance of gold nanoparticles: From theory to applications. Chem. Rev. 2007, 107, 4797–4862. [Google Scholar] [CrossRef]
- Lopatynskyi, A.M.; Lopatynska, O.G.; Guo, L.J.; Chegel, V.I. Localized surface plasmon resonance biosensor—Part I: Theoretical study of sensitivity—Extended Mie approach. IEEE Sens. J. 2010, 11, 361–369. [Google Scholar] [CrossRef]
- Myroshnychenko, V.; Rodriguez-Fernandez, J.; Pastoriza-Santos, I.; Funston, A.M.; Novo, C.; Mulvaney, P.; Liz-Marzan, L.M.; De Abajo, F.J.G. Modelling the optical response of gold nanoparticles. Chem. Soc. Rev. 2008, 37, 1792–1805. [Google Scholar] [CrossRef]
- Ulman, A. Formation and structure of self-assembled monolayers. Chem. Rev. 1996, 96, 1533–1554. [Google Scholar] [CrossRef] [PubMed]
- Critchfield, F.E.; Johonson, J. Reaction of carbon disulfide with primary and secondary aliphatic amines as analytical tool. Anal. Chem. 1956, 28, 430–436. [Google Scholar] [CrossRef]
- Zhao, Y.; Pérez-Segarra, W.; Shi, Q.; Wei, A. Dithiocarbamate assembly on gold. J. Am. Chem. Soc. 2005, 127, 7328–7329. [Google Scholar] [CrossRef]
- Li, D.-F.; Gao, S.-Q.; Sun, C.-L.; Jiang, X.-L.; Li, Z.-W. The effect of the Fermi resonance on the Raman scattering cross sections of the Fermi doublet ν1 and 2ν2 of liquid carbon disulfide in benzene. Spectrochim. Acta A Mol. Biomol. Spectrosc. 2012, 89, 155–159. [Google Scholar] [CrossRef] [PubMed]
- Betelu, S.; Tijunelyte, I.; Boubekeur Lecaque, L.; Ignatiadis, I.; Schnepf, A.; Guenin, E.; Bouchemal, N.; Felidj, N.; Rinnert, E.; Lamy De La Chapelle, M. Raman characterization of Phenyl-Derivatives: From primary amine to diazonium salts. J. Org. Inorg. Chem. 2017, 3, 1–10. [Google Scholar]
- Huang, H.-Y.; Chen, W.-F.; Kuo, P.-L. Self-assembly of gold nanoparticles induced by poly (oxypropylene) diamines. J. Phys. Chem. B 2005, 109, 24288–24294. [Google Scholar] [CrossRef] [PubMed]
- Bonnet, J.; Ibers, J.A. Structure of histamine. J. Am. Chem. Soc. 1973, 95, 4829–4833. [Google Scholar] [CrossRef] [PubMed]
- Molina, P.; Almendros, P.; Fresneda, P.M. Iminophosphorane-mediated imidazole ring formation: A new and general entry to aplysinopsin-type alkaloids of marine origin. Tetrahedron 1994, 50, 2241–2254. [Google Scholar] [CrossRef]
- Yang, H.; Ma, Z.; Yuan, B.; Wang, Z.; Zhang, X. Supramolecular polymerization at the interface: Layer-by-layer assembly driven by host-enhanced π–π interaction. Chem. Commun. 2014, 50, 11173–11176. [Google Scholar] [CrossRef]
- Doeun, D.; Davaatseren, M.; Chung, M.-S. Biogenic amines in foods. Food Sci. Biotechnol. 2017, 26, 1463–1474. [Google Scholar] [CrossRef] [PubMed]


Publisher’s Note: MDPI stays neutral with regard to jurisdictional claims in published maps and institutional affiliations. |
© 2021 by the authors. Licensee MDPI, Basel, Switzerland. This article is an open access article distributed under the terms and conditions of the Creative Commons Attribution (CC BY) license (http://creativecommons.org/licenses/by/4.0/).
Share and Cite
Choi, N.; Park, B.; Lee, M.J.; Umapathi, R.; Oh, S.Y.; Cho, Y.; Huh, Y.S. Fabrication of Carbon Disulfide Added Colloidal Gold Colorimetric Sensor for the Rapid and On-Site Detection of Biogenic Amines. Sensors 2021, 21, 1738. https://doi.org/10.3390/s21051738
Choi N, Park B, Lee MJ, Umapathi R, Oh SY, Cho Y, Huh YS. Fabrication of Carbon Disulfide Added Colloidal Gold Colorimetric Sensor for the Rapid and On-Site Detection of Biogenic Amines. Sensors. 2021; 21(5):1738. https://doi.org/10.3390/s21051738
Chicago/Turabian StyleChoi, Namhyeok, Bumjun Park, Min Ji Lee, Reddicherla Umapathi, Seo Yeong Oh, Youngjin Cho, and Yun Suk Huh. 2021. "Fabrication of Carbon Disulfide Added Colloidal Gold Colorimetric Sensor for the Rapid and On-Site Detection of Biogenic Amines" Sensors 21, no. 5: 1738. https://doi.org/10.3390/s21051738
APA StyleChoi, N., Park, B., Lee, M. J., Umapathi, R., Oh, S. Y., Cho, Y., & Huh, Y. S. (2021). Fabrication of Carbon Disulfide Added Colloidal Gold Colorimetric Sensor for the Rapid and On-Site Detection of Biogenic Amines. Sensors, 21(5), 1738. https://doi.org/10.3390/s21051738