
Generating Datasets for Anomaly-Based Intrusion Detection Systems in IoT and Industrial IoT Networks

 ,
, 
 , ,
, ,
Abstract
1. Introduction
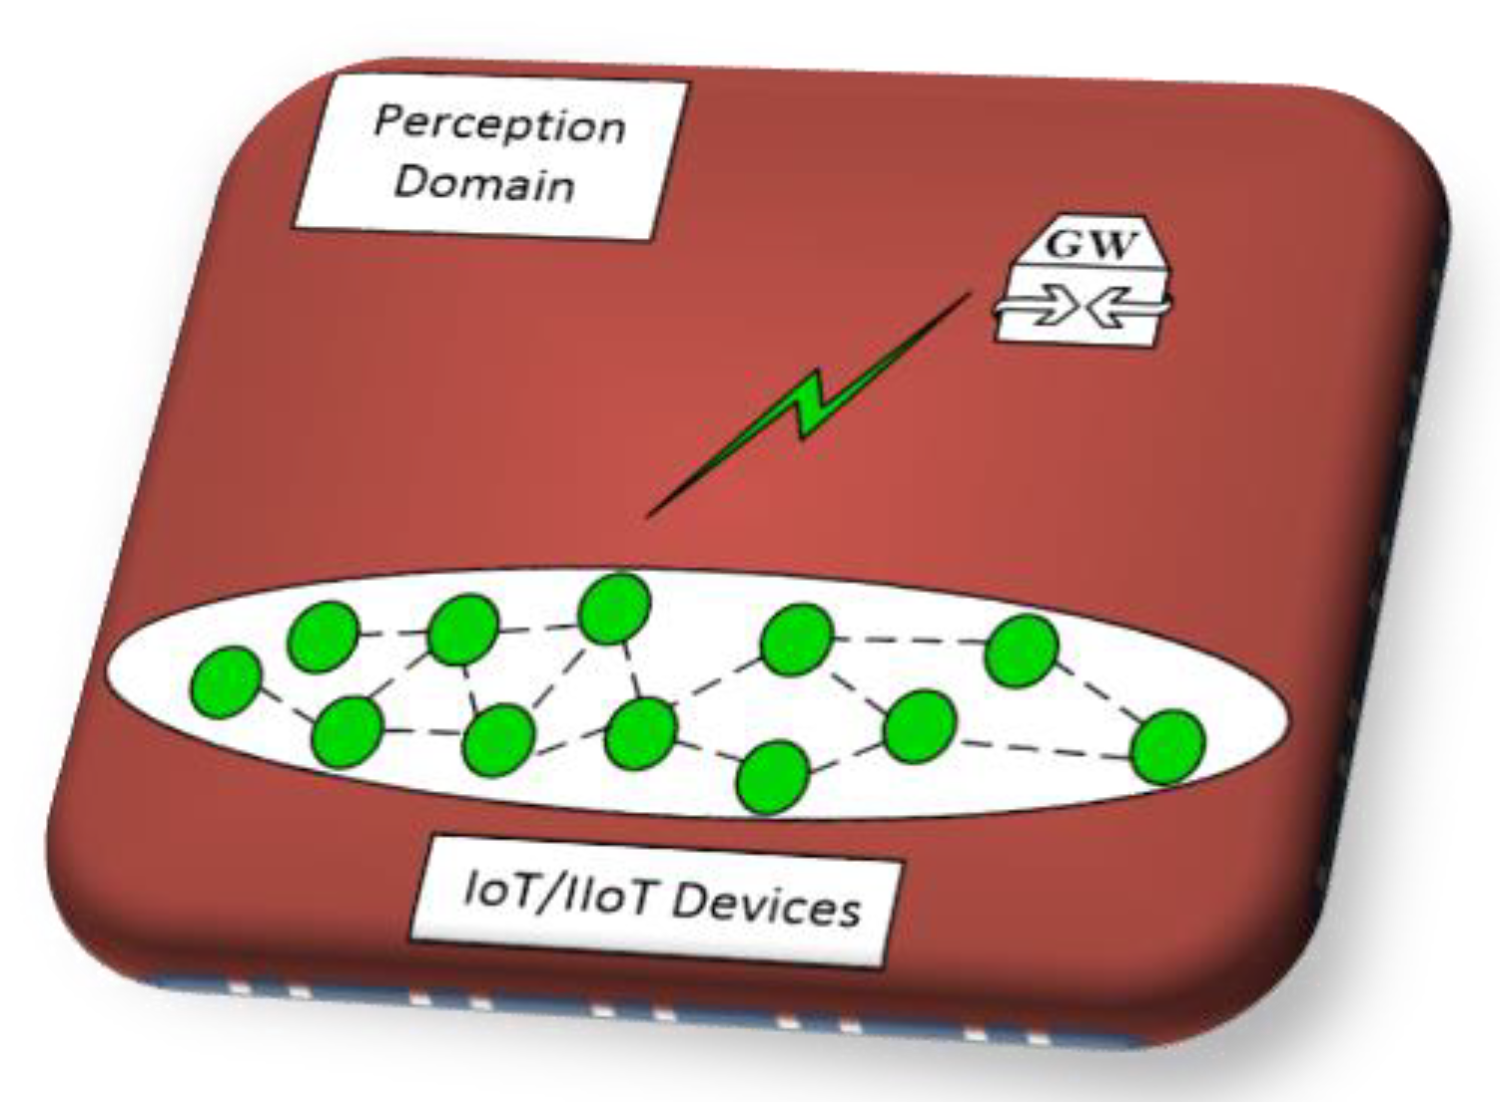
2. Threat Analysis of the IoT/IIoT Network (Perception Domain)
2.1. Sinkhole Attacks
2.2. Node Capture Attacks
2.3. Malicious Code Injection Attacks
2.4. False Data Injection Attacks
2.5. Replay Attacks
2.6. Eavesdropping
2.7. Sleep Deprivation Attacks or Denial of Sleep Attacks
2.8. Sybil Attacks
2.9. Denial of Service (DoS) Attacks
3. Anomaly-Based Intrusion Detection Systems for IoT/IIoT Networks
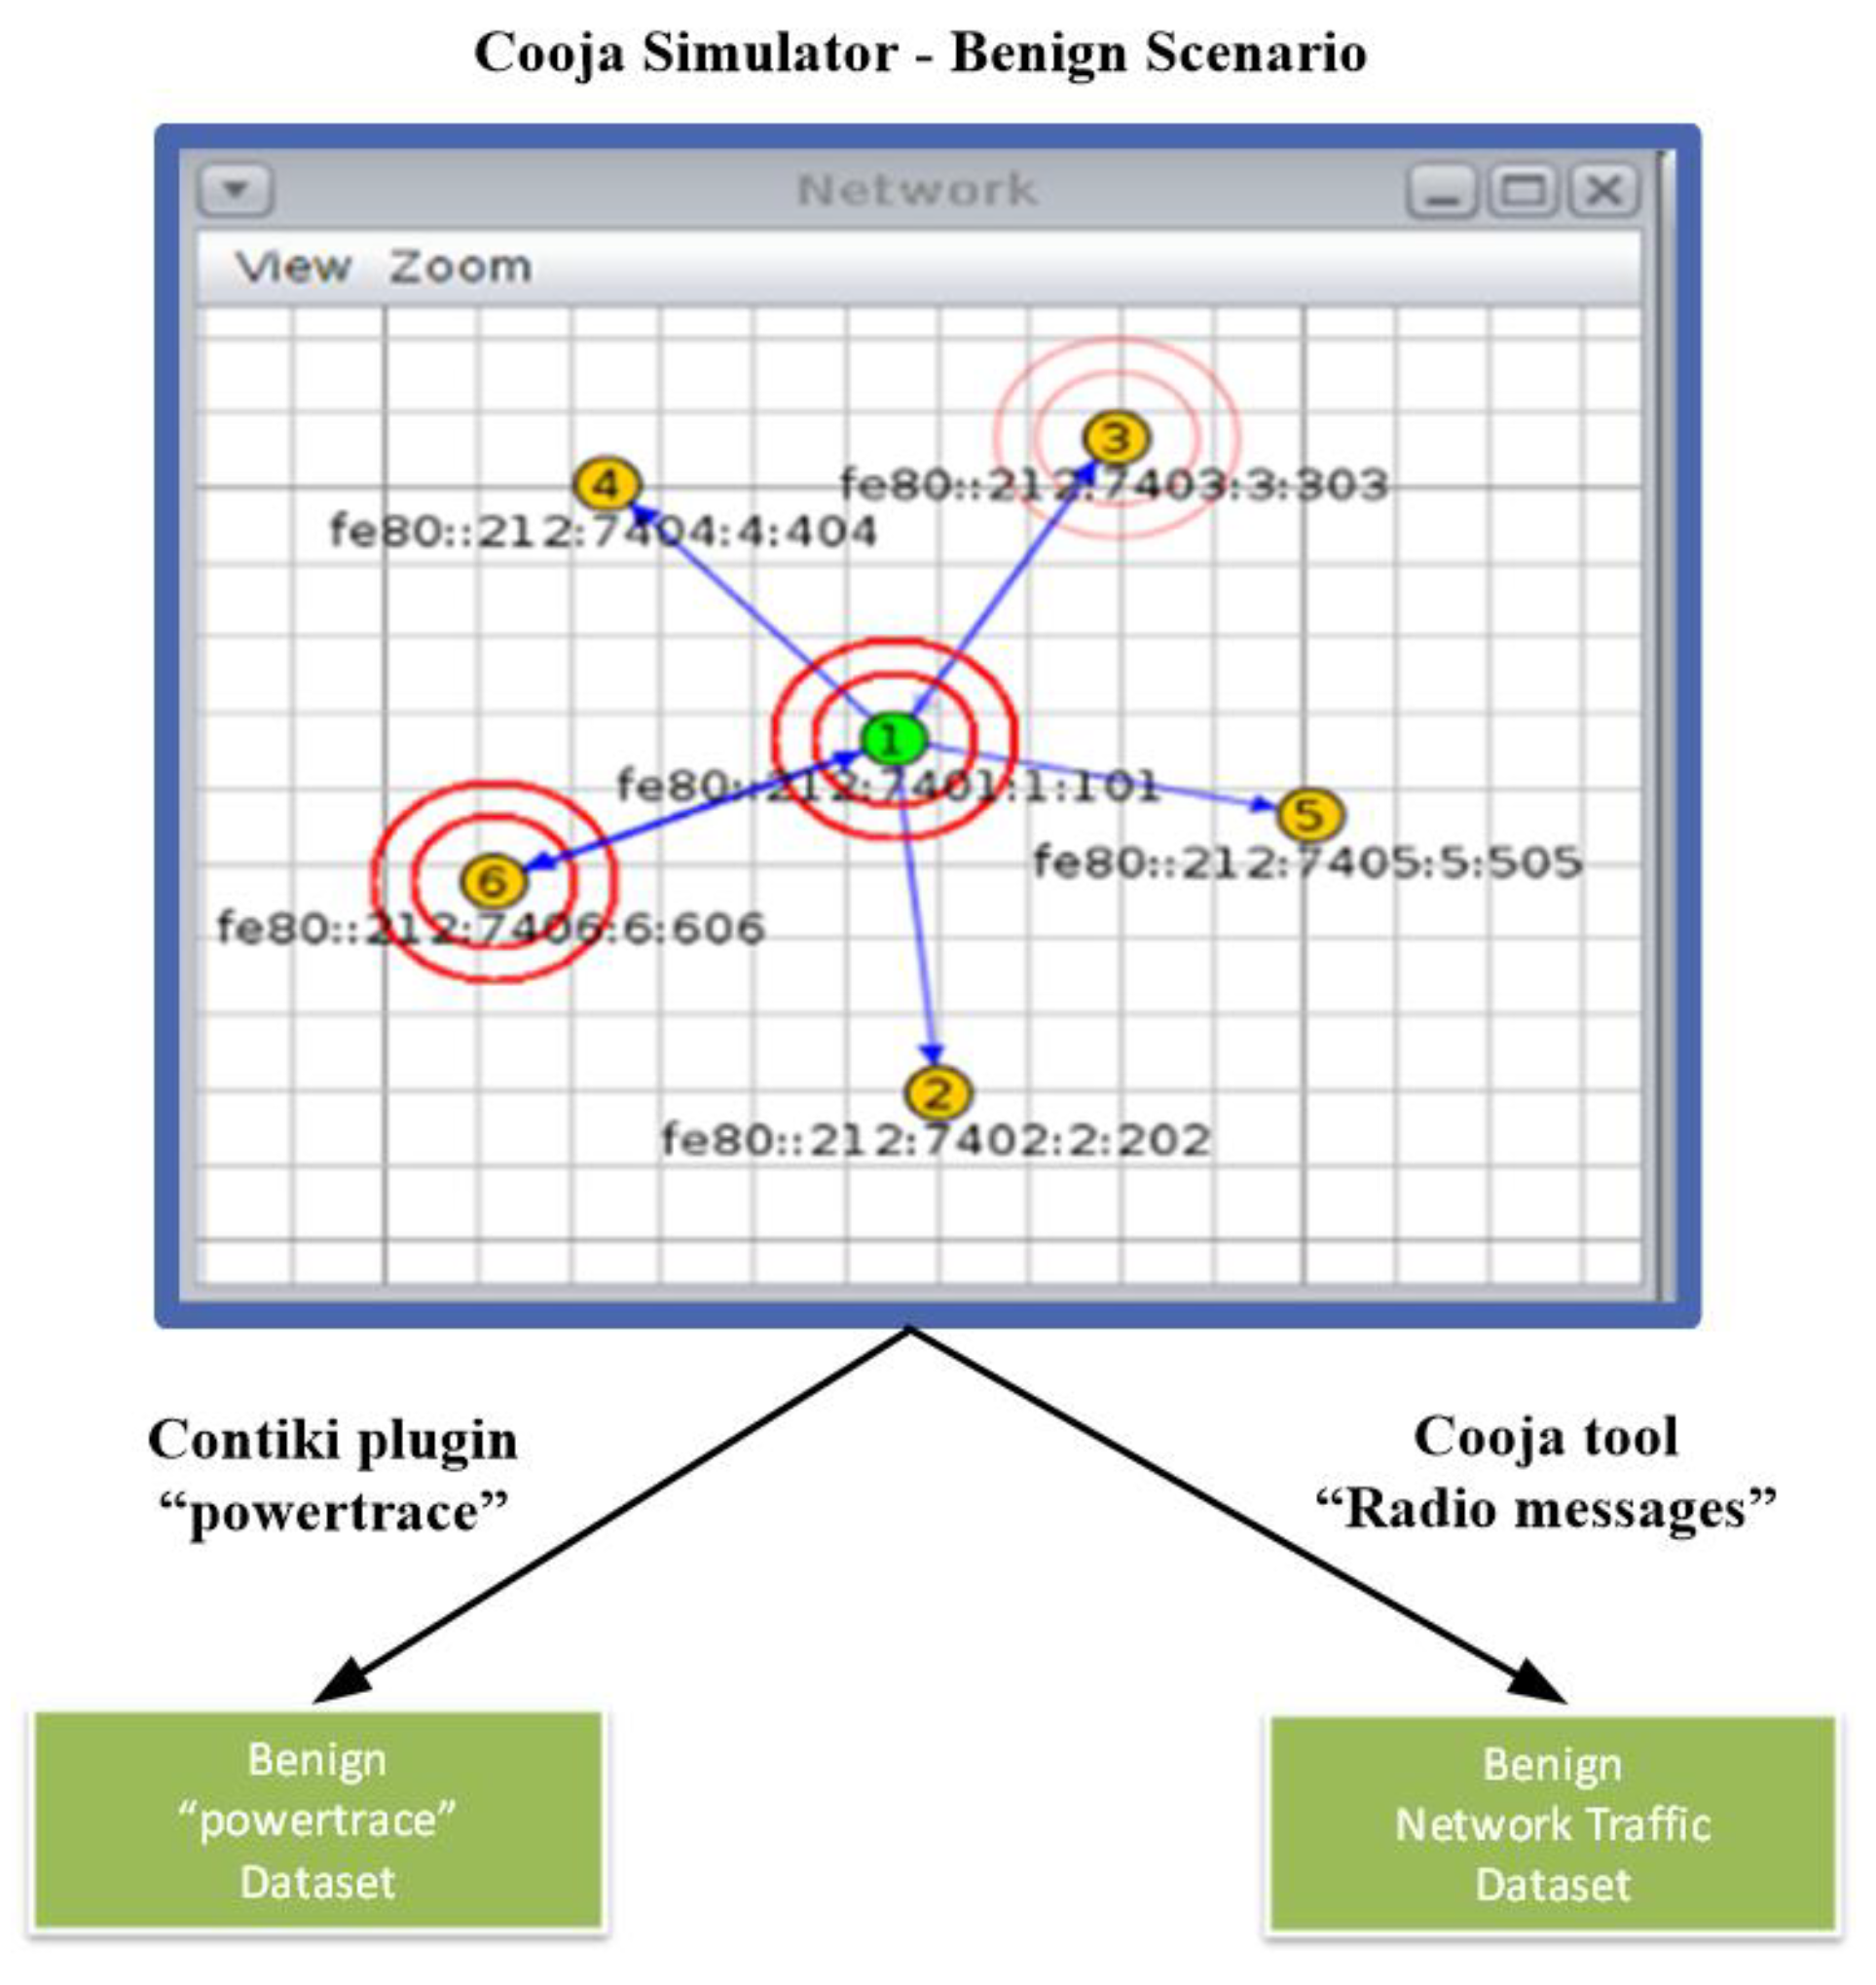
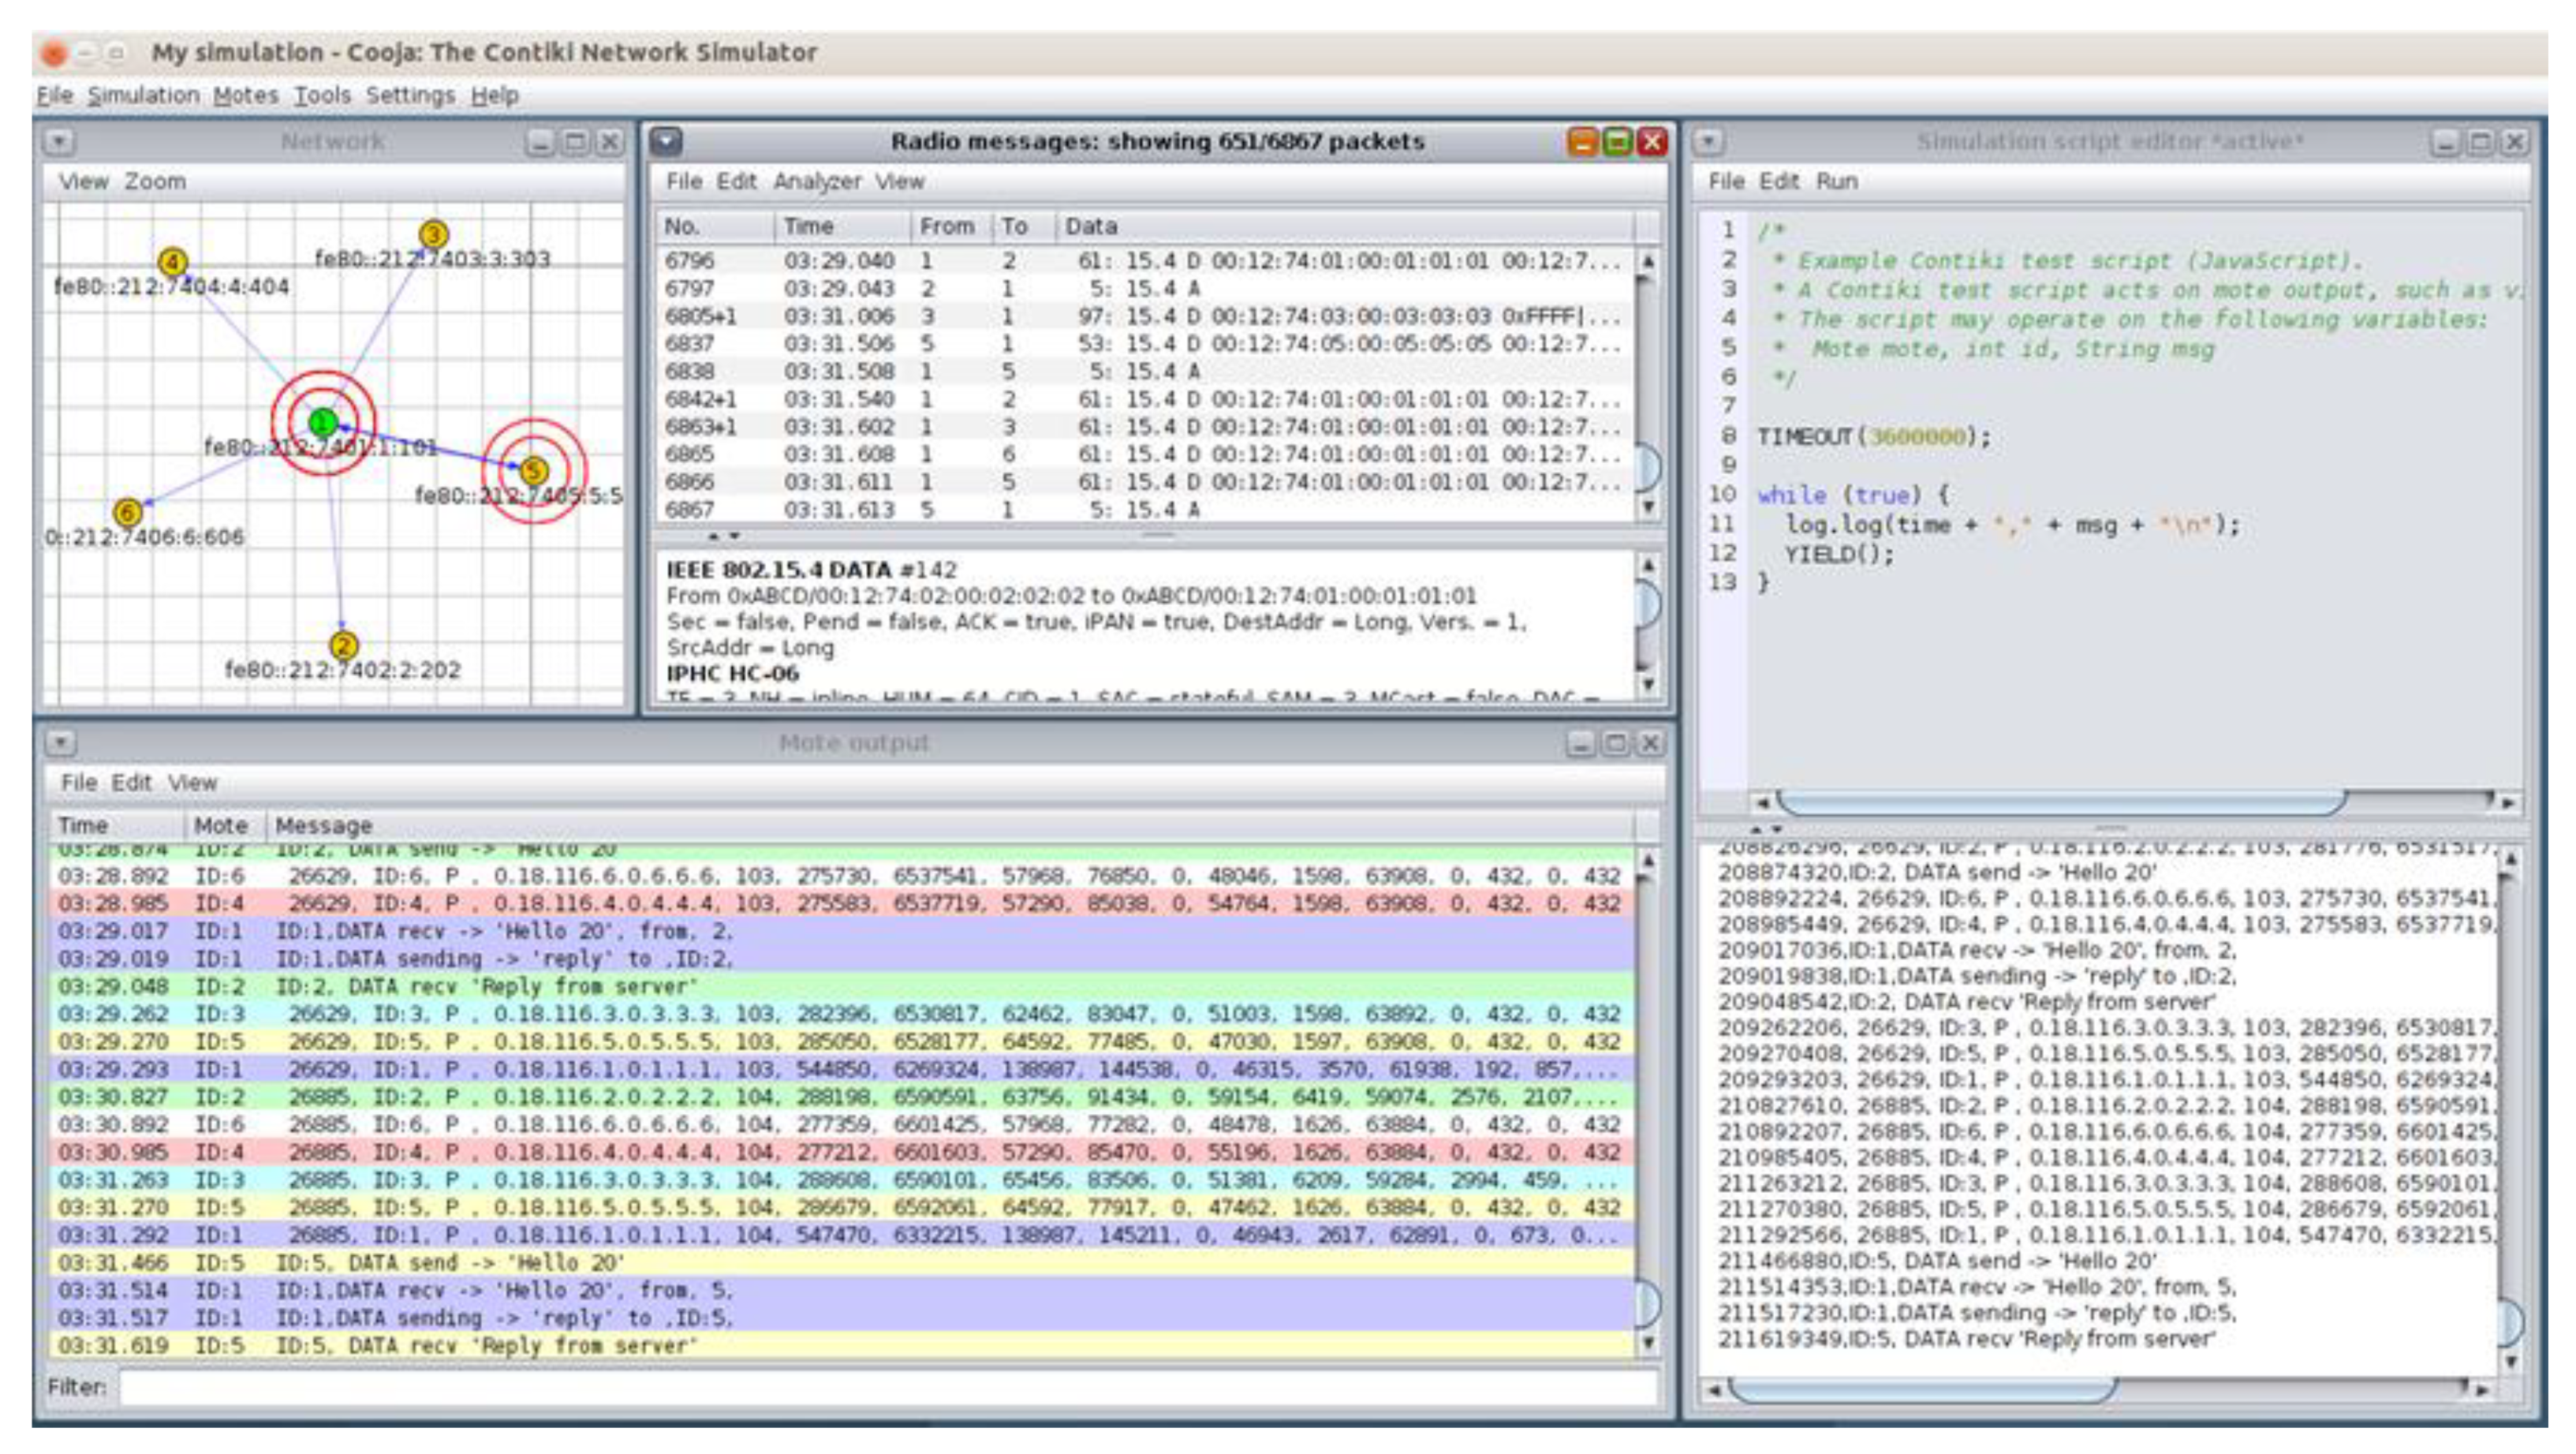
4. Generation of Benign IoT/IIoT Datasets
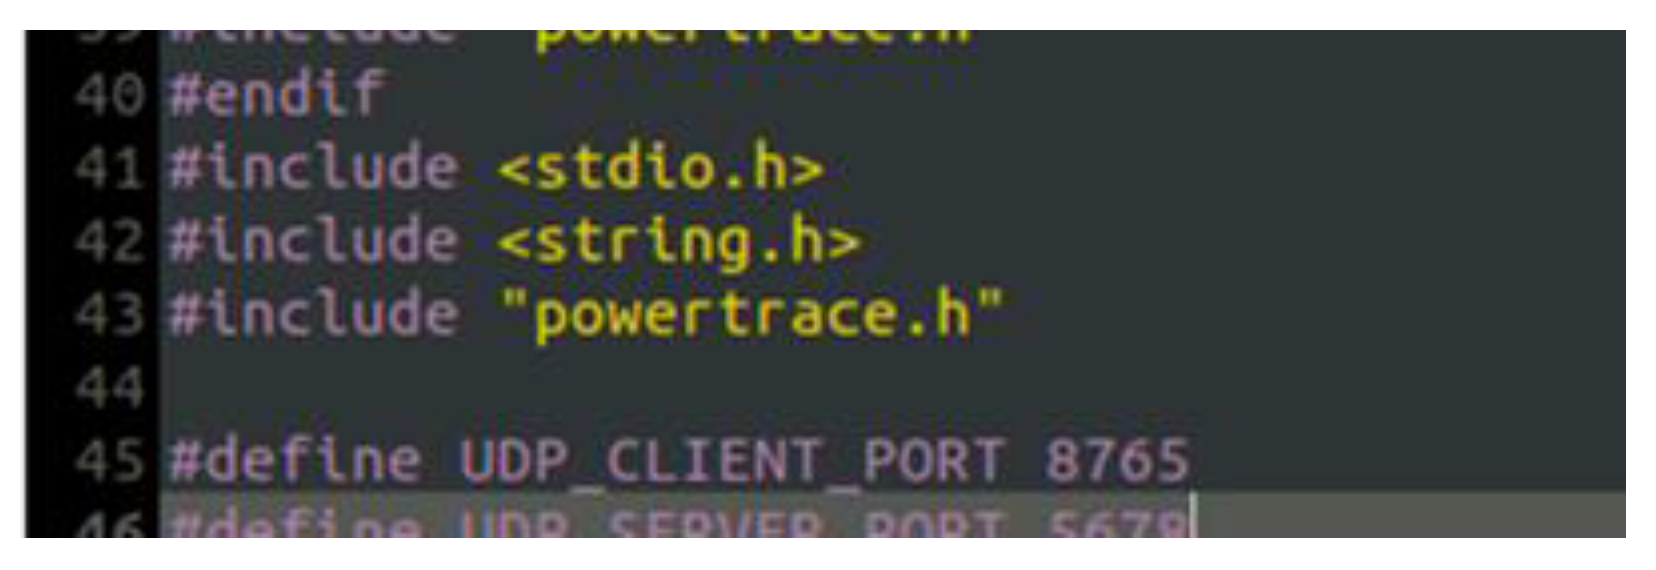
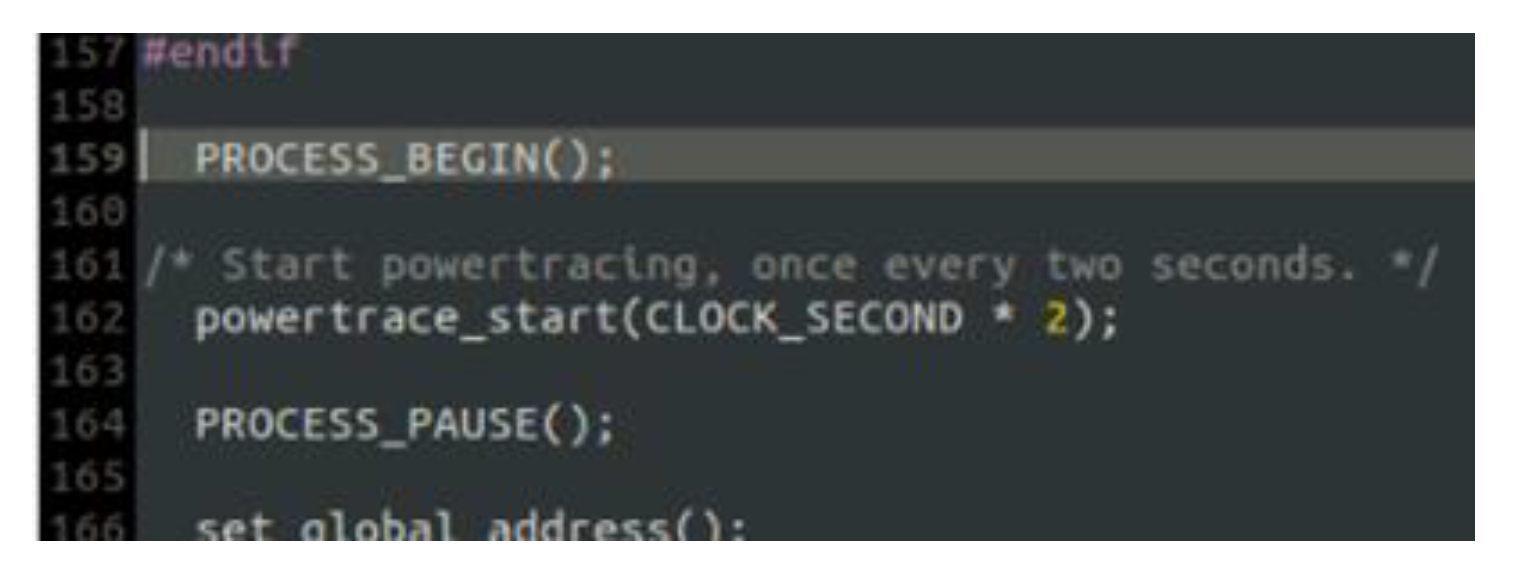
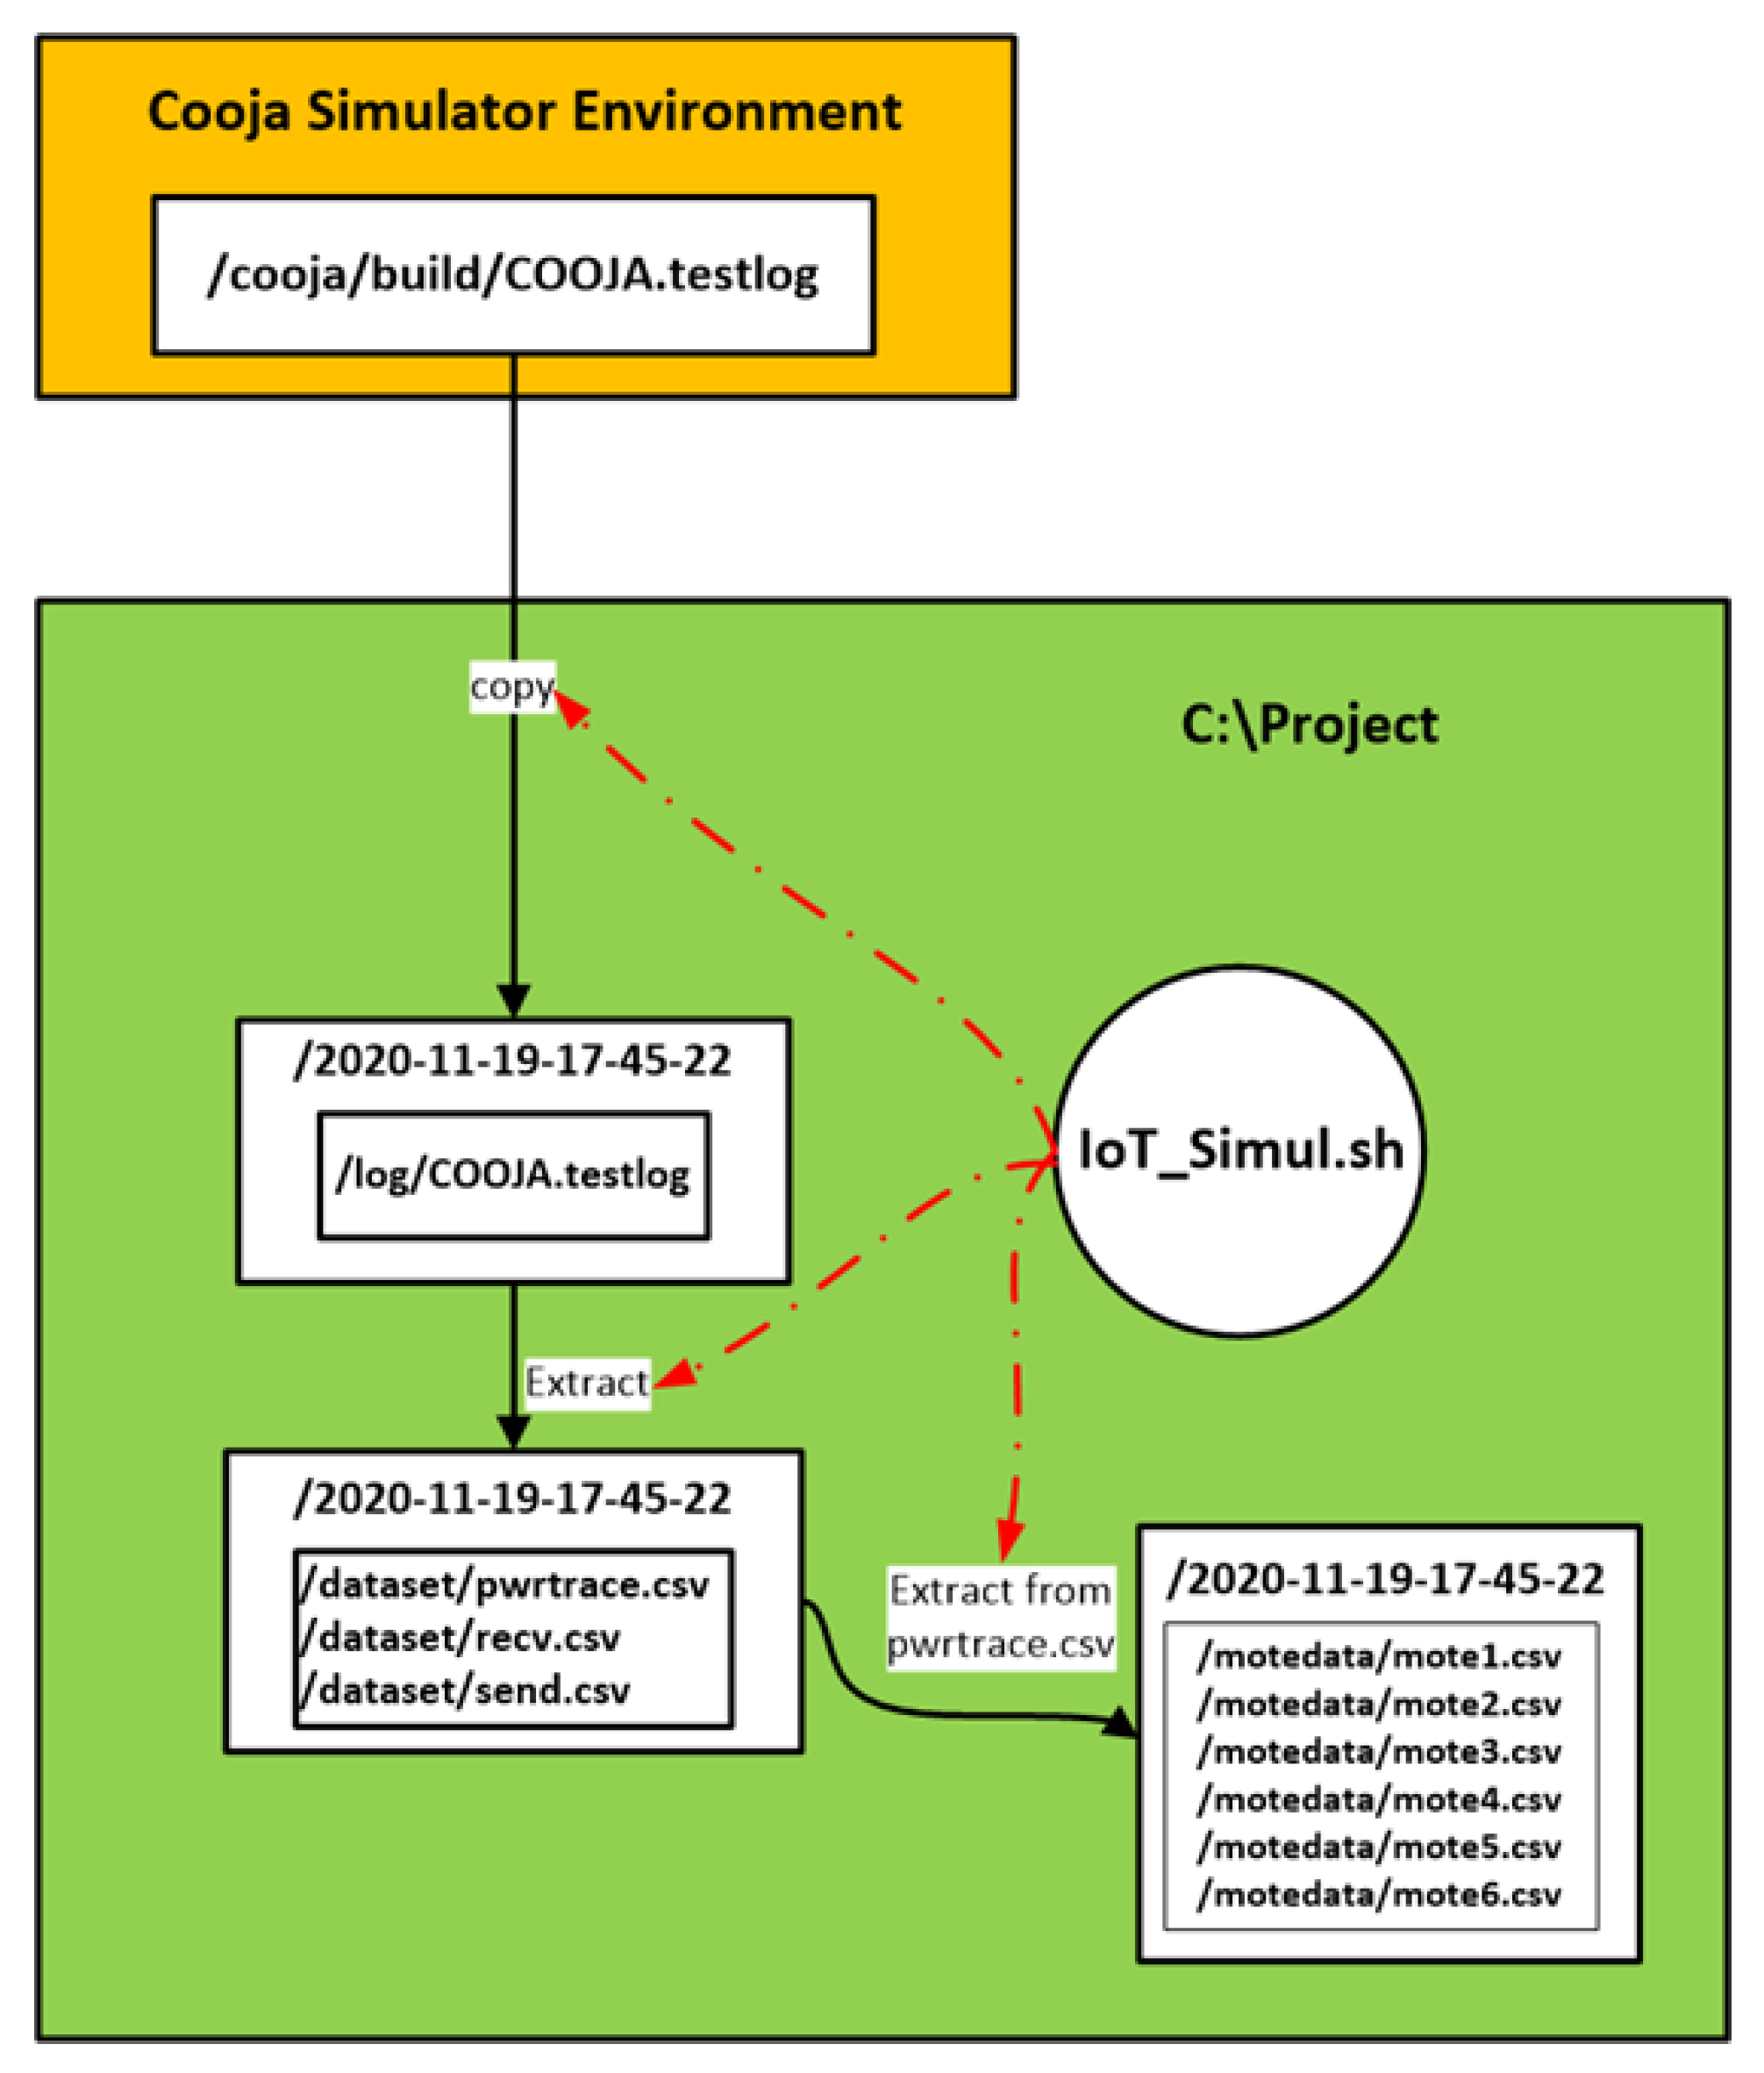
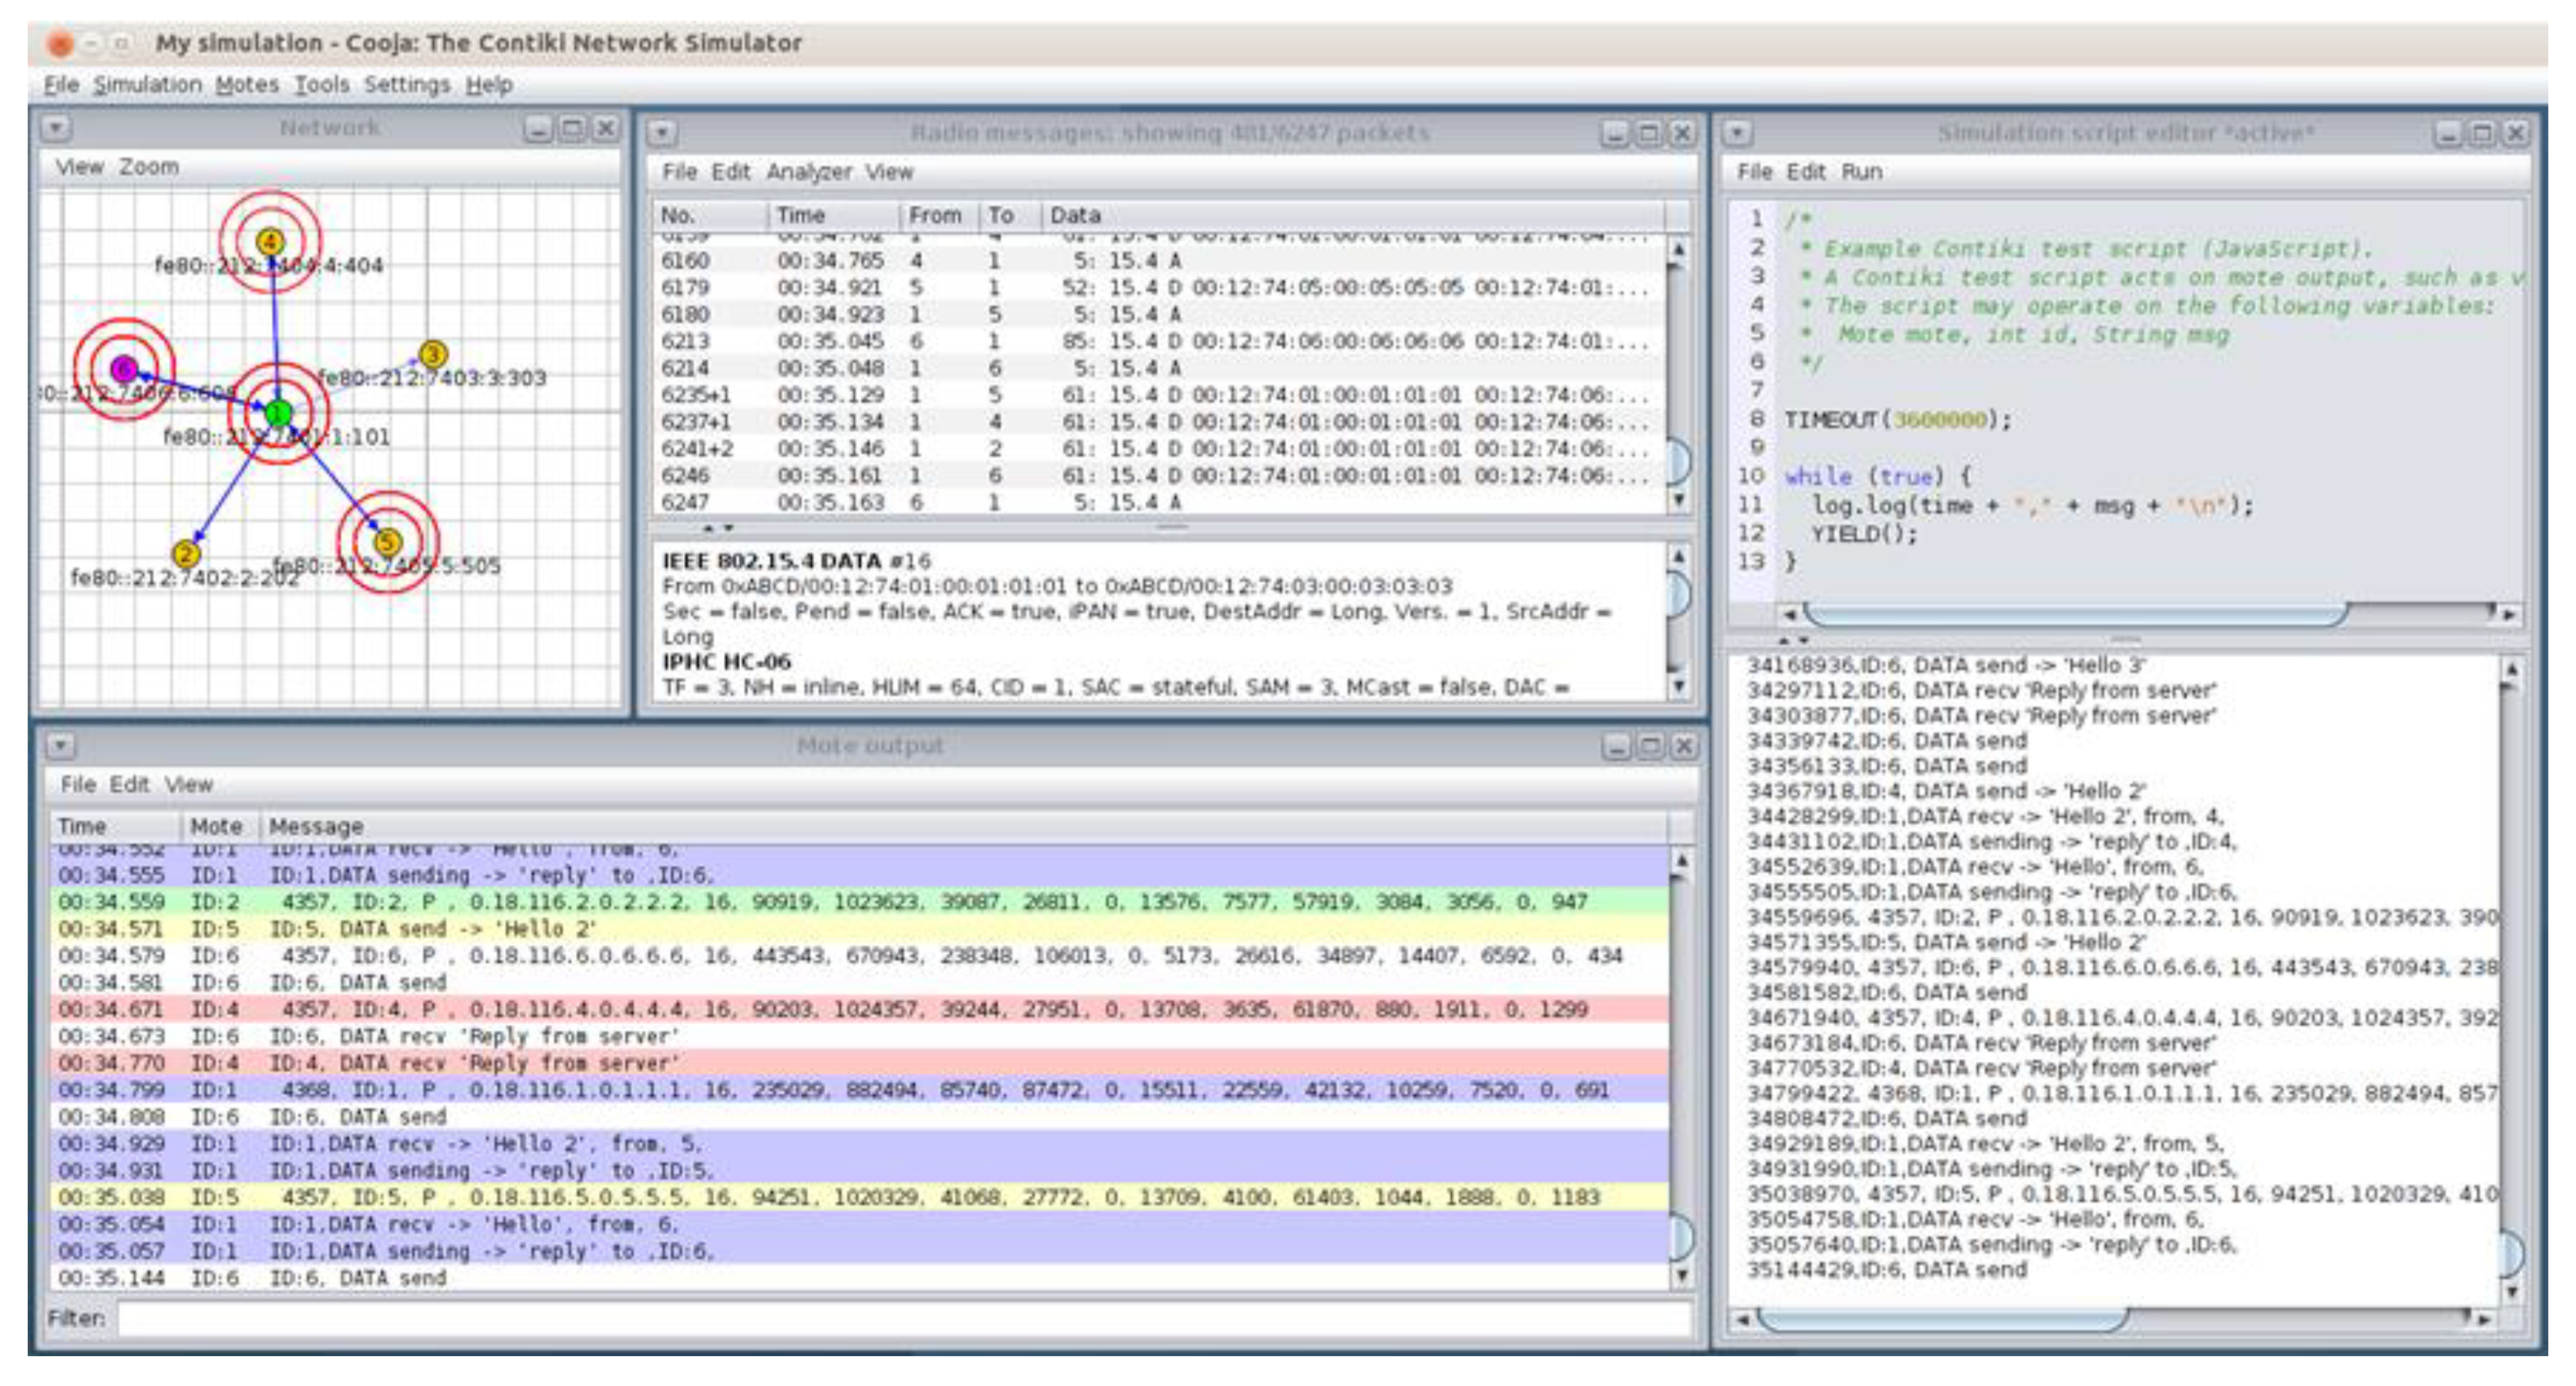
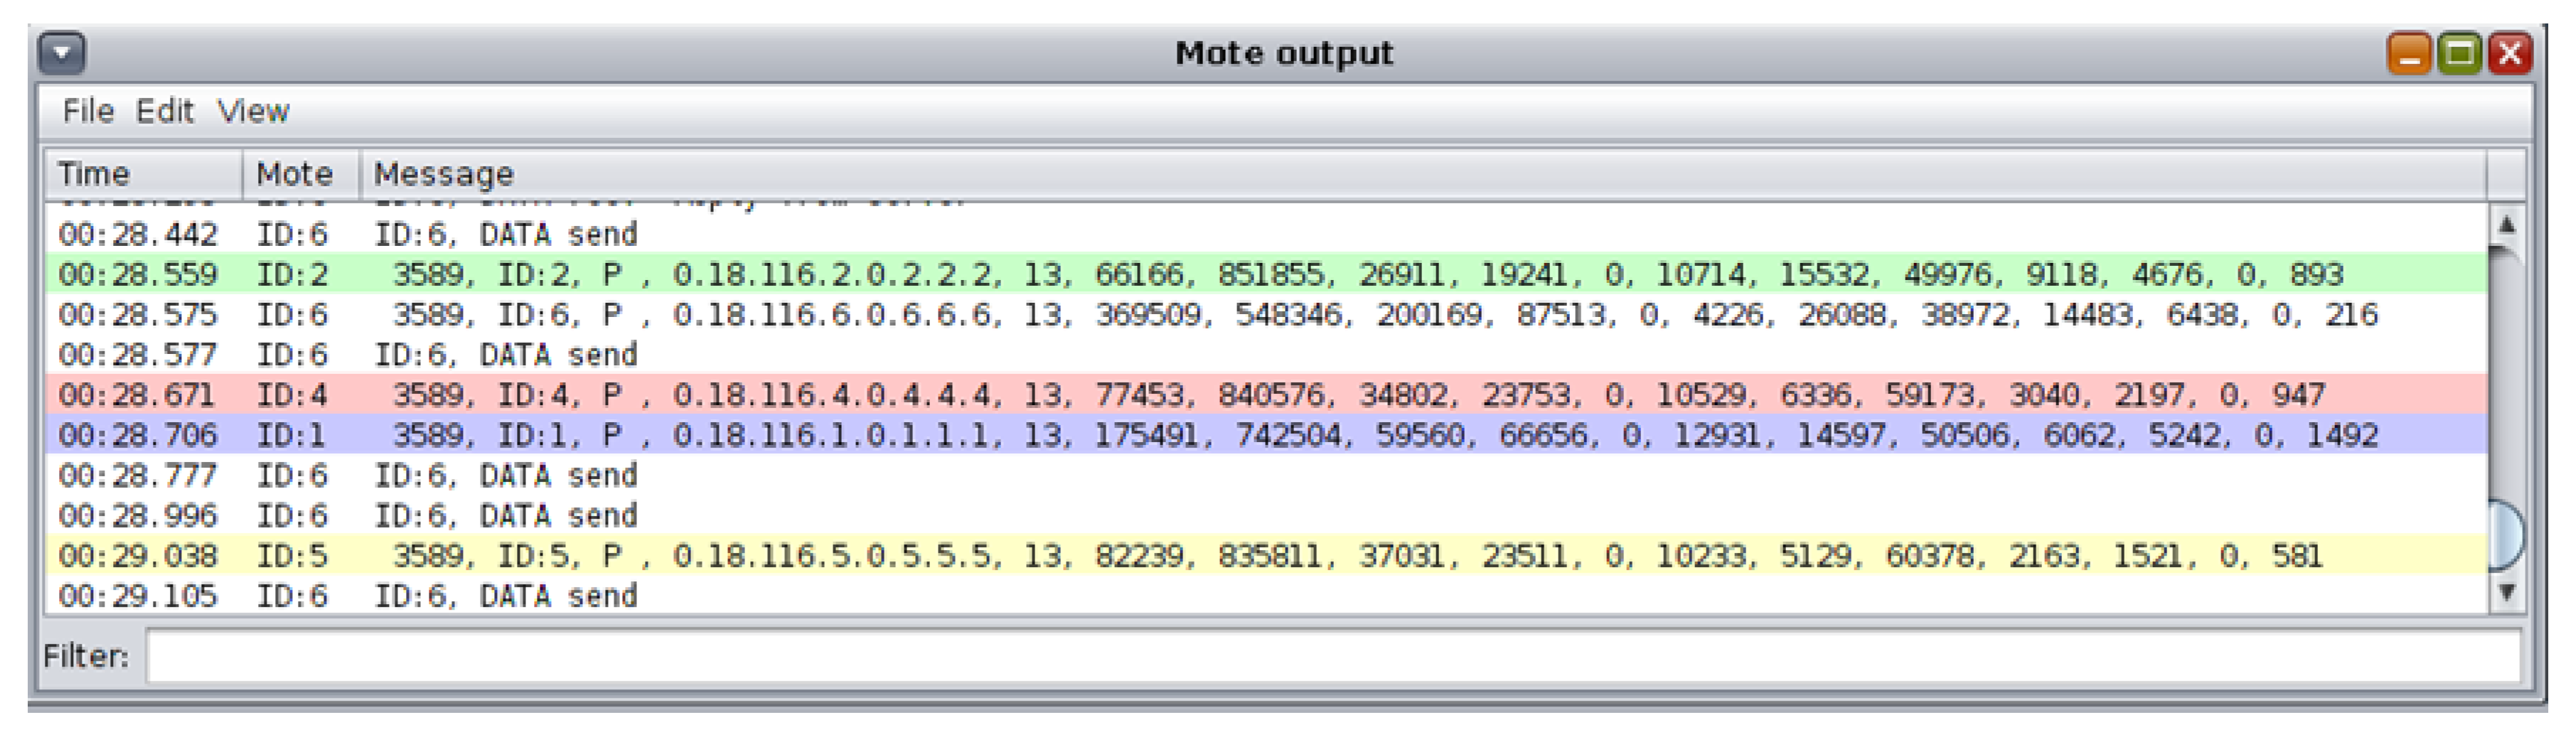
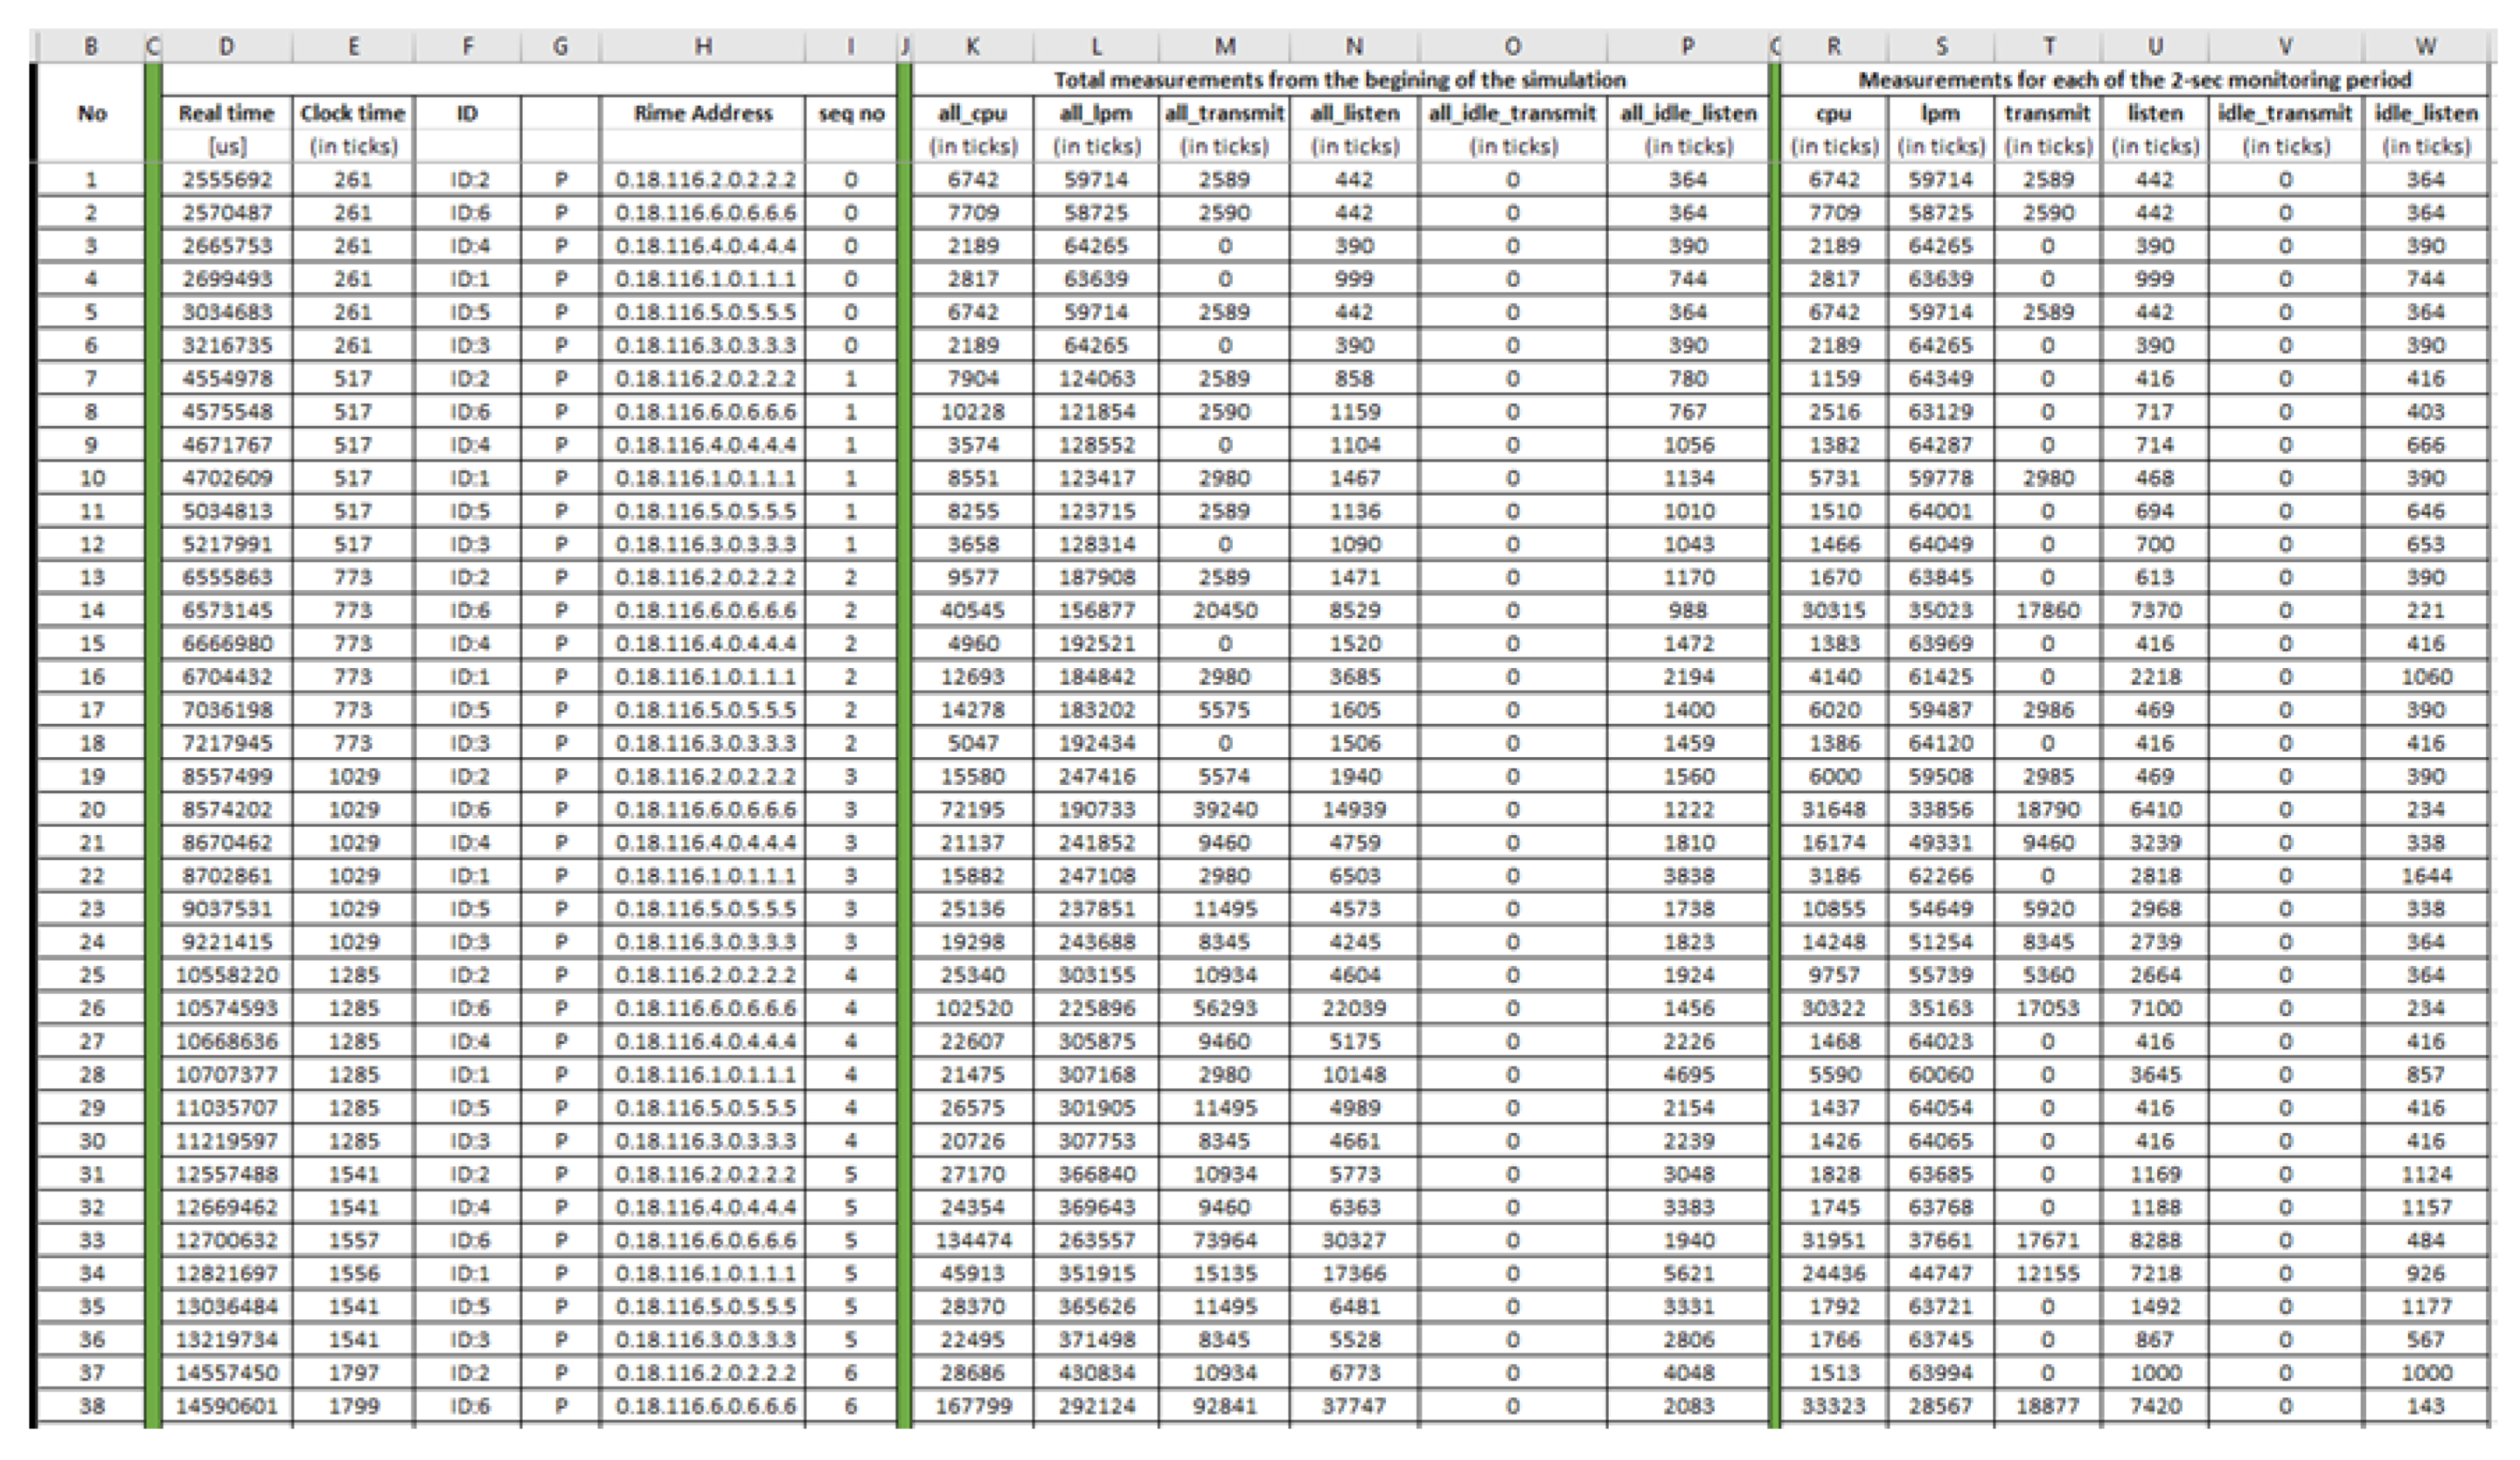
4.1. Benign “Powertrace” Dataset Generation
4.1.1. Benign “Powertrace” Dataset Generation
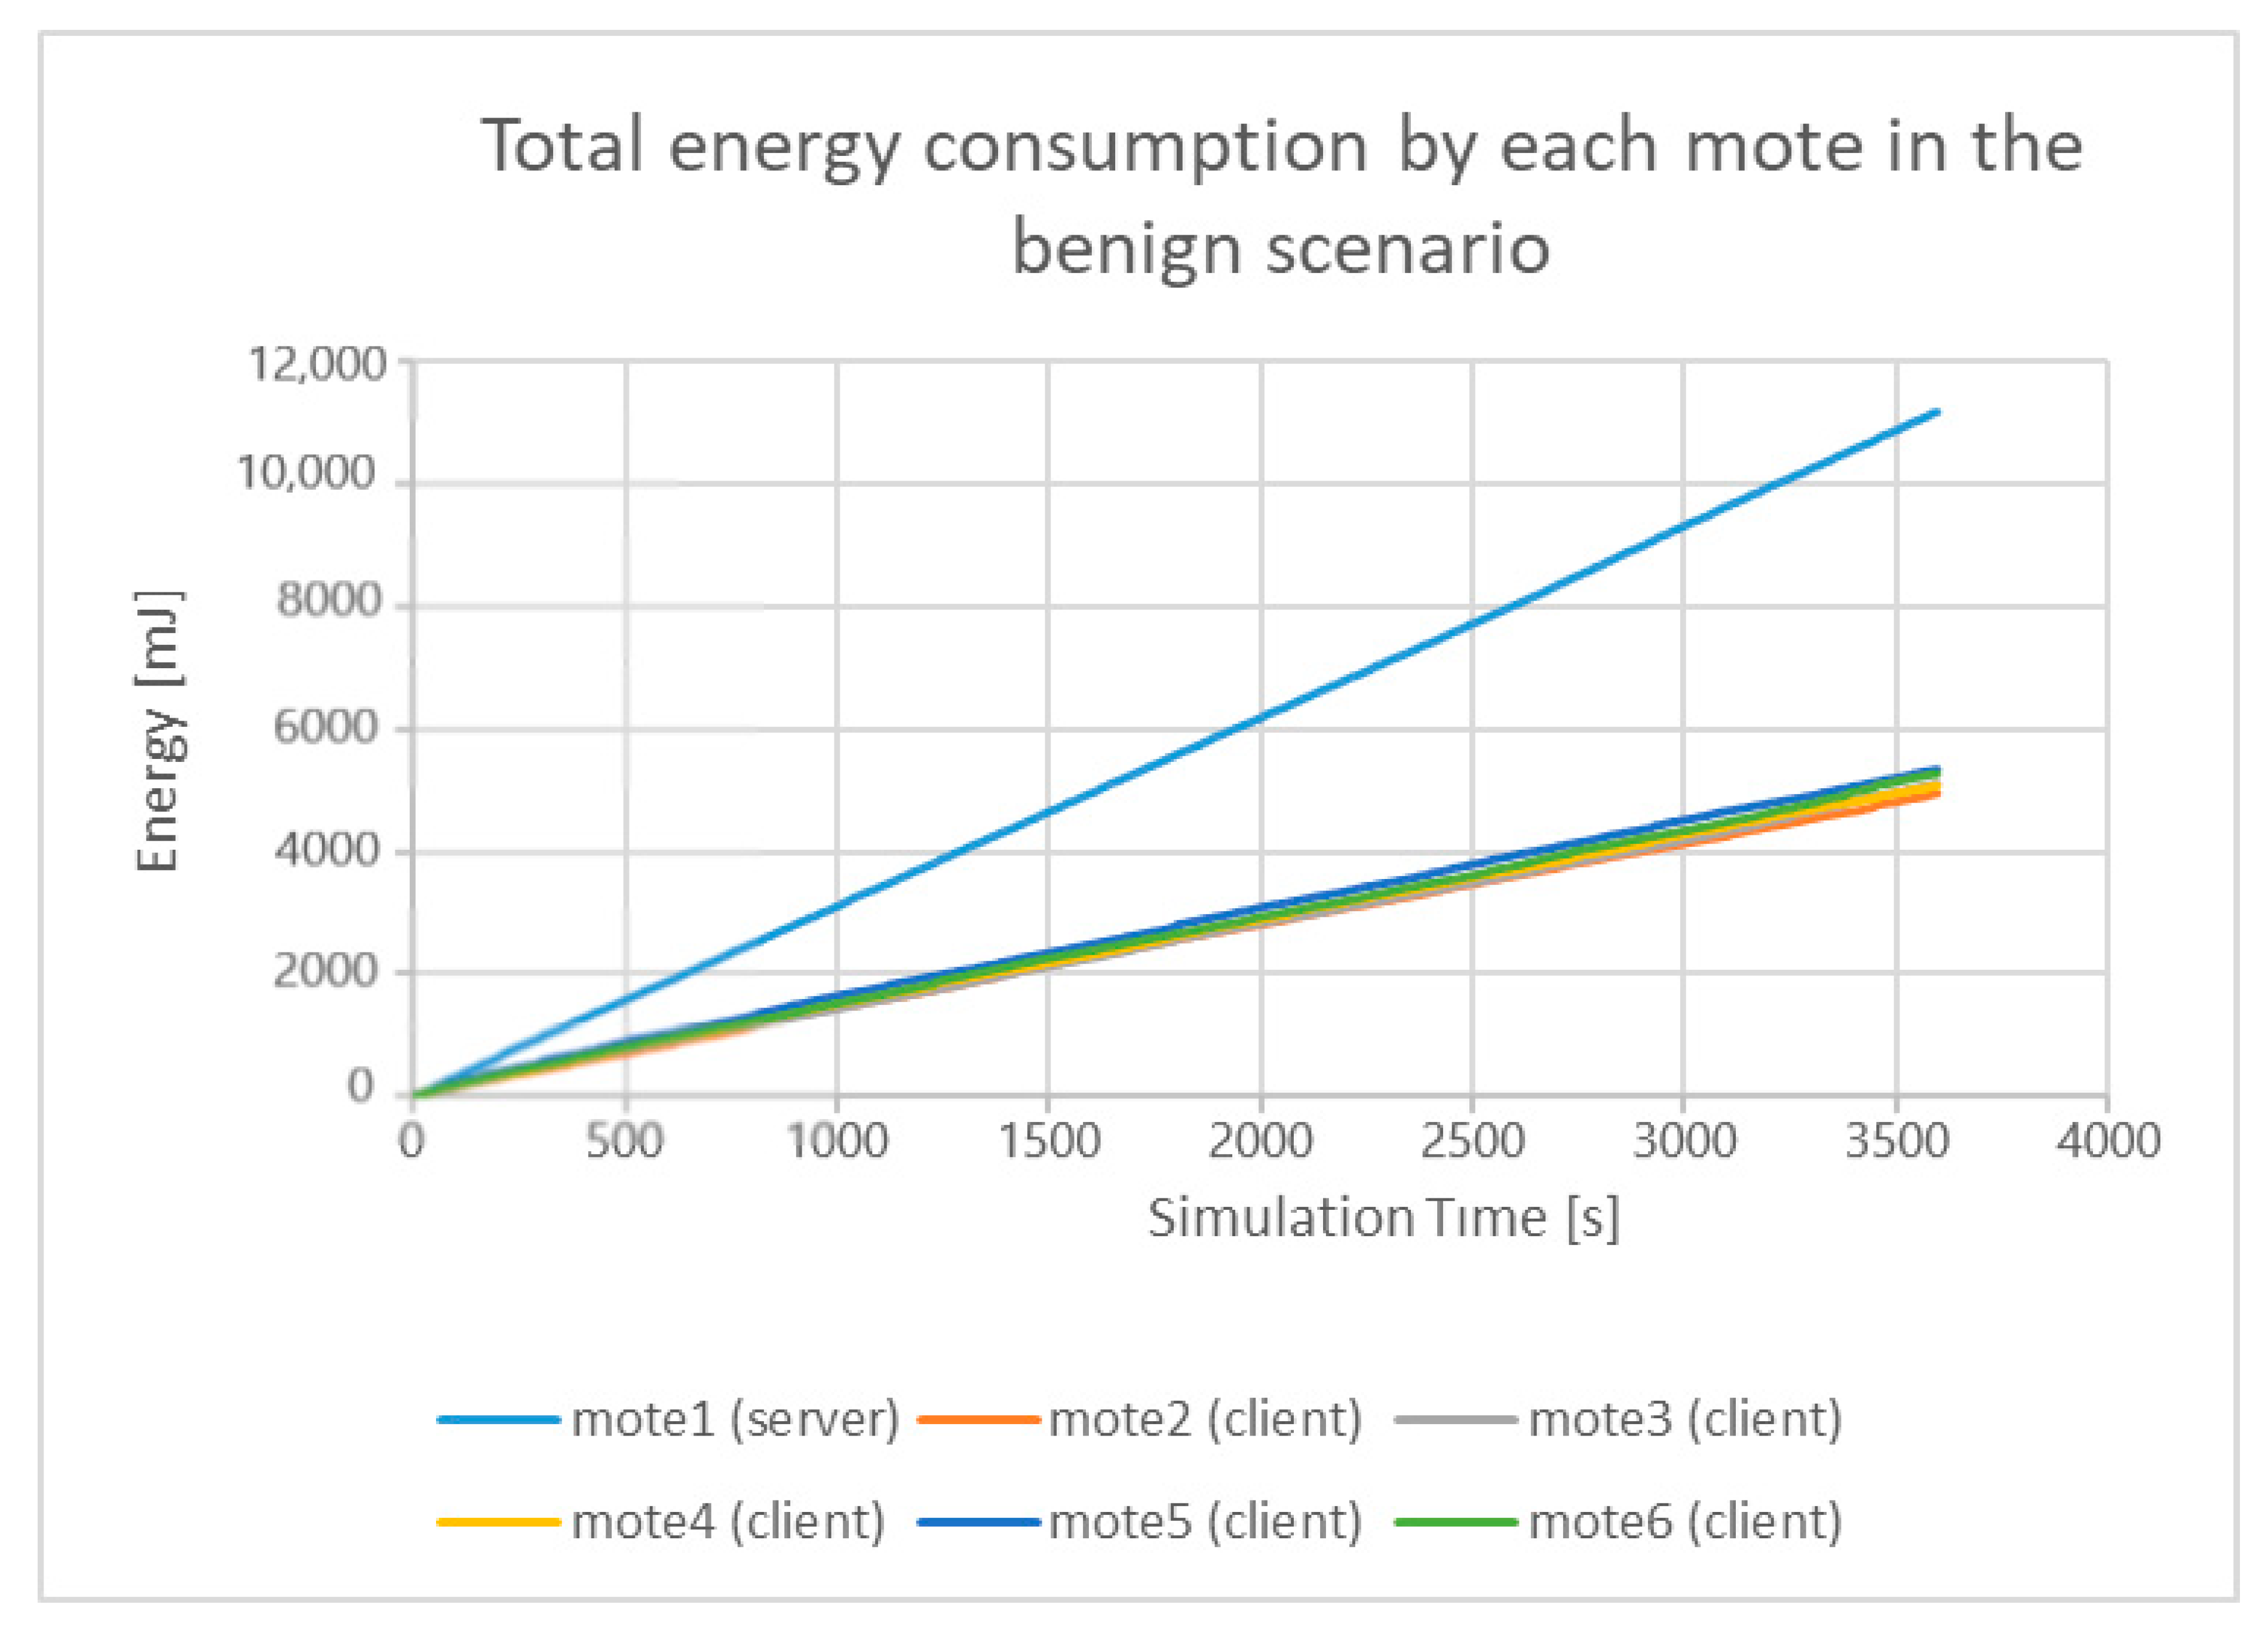
4.1.2. Benign “Powertrace” Datasets—Results
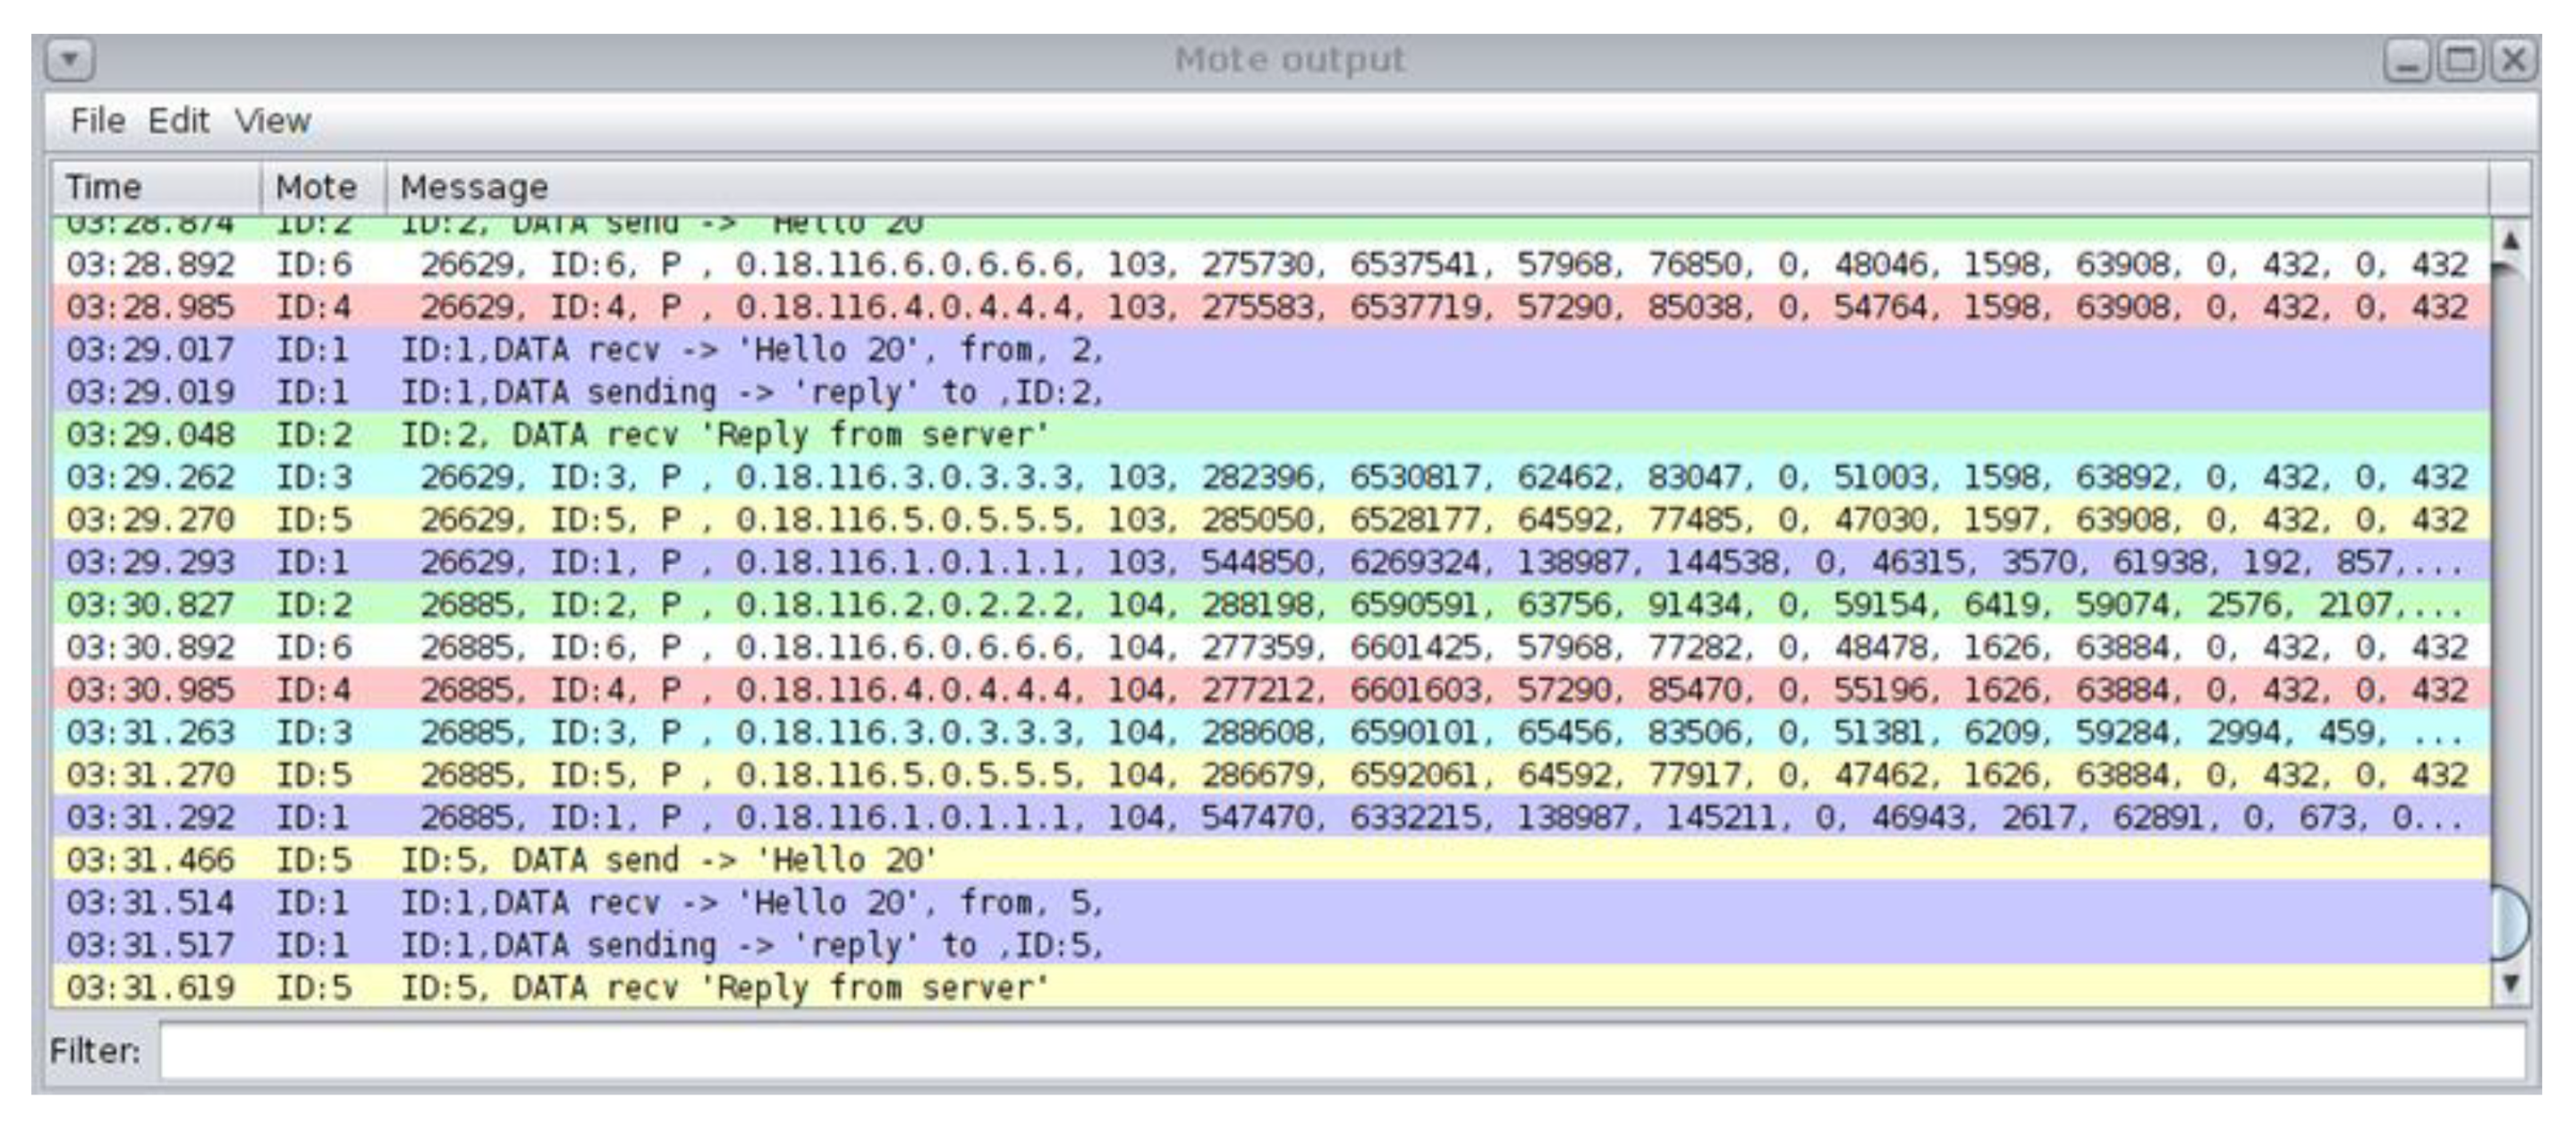
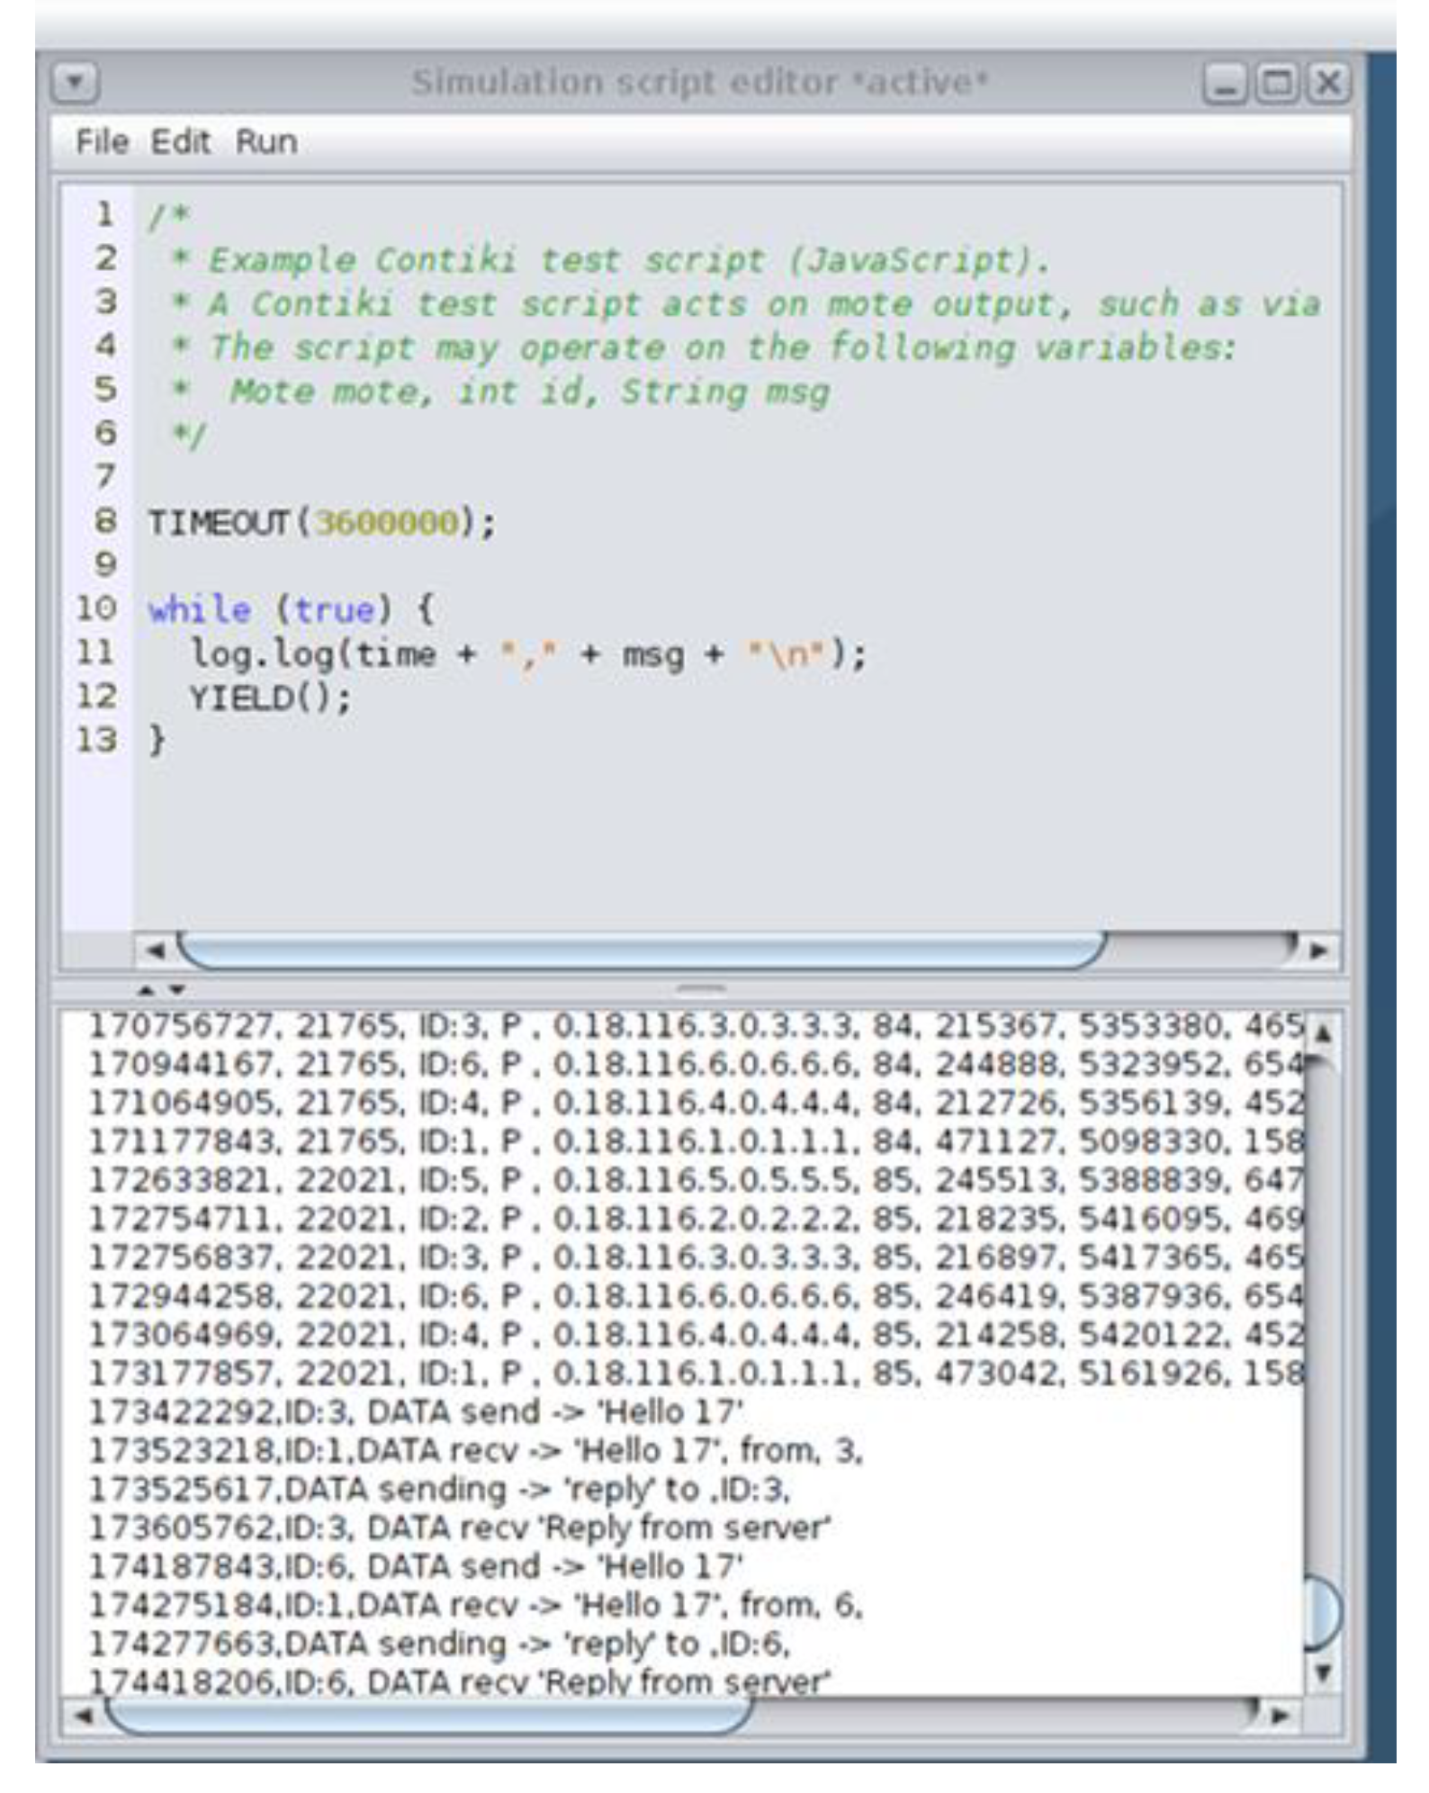
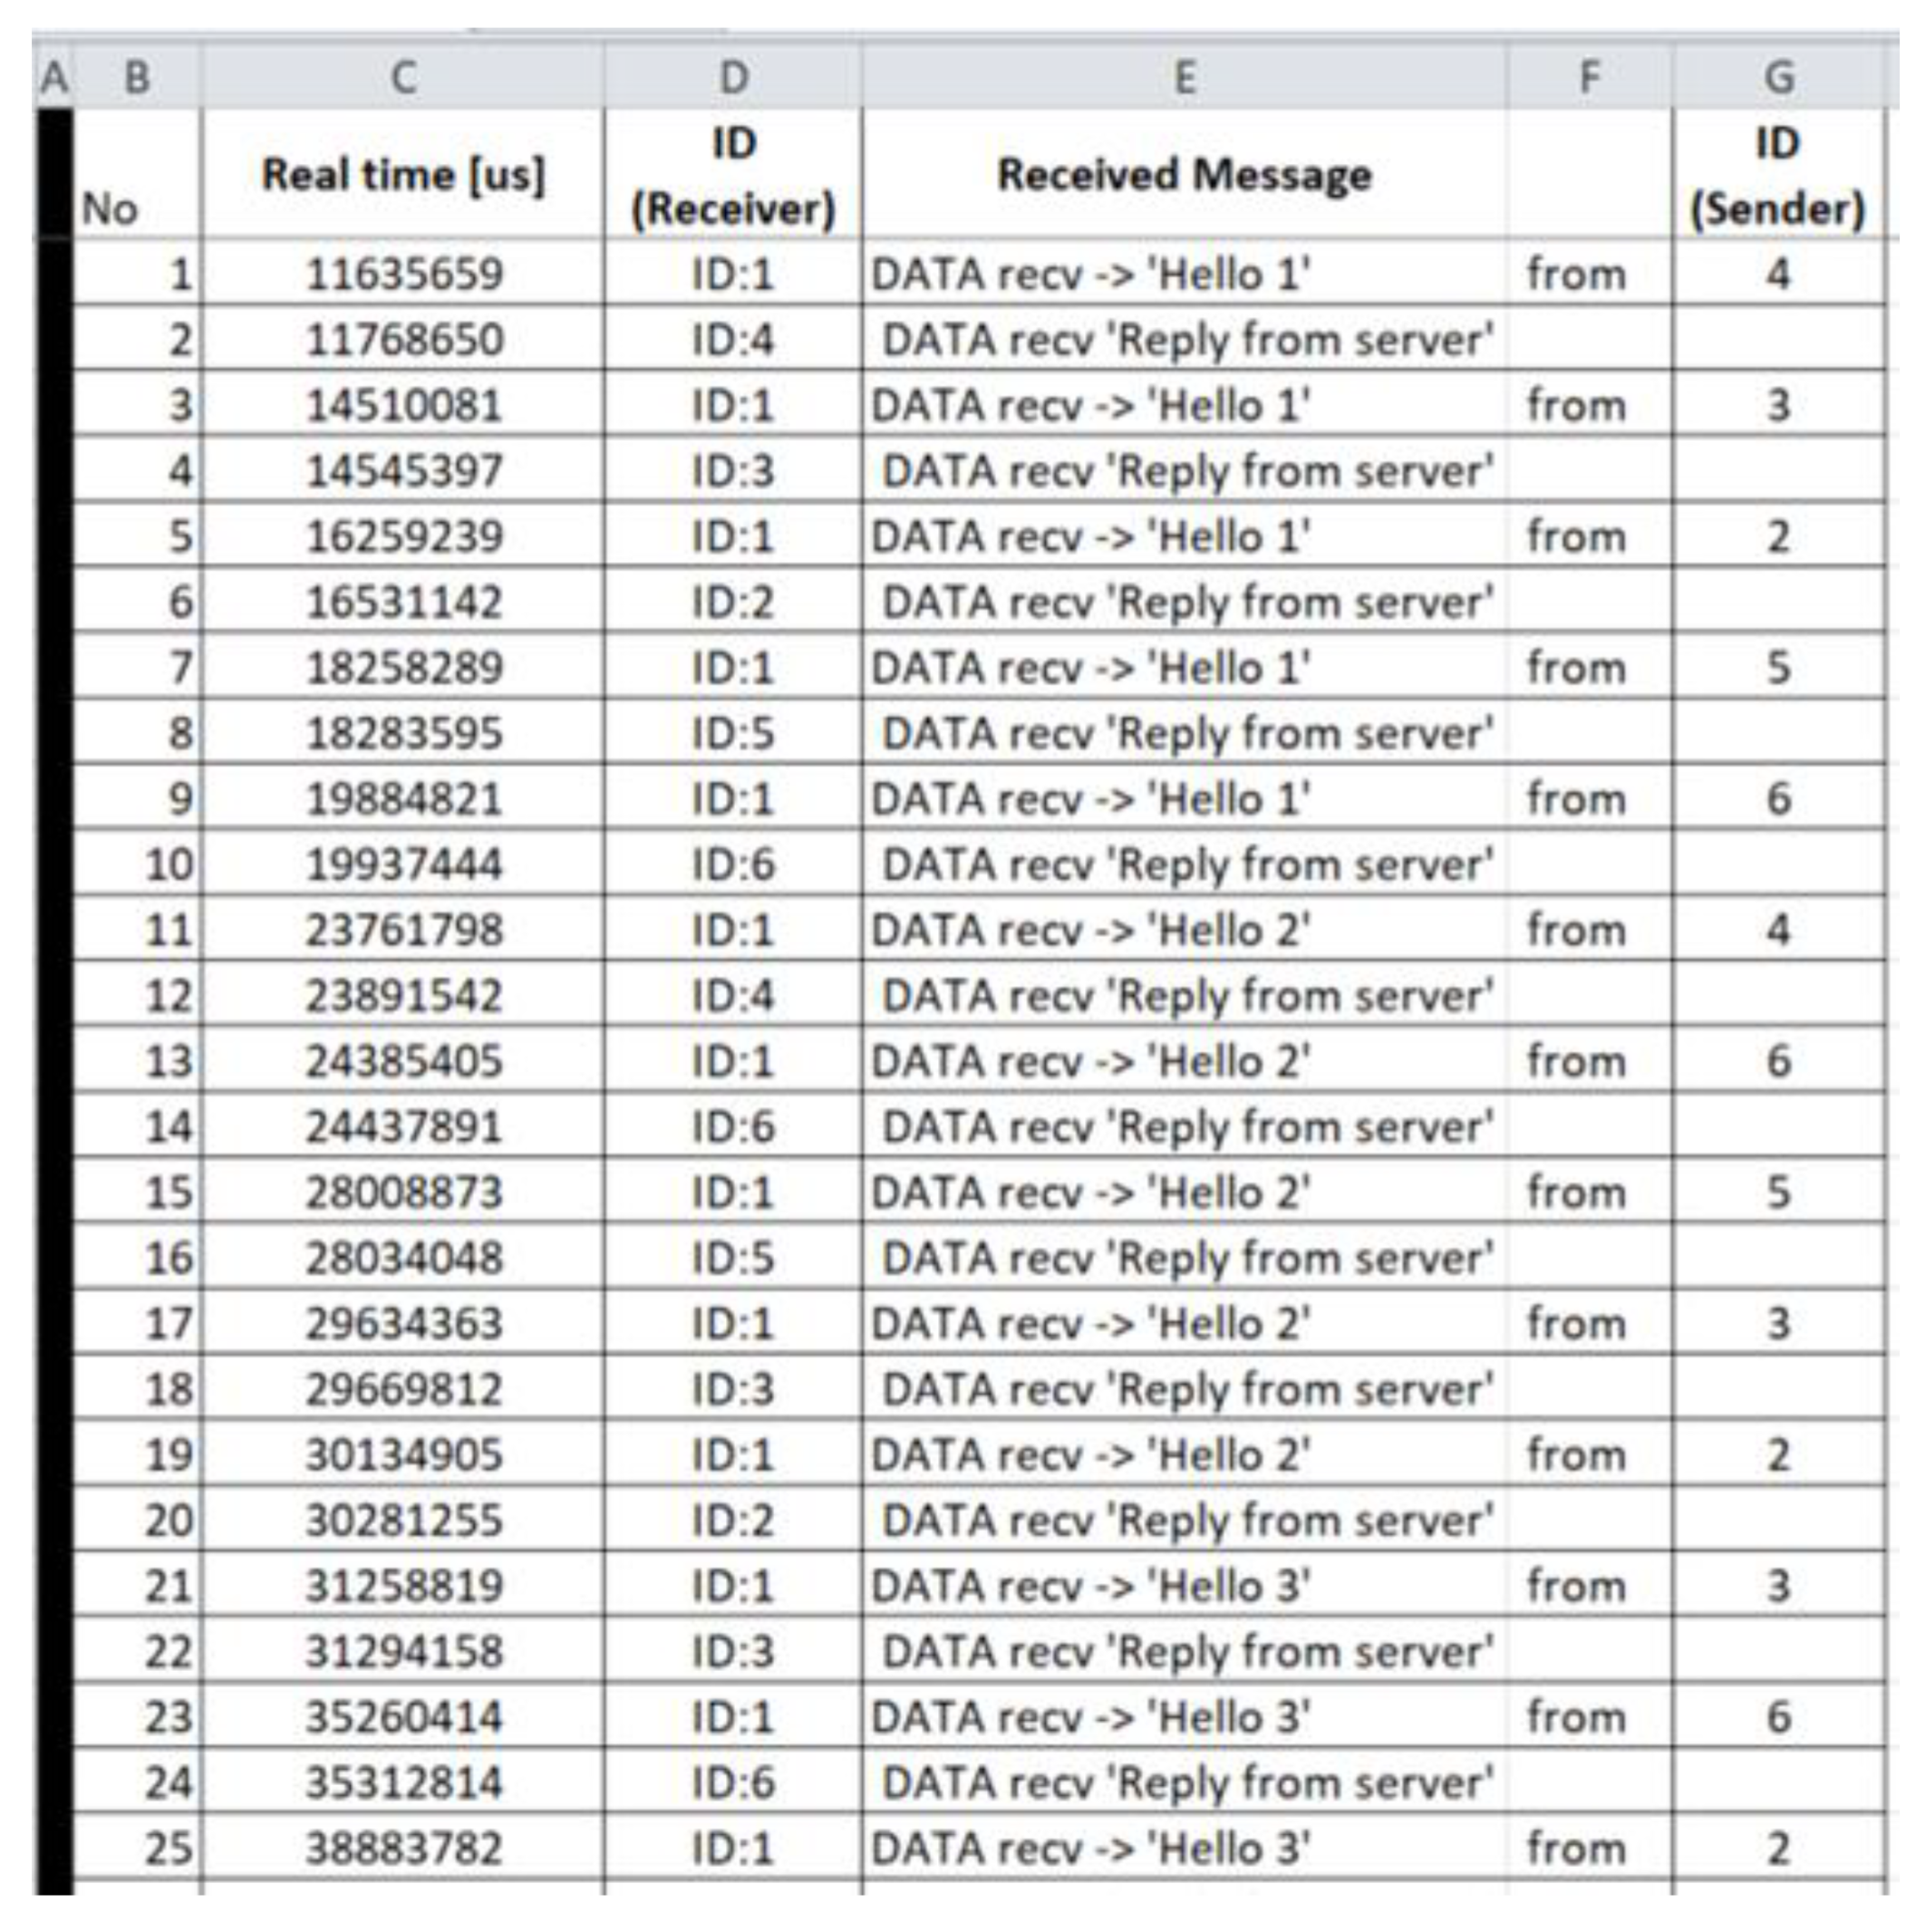
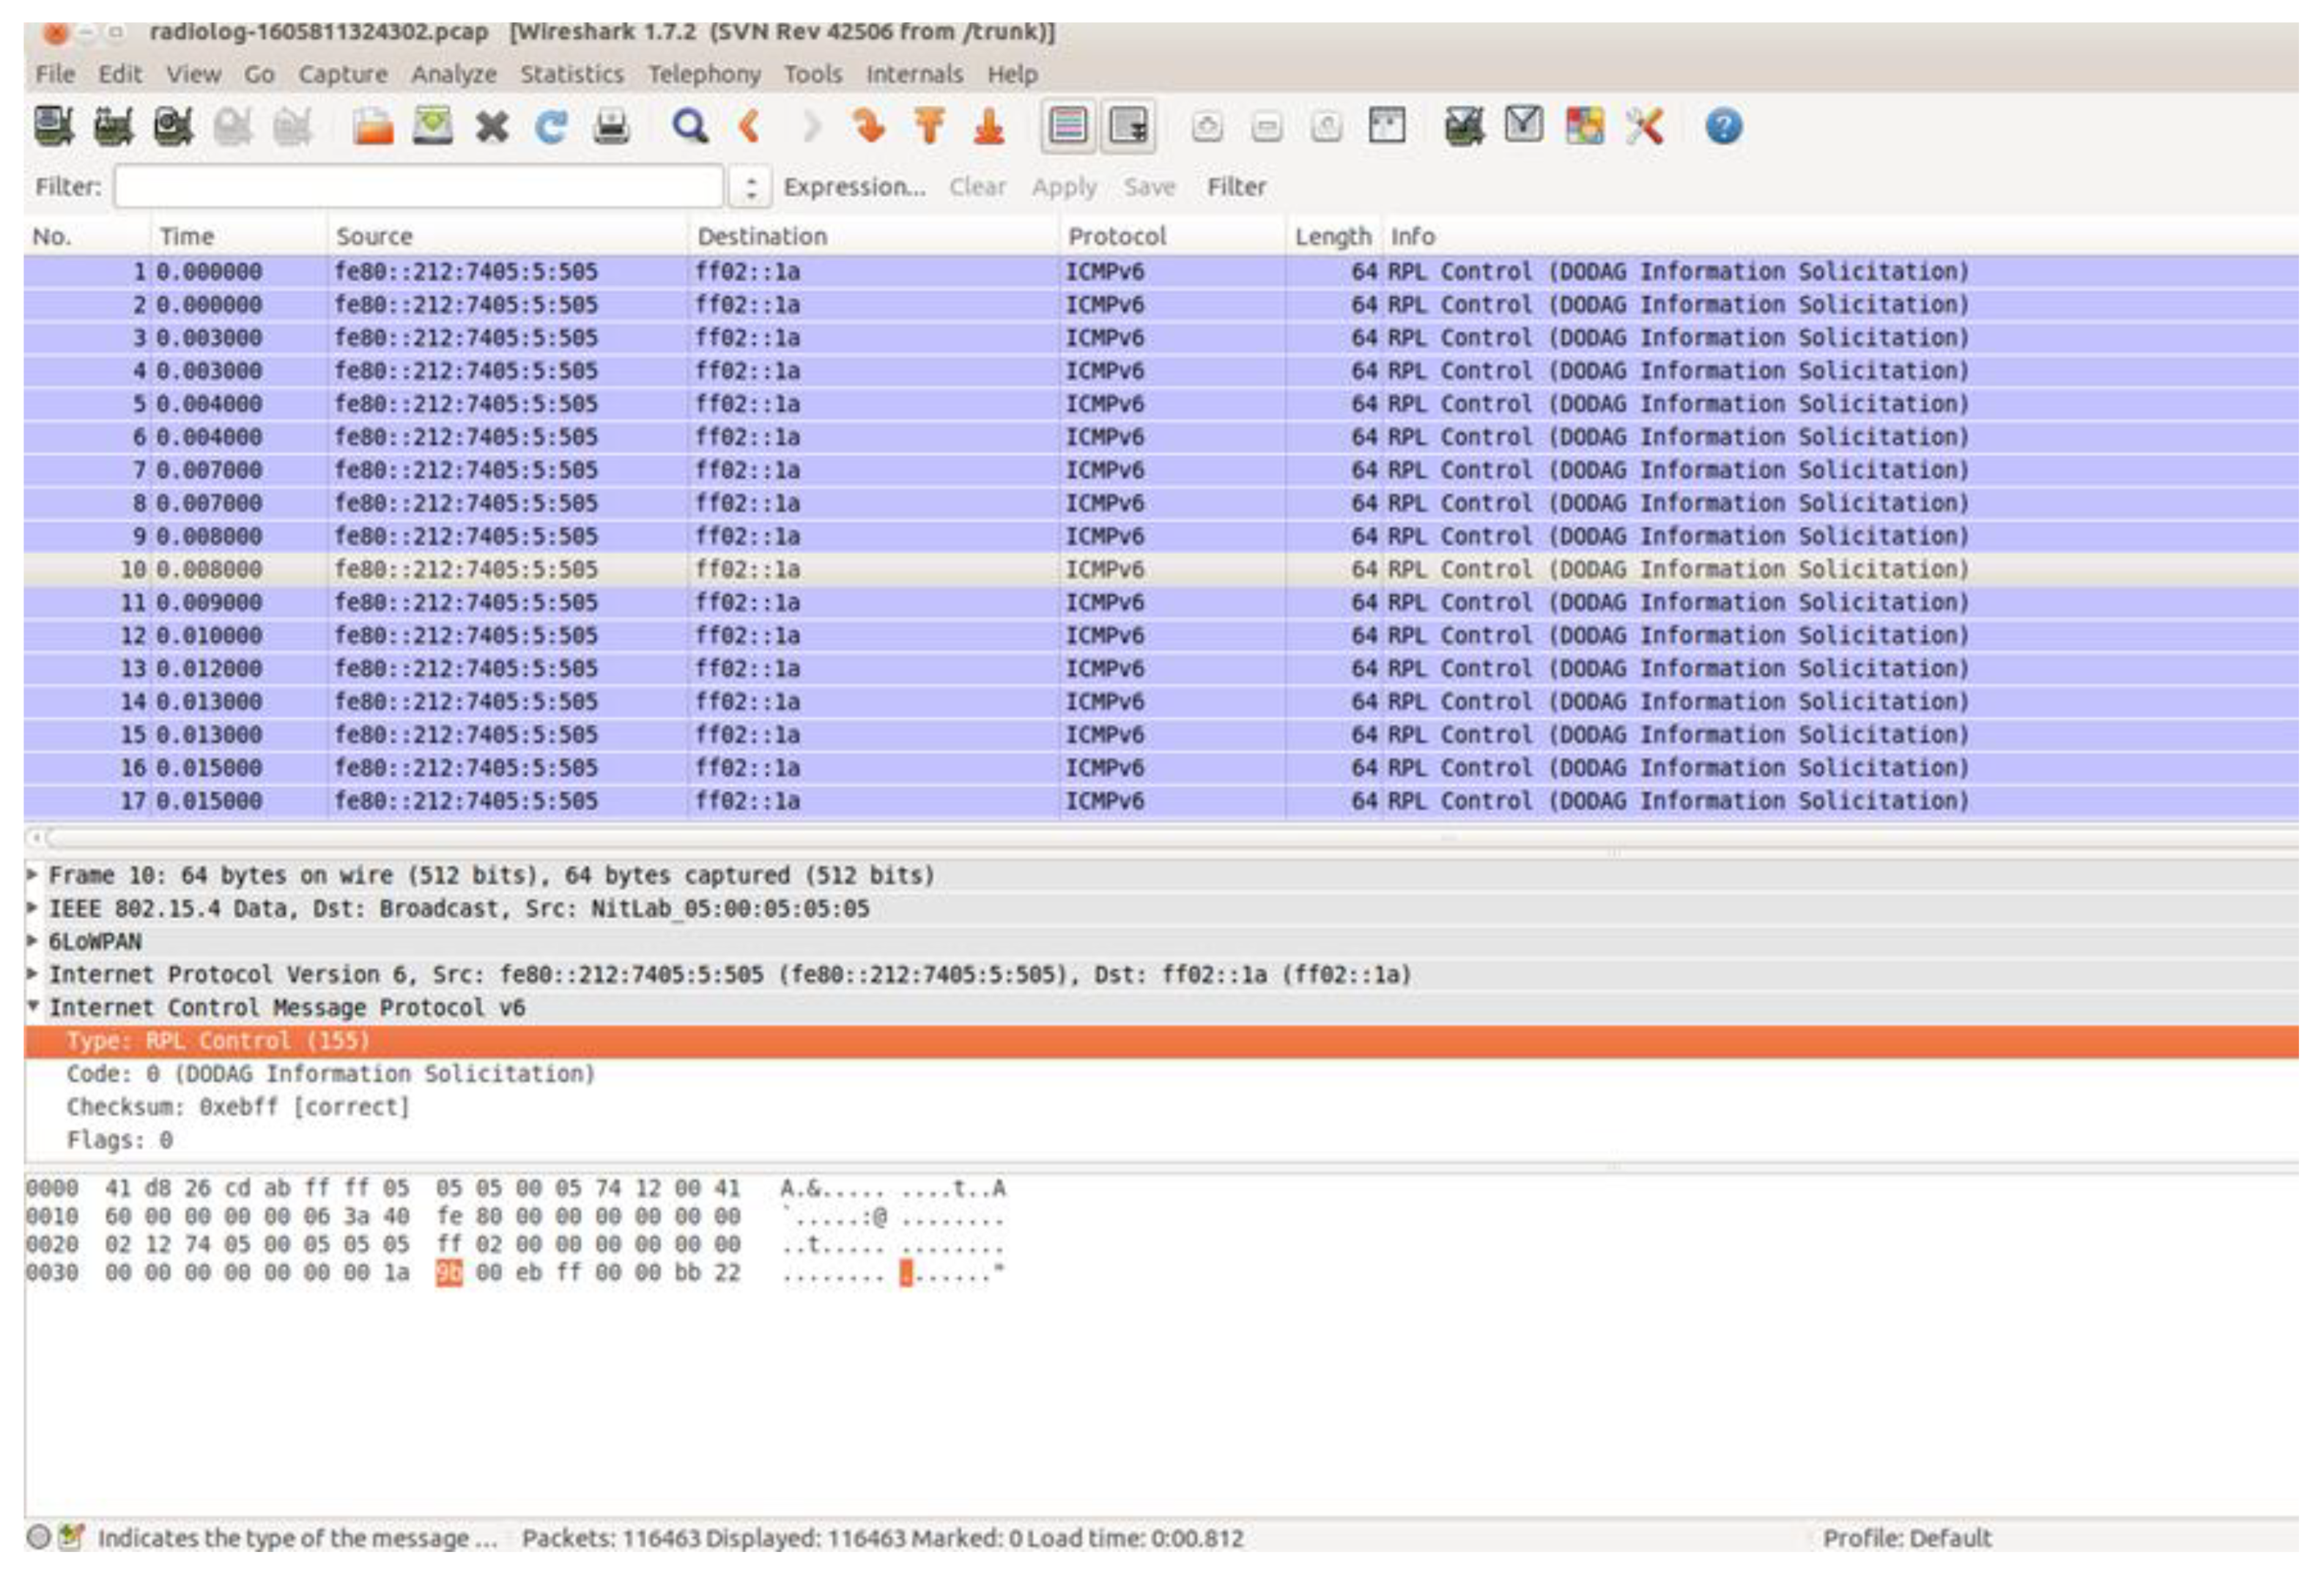
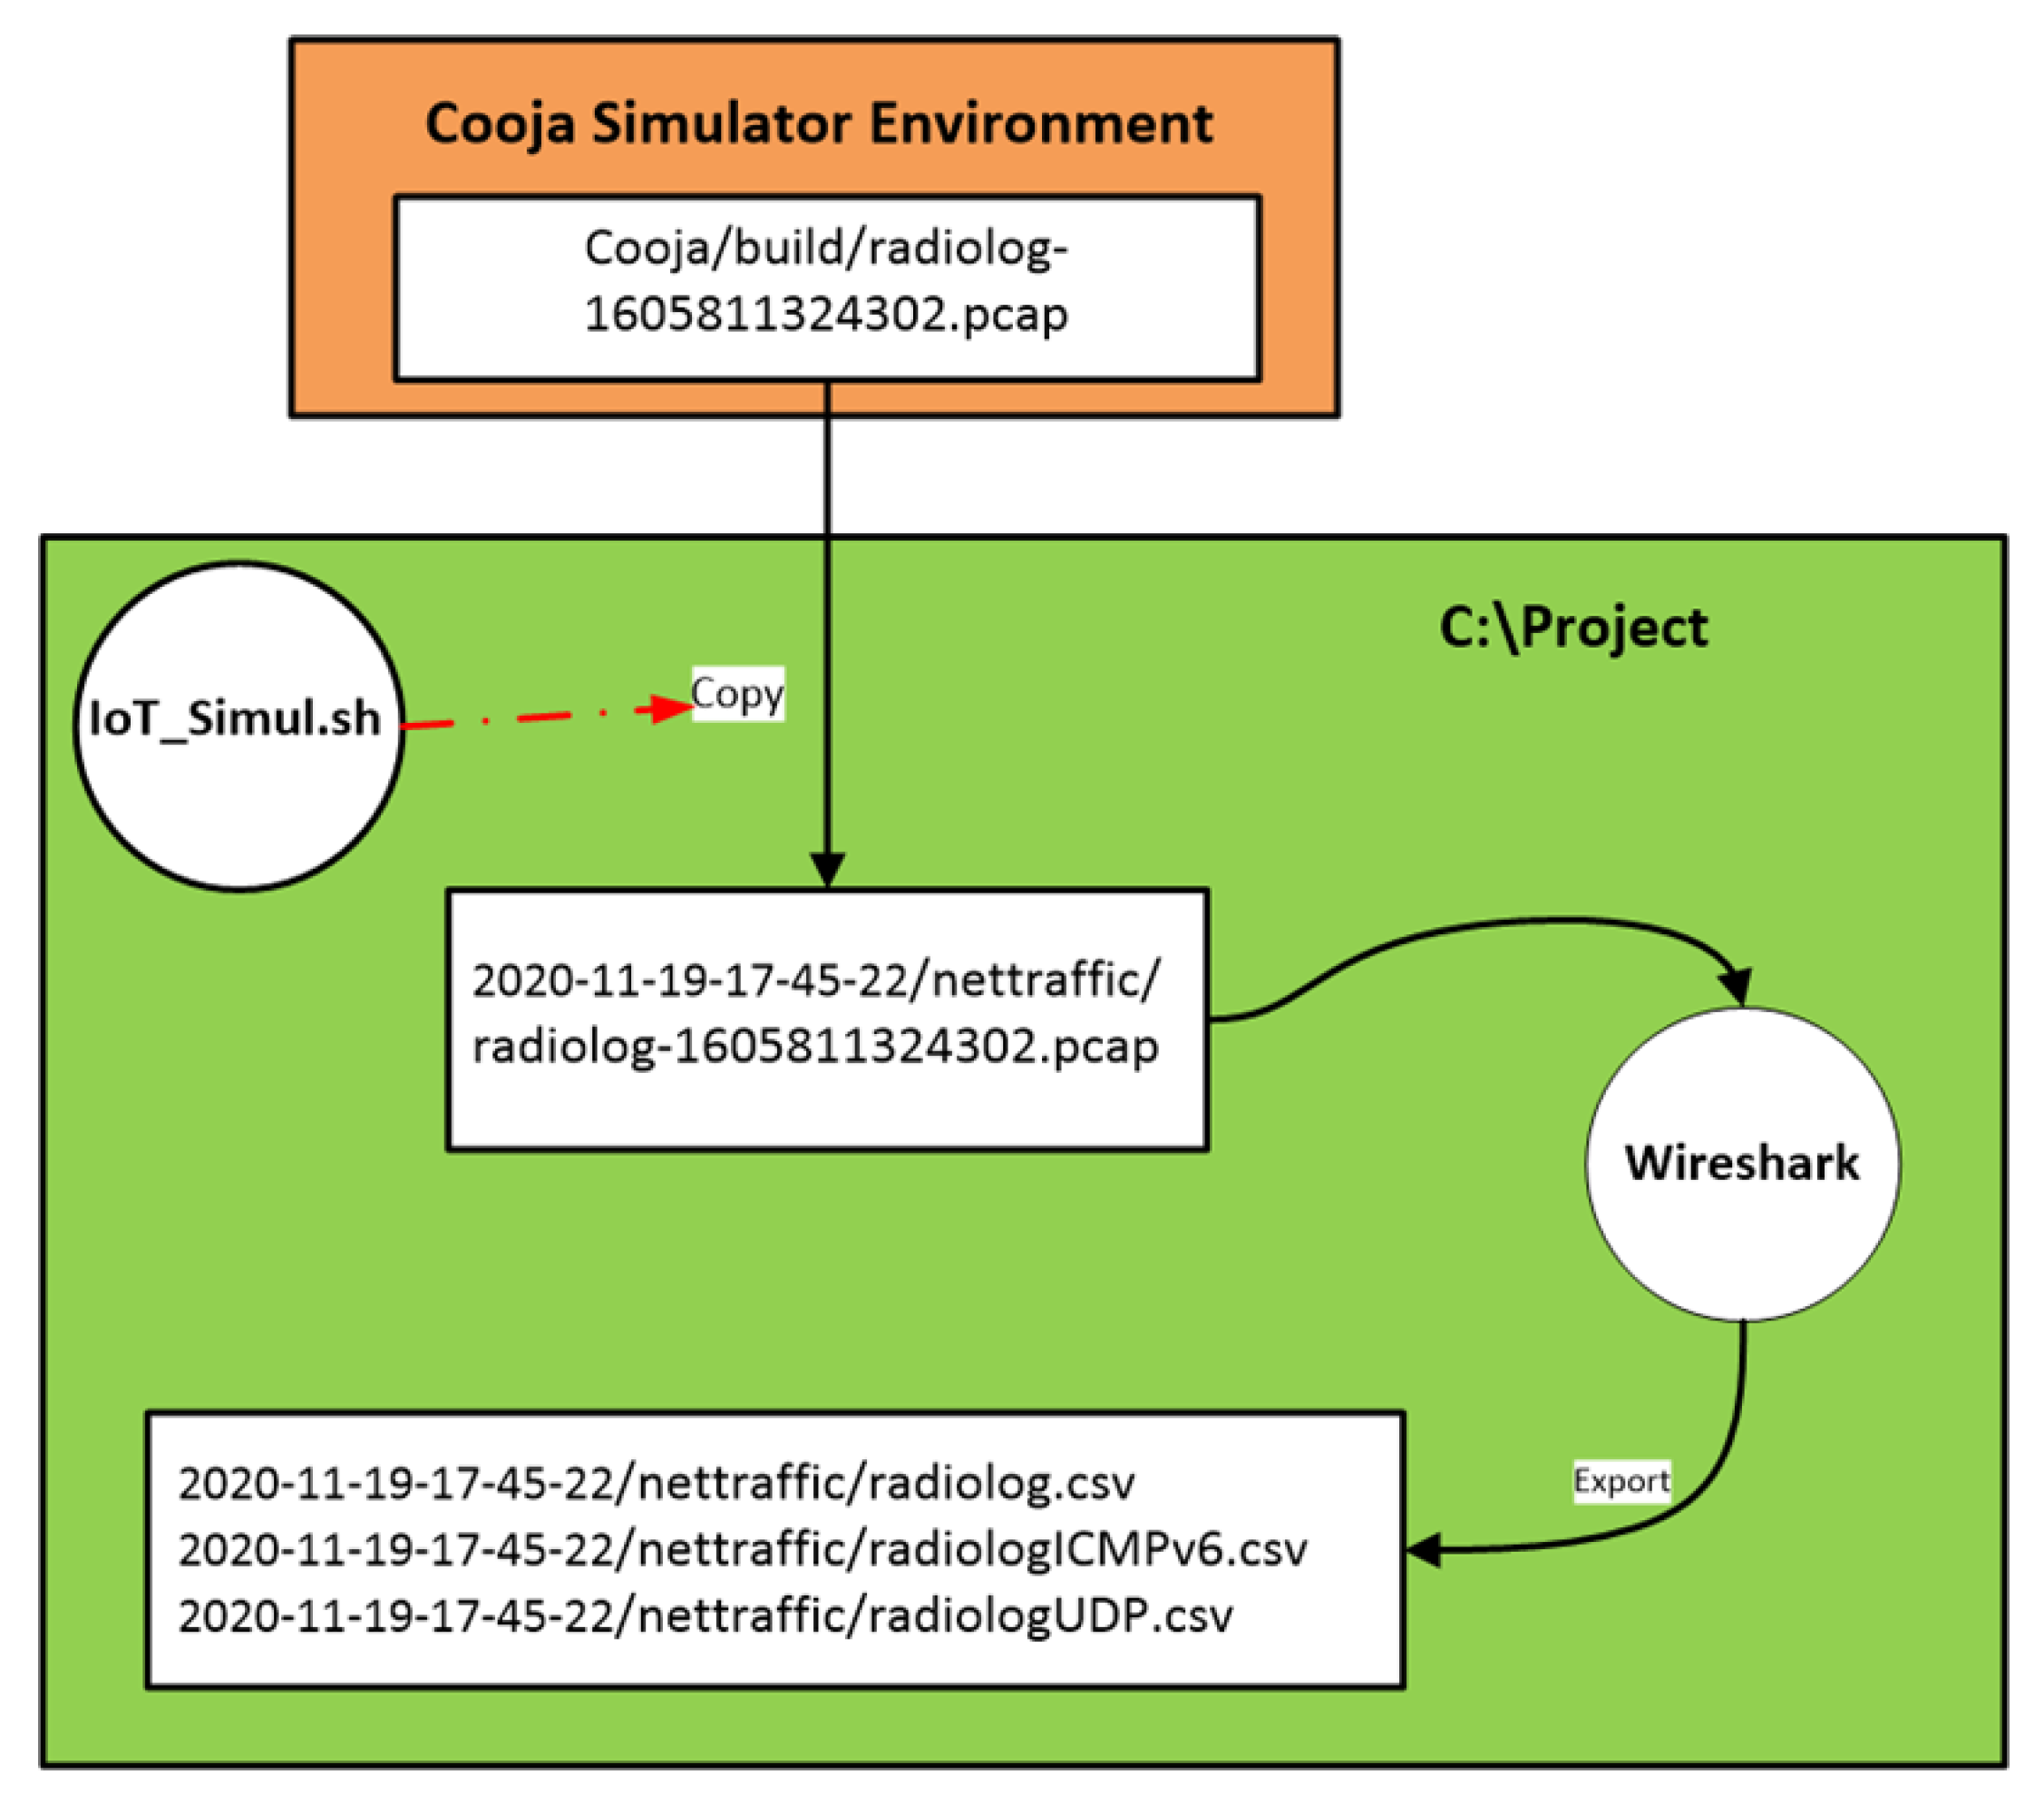
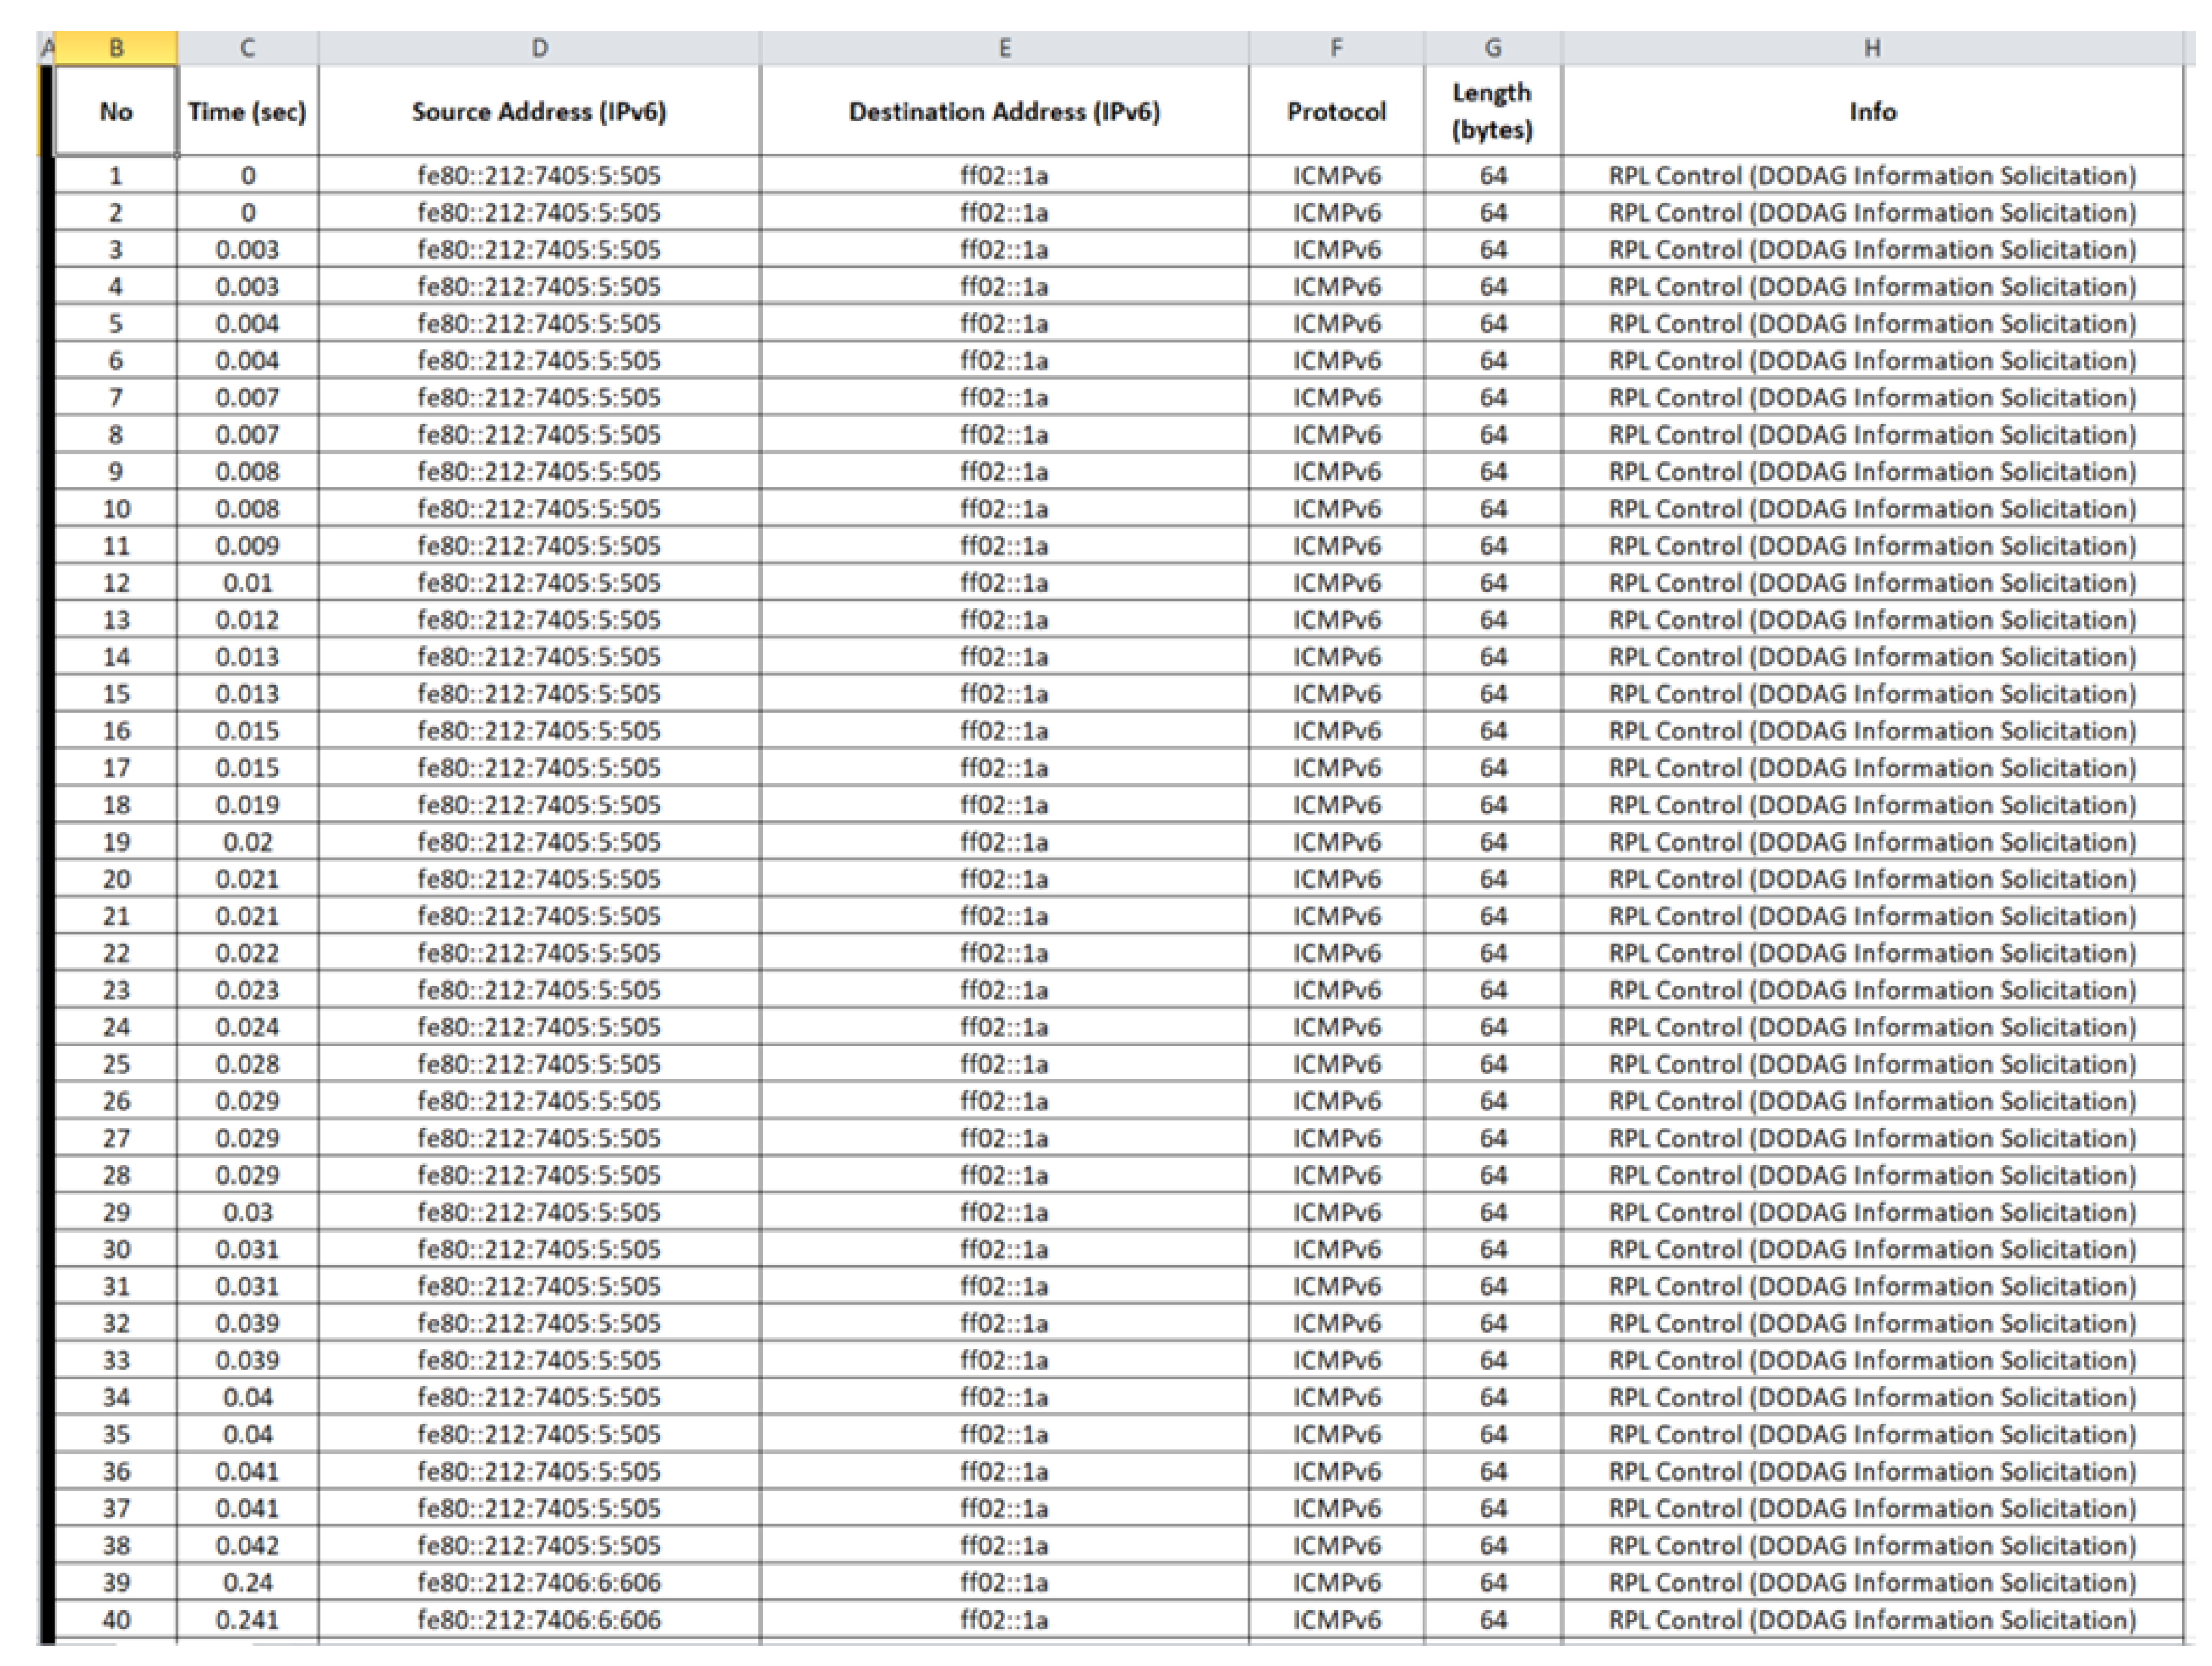
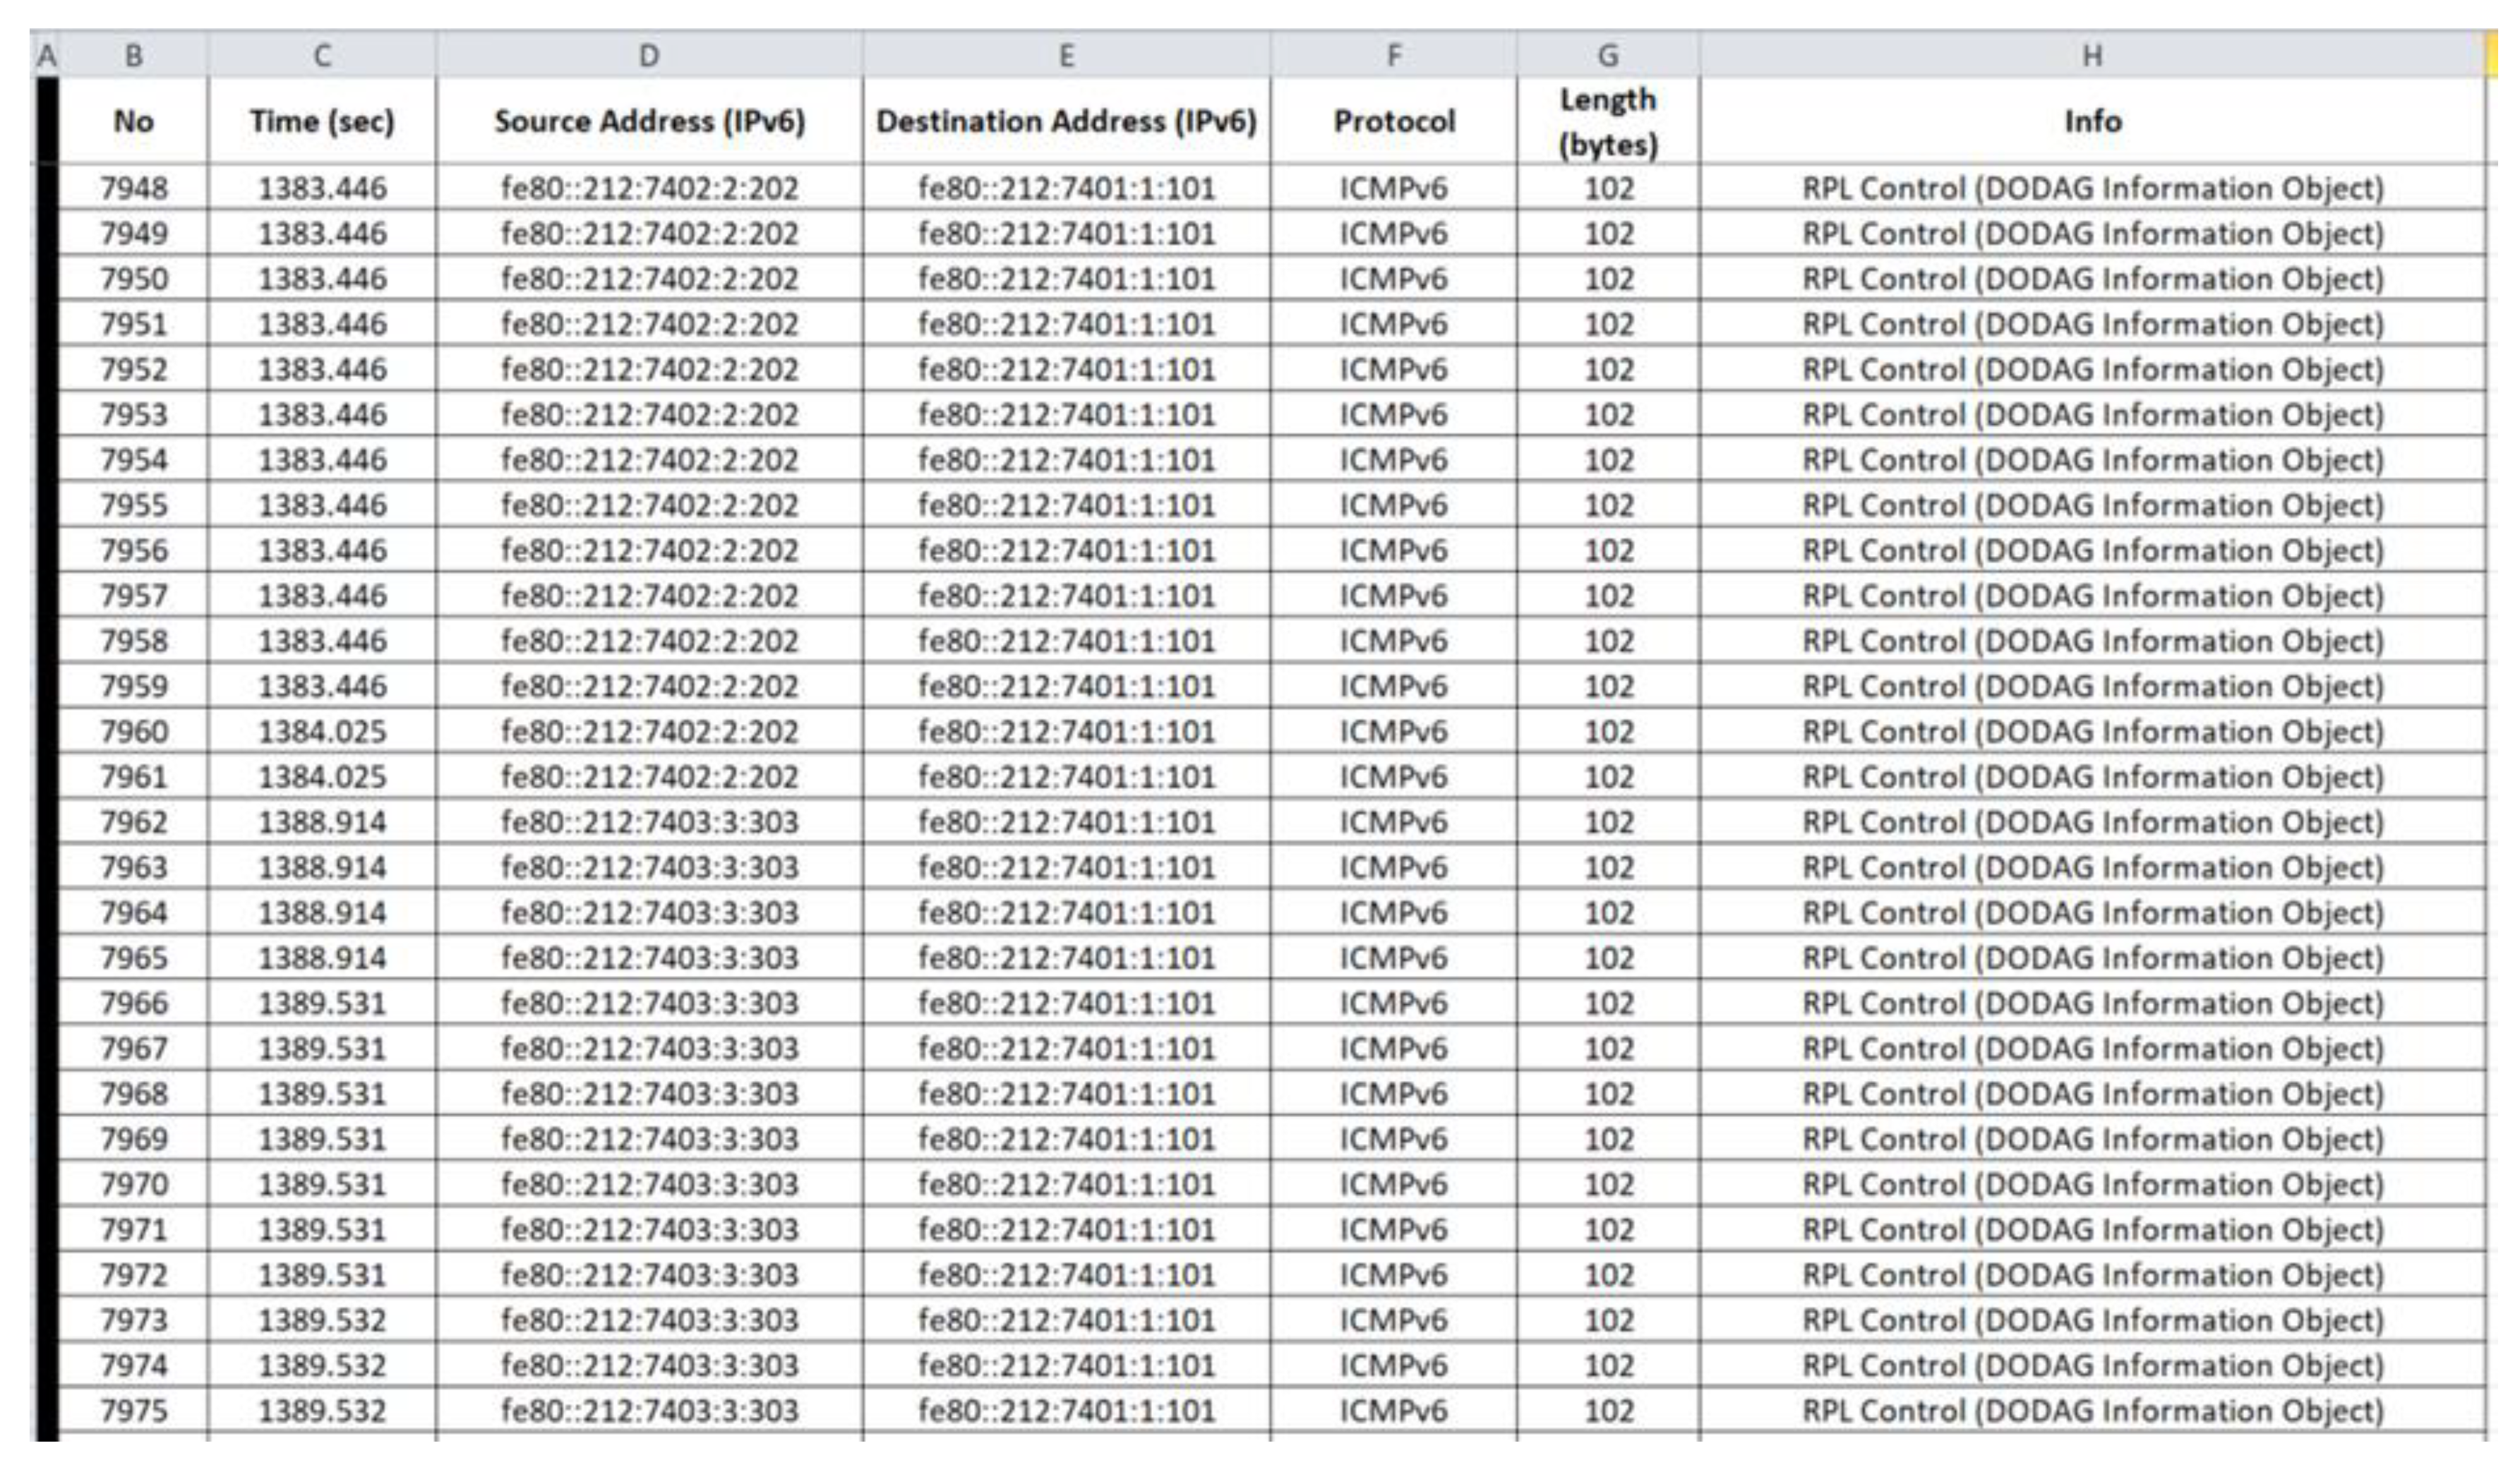
4.2. Benign Network Traffic Dataset Generation
4.2.1. Benign Network Traffic Dataset Generation
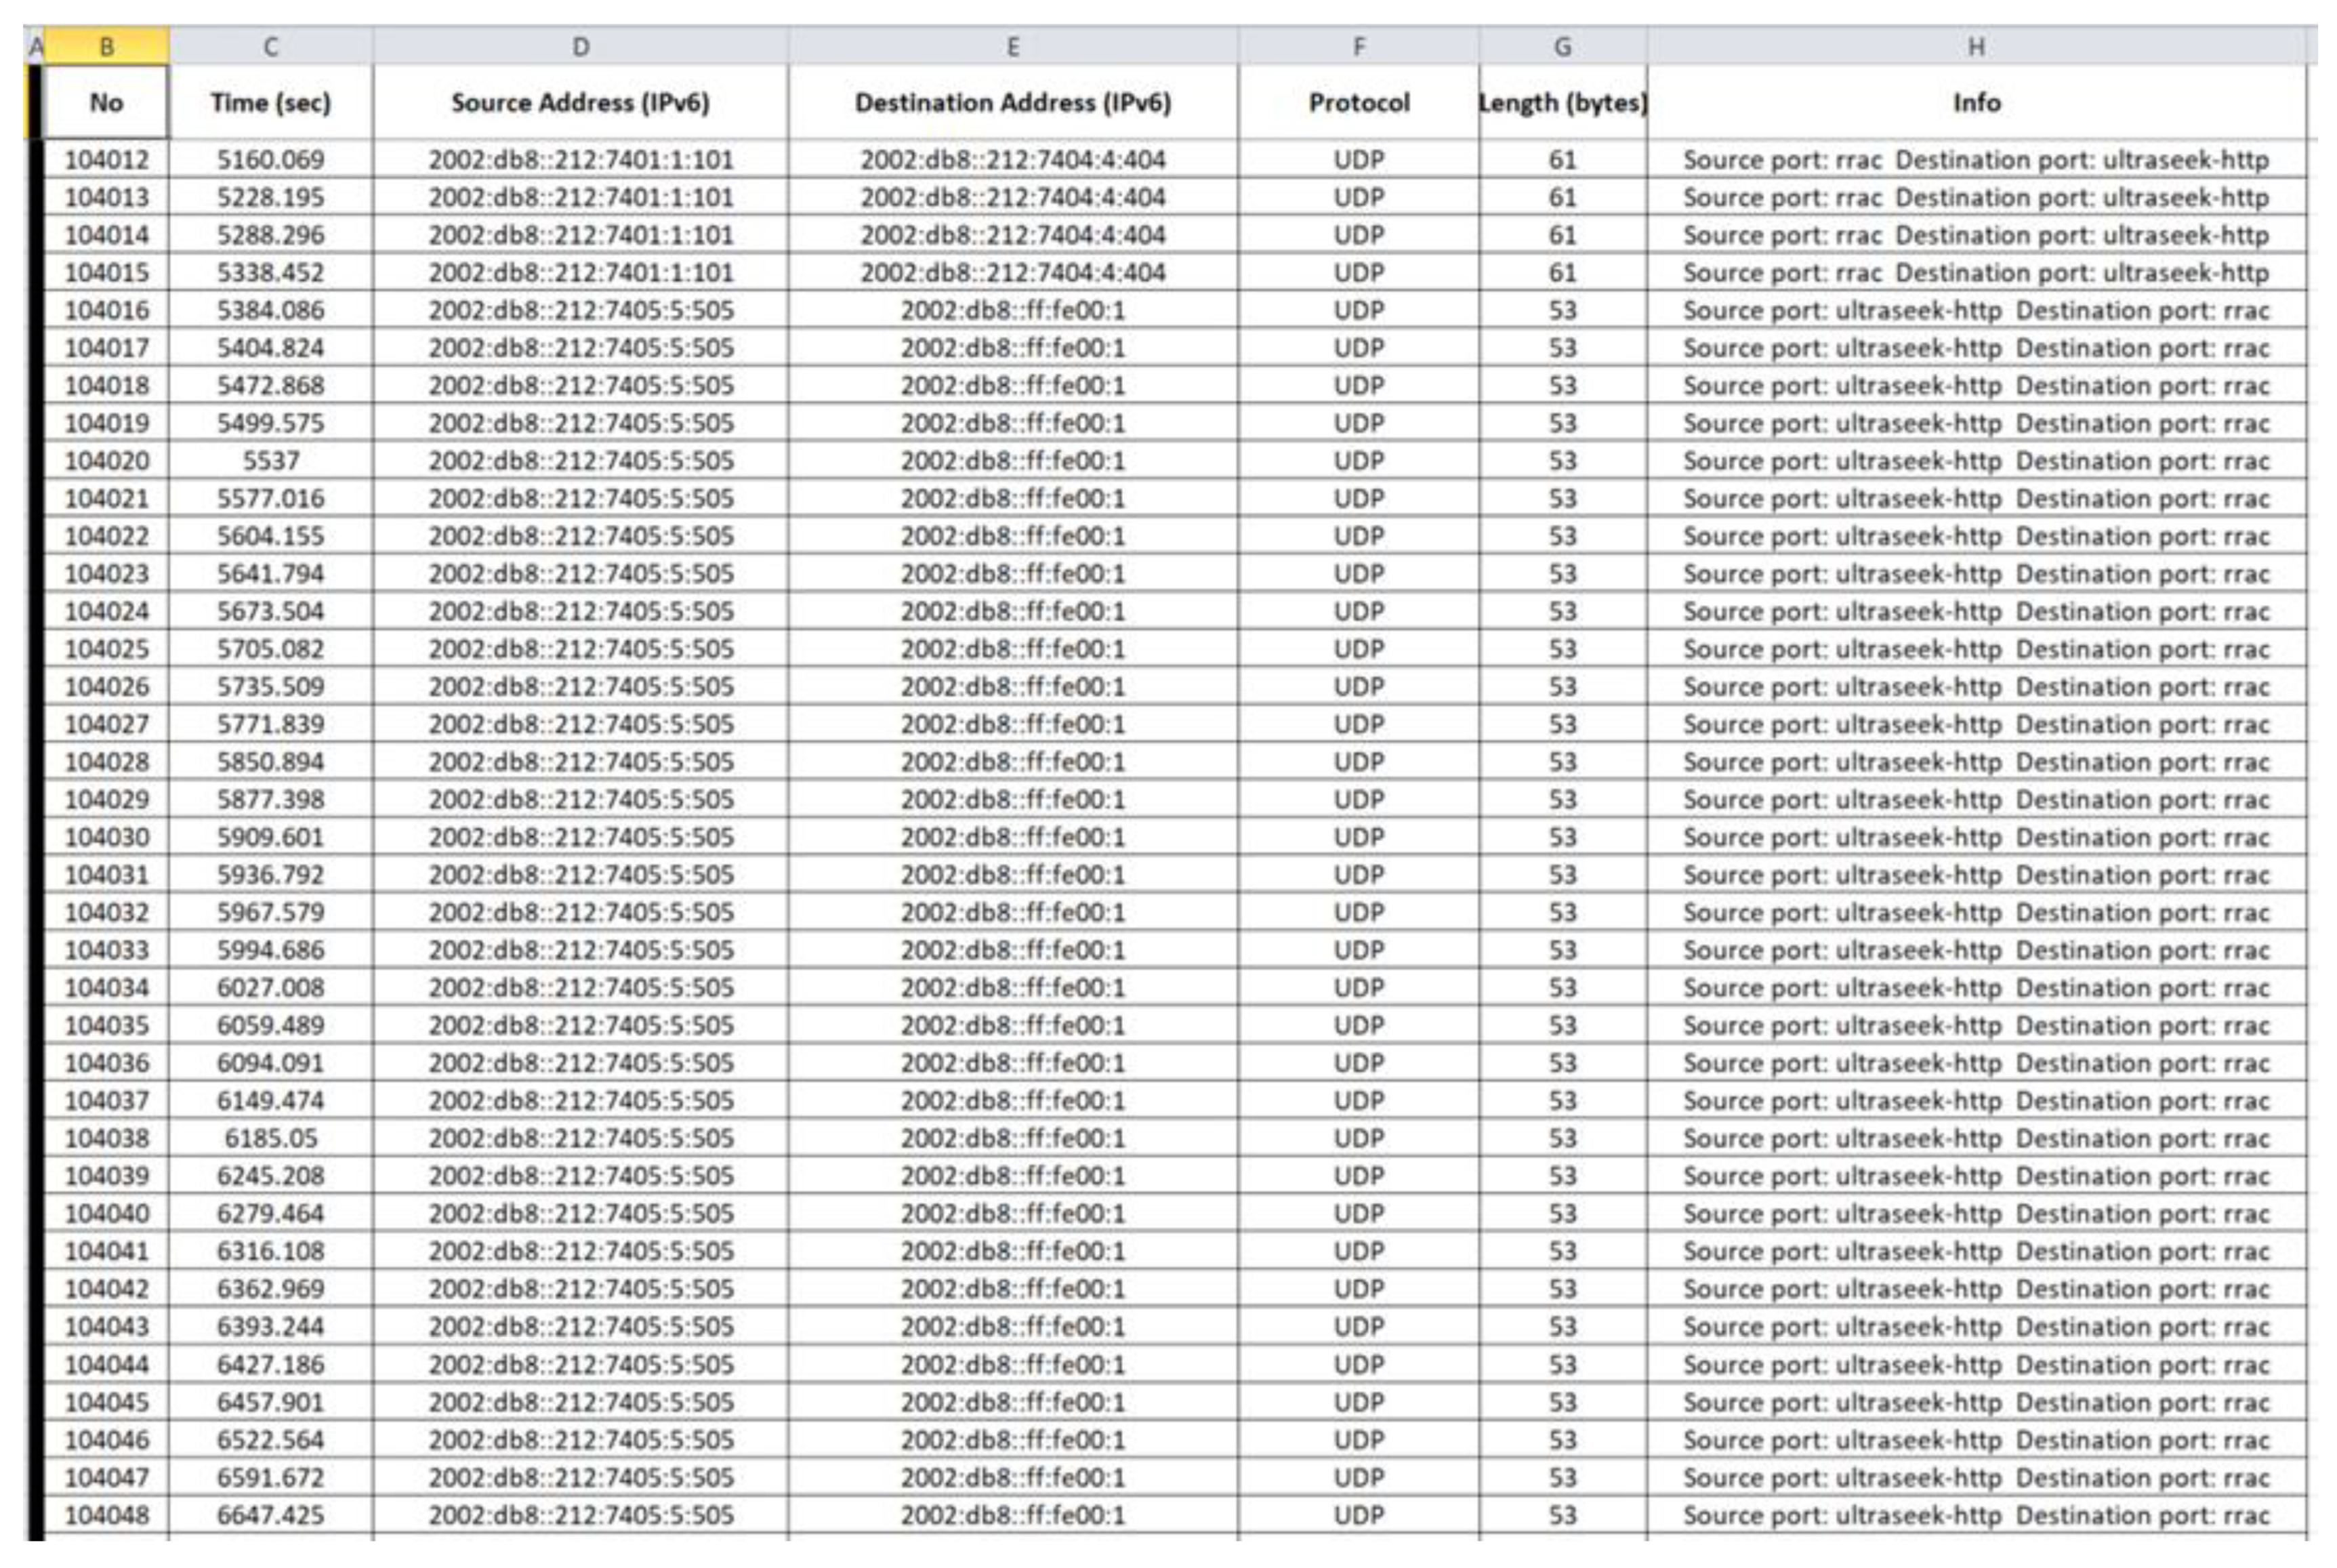
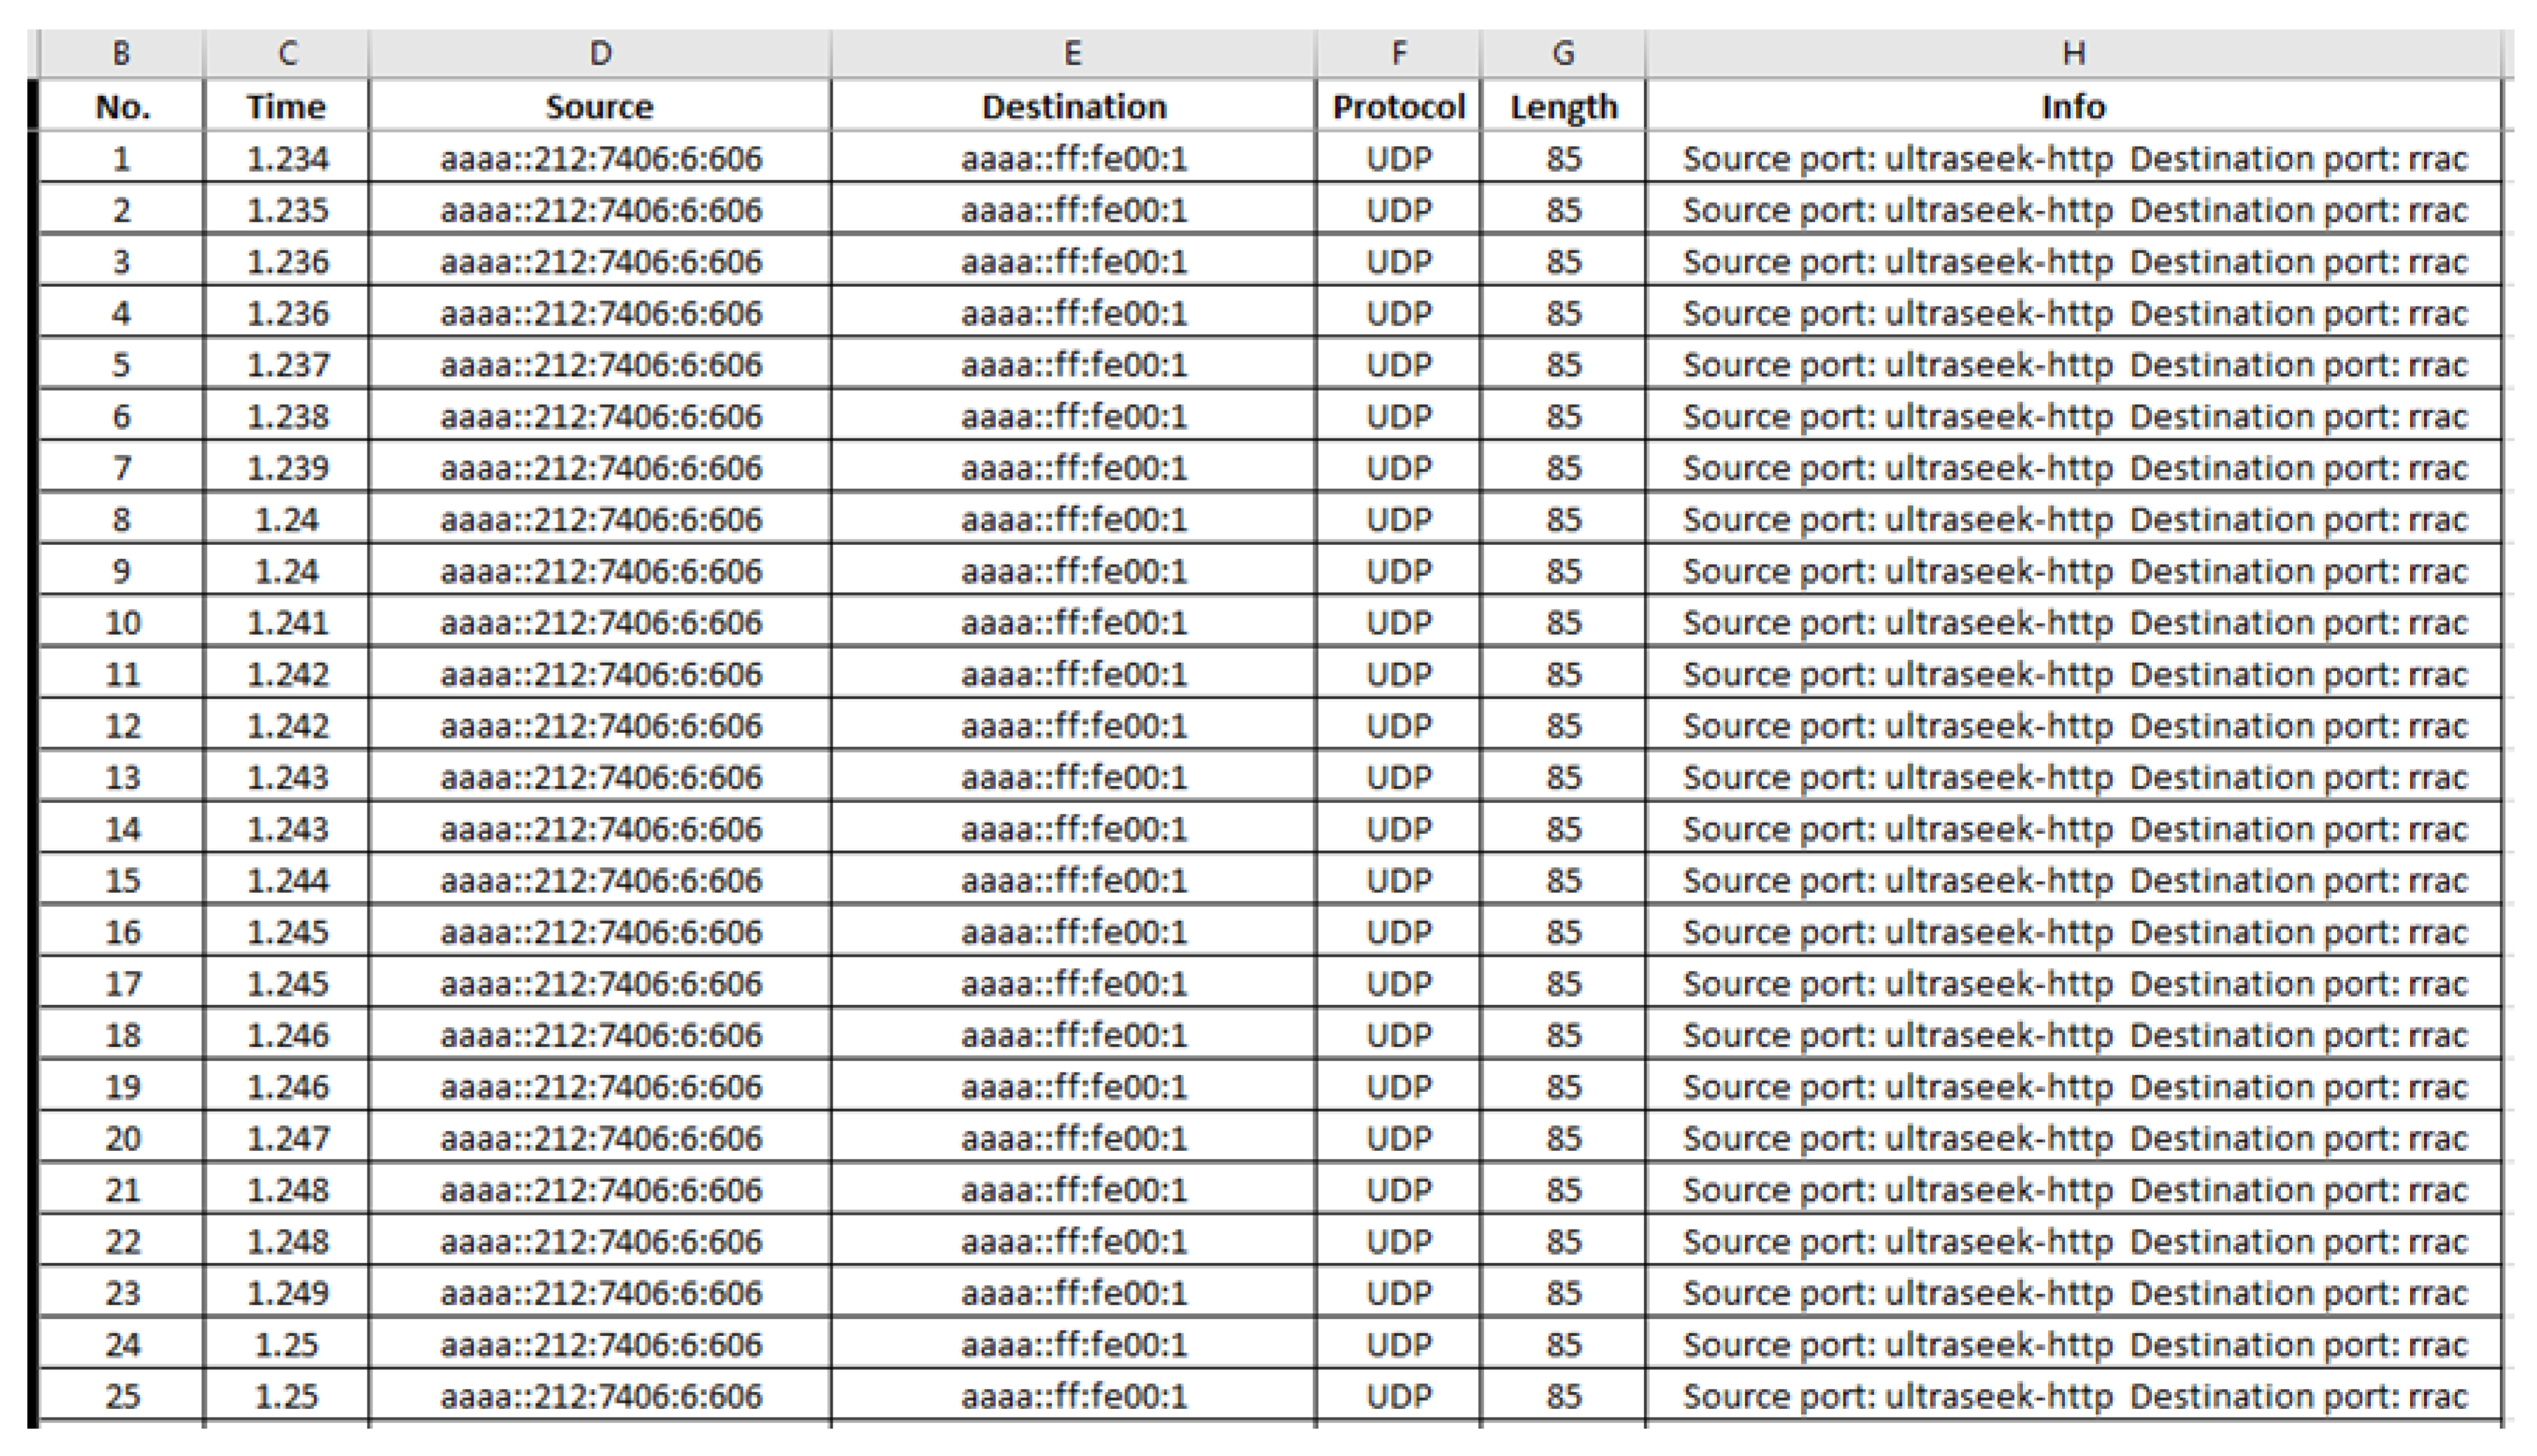
4.2.2. Benign Network Traffic Datasets—Results
5. Generation of Malicious IoT/IIoT Datasets
5.1. Malicious “Powertrace” Dataset Generation
5.1.1. Malicious “Powertrace” Dataset Generation
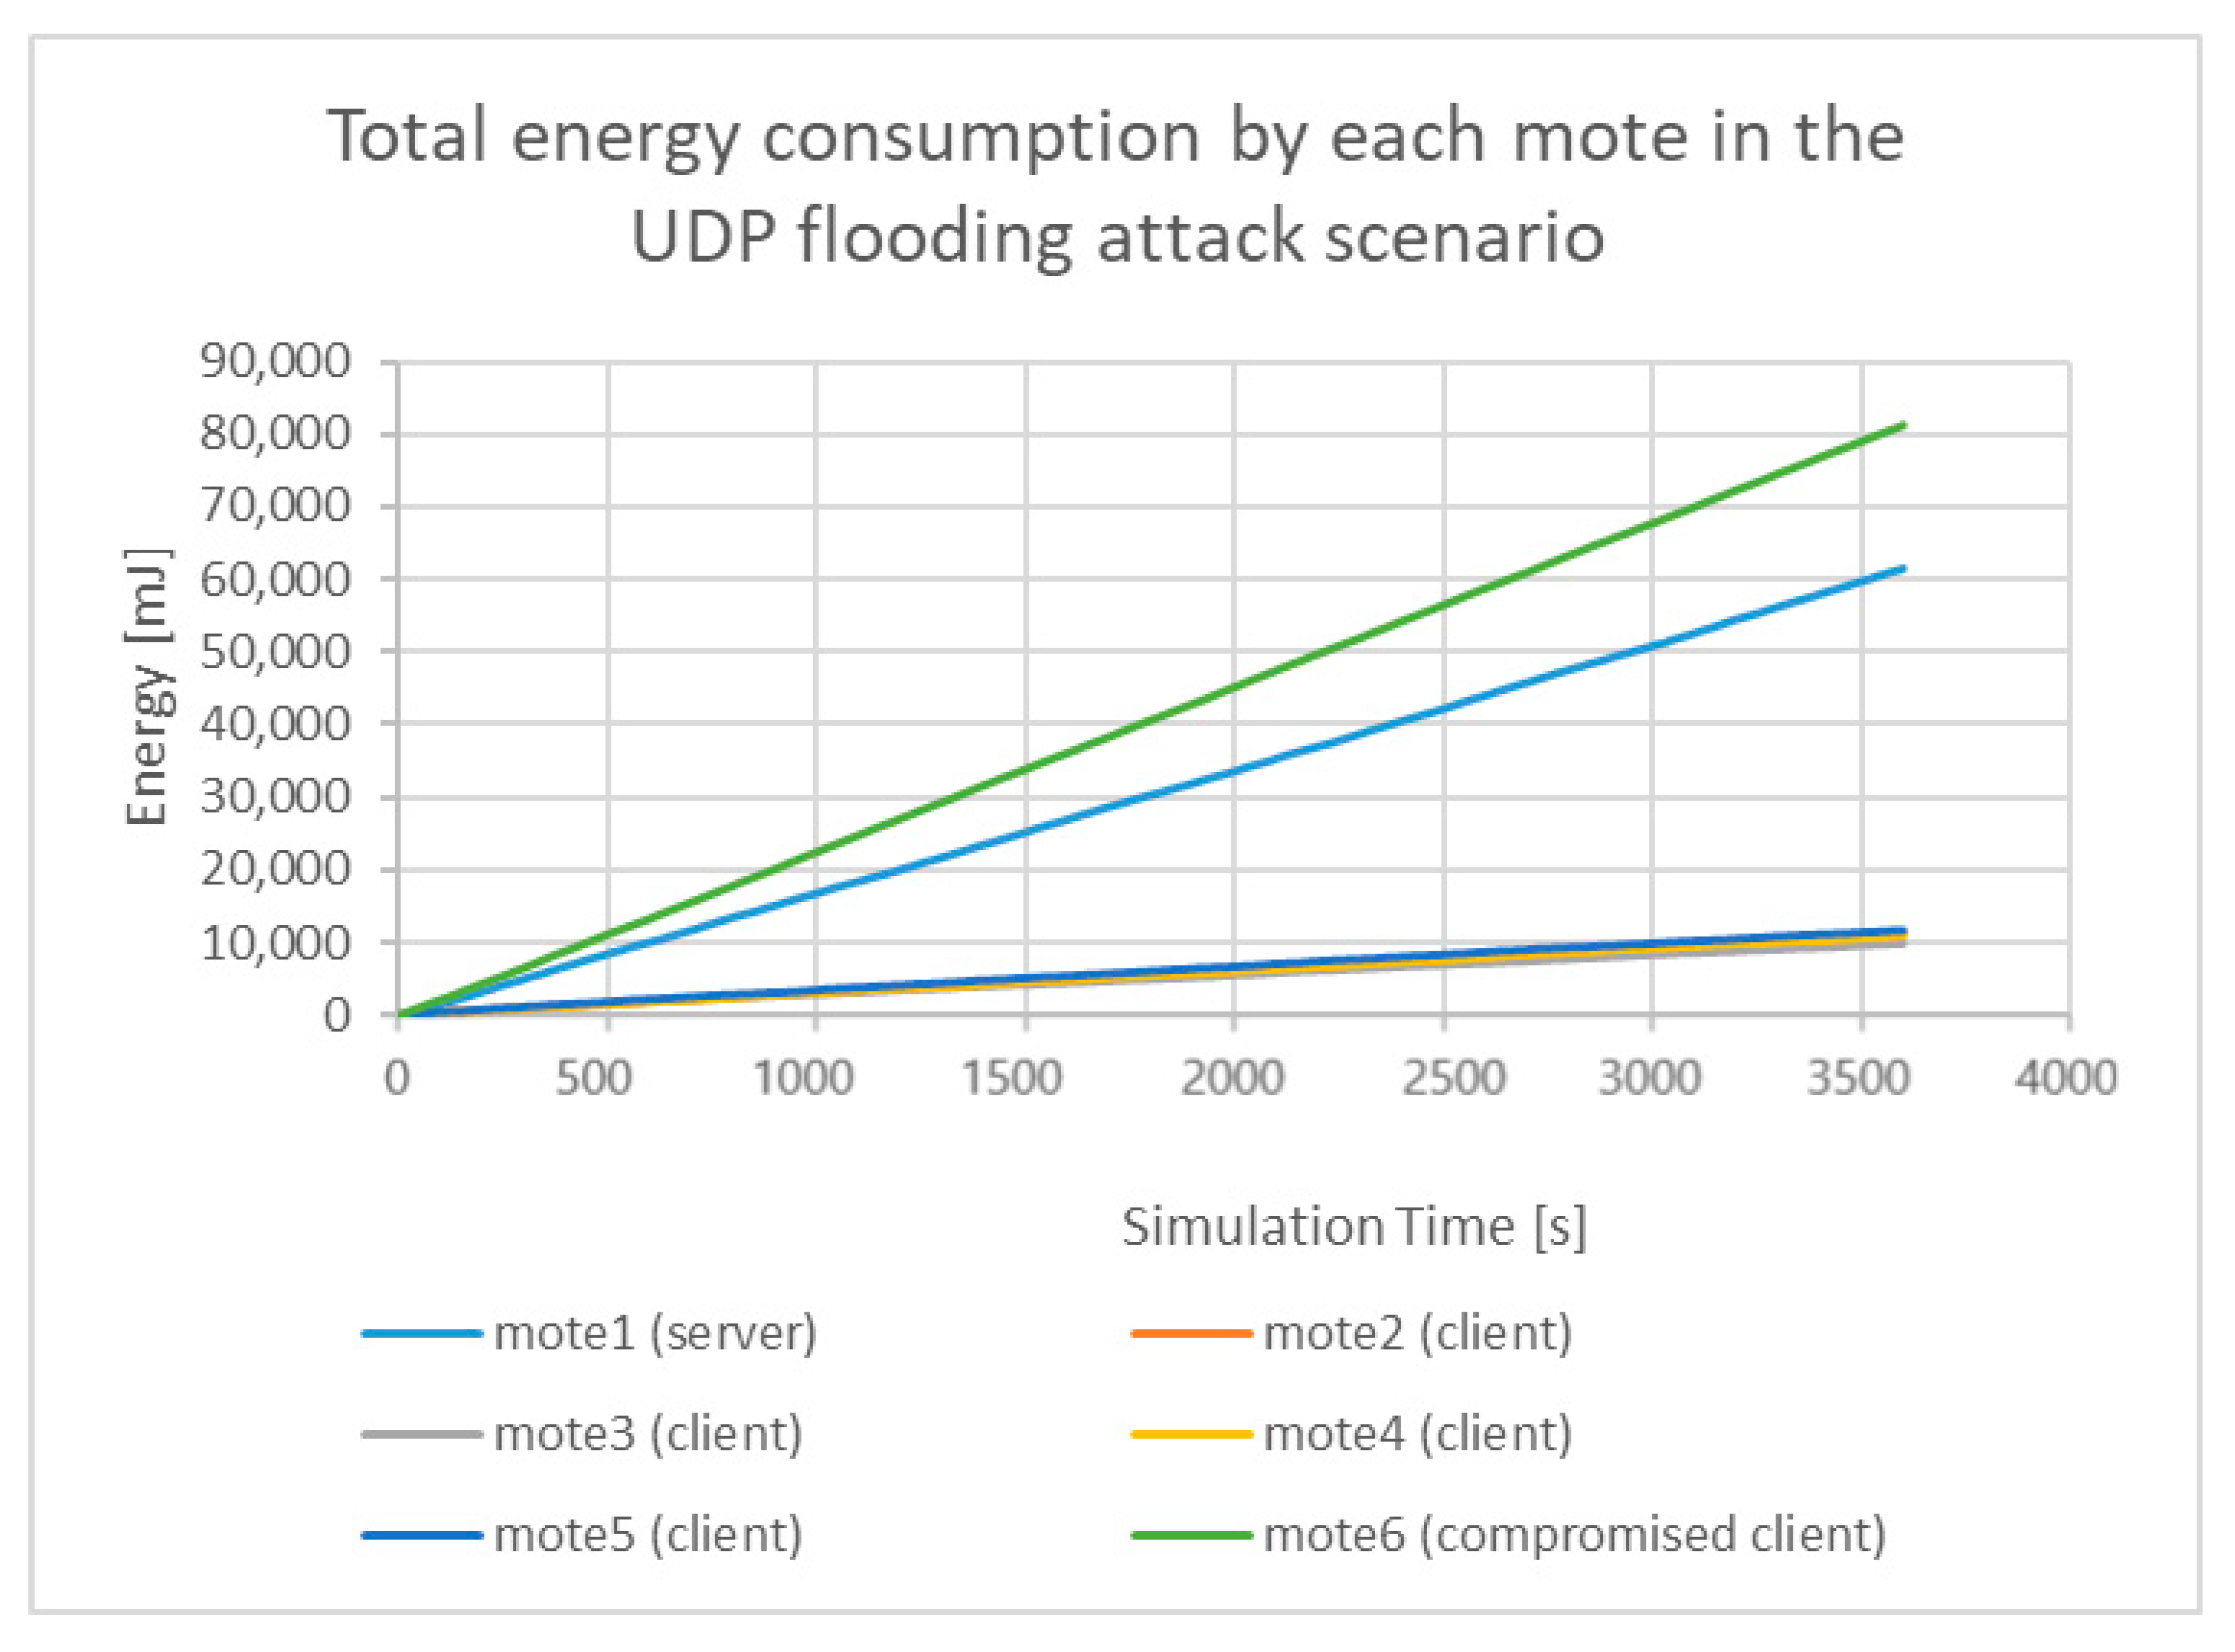
5.1.2. Malicious “powertrace” Datasets—Results
5.2. Malicious Network Traffic Dataset Generation
5.2.1. Malicious Network Traffic Dataset Generation
5.2.2. Malicious Network Traffic Datasets—Results
6. Discussion on the Generated Datasets
- Icpu: the nominal current in the CPU state;
- Ilpm: the nominal current in the LPM state;
- Itx: the nominal current in the TX state;
- Irx: the nominal current in the RX state;
- Vcpu: the nominal voltage in the CPU state;
- Vlpm: the nominal voltage in the LPM state;
- Vtx: the nominal voltage in the TX state;
- Vrx: the nominal voltage in the RX state;
7. Conclusions
Author Contributions
Funding
Institutional Review Board Statement
Informed Consent Statement
Acknowledgments
Conflicts of Interest
References
- Xu, L.D.; He, W.; Li, S. Internet of Things in Industries: A Survey. IEEE Trans. Ind. Informatics 2014, 10, 2233–2243. [Google Scholar] [CrossRef]
- Zarpelão, B.B.; Miani, R.S.; Kawakani, C.T.; de Alvarenga, S.C. A survey of intrusion detection in Internet of Things. J. Netw. Comput. Appl. 2017, 84, 25–37. [Google Scholar] [CrossRef]
- Sisinni, E.; Saifullah, A.; Han, S.; Jennehag, U.; Gidlund, M. Industrial Internet of Things: Challenges, Opportunities, and Directions. IEEE Trans. Ind. Informatics 2018, 14, 4724–4734. [Google Scholar] [CrossRef]
- Alsaedi, A.; Moustafa, N.; Tari, Z.; Mahmood, A.; Anwar, A. TON_IoT Telemetry Dataset: A New Generation Dataset of IoT and IIoT for Data-Driven Intrusion Detection Systems. IEEE Access 2020, 8, 165130–165150. [Google Scholar] [CrossRef]
- Chaabouni, N.; Mosbah, M.; Zemmari, A.; Sauvignac, C.; Faruki, P. Network Intrusion Detection for IoT Security Based on Learning Techniques. IEEE Commun. Surv. Tutorials 2019, 21, 2671–2701. [Google Scholar] [CrossRef]
- KDD Cup 1999 Data. Available online: http://kdd.ics.uci.edu/databases/kddcup99/kddcup99.html (accessed on 19 September 2020).
- Tavallaee, M.; Bagheri, E.; Lu, W.; Ghorbani, A.A. A detailed analysis of the KDD CUP 99 data set. In Proceedings of the IEEE Symposium on Computational Intelligence for Security and Defense Applications, CISDA 2009, Ottawa, ON, Canada, 8–10 July 2009; pp. 1–6. [Google Scholar]
- Moustafa, N.; Slay, J. UNSW-NB15: A comprehensive data set for network intrusion detection systems (UNSW-NB15 network data set). In Proceedings of the 2015 Military Communications and Information Systems Conference, MilCIS 2015, Canberra, ACT, Australia, 10–12 November 2015; pp. 1–6. [Google Scholar]
- Sharafaldin, I.; Lashkari, A.H.; Ghorbani, A.A. Toward Generating a New Intrusion Detection Dataset and Intrusion Traffic Characterization. In Proceedings of the ICISSP2018, Funchal, Madeira, Portugal, 22–24 January 2018; pp. 108–116. [Google Scholar]
- Suthaharan, S.; Alzahrani, M.; Rajasegarar, S.; Leckie, C.; Palaniswami, M. Labelled data collection for anomaly detection in wireless sensor networks. In Proceedings of the 2010 6th International Conference on Intelligent Sensors, Sensor Networks and Information Processing, ISSNIP 2010, Brisbane, QLD, Australia, 7–10 December 2010; pp. 269–274. [Google Scholar]
- Sivanathan, A.; Gharakheili, H.H.; Loi, F.; Radford, A.; Wijenayake, C.; Vishwanath, A.; Sivaraman, V. Classifying IoT Devices in Smart Environments Using Network Traffic Characteristics. IEEE Trans. Mob. Comput. 2019, 18, 1745–1759. [Google Scholar] [CrossRef]
- Koroniotis, N.; Moustafa, N.; Sitnikova, E.; Turnbull, B. Towards the development of realistic botnet dataset in the Internet of Things for network forensic analytics: Bot-IoT dataset. Futur. Gener. Comput. Syst. 2019, 100, 779–796. [Google Scholar] [CrossRef]
- Hamza, A.; Gharakheili, H.H.; Benson, T.A.; Sivaraman, V. Detecting Volumetric Attacks on IoT Devices via SDN-Based Monitoring of MUD Activity. In Proceedings of the SOSR 2019—Proceedings of the 2019 ACM Symposium on SDN Research, San Jose, CA, USA, 3–4 April 2019; Association for Computing Machinery, Inc: New York, NY, USA, 2019; pp. 36–48. [Google Scholar]
- Österlind, F.; Dunkels, A.; Eriksson, J.; Finne, N.; Voigt, T. Cross-level sensor network simulation with COOJA. In Proceedings of the Proceedings—Conference on Local Computer Networks, LCN, Tampa, FL, USA, 14–16 November 2006; pp. 641–648. [Google Scholar]
- ITU-T. Recommendation ITU-T Y.2060 “Overview of the Internet of Things”. 2012. Available online: https://www.itu.int/ITU-T/recommendations/rec.aspx?rec=y.2060 (accessed on 15 December 2020).
- Qi, Q.; Tao, F. A Smart Manufacturing Service System Based on Edge Computing, Fog Computing, and Cloud Computing. IEEE Access 2019, 7, 86769–86777. [Google Scholar] [CrossRef]
- Lin, J.; Yu, W.; Zhang, N.; Yang, X.; Zhang, H.; Zhao, W. A Survey on Internet of Things: Architecture, Enabling Technologies, Security and Privacy, and Applications. IEEE Internet Things J. 2017, 4, 1125–1142. [Google Scholar] [CrossRef]
- Ferrag, M.A.; Maglaras, L.; Argyriou, A.; Kosmanos, D.; Janicke, H. Security for 4G and 5G cellular networks: A survey of existing authentication and privacy-preserving schemes. J. Netw. Comput. Appl. 2018, 101, 55–82. [Google Scholar] [CrossRef]
- Makhdoom, I.; Abolhasan, M.; Lipman, J.; Liu, R.P.; Ni, W. Anatomy of Threats to the Internet of Things. IEEE Commun. Surv. Tutorials 2019, 21, 1636–1675. [Google Scholar] [CrossRef]
- Hassija, V.; Chamola, V.; Saxena, V.; Jain, D.; Goyal, P.; Sikdar, B. A Survey on IoT Security: Application Areas, Security Threats, and Solution Architectures. IEEE Access 2019, 7, 82721–82743. [Google Scholar] [CrossRef]
- Newsome, J.; Shi, E.; Song, D.; Perrig, A. The Sybil attack in sensor networks: Analysis & defenses - IEEE Conference Publication. In Proceedings of the Third International Symposium on Information Processing in Sensor Networks, Berkeley, CA, USA, 27 April 2004. [Google Scholar]
- El-hajj, M.; Fadlallah, A.; Chamoun, M.; Serhrouchni, A. A Survey of Internet of Things (IoT) Authentication Schemes. Sensors 2019, 19, 1141. [Google Scholar] [CrossRef] [PubMed]
- Frustaci, M.; Pace, P.; Aloi, G.; Fortino, G. Evaluating critical security issues of the IoT world: Present and future challenges. IEEE Internet Things J. 2018, 5, 2483–2495. [Google Scholar] [CrossRef]
- Moustafa, N.; Turnbull, B.; Choo, K.K.R. An ensemble intrusion detection technique based on proposed statistical flow features for protecting network traffic of internet of things. IEEE Internet Things J. 2019, 6, 4815–4830. [Google Scholar] [CrossRef]
- Clarence, C.; David, F. Machine Learning and Security [Book]; O’Reilly Media, Inc.: Newton, MA, USA, 2018. [Google Scholar]
- Hodo, E.; Bellekens, X.; Hamilton, A.; Dubouilh, P.L.; Iorkyase, E.; Tachtatzis, C.; Atkinson, R. Threat analysis of IoT networks using artificial neural network intrusion detection system. In Proceedings of the 2016 International Symposium on Networks, Computers and Communications, ISNCC 2016, Yasmine Hammamet, Tunisia, 11–13 May 2016. [Google Scholar]
- Moteiv Corporation Tmote Sky—Ultra Low Power IEEE 802.15.4 Compliant Wireless Sensor Module. 2006. Available online: http://www.crew-project.eu/sites/default/files/tmote-sky-datasheet.pdf (accessed on 5 December 2020).
- Wireshark Go Deep. Available online: https://www.wireshark.org/ (accessed on 28 November 2020).
- Amirinasab Nasab, M.; Shamshirband, S.; Chronopoulos, A.; Mosavi, A.; Nabipour, N. Energy-Efficient Method for Wireless Sensor Networks Low-Power Radio Operation in Internet of Things. Electronics 2020, 9, 320. [Google Scholar] [CrossRef]
- Bandekar, A.; Javaid, A.Y. Cyber-attack Mitigation and Impact Analysis for Low-power IoT Devices. In Proceedings of the 2017 IEEE 7th Annual International Conference on CYBER Technology in Automation, Control, and Intelligent Systems, CYBER 2017, Honolulu, HI, USA, 31 July–4 August 2018; pp. 1631–1636. [Google Scholar]
- Amir Alavi, S.; Rahimian, A.; Mehran, K.; Alaleddin Mehr Ardestani, J. An IoT-Based Data Collection Platform for Situational Awareness-Centric Microgrids. In Proceedings of the Canadian Conference on Electrical and Computer Engineering, Quebec City, QC, Canada, 13–16 May 2018; Volume 2018. [Google Scholar]


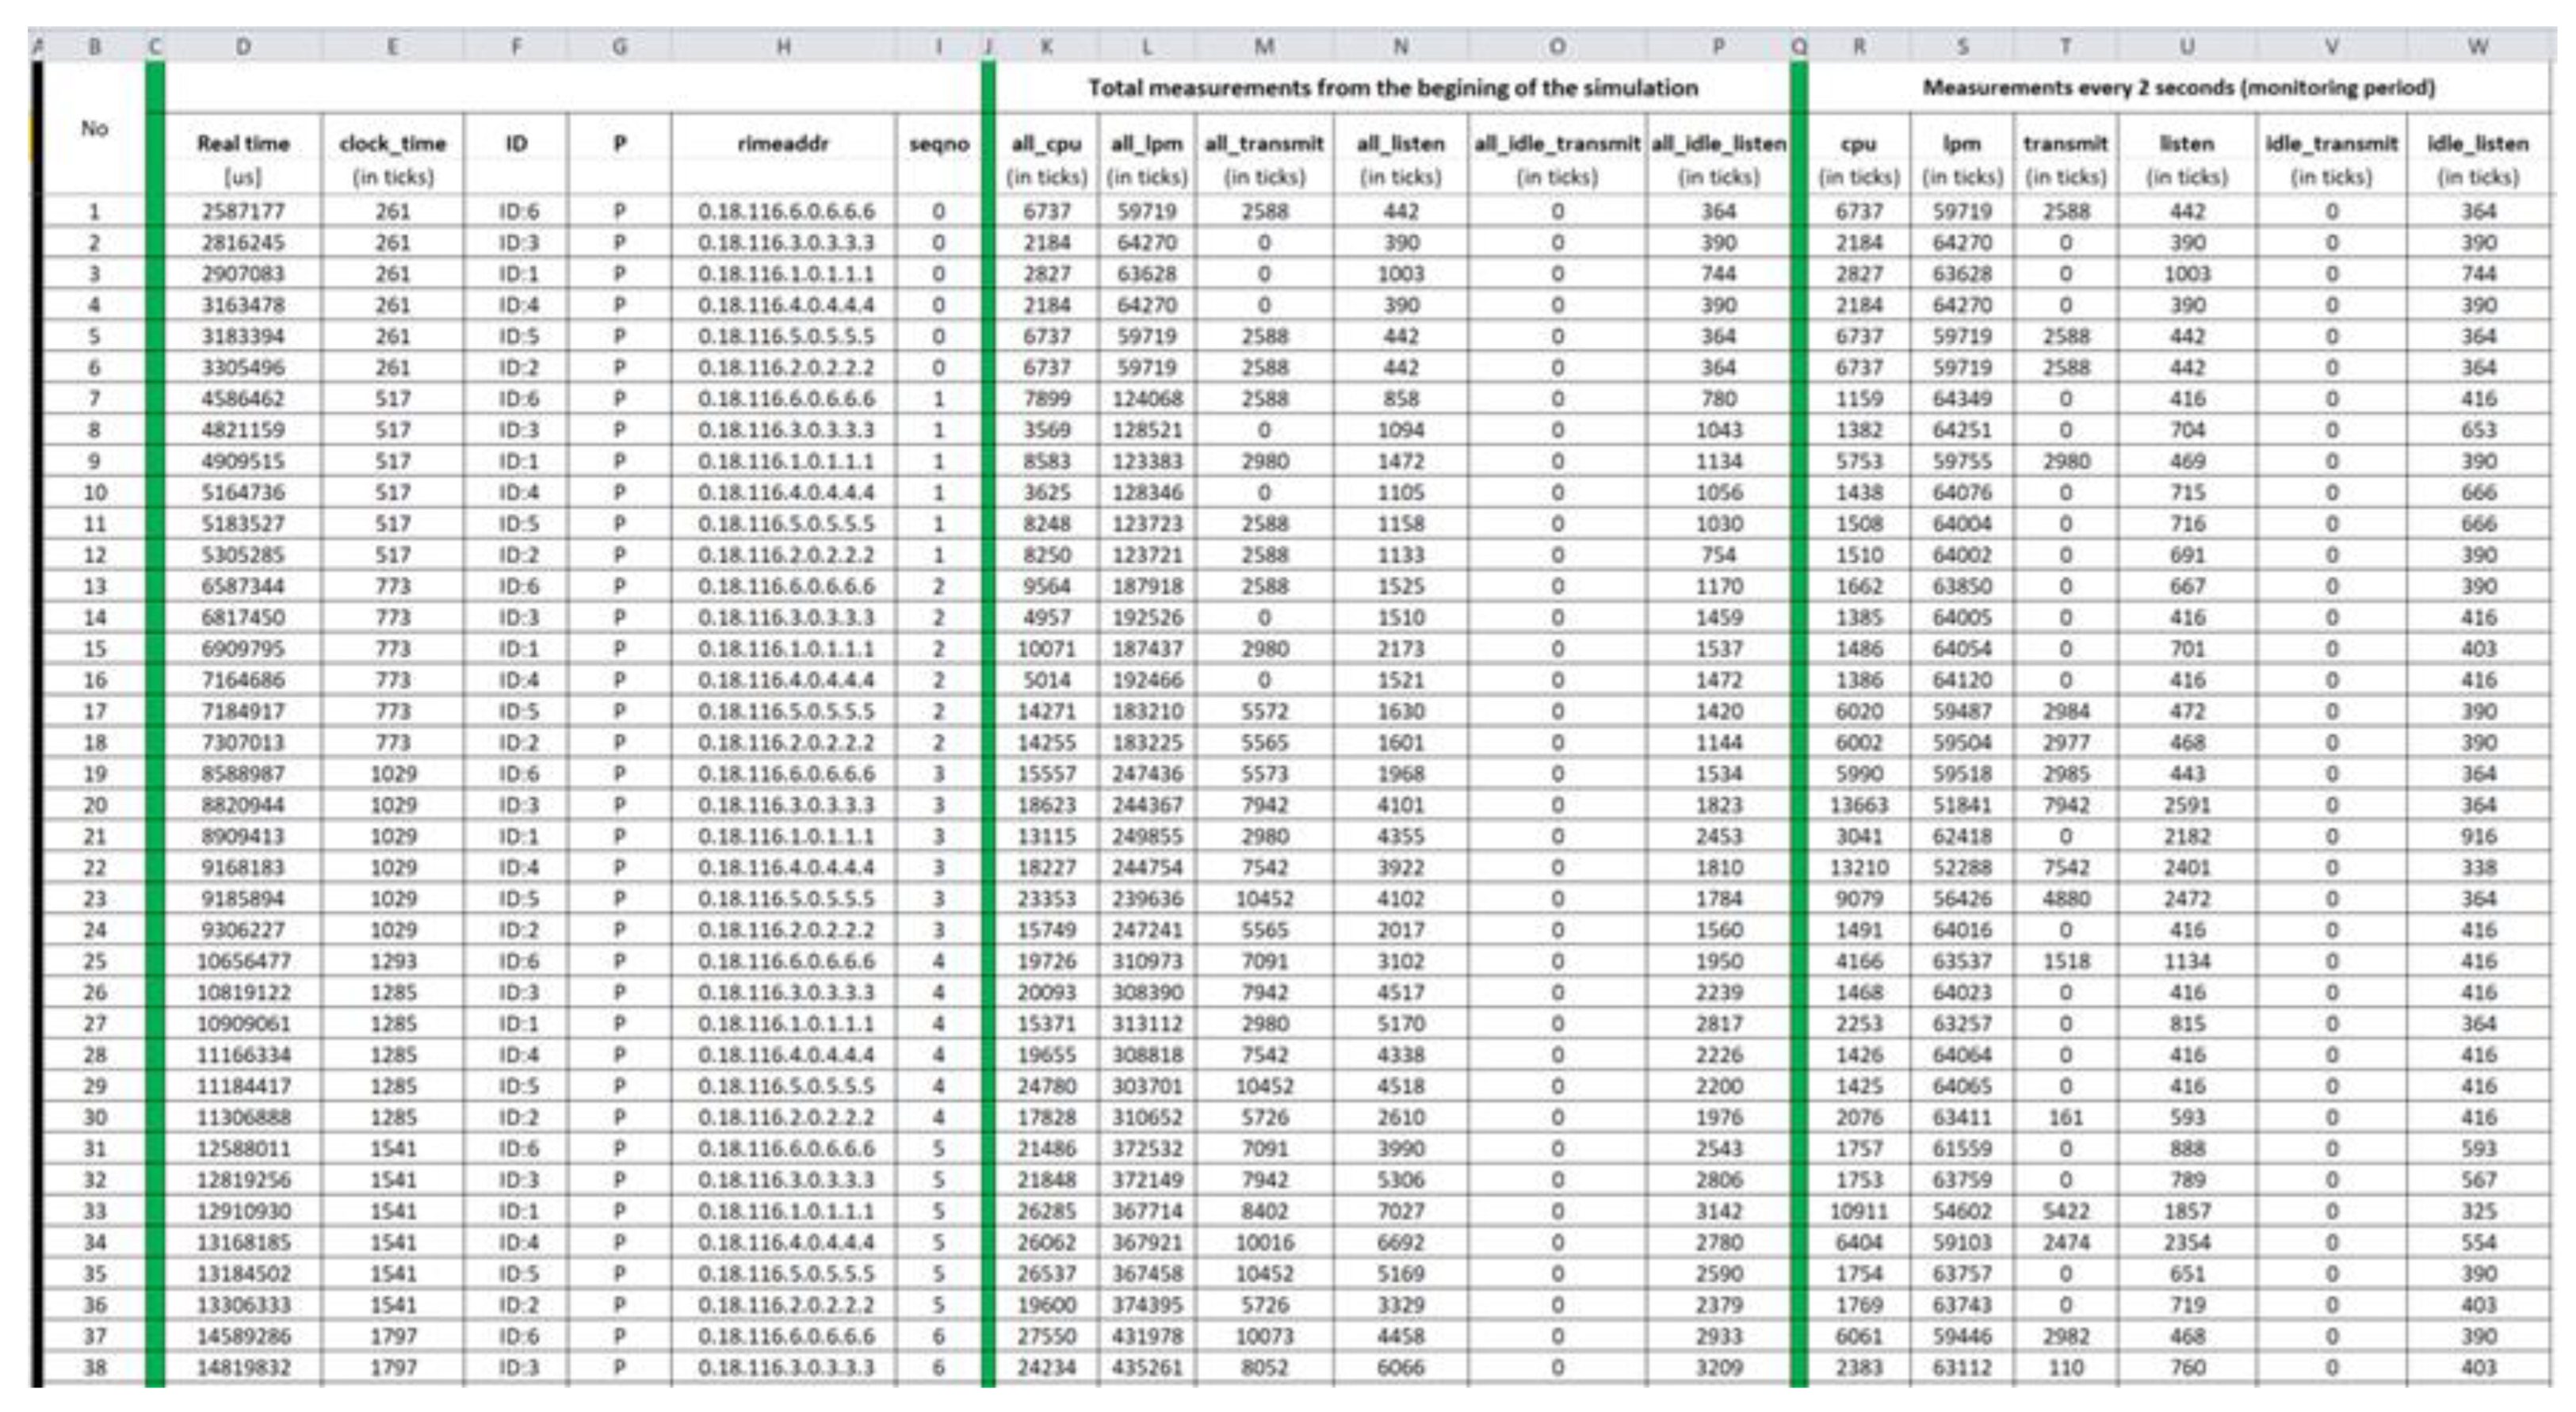
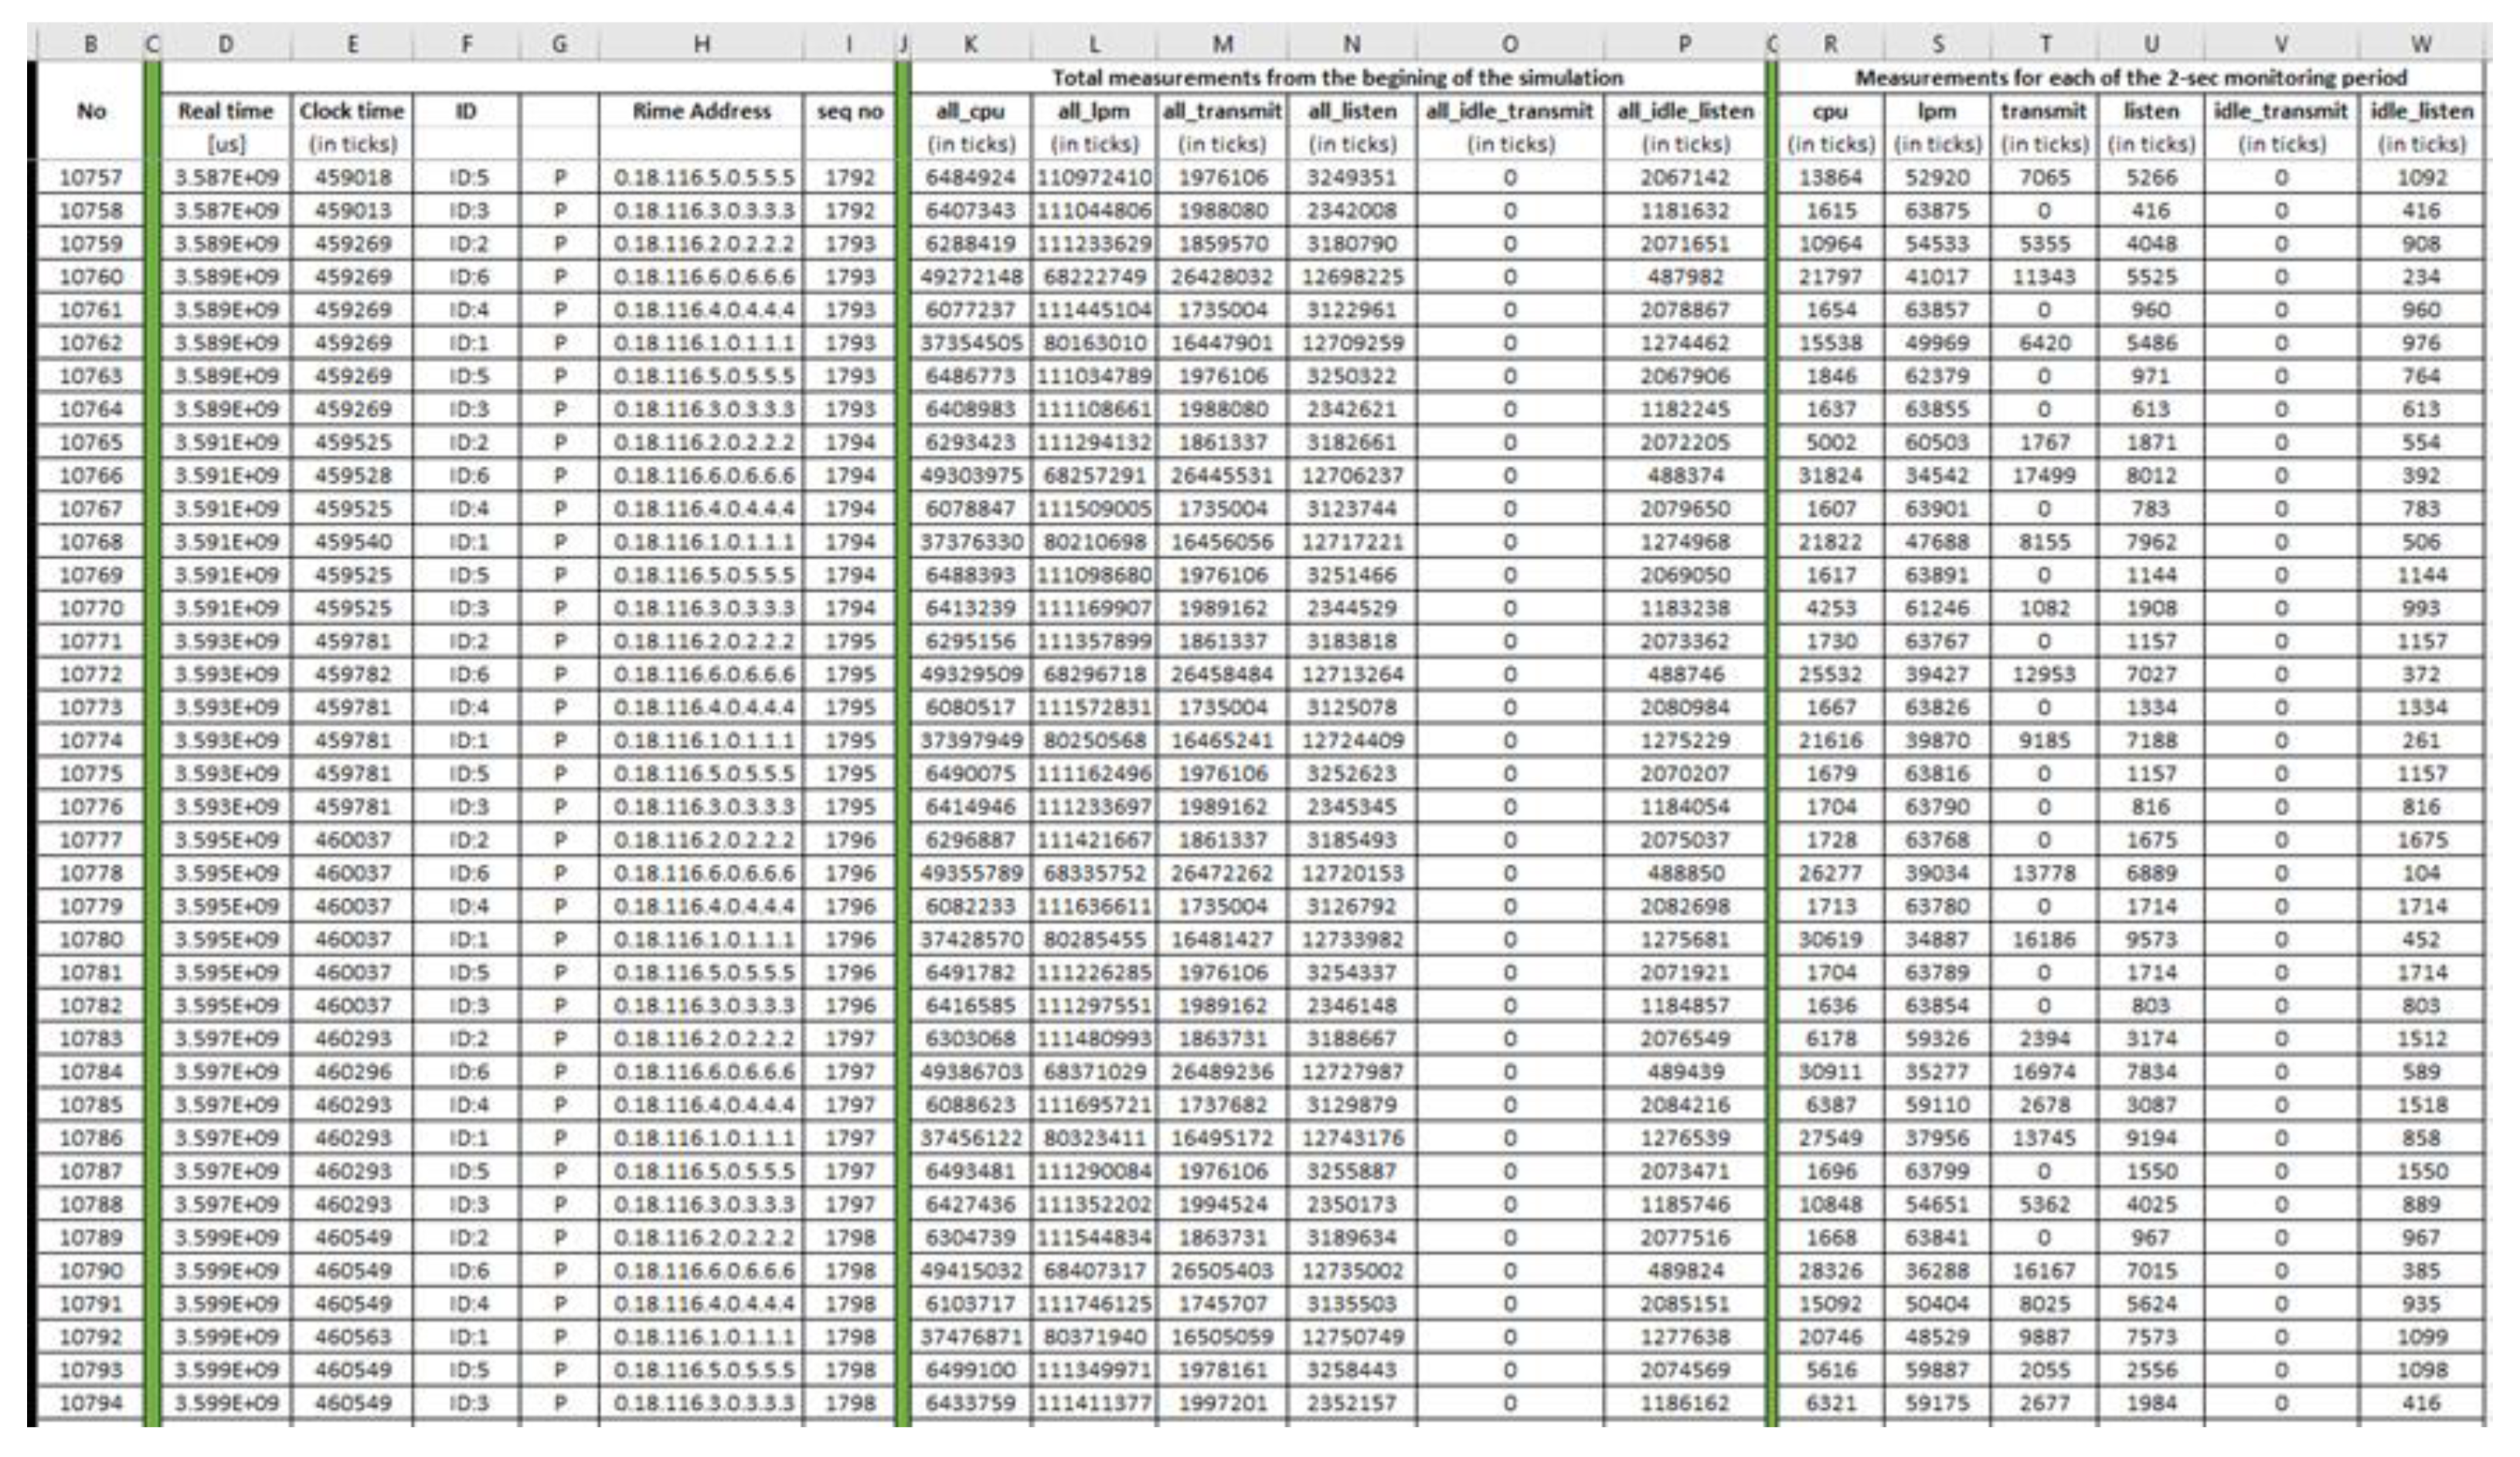
| Index | Feature | Description |
|---|---|---|
| 1 | sim time | simulation time |
| 2 | clock_time() | clock time (i.e.,by default, 128 ticks/second) |
| 3 | ID | Mote ID |
| 4 | P | label |
| 5 | rimeaddr | rime address |
| 6 | seqno | sequence number |
| 7 | all_cpu | accumulated CPU energy consumption |
| 8 | all_lpm | accumulated Low Power Mode energy consumption |
| 9 | all_transmit | accumulated transmission energy consumption |
| 10 | all_listen | accumulated listen energy consumption |
| 11 | all_idle_transmit | accumulated idle transmission energy consumption |
| 12 | all_idle_listen | accumulated idle listen energy consumption |
| 13 | cpu | CPU energy consumption for this cycle |
| 14 | lpm | LPM energy consumption for this cycle |
| 15 | transmit | transmission energy consumption for this cycle |
| 16 | listen | listen energy consumption for this cycle |
| 17 | idle_transmit | idle transmission energy consumption for this cycle |
| 18 | idle_listen | idle listen energy consumption for this cycle |
| MIN | NOM (Typical) | MAX | UNIT | |
|---|---|---|---|---|
| Supply voltage | 2.1 | 3.0 | 3.6 | V |
| Supply voltage during flash memory programming | 2.7 | 3.0 | 3.6 | V |
| Operating free air temperature | −40 | 85 | ºC | |
| Current Consumption: MCU on, Radio RX | 21.8 | 23 | mA | |
| Current Consumption: MCU on, Radio TX | 19.5 | 21 | mA | |
| Current Consumption: MCU on, Radio off | 1800 | 2400 | µA | |
| Current Consumption: MCU idle, Radio off | 54.5 | 1200 | µA | |
| Current Consumption: MCU standby | 5.1 | 21.0 | µA |
| RPL Messages Overhead | ||||
|---|---|---|---|---|
| Number of RPL Messages | Number of UDP Messages | Number of Other Messages | RPL Overhead (%) | |
| Mote 1 | 290 | 43,804 | N/A | 0.25 |
| Mote 2 | 1982 | 11,621 | N/A | 1.70 |
| Mote 3 | 1621 | 11,883 | N/A | 1.39 |
| Mote 4 | 1604 | 11,827 | N/A | 1.38 |
| Mote 5 | 1308 | 12,556 | N/A | 1.12 |
| Mote 6 | 1170 | 12,357 | N/A | 1.00 |
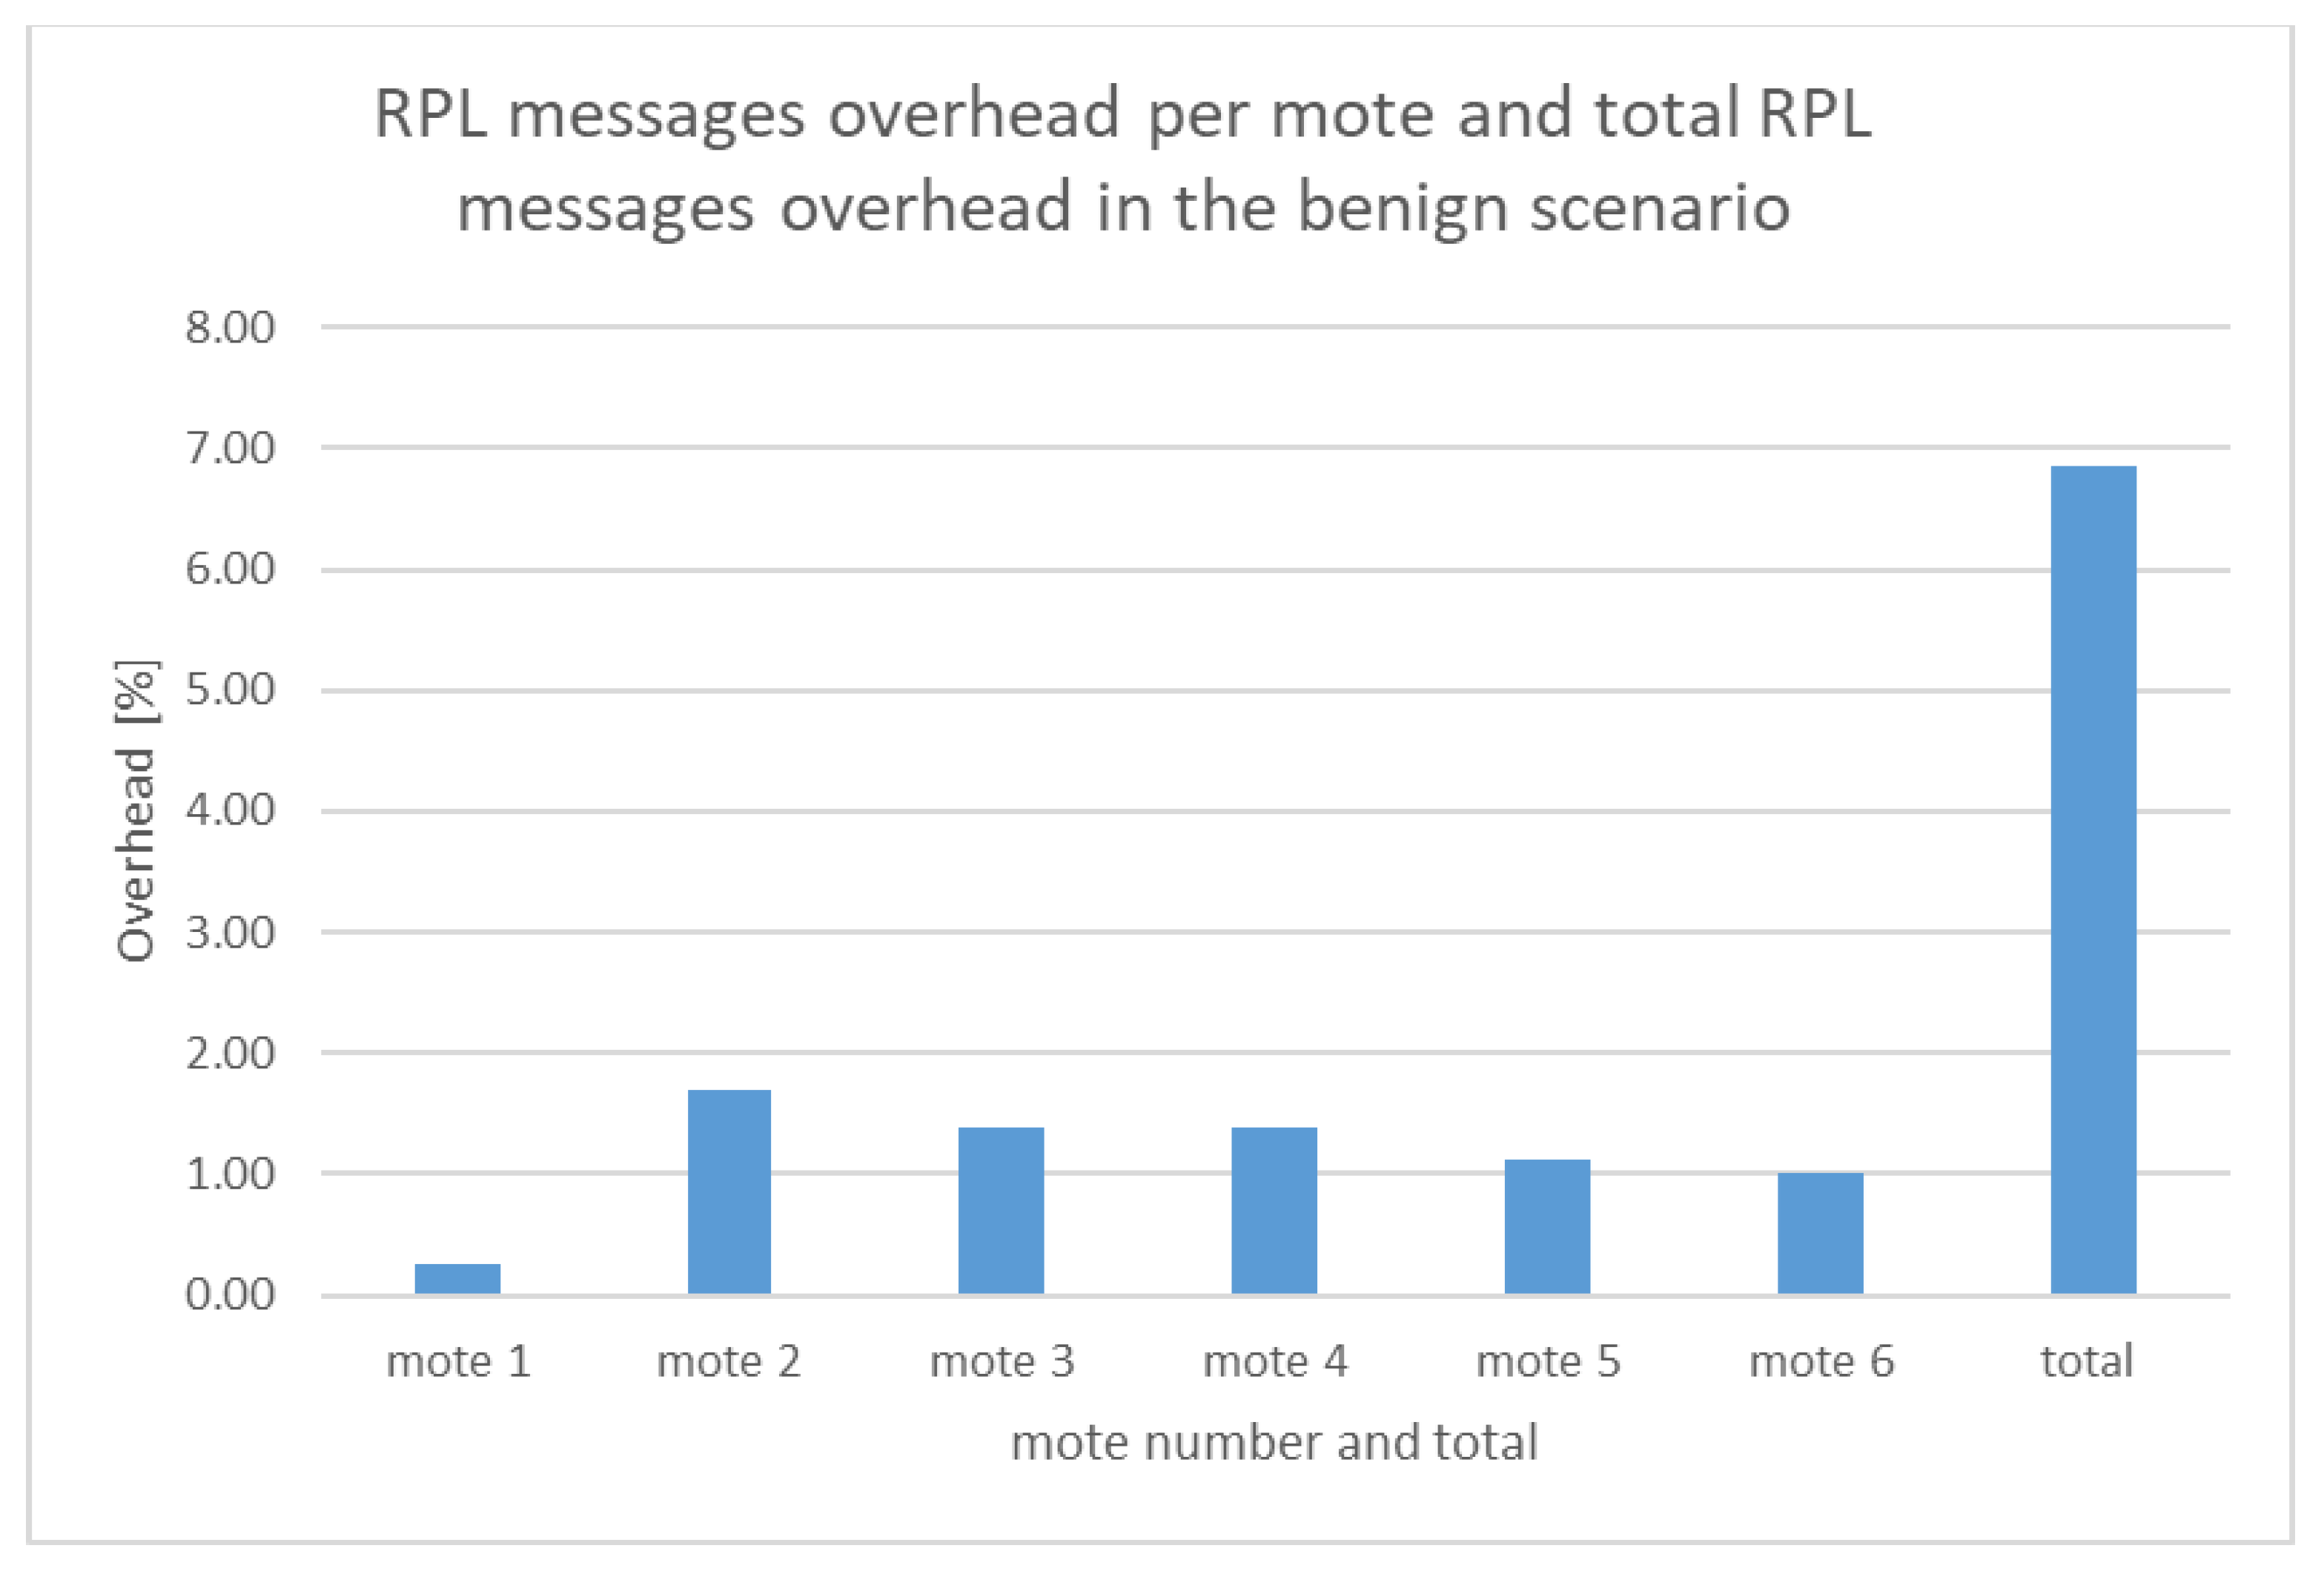
| Total | 7975 | 104,048 | 4440 | 6.85 |
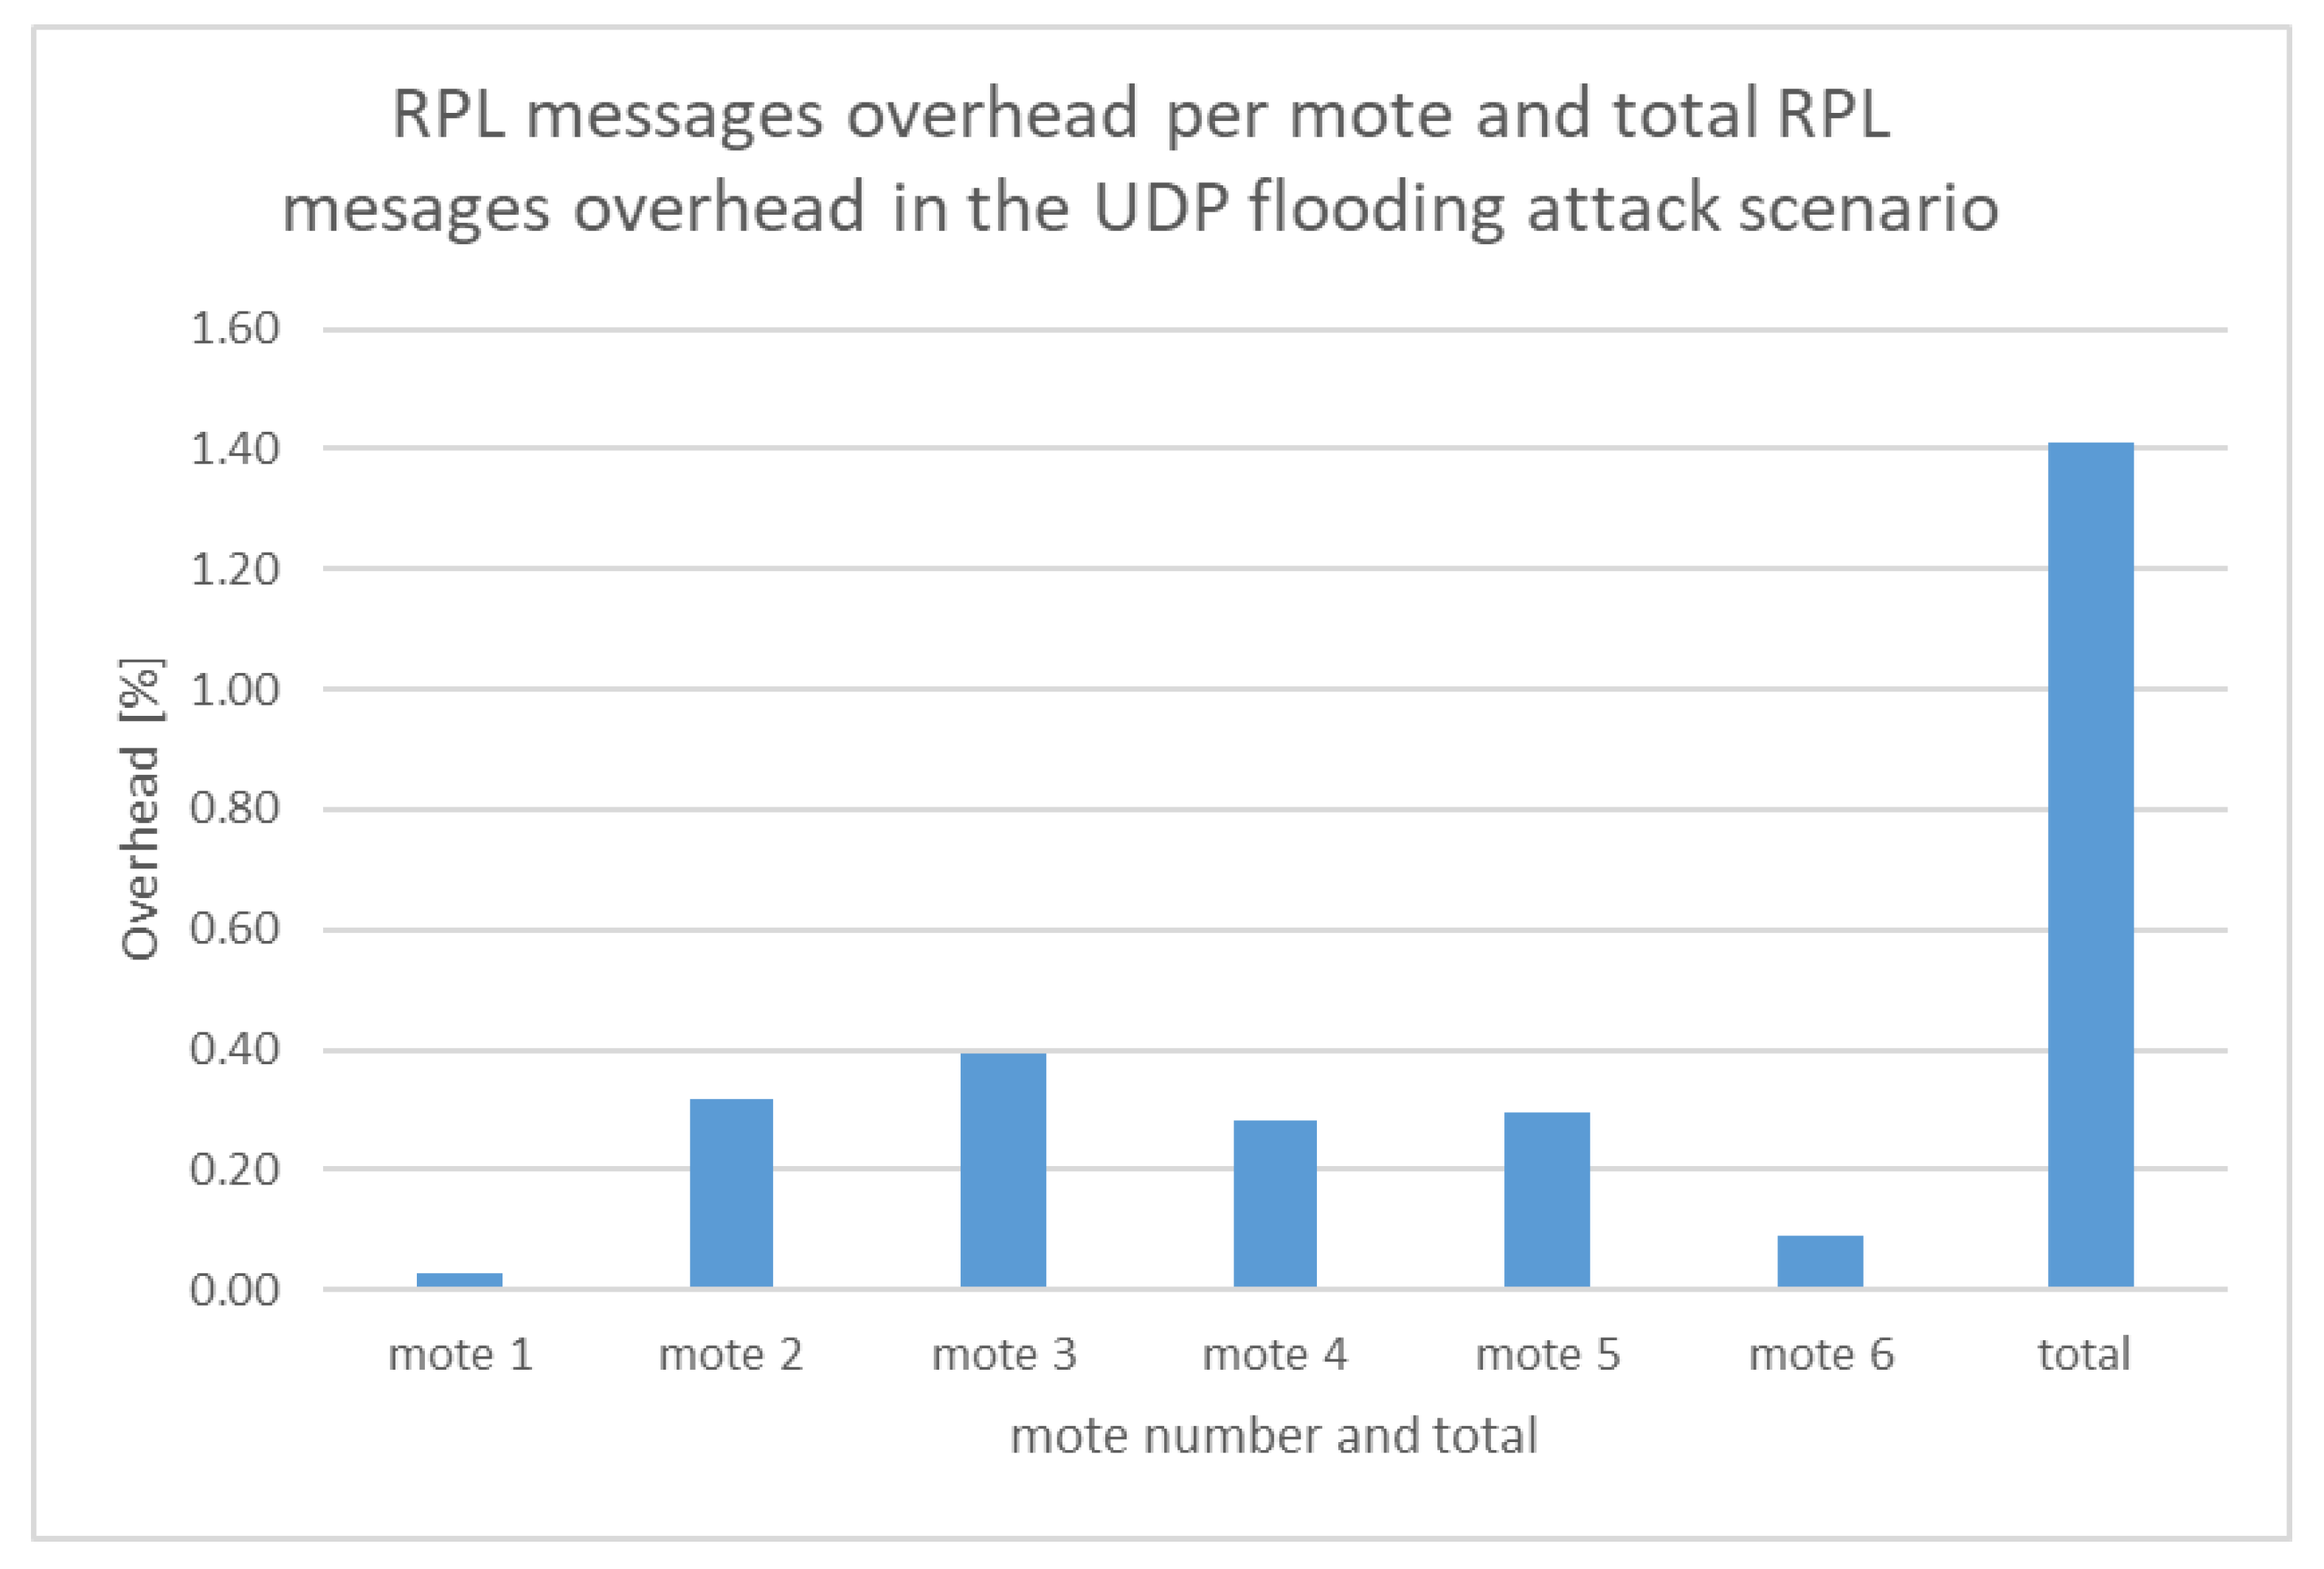
| RPL Messages Overhead | ||||
|---|---|---|---|---|
| Number of RPL Messages | Number of UDP Messages | Number of Other Messages | RPL Overhead (%) | |
| Mote 1 | 203 | 254,796 | N/A | 0.03 |
| Mote 2 | 2228 | 28,953 | N/A | 0.32 |
| Mote 3 | 2768 | 30,238 | N/A | 0.39 |
| Mote 4 | 1976 | 27,260 | N/A | 0.28 |
| Mote 5 | 2084 | 31,247 | N/A | 0.30 |
| Mote 6 | 6490 | 298,177 | N/A | 0.09 |
| Total | 9908 | 670,671 | 21,753 | 1.41 |
Publisher’s Note: MDPI stays neutral with regard to jurisdictional claims in published maps and institutional affiliations. |
© 2021 by the authors. Licensee MDPI, Basel, Switzerland. This article is an open access article distributed under the terms and conditions of the Creative Commons Attribution (CC BY) license (http://creativecommons.org/licenses/by/4.0/).
Share and Cite
Essop, I.; Ribeiro, J.C.; Papaioannou, M.; Zachos, G.; Mantas, G.; Rodriguez, J. Generating Datasets for Anomaly-Based Intrusion Detection Systems in IoT and Industrial IoT Networks. Sensors 2021, 21, 1528. https://doi.org/10.3390/s21041528
Essop I, Ribeiro JC, Papaioannou M, Zachos G, Mantas G, Rodriguez J. Generating Datasets for Anomaly-Based Intrusion Detection Systems in IoT and Industrial IoT Networks. Sensors. 2021; 21(4):1528. https://doi.org/10.3390/s21041528
Chicago/Turabian StyleEssop, Ismael, José C. Ribeiro, Maria Papaioannou, Georgios Zachos, Georgios Mantas, and Jonathan Rodriguez. 2021. "Generating Datasets for Anomaly-Based Intrusion Detection Systems in IoT and Industrial IoT Networks" Sensors 21, no. 4: 1528. https://doi.org/10.3390/s21041528
APA StyleEssop, I., Ribeiro, J. C., Papaioannou, M., Zachos, G., Mantas, G., & Rodriguez, J. (2021). Generating Datasets for Anomaly-Based Intrusion Detection Systems in IoT and Industrial IoT Networks. Sensors, 21(4), 1528. https://doi.org/10.3390/s21041528