Abstract
The preparation and characterization of a hybrid composite, based on carbon cloth (CC) matrix functionalized with two-dimensional (2D) MoS2 flakes and MoO3, and its use for developing an electrochemical sensor for the determination of riboflavin (RF) is here reported. The 2D-MoS2-MoO3CC composite was prepared by depositing 2D-MoS2 nanosheets, obtained by liquid phase exfoliation (LPE), on the surface of a carbon cloth fiber network, previously functionalized with a layer of molybdenum oxide (α-MoO3) by radio-frequency magnetron reactive sputtering technique. The 2D-MoS2-MoO3CC composite was characterized by scanning electron microscopy and energy dispersive X-ray analysis (SEM-EDX), and Raman spectroscopy. An electrochemical sensor has been then fabricated by fixing a slice of the 2D-MoS2-MoO3CC composite on the working electrode of a screen-printed carbon electrode (SPCE). The 2D-MoS2-MoO3-CC/SPCE sensor display good electrochemical characteristics which have been exploited, for the first time, in the electroanalytical determination of riboflavin (RF). The sensitivity to RF, equal to 0.67 µA mM−1 in the linear range from 2 to 40 µM, and a limit of detection (LOD) of 1.5 µM at S/N = 3, demonstrate the promising characteristics of the proposed 2D-MoS2-MoO3-CC/SPCE electrochemical sensor for the determination of riboflavin.
1. Introduction
The discovery of graphene has been a revolution in the field of nanomaterials because of its inherent two-dimensionality [1]. This characteristic has given the origin at a very impressive research for using graphene in many devices. For example, two-dimensional electron confinement of ultra-thin 2D graphene has improved the electrical properties compared to other nanomaterials [2]. With the time, a lot of works mentioned a major disadvantage in using graphene, essentially the lack of band-gap.
Nowadays, research is focused on other 2D nanomaterials, such as transition metal disulphides (TMDs), due to their amazing properties. For example, they possess sizable band-gaps around 1–2 eV, promising interesting applications in chemical sensors. Molybdenum disulphide (MoS2) is one of the most interesting TMDs nanomaterials. It has an indirect band-gap of 1.29 eV [3] that turns to semiconductor with a direct band-gap of 1.9 eV [4] going from bulk to a monolayer, offering an important charge carrier mobility. MoS2 nanosheets have been fabricated via liquid phase exfoliation (LPE) by our groups and used for the detection of different biomolecules [5,6,7,8].
In a previous paper [9], we also investigated the electrochemical properties of MoO3, a semiconductor oxide with a band gap of 3.2 eV which presents three crystalline structures among of which the orthorhombic (α-MoO3) phase is the most thermodynamically stable. In order to increase its poor conductivity and to improve the electrochemical characteristics, a layer of α-MoO3 was grown on flexible conductive carbon cloth (CC). It was demonstrated that the high electron mobility and the large surface area provided by the carbon fibers increased the capacities of the sensor in terms of peak current and sensitivity compared to bare screen-printed carbon electrode (SPCE) [9]. The main advantage of using the CC was its capability to favor the electron transfer between the electrode surface and the analyte. These enhanced electroanalytical properties were demonstrated in the sensing of dopamine [9].
Considering the promising properties offered by 2D-MoS2 and α-MoO3, the combination of these two materials appears to be very interesting in the fabrication of an electrochemical sensors. These systems have been reported to improve the electrical properties, enhancing the supercapacitor performance, the storage properties and hydrogen evolution [10,11,12,13,14]. Hybrid MoO3/MoS2 composites reveal more satisfying electrochemical properties than pure MoO3 and MoS2 [10]. The dispersion of single [11,12,13], or hybrid layers [14] on the surface of carbon cloths has been reported for obtaining better characteristics.
Little has been instead reported on their use for molecular sensing. In this article, we propose an electrochemical sensor for riboflavin (RF) detection using carbon cloth functionalized with MoO3 and decorated with 2D-MoS2 nanosheets. Riboflavin is a water soluble vitamin of B group and is an important constituent of flavoproteins, and plays a vital role in the enzyme reactions in the human body [15] as well as for animals [16], that need a riboflavin supply to maintain a stable balance in their bodies. Supplemental RF intake appears to have a protective effect on various medical conditions such as sepsis, ischemia and at the same time it also helps to reduce the risk of certain forms of cancer in humans and has anti-oxidant, anti-aging, anti-inflammatory, anti-nociceptive properties [15]. RF is found in most foods, with the highest content in dairy products, meat, and dark green vegetables [17,18]. Thus, due to the importance of this vitamin, a large number of data are found in the literature about its electrochemical determination [19,20,21,22,23].
Here, we report, for the first time, the electrochemical determination of RF with a novel 2D-MoS2-MoO3CC/SPCE sensor. To the best of our knowledge, there are no reports about the fabrication and application of a such SPCE electrochemical platform modified with a layer-by-layer structure based on molybdenum compounds grown/deposited on a carbon cloth network structure.
2. Materials and Methods
2.1. Preparation of the 2D-MoS2-MoO3CCcomposite
The 2D-MoS2-MoO3CC composite were fabricated as follows: first, pristine carbon cloth substrates were washed for 2 to 3 times with acetone and deionized water under sonication for 2 h, to remove organic residues and other impurities thoroughly. The cleaned carbon cloth substrates were kept in a hot air oven overnight. They are constituted of long nanofibers. Afterwards, the dry substrates were placed in a radio-frequency magnetron reactive sputtering (Huttenger, Germany) in a customized down setup sputtering mode and (99.999%) is used as working gas and (99.999%) as reactive gas in 1:5 ratio. The Mo metal target was fixed in the working pressure of 10−2 mbar for depositing a thin layer. A α-MoO3 thin film (around 350 nm thick) was deposited on carbon cloth substrates at deposition rate of 3 Ǻ/s at 450ºC temperature. The surface contamination on the target material was removed by pre-sputtering the target at 0.01 mbar pressure for 10 min. The RF power was set to 150W, the distance between target and substrate was maintained at 50 mm [9]. 2D-MoS2 nanosheets were prepared by liquid phase exfoliation (LPE) in sodium cholate (SC) watery solutions (1.5 mg/mL) [6]. Solutions were prepared by tip sonication (Branson S250) of MoS2 powder (particle size < 2µm, Sigma Aldrich) in SC at a concentration of 5 mg/mL for 30 min. Samples were kept in an ice bath to reduce detrimental heating effects during sonication. The dispersions were allowed to decant overnight in a flask. Then, the half top part was centrifuged at 1500 rpm for 90 min and the supernatant, rich of few-layer nanosheets, was collected. The dispersions thus obtained contained MoS2 flakes with an average number of layers, n = 9, an average lateral of 170 nm, in an estimated concentration of 80 µg/mL. The dispersions were stable for months [6]. Finally, the 2D-MoS2 suspension was drop casted onto the MoO3 carbon cloth and left to dry at room temperature.
2.2. Characterization
SEM images were acquired by means of a Zeiss CrossBeam 540 apparatus equipped with EDX detector. Raman spectroscopy was carried out with a XploRA micro-spectrometer (Horiba Scientific), with excitation at 638 nm. The laser beam was focused with a 100X objective (NA 0.9, WD 0.21 mm) on a diffraction limited spot. The Raman signal was collected through the same objective in a backscattering configuration and dispersed by an 1800 lines/mm grating onto a charge-coupled device (CCD) detector (Syncerity, Horiba Scientific). The laser power was set at 0.2 mW in order to avoid sample damaging and the signal was integrated over 30 s.
2.3. Modified Electrode Fabrication
To fabricate the modified SPCE, slices of pristine CC, MoO3-CC and MoS2-MoO3-CC were cut in order to cover entirely the surface of the working electrode of SPCE. Then, 6 µL of Nafion solution 5% was dropped on that for enhancing the adhesion on the surface of SPCE and left to dry at room temperature.
2.4. Electrochemical Measurements
Electrochemical analyses (Cyclic Voltammetry and Linear Sweep Voltammetry) were performed by using a DropSens µStat 400 Potentiostat empowered by Dropview 8400 software for data acquisition. The sensors were characterized by cyclic voltammetry (CV) and linear sweep voltammetry (LSV) in aerated 1M Phosphate-buffered saline (PBS) electrolyte. CV and LSV tests were carried out at a scan rate of 50 mV/s in the potential range from −0.8 to 0 V, by varying the concentration of the investigated analyte. The calibration curves were obtained by plotting the Faradaic current vs. analyte’s concentration. The sensitivity was computed as the slope of the calibration curve.
3. Results and Discussion
3.1. 2D-MoS2-MoO3-CC/SPCE Characterization
A picture of the modified 2D-MoS2-MoO3-CC/SPCE is reported in Figure 1a. The sensitive area is 0.125 cm2. The network morphology of the 2D-MoS2-MoO3-CC fixed on the working electrode of SPCE is shown in Figure 1b. The large surface of carbon cloth fibers is beneficial for growing the MoO3 layer and successively to anchoring the 2D-MoS2 nanosheets (Figure 1c).
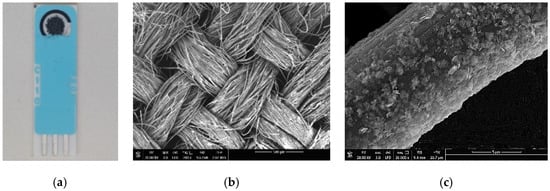
Figure 1.
(a) Picture of the modified 2D-MoS2-MoO3-CC/screen-printed carbon electrode (SPCE); (b) SEM image of the 2D-MoS2- MoO3-CC network. (c) SEM image of the surface of a single 2D-MoS2-MoO3-CC/SPCE fiber.
This open network structure facilitates the electrolyte ions diffusion during the electrochemical tests. The change of morphology subsequent to the CC surface modification is shown in Figure 2.
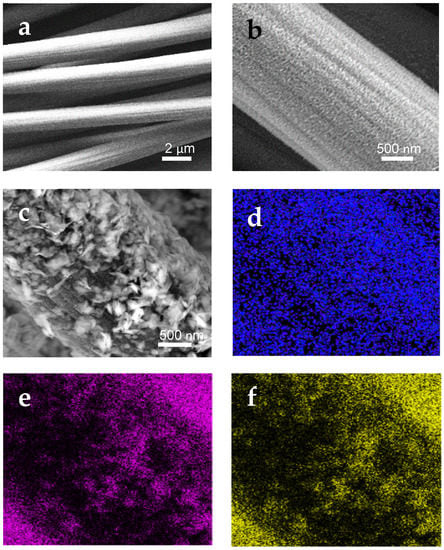
Figure 2.
SEM images of: (a) CC/SPCE; (b) MoO3-CC/SPCE; (c) MoS2-MoO3-CC/SPCE. (d–f) energy dispersive X-ray (EDX) mapping of the SEM image shown in (c) at the O, Mo, and S energies, respectively.
Unmodified CC fibers present a smooth surface (Figure 2a). In the MoO3-CC, the MoO3 thin layer covers homogeneously the entire surface of the carbon fibers (Figure 2b). In Figure 2c is shown the two-layers 2D-MoS2-MoO3-CC composite. The MoS2 nanosheet particles are clearly seen on the top of underling MoO3 nanoparticle layer. There are no remarkable aggregation of MoS2 sheets on the MoO3 layer. Furthermore, an increase in the surface roughness is observed, which gives rise to higher active surface area for the modified electrode, and thus enhances its electrochemical activity. The 2D-MoS2 nanosheets build up an external porous layer covering the MoO3-CC fibers. EDX elemental mapping analysis (Figure 2d–f) of the MoS2-MoO3-CC composite-based SPCE confirms the presence and distribution of the main O, Mo, and S elements on the electrode surface.
Raman spectra at 638 nm have been acquired first on the bare carbon cloth SPCE (Figure 3, black line), then on the carbon cloth added with molybdenum oxide SPCE (Figure 3, blue line) and finally on the MoS2-MoO3-CC/SPCE (Figure 3, red line). On the CC/SPCE, only the Raman fingerprint of carbon is detected, namely the D-band peak centered at 1330 cm−1 and the G-band around 1600 cm−1. These two peaks correspond to the amorphous carbon phase present in the carbon cloth [24].
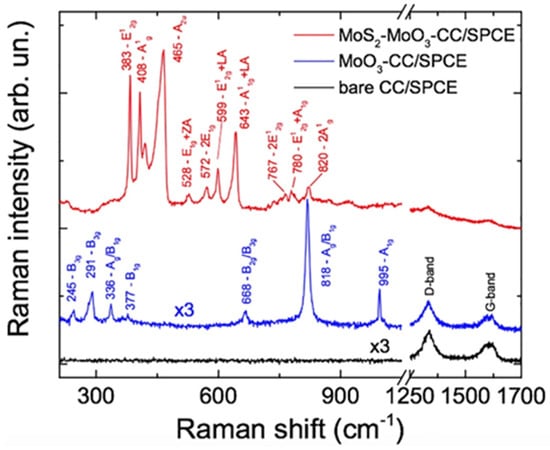
Figure 3.
Raman spectra carried out at 638 nm on the CC/SPCE (black line), MoO3-CC/SPCE (blue line) and MoO3-CC-MoS2/SPCE (red line). The spectra on CC and MoO3-CC were multiplied by a factor 3 to fit the same intensity scale of the MoS2 one. All spectra were offset for clarity.
On the MoO3CC/SPCE (blue line) we observe the superposition of the carbon bands and the MoO3 vibrational modes which are attributed to the α-MoO3 orthorhombic phase [25]. The spectrum of the MoS2-MoO3-CC/SPCE is dominated by the MoS2 signal. At 638 nm the photons are almost resonant with the B-excitonic transition of MoS2 [26], leading to resonant Raman (RR) effects [26,27]. When the frequency of the incoming light comes close to the specific frequency needed to drive the transfer of an electron from an occupied state to an unoccupied state, the absolute Raman intensity can change by several orders of magnitude. Besides the amplification of first-order transitions, RR scattering causes second-order Raman processes to be particularly amplified. These exhibit features coming from different crystalline momenta, potentially from the entire Brillouin zone (BZ), with the only constraint of negligible momentum of the phonon pairs involved in the two-phonon process. The strong second order transitions in MoS2 cover the 500–850 cm−1 frequency range. Table 1 summarizes the Raman modes observed on our sample, their symmetry and transition order. The position of the first-order transitions E12g (383 cm−1) and A1g (408 cm−1) is typical of the 2H phase on few layers 2D-MoS2 [6,27]. The 466 cm−1 peakhas been attributed to either an A2u(Γ) vibration [28] or to an overtone of a longitudinal acoustic (LA) phonon [29].

Table 1.
Peaks frequency, group theory representation and attribution of the modes observed in the Raman spectra of the different samples [24,25,28,29].
3.2. Electrochemical Characterization
A series of electrochemical tests has been carried out to characterize the bare screen-printed carbon electrodes and the modified ones. Preliminary CV tests have been conducted in 1 M PBS. Figure 4a compares the CV spectra of the bare SPCE and modified CC/SPCE at 0.05 V/s. The strong enhancement of the background current of the CC/SPCE, is due to its large electrochemical double-layer capacitance (EDLC). Cyclic voltammograms of the fabricated electrodes at different scan rates have been also collected. Each point related to sensor response reported is the average of three independent measurements. The standard deviation associated with these measurements has been evaluated to be less than 10%, which is good for these not yet optimized sensors.
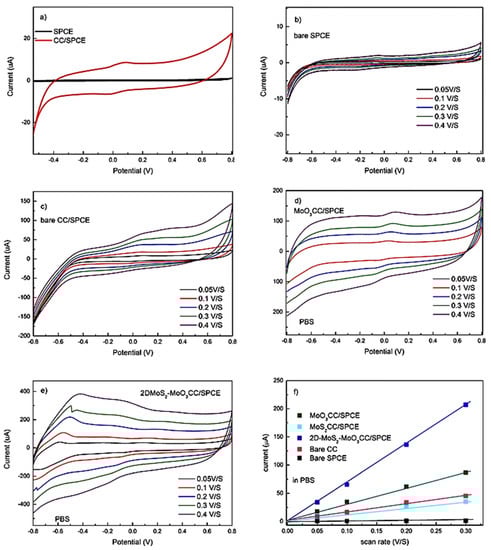
Figure 4.
(a) Cyclic voltammetry (CV) spectra of the bare SPCE and modified carbon cloth (CC)/SPCE at 0.05 V/s in 1M PBS. CVs at different scan rates of: (b) bare SPCE, (c) bare CC/SPCE, (d) MoO3CC/SPCE and (e) 2D-MoS2-MoO3CC/SPCE from 0.05 V/s to 0.4 V/s. (f) Linear fitting of the capacitive currents of the different electrodes vs. scan rates.
As expected, the scan rate amplifies the capacitive current. This is well evident for the modified electrodes (compare Figure 4b–e), due to the exposure of more active sites on the working electrode’s surface. Plotting the scanning rate versus the current for all electrodes (Figure 4f), a series of straight lines were obtained, allowing us to estimate the EDLC for these electrodes from the slope and the geometrical area. These data show that the EDLC of the CC/SPCE is increased largely compared to the bare SPCE (black line). The EDLC is increased by nearly a factor 2 when the MoO3 layer is grown on CC/SPCE (dark green line) and undergoes a further strong enhancement when the MoS2 nanosheets are deposited (blue line). The 2D-MoS2-MoO3CC/SPCE composite electrode shows the highest EDLC (blue line). This suggests that the network structure of CC is able to provide a larger surface area compared to bare SPCE, which is further increased in the presence of the layered MoO3 and hybrid 2D-MoS2-MoO3 structure.
The electron transfer capability of the various electrodes has been tested with [Fe(CN)6]4− as analyte (10 mM in 1 M PBS) by varying the scan rate from 0.05 to 0.4 V/s. In order to provide a quick comparison among the fabricated electrodes, Figure 5 displays the cyclic voltammograms obtained at a scan rate of 0.05 V/s.
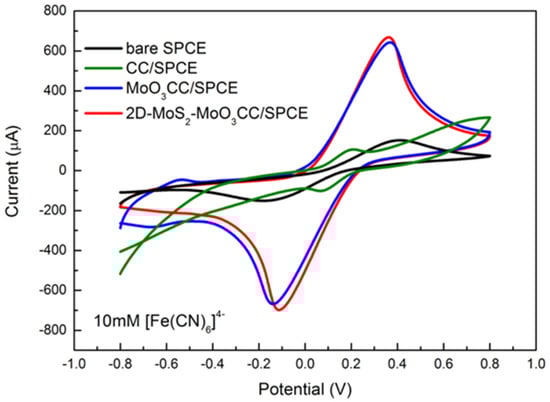
Figure 5.
Cyclic voltammograms performed in 10 mM [Fe(CN)6]4− at a scan rate of 0.05 V/swithbare SPCE (black line), CC/SPCE (green line),MoO3CC/SPCE (blue line), and 2D-MoS2-MoO3CC/SPCE (red line).
As can be noted, both the current peak intensity (Ip) and the peak-to-peak separation (∆Ep) depend on the investigated electrodes. ∆Ep and Ip are helpful parameters to provide a qualitative estimation of the electron transfer rate due to the redox process at the electrode’s surface. In Table 2 we report the values of the anodic (Ipa) and cathodic (Ipc) current peaks, together with the value of ∆Ep for the bare SPCE, the modified CC/SPCE, the MoO3CC/SPCE, and 2D-MoS2-MoO3CC/SPCE measured with 10 mM [Fe(CN)6]4− at a scan rate of 0.05 V/s.
Table 2.
CV data of anodic (Ipa) and cathodic (Ipc) current peaks and ∆Ep for the bare SPCE and the modified CC/SPCE, MoO3CC/SPCE, and 2D-MoS2-MoO3CC/SPCE in 10 mM [Fe(CN)6]4– at a scan rate of 0.05 V/s.
Lower ∆Ep values and higher Ipa and Ipc is measured using the modified electrodes. These values suggest a faster electron transfer in the carbon cloth composite electrodes compared to bare SPCE likely resulting from a larger reaction surface area. Furthermore, the ΔEp values as well as the current peaks increase linearly with the square root of the scan rate (see Figure 6 for the anodic peak), indicating a diffusion-controlled process.
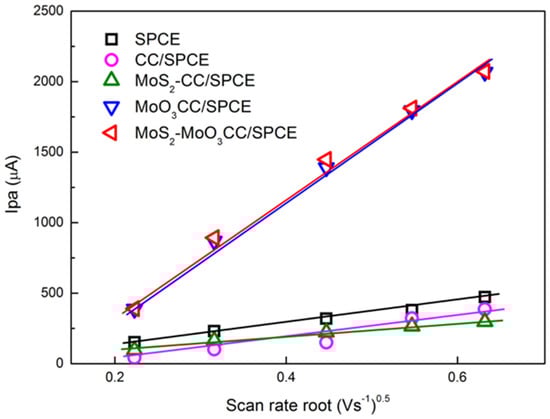
Figure 6.
Plot of the anodic peak current (Ipa) vs. scan rate root. Ipa values were derived by CVs performed with the different bare and modified SPCE in 10 mM [Fe(CN)6]4− at different scan rate.
These studies suggest that the electrochemical behavior of the bare electrode is improved after modification with CC-based MoS2 and MoO3 layer. Further, it is evidenced that MoO3CC/SPCE and MoS2-MoO3CC/SPCE present almost similar electrochemical properties for the [Fe(CN)6]4−/[Fe(CN)6]3− redox process, indicating that they have comparable EDLC and electron transfer capability.
3.3. Electrochemical Behavior in Presence of Riboflavin
We have exploit the enhanced electrochemical performances of the 2D-MoS2-MoO3 layer on CC to develop an electrochemical sensor for biomolecules detection. Here, we tested the new electrode on riboflavin (RF) at a concentration of 100 µM.
Figure 7a shows the remarkable enhancement of the CV signal measured with the modified 2D-MoS2-MoO3CC/SPCE (red lines) compared to the bare SPCE (black lines) and MoO3CC/SPCE. This behavior highlight the strong effect of the MoS2 layer on RF electrocatalysis. Figure 7b presents the CV curves of the 2D-MoS2-MoO3CC/SPCE in absence (black dotted line) and in presence of RF (orange line). At the starting potential of −0.8 V, RF exists in its reduced form. At −0.55V, RF exhibits an oxidation peak followed by a reduction peak at −0.72V on the back forward scan. This electrochemical redox process involves the transfer of two protons and two electrons [29]. We have subsequently checked the effect of the loading of MoS2 on the MoO3CC fiber network. As shown in Figure 7c, the current increases as a function of the MoS2 quantity on the MoO3CC matrix, thus proving the fundamental electrocatalytic role of MoS2 in enhancing the response to RF.
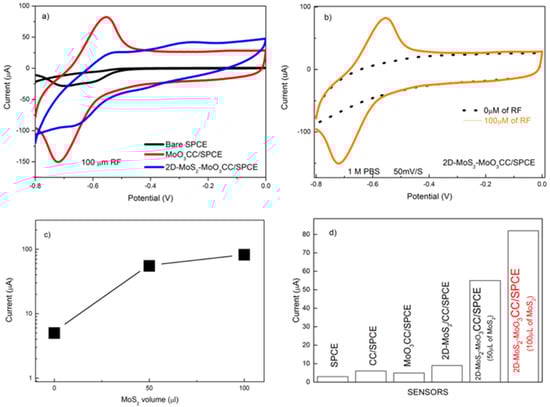
Figure 7.
(a) CV of the bare SPCE (black line), MoO3CC/SPCE (blue line) and 2D-MoS2-MoO3CC/SPCE (red line) in presence of 100 µM RF; (b) CV of 2D-MoS2-MoO3CC/SPCE in absence (black dotted line) and in presence of 100 µM RF (orange line);(c) Ipa current vs. the volume of 2D-MoS2 nanosheets suspension used for the MoO3CC matrix modification; (d) comparison of the Ipa current obtained with the different electrodes in presence of 100µM riboflavin (RF).
Figure 7d compares the current response of the different electrodes in the determination of RF. The sensor employing the modified 2D-MoS2-MoO3CC electrode has the highest sensitivity towards riboflavin, dwarfing the performances of other electrodes. The better sensitivity of the composite electrode can be associated to the increase of the effective surface area of the working electrode and the formation of new electroactive sites, formed at the interface between the MoO3 and 2D-MoS2 layers.
Based on these results, we have evaluated the response of the 2D-MoS2-MoO3CC-based sensor at different RF concentrations. In Figure 8a, is reported the linear sweep voltammetry (LSV) analysis of solutions containing increasing concentrations of RF, from 0 to 40 µM, evidencing the associated augmentation of the peak current value. In Figure 8b (black dots), is shown the calibration curves for RF, plotting the peak current as a function of the analyte concentration. The sensitivity, namely the slope of the calibration curve, is computed from a linear fit of the data (red line), and is 0.67 µA µM−1. LOD was 1.5 µM, as calculated by comparing the signals (S) from the samples with known and low concentrations of RF with those of blank samples (N) and by establishing the minimum concentration at which the RF signal is three times as high as noise (S/N = 3).
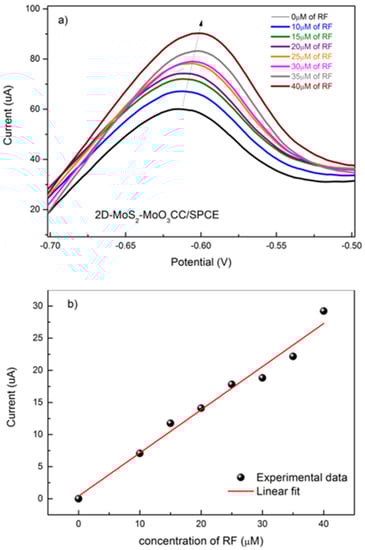
Figure 8.
(a) Linear sweep voltammetry (LSV) of 2D-MoS2-MoO3CC/SPCE, performed in 1 M PBS electrolyte and in the presence of different concentrations of RF. (b) Calibration curve for the determination of RF.
The performances (linear range, sensitivity and limit of detection) of the proposed 2D-MoS2-MoO3CC/SPCE based sensor have been compared to most of the recently reported riboflavin electrochemical sensors (see Table 3).
Table 3.
Comparison of MoS2-MoO3CC/SPCE sensor performance with recently reported riboflavin electrochemical sensors.
From this comparison it can be deduced that our sensor platform displays a wide linear range and a high sensitivity respect to the other sensors. We repeated this test after about one year using a new prepared 2D-MoS2 nanosheets suspension for replicating the fabrication of a new 2D-MoS2-MoO3CC/SPCE sensor in the same conditions of the first one. The calibration curves obtained by these tests are compared in Figure 9. It can be clearly observed that the two set of data points can be fitted almost well from the same linear relationship. The reported findings suggest that the electrochemical properties of the 2D-MoS2-MoO3CC network structure as well as the fabrication procedure of 2D-MoS2-MoO3CC/SPCE platform can be replicated very well, leading to different sensor devices with reproducible response.
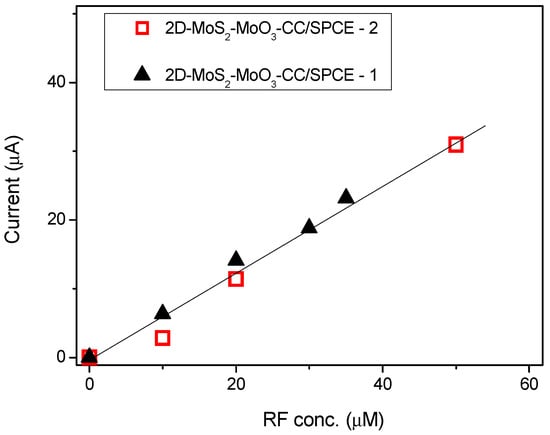
Figure 9.
Responses versus riboflavin concentrations with two different 2D-MoS2-MoO3CC/SPCE sensors. Sensors 2 was fabricated about one year after Sensor 1, using newly prepared 2D-MoS2 nanosheets.
The effect of some interferent biomolecules has been also investigated. Folic acid (FA), which is another vitamin of B group, and ascorbic acid (AA), a vitamin of C group, are considered as the main interferent analytes in the determination of RF. These two biomolecules are present in human body so it’s mandatory to verify if their presence affect the RF detection. Preliminary tests have shown that these compounds, in absence of RF, show no redox peak in the potential range where the RF peak is present. This is an expected result because, similarly to redox processes of most organic compounds, they take place in the positive potential range.
The effect of FA and AA on the determination of riboflavin has been investigated with our 2D-MoS2-MoO3CC/SPCE sensor. The test has been carried out at different concentrations of RF in presence of the two analytes. LSV curves measured in a solution of RF mixed with 100µM AA and 100µM FA are reported in Figure 10. The test shows clearly how the presence of the two interferent analytes decreases the RF current peak. This behavior can be explained assuming that FA and AA compete with RF for the interaction with a significant fraction of the active site on the sensing layer.
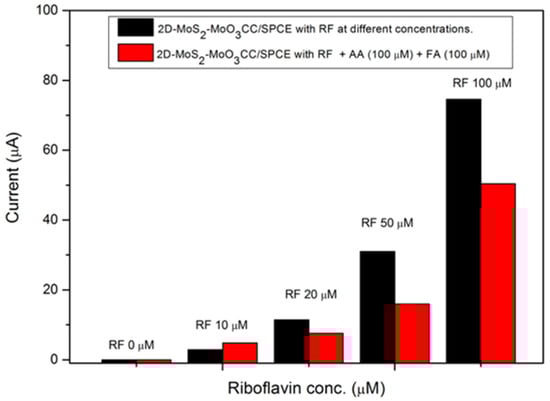
Figure 10.
Ipa current values registered by the 2D-MoS2-MoO3CC/SPCE sensor in presence of RF at different concentrations (black bars) and in co-presence (red bars) of FA and AA at 100 µM in 1 M PBS.
The above results indicate that the effects of interferents substances on the RF sensor response needs to be checked. As it is well known, the electrochemical characteristics of the biomolecules here investigated are largely dependent on pH [35,36,37]. This implies that it is possible to optimize the conditions at which riboflavin has the larger interaction with the electrode surface, which means that the sensor response will be probably less influenced by the presence of these interferent analytes. This is a general strategy which can be used for monitoring riboflavin in real samples [38,39], thus we have planned to investigate in detail this aspect aim at applying our developed sensor in real applications.
4. Conclusions
A 2D-MoS2-MoO3CC nanocomposite electrode was prepared and tested for the electrochemical detection of riboflavin in PBS. The modified platform was fabricated by layers of MoO3 and 2D-MoS2 nanosheets on the fiber of CC network structure. The MoO3 layer was grown on CC fibers through radio-frequency magnetron reactive sputtering. An additional layer of 2D-MoS2 nanosheets was casted, starting from a solution of MoS2 few-layers flakes produced by LPE.
The structure was used for fabricating a novel electrochemical platform with enhanced properties with respect to the conventional commercial devices and those prepared with the single constituents. Riboflavin electroxidation was observed at negative potential (around −0.55 V) and this can be regarded as an advantage, because most of the redox processes of organic compounds which can interfere with it take place at more positive potentials. Interference from folic and ascorbic acid has been observed to decrease the sensitivity of the sensor for riboflavin, although not dramatically.
The enhanced sensitivity of the 2D-MoS2-MoO3CC/SPCE sensor was attributed to the improved electron transport provided by the conductive CC structure network, as well as the enhancement of specific active sites for the electrocatalytic reduction/oxidation of RF on MoS2. This unique 2D-MoS2-MoO3CC/SPCE electrochemical platform resulted in a promising sensor device for the electroanalytical determination of riboflavin.
Author Contributions
The contribution of the authors to this paper is as follows: conceptualization, R.Z. and G.N.; methodology, G.N.; investigation, R.Z., A.F., M.G.D.; data curation, R.Z., G.N., P.G.G.; writing—R.Z, G.N.; writing—review and editing, G.N., M.G.D., P.G.G.; supervision, G.N. All authors have read and agreed to the published version of the manuscript.
Funding
This research received no external funding.
Institutional Review Board Statement
Not applicable.
Informed Consent Statement
Not applicable.
Conflicts of Interest
The authors declare no conflict of interest.
References
- Geim, A.K.; Novoselov, K.S. The rise of graphene. In Nanoscience and Technology; Co-Published with Macmillan Publishers Ltd.: London, UK, 2009; pp. 11–19. ISBN 978-981-4282-68-0. [Google Scholar]
- Neri, G. Thin 2D: The New Dimensionality in Gas Sensing. Chemosensors 2017, 5, 21. [Google Scholar] [CrossRef]
- Mak, K.F. Atomically Thin MoS2: A New Direct-Gap Semiconductor. Phys. Rev. Lett. 2010, 105. [Google Scholar] [CrossRef] [PubMed]
- Ganatra, R.; Zhang, Q. Few-Layer MoS2: A Promising Layered Semiconductor. ACS Nano 2014, 8, 4074–4099. [Google Scholar] [CrossRef] [PubMed]
- Zribi, R.; Maalej, R.; Messina, E.; Gillibert, R.; Donato, M.G.; Maragò, O.M.; Gucciardi, P.G.; Leonardi, S.G.; Neri, G. Exfoliated 2D-MoS2 Nanosheets on Carbon and Gold Screen Printed Electrodes for Enzyme-Free Electrochemical Sensing of Tyrosine. Sens. Actuators B Chem. 2020, 303, 127229. [Google Scholar] [CrossRef]
- Zribi, R.; Maalej, R.; Gillibert, R.; Donato, M.G.; Gucciardi, P.G.; Leonardi, S.G.; Neri, G. Simultaneous and Selective Determination of Dopamine and Tyrosine in the Presence of Uric Acid with 2D-MoS2 Nanosheets Modified Screen-Printed Carbon Electrodes. FlatChem 2020, 24, 100187. [Google Scholar] [CrossRef]
- Abid, K.; Belkhir, N.H.; Jaber, S.B.; Zribi, R.; Donato, M.G.; Di Marco, G.; Gucciardi, P.G.; Neri, G.; Maâlej, R. Photoinduced Enhanced Raman Spectroscopy with Hybrid Au@WS2 Nanosheets. J. Phys. Chem. C 2020. [Google Scholar] [CrossRef]
- Donato, M.G.; Messina, E.; Foti, A.; Smart, T.; Jones, P.H.; Iatì, M.A.; Saija, R.; Gucciardi, P.G.; Maragò, O.M. Optical Trapping and Optical Force Positioning of Two-Dimensional Materials. Nanoscale 2018, 10, 1245–1255. [Google Scholar] [CrossRef]
- Murugesan, D.; Moulaee, K.; Neri, G.; Ponpandian, N.; Viswanathan, C. α-MoO3 Nanostructure on Carbon Cloth Substrate for Dopamine Detection. Nanotechnology 2019, 30, 265501. [Google Scholar] [CrossRef]
- Zhao, S.; Zha, Z.; Liu, X.; Tian, H.; Wu, Z.; Li, W.; Sun, L.-B.; Liu, B.; Chen, Z. Core–Sheath Structured MoO3@MoS2 Composite for High-Performance Lithium-Ion Battery Anodes. Energy Fuels 2020, 34, 11498–11507. [Google Scholar] [CrossRef]
- Kang, J.; Feng, H.; Huang, P.; Su, Q.; Dong, S.; Jiao, W.; Chen, X.; Du, G.; Yu, Y.; Xu, B. Carbon Cloth Decorated with MoS2 Microflowers as Flexible Binder-Free Anodes for Lithium and Sodium Storage. Energy Technol. 2019, 7, 1801086. [Google Scholar] [CrossRef]
- Murugesan, D.; Prakash, S.; Ponpandian, N.; Manisankar, P.; Viswanathan, C. Two Dimensional α-MoO3 Nanosheets Decorated Carbon Cloth Electrodes for High-Performance Supercapacitors. Colloids Surf. Physicochem. Eng. Asp. 2019, 569, 137–144. [Google Scholar] [CrossRef]
- Liu, Y.; Ren, L.; Zhang, Z.; Qi, X.; Li, H.; Zhong, J. 3D Binder-Free MoSe 2 Nanosheets/Carbon Cloth Electrodes for Efficient and Stable Hydrogen Evolution Prepared by Simple Electrophoresis Deposition Strategy. Sci. Rep. 2016, 6, 22516. [Google Scholar] [CrossRef] [PubMed]
- Sari, F.N.I.; Ting, J.-M. MoS2/MoOx-Nanostructure-Decorated Activated Carbon Cloth for Enhanced Supercapacitor Performance. ChemSusChem 2018, 11, 897–906. [Google Scholar] [CrossRef] [PubMed]
- Suwannasom, N.; Kao, I.; Pruß, A.; Georgieva, R.; Bäumler, H. Riboflavin: The Health Benefits of a Forgotten Natural Vitamin. Int. J. Mol. Sci. 2020, 21, 950. [Google Scholar] [CrossRef]
- Goldsmith, G.A. Riboflavin Deficiency. In Riboflavin; Rivlin, R.S., Ed.; Springer: Boston, MA, USA, 1975; pp. 221–244. ISBN 978-1-4613-4419-3. [Google Scholar]
- Buehler, B.A. Vitamin B2: Riboflavin. J. Evid. Based Complement. Altern. Med. 2011, 16, 88–90. [Google Scholar] [CrossRef]
- Khaloo, S.S.; Mozaffari, S.; Alimohammadi, P.; Kargar, H.; Ordookhanian, J. Sensitive and Selective Determination of Riboflavin in Food and Pharmaceutical Samples Using Manganese (III) Tetraphenylporphyrin Modified Carbon Paste Electrode. Int. J. Food Prop. 2016, 19, 2272–2283. [Google Scholar] [CrossRef][Green Version]
- Lin, J.; Mei, Q.; Duan, Y.; Yu, C.; Ding, Y.; Li, L. A Highly Sensitive Electrochemical Sensor Based on Nanoflower-like MoS2-Ag-CNF Nanocomposites for Detection of VB2. ECS Meet. Abstr. 2020, MA2020-01, 1941. [Google Scholar] [CrossRef]
- Lavanya, N.; Radhakrishnan, S.; Sekar, C.; Navaneethan, M.; Hayakawa, Y. Fabrication of Cr Doped SnO2 Nanoparticles Based Biosensor for the Selective Determination of Riboflavin in Pharmaceuticals. Analyst 2013, 138, 2061–2067. [Google Scholar] [CrossRef]
- Cioates, C.N. Review—Electrochemical Sensors Used in the Determination of Riboflavin. J. Electrochem. Soc. 2020, 167, 037558. [Google Scholar] [CrossRef]
- Selvarajan, S.; Suganthi, A.; Rajarajan, M. A facile synthesis of ZnO/Manganese hexacyanoferrate nanocomposite modified electrode for the electrocatalytic sensing of riboflavin. J. Phys. Chem. Solids 2018, 121, 350–359. [Google Scholar] [CrossRef]
- Bagoji, A.M.; Nandibewoor, S.T. Redox Behavior of Riboflavin and Its Determination in Real Samples at Graphene Modified Glassy Carbon Electrode. Phys. Chem. 2016, 3, 12. [Google Scholar]
- Ferrari, A.C.; Robertson, J. Interpretation of Raman Spectra of Disordered and Amorphous Carbon. Phys. Rev. B 2000, 61, 14095–14107. [Google Scholar] [CrossRef]
- de Castro Silva, I.; Reinaldo, A.C.; Sigoli, F.A.; Mazali, I.O. Raman Spectroscopy-in Situ Characterization of Reversibly Intercalated Oxygen Vacancies in α-MoO3. RSC Adv. 2020, 10, 18512–18518. [Google Scholar] [CrossRef]
- Carvalho, B.R.; Malard, L.M.; Alves, J.M.; Fantini, C.; Pimenta, M.A. Symmetry-Dependent Exciton-Phonon Coupling in 2D and Bulk MoS2 Observed by Resonance Raman Scattering. Phys. Rev. Lett. 2015, 114, 136403. [Google Scholar] [CrossRef]
- Chakraborty, B.; Matte, H.S.S.R.; Sood, A.K.; Rao, C.N.R. Layer-Dependent Resonant Raman Scattering of a Few Layer MoS2: Raman Scattering of a Few Layer MoS2. J. Raman Spectrosc. 2013, 44, 92–96. [Google Scholar] [CrossRef]
- Placidi, M.; Dimitrievska, M.; Izquierdo-Roca, V.; Fontané, X.; Castellanos-Gomez, A.; Pérez-Tomás, A.; Mestres, N.; Espindola-Rodriguez, M.; López-Marino, S.; Neuschitzer, M.; et al. Multiwavelength Excitation Raman Scattering Analysis of Bulk and Two-Dimensional MoS2: Vibrational Properties of Atomically Thin MoS2 Layers. 2D Mater. 2015, 2, 035006. [Google Scholar] [CrossRef]
- Windom, B.C.; Sawyer, W.G.; Hahn, D.W. A Raman Spectroscopic Study of MoS2 and MoO3: Applications to Tribological Systems. Tribol. Lett. 2011, 42, 301–310. [Google Scholar] [CrossRef]
- Wang, Y.; Zhuang, Q.; Ni, Y. Fabrication of riboflavin electrochemical sensor based on homoadenine single-stranded DNA/molybdenum disulfide–graphene nanocomposite modified gold electrode. J. Electroanal. Chem. 2015, 736, 47–54. [Google Scholar] [CrossRef]
- Si, R.-W.; Yang, Y.; Yu, Y.-Y.; Han, S.; Zhang, C.-L.; Sun, D.-Z.; Zhai, D.-D.; Liu, X.; Yong, Y.-C. Wiring Bacterial Electron Flow for Sensitive Whole-Cell Amperometric Detection of Riboflavin. Anal. Chem. 2016, 88, 11222. [Google Scholar] [CrossRef]
- Mehmeti, E.; Stanković, D.M.; Chaiyo, S.; Švorc, Ľ.; Kalcher, K. Manganese dioxide-modified carbon paste electrode for voltammetric determination of riboflavin. Microchim. Acta 2016, 183, 1619. [Google Scholar] [CrossRef]
- Nezamzadeh Ejhieh, A.; Pouladsaz, P. Voltammetric Determination of Riboflavin Based on Electrocatalytic Oxidation at Zeolite-Modified Carbon Paste Electrodes. J. Ind. Eng. Chem. 2014, 20, 2146–2152. [Google Scholar] [CrossRef]
- Huang, D.-Q.; Wu, H.; Song, C.; Zhu, Q.; Zhang, H.; Sheng, L.-Q.; Xu, H.-J.; Liu, Z.-D. The Determination of Riboflavin (Vitamin B2) Using Manganese Dioxide Modified Glassy Carbon Electrode By Differential Pulse Voltammetry. Int. J. Electrochem. Sci. 2018, 13, 8303–8312. [Google Scholar] [CrossRef]
- Stefanov, C.; CioatesNegut, C.; Alexandra, L.; Gugoasa, D.; Frederick van Staden, J. Sensitive Voltammetric Determination of Riboflavin in Pharmaceutical and Biological Samples Using FSN-Zonyl-Nafion Modified Carbon Paste Electrode. Microchem. J. 2020, 155, 104729. [Google Scholar] [CrossRef]
- Lavanya, N.; Fazio, E.; Neri, F.; Bonavita, A.; Leonardi, S.G.; Neri, G.; Sekar, C. Electrochemical Sensor for Simultaneous Determination of Ascorbic Acid, Uric Acid And Folic Acid Based on Mn-SnO2 Nanoparticles Modified Glassy Carbon Electrode. J. Electroanal. Chem. 2016, 770, 23–32. [Google Scholar] [CrossRef]
- Lavanya, N.; Radhakrishnan, S.; Sudhan, N.; Sekar, C.; Leonardi, S.G.; Cannilla, C.; Neri, G. Fabrication of Folic Acid Sensor Based on the Cu Doped SnO2 Nanoparticles Modified Glassy Carbon Electrode. Nanotechnology 2014, 25, 295501. [Google Scholar] [CrossRef] [PubMed]
- Derakhshan, M.; Shamspur, T.; Molaakbari, E.; Mostafavi, A.; Saljooqi, A. Fabrication of a Novel Electrochemical Sensor for Determination of Riboflavin in Different Drink Real Samples. Russ. J. Electrochem. 2020, 56, 181–188. [Google Scholar] [CrossRef]
- Kowalczyk, A.; Sadowska, M.; Krasnodebska-Ostrega, B.; Nowicka, A.M. Selective and Sensitive Electrochemical Device for Direct VB2 Determination in Real Products. Talanta 2017, 163, 72. [Google Scholar] [CrossRef]
Publisher’s Note: MDPI stays neutral with regard to jurisdictional claims in published maps and institutional affiliations. |
© 2021 by the authors. Licensee MDPI, Basel, Switzerland. This article is an open access article distributed under the terms and conditions of the Creative Commons Attribution (CC BY) license (http://creativecommons.org/licenses/by/4.0/).