Article

Hierarchical Porous Carbon Electrodes with Sponge-Like Edge Structures for the Sensitive Electrochemical Detection of Heavy Metals

Department of Mechanical Engineering, Ulsan National Institute of Science and Technology (UNIST), 50 UNIST-gil, Eonyang-eup, Ulju-gun, Ulsan 44919, Korea
*
Author to whom correspondence should be addressed.
Sensors 2021, 21(4), 1346; https://doi.org/10.3390/s21041346
Submission received: 24 December 2020 / Revised: 11 February 2021 / Accepted: 12 February 2021 / Published: 14 February 2021
(This article belongs to the Special Issue Innovative Sensor Devices for the Environmental Monitoring)

Abstract

:
This article presents the development of a highly sensitive electrochemical heavy metal sensor based on hierarchical porous carbon electrodes with sponge-like edge structures. Micrometer-scale hierarchical nanoporous carbon electrodes were fabricated at a wafer-scale using cost-effective batch microfabrication technologies, including the carbon microelectromechanical systems technology and oxygen plasma etching. The sponge-like hierarchical porous structure and sub-micrometer edges of the nanoporous carbon electrodes facilitate fast electron transfer rate and large active sites, leading to the efficient formation of dense heavy metal alloy particles of small sizes during the preconcentration step. This enhanced the peak current response during the square wave anodic stripping voltammetry, enabling the detection of Cd(II) and Pb(II) at concentrations as low as 0.41 and 0.7 μg L−1, respectively, with high sensitivity per unit sensing area (Cd: 109.45 nA μg−1 L mm−2, Pb: 100.37 nA μg−1 L mm−2).

1. Introduction

Heavy metal ions can accumulate in the human body and cause serious damage to organs. For example, cadmium and lead cause disorders of the nervous system, kidney, liver, and bones, even at a small quantity [1]. The standard guidelines of the US Environmental Protection Agency (EPA) restrict the concentration of cadmium and lead in drinking water at 5 and 15 ppb, respectively [2]. The well-developed heavy metal analysis methods based on spectroscopy, such as inductively coupled plasma mass spectrometry, atomic absorption spectroscopy, and X-ray fluorescence (XRF) spectroscopy [3,4,5], can facilitate the detection of heavy metals at concentrations as low as parts per trillion in a laboratory [6]. However, these laboratory techniques require long analysis times and skilled personnel [7,8]. In addition, field detection is limited because of the bulky equipment size. Although portable XRF spectrometers are relatively free from these limitations, their limit of detection (LOD) is not sufficient for detecting heavy metal ions at parts per billion levels [9].
Owing to the simple configuration and small size, electrochemical and colorimetric analysis methods have been adopted for on-site heavy metal detection. In addition, these methods facilitate a more sensitive detection of multiple heavy metal ions at a lower cost, as compared to that of the portable XRF spectrometry [10,11,12]. Recently, Ying Gan et al. reported the successful detection of cadmium at concentrations as low as 1.12 ppb, using a colorimetric method; this concentration is much lower than the EPA standard for cadmium concentration in drinking water [13]. However, the colorimetric method still has limitations, such as a relatively complex sample preparation step and low sensitivity in the detection of multiple heavy metal ions, when compared to the electrochemical method [14]. Square wave anodic stripping voltammetry (SWASV) has been widely used for the electrochemical detection of heavy metals because multiple heavy metals can be distinguished with high sensitivity, according to their characteristic oxidation potential [15,16]. SWASV consists of two steps: (i) a preconcentration step in which the heavy metal ions in the analyte are concentrated by electrodeposition and (ii) an anodic removal step in which the electrodeposited metal alloy is oxidized to generate a peak current signal for each metal.
In early studies, mercury was employed as the electrode material for the anodic stripping method-based heavy metal sensors because it facilitates efficient amalgam formation, leading to high sensitivity and good reproducibility [17,18,19]. However, the toxicity of the mercury has limited its further application in heavy metal sensor electrodes, and bismuth has consequently received attention as a non-toxic electrode material [20,21]. For an electrochemical electrode of a heavy metal sensor, a nanoporous structure is generally used to enlarge the adsorption sites and improve the diffusion and local concentration of the target ions [22,23]. In particular, carbon-based porous electrodes are widely used in the bismuth-modified heavy metal sensors because of their good conductivity among the porous electrode materials, wide potential window, and low cost [20,21,24]. In addition, when the porous electrode has a hierarchical architecture, the electrode provides excellent advantages. For example, the macropores and mesopores enhance the diffusion of the electrochemical species into the nanopores; the adsorption sites are increased, facilitating excellent physical and chemical adsorption of metal ions; and the reaction kinetics is improved due to the small diffusion length in the 3D porous structure [25,26,27]. Previously, hierarchical nanoporous carbon electrodes fabricated by eco-friendly methods using biomass were developed to improve the heavy metal adsorption [25,26,28]. The biomass-induced nanoporous electrode-based heavy metal sensor allowed the sensitive detection of heavy metal ions at low concentrations.
In this study, we developed a highly sensitive heavy metal sensor based on patternable hierarchical nanoporous carbon electrode. The disk-shaped carbon electrode with hierarchical sponge-like porous networks was prepared by the fabrication technology of carbon microelectromechanical systems (C-MEMS) and microwave O2 plasma etching, which facilitated 6-inch wafer-scale batch fabrication, ensuring cost-effective sensor production. C-MEMS is capable of generating glassy carbon micro/nanostructures by pyrolyzing photosensitive polymer structures pre-patterned by using various lithography technologies, including photolithography and e-beam lithography [29,30]. The C-MEMS-based glassy carbon is a good electrode material for electrochemical analysis, owing to its advantageous properties, such as high thermal stability, excellent electrochemical stability, and a wide potential window [31]. For this reason, the glassy carbon microelectrodes have been widely used in a variety of electrochemical analysis applications, such as biomolecule detection [32,33], bacterial sensing [34], cell sensing [35], and heavy metal detection [36]. In addition, the glassy carbon has good corrosion resistance, allowing the heavy metal sensor to operate stably during the preconcentration and stripping steps in SWAV. In addition to the patternability of the C-MEMS-based microelectrode, nanowire forest-like porous surface can be formed in a facile manner, by treating polymer precursors, using O2 plasma prior to pyrolysis [37]. In this study, a hierarchical sponge-like porous networks could be formed via microwave O2 plasma, which generates high plasma density with low ion bombardment energy [38]. The sponge-like edge structure, as well as the large surface area derived from the hierarchical nanostructure, enabled efficient and conformal electrodeposition of the metals in the preconcentration step, leading to high sensitivity in the simultaneous detection of dual heavy metal ions, Cd(II) and Pb(II). In addition, the hierarchical nanoporous electrode exhibited a large current density (peak current/unit sensing area), facilitating heavy metal detection with a low LOD, even with a micrometer sized electrode. In this study, the effect of the hierarchical porous architecture on the heavy metal sensing was analyzed by comparing the preconcentration behaviors and the corresponding anodic stripping current signals of Cd and Pb ions, using carbon electrodes with different surface porosities. The reliability of the patternable hierarchical nanoporous carbon electrode-based heavy metal sensor was verified by using tap water spiked with heavy metal ions.

2. Materials and Methods

2.1. Materials

A negative photoresist (SU-8 2025, Kayaku Advanced Materials, Inc., Westborough, MA, USA) was used as the precursor for the pyrolyzed carbon electrode, while a positive photoresist (AZ 40 XT, Merk KGaA, Darmstadt, Germany) was used as the mask material for the insulation layer patterning. Potassium ferrocyanide (K4Fe(CN)6), potassium chloride (KCl), potassium sulfate (K2SO4), and standard solutions of Cd and Pb were purchased from Sigma-Aldrich (St. Louis, MO, USA). The standard solution of bismuth was purchased from Kanto Chemical Co., Inc. (Tokyo, Japan). Acetic acid (glacial, 99.7%) was purchased from Samchun Chemical Co. (Seoul, Korea). Sodium acetate trihydrate was purchased from Junsei Chemical Co., Ltd. (Tokyo, Japan). The buffered oxide etch (BOE) solution (JT Baker) was purchased from Fisher scientific (Waltham, MA, USA). Tap water was obtained from waterworks in Ulsan, South Korea.

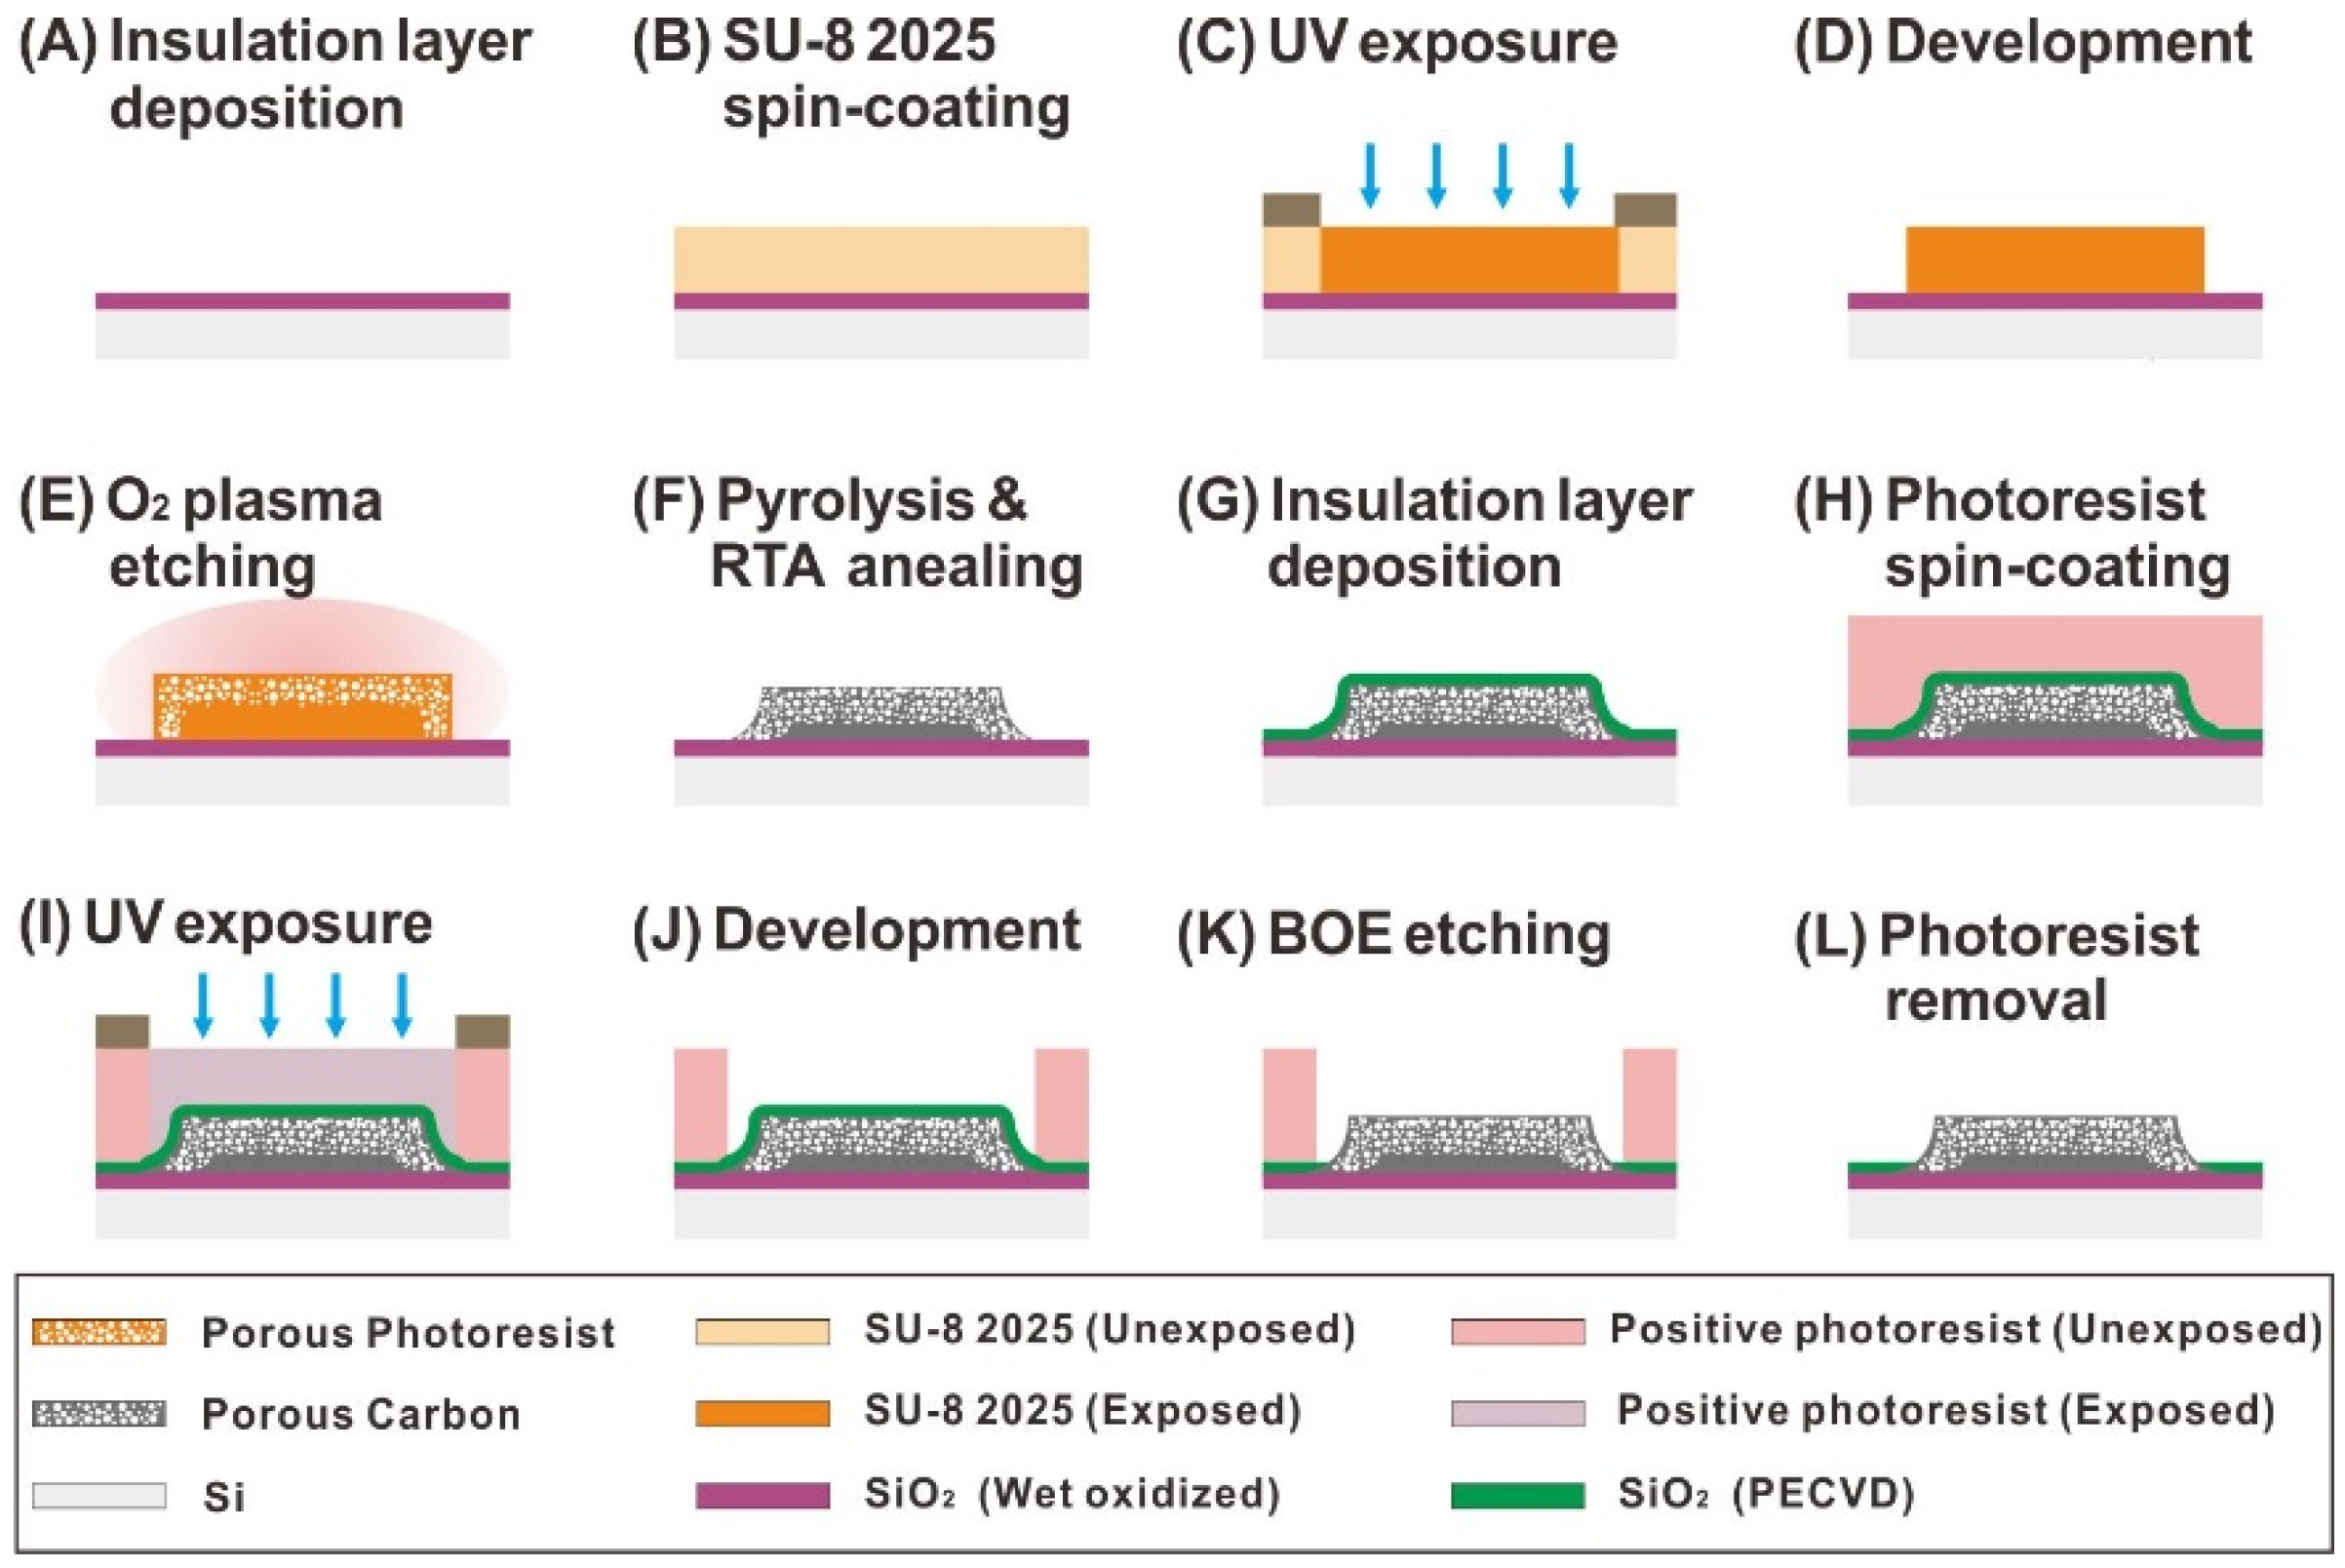
2.2. Fabrication of the Hierarchical Nanoporous Carbon Electrode with Sponge-Like Edge Structures

Hierarchical nanoporous-carbon-structure-based sensors of heavy metals were fabricated in a controllable manner through C-MEMS and O2 microwave plasma etching. The dimensions and geometries of the fabricated structures were inspected, using a surface profiler (P6, KLA Corporation, Milpitas, CA, USA) and a scanning electron microscope (Quanta200 FE-SEM, FEI Company, Hillsboro, OR, USA). First, 25 μm thick photoresist structures were patterned using the SU-8 2025 negative photoresist by UV-lithography on top of a thermally oxidized 6-inch silicon wafer, as shown in Figure 1A–D. Then, the surface of the photoresist was subjected to O2 microwave plasma etching (V15-G, KAMI, Linden, Germany), to controllably form a structure with surface porosity and sponge-like networks, as shown in Figure 1E. In this study, the surface porosity was controlled by changing the microwave plasma etching time, while the flow rate (O2 100 sccm), plasma power (500 W), and chamber pressure (60 mTorr) were fixed. After the oxygen-plasma-etching process, the photoresist structures were pyrolyzed in a vacuum furnace (DMTF15/145-400, Daemyoung Enterprise Co., Ltd., Gwangmyeong-si, Korea), to convert the polymer structures into carbon electrodes, while maintaining the surface porosity. To enhance the electrical conductivity, the pyrolyzed porous carbon electrodes were subsequently subjected to a rapid thermal-annealing process (KVR-6000, Korea Vacuum Tech., Ltd., Gimpo-si, Korea) at 1000 °C, as described in our previous report [39]. The nanoporous carbon electrodes were finally insulated with a silicon dioxide layer via plasma-enhanced chemical vapor deposition (PEH-600, SORONA Inc., Anseong-si, Korea), as shown in Figure 1G. The active sensing area of the nanoporous carbon electrodes was exposed through UV lithography and BOE wet-etching processes, as shown in Figure 1H–L.

2.3. Electrochemical Characterization of Hierarchical Nanoporous Carbon Electrodes

The electrochemical properties of the prepared nanoporous carbon electrodes with different surface morphologies were characterized by cyclic voltammetry (CV) and SWASV. A three-electrode system was used for all the electrochemical experiments; a commercial Ag/AgCl reference electrode (RE-1B, ALS Co., Ltd., Tokyo, Japan), a platinum wire, and the prepared nanoporous carbon electrodes were used as the reference, counter, and working electrode, respectively. The surface area of the electrode was determined electrochemically through CV in a 0.2 M K2SO4 solution, by scanning the working electrode from 0 to 0.8 V vs. an Ag/AgCl electrode. The electrochemical reactivity of the electrode surface was characterized, using CV of 10 mM K4Fe(CN)6 in 0.5 M KCl. The heavy metal alloy of bismuth, cadmium, and lead was electrodeposited at −1.4 V, to analyze the effect of the morphology of the electrode surface on the preconcentration behaviors. These electrochemical characterizations were performed, using a multi-potentiostat (CHI 1020, CH Instruments, Inc., Austin, TX, USA). The heavy-metal-detection capability of nanoporous carbon electrodes was evaluated by SWASV, using a potentiostat (Modulab XM MTS, Solatron Analytical, Hampshire, UK). Bismuth and the target heavy metals were electrodeposited in the form of an alloy on the nanoporous carbon electrodes at a reduction potential of −1.4 V vs. an Ag/AgCl electrode for 300 s. Then, the electrodeposited alloy was stripped with a square wave of 15 Hz frequency, 25 mV pulse amplitude, and 5 mV step potential; this resulted in anodic stripping current signals. The nanoporous carbon electrodes were electrochemically cleaned by applying 0.2 V vs. Ag/AgCl reference electrode for 60 s in 0.1 M NaAc buffer solution between each measurement. Tap water from Ulsan, South Korea, was used to validate the heavy metal sensor in the analysis of real samples. The tap water was spiked with Cd and Pb ions, and the solution was diluted with 0.1 M NaAc buffer at a 1:1 ratio. The composition of the carbon electrodes, according to O2-plasma-etching time, was analyzed by using X-ray photoelectron spectroscopy (XPS; ESCALAB 250XI, Thermo Fisher Scientific Inc., Waltham, MA, USA). The compositions of tap-water samples were analyzed by ICP-MS (Agilent 7700s, Agilent Technologies, Inc., Santa Clara, CA, USA).

3. Results and Discussion

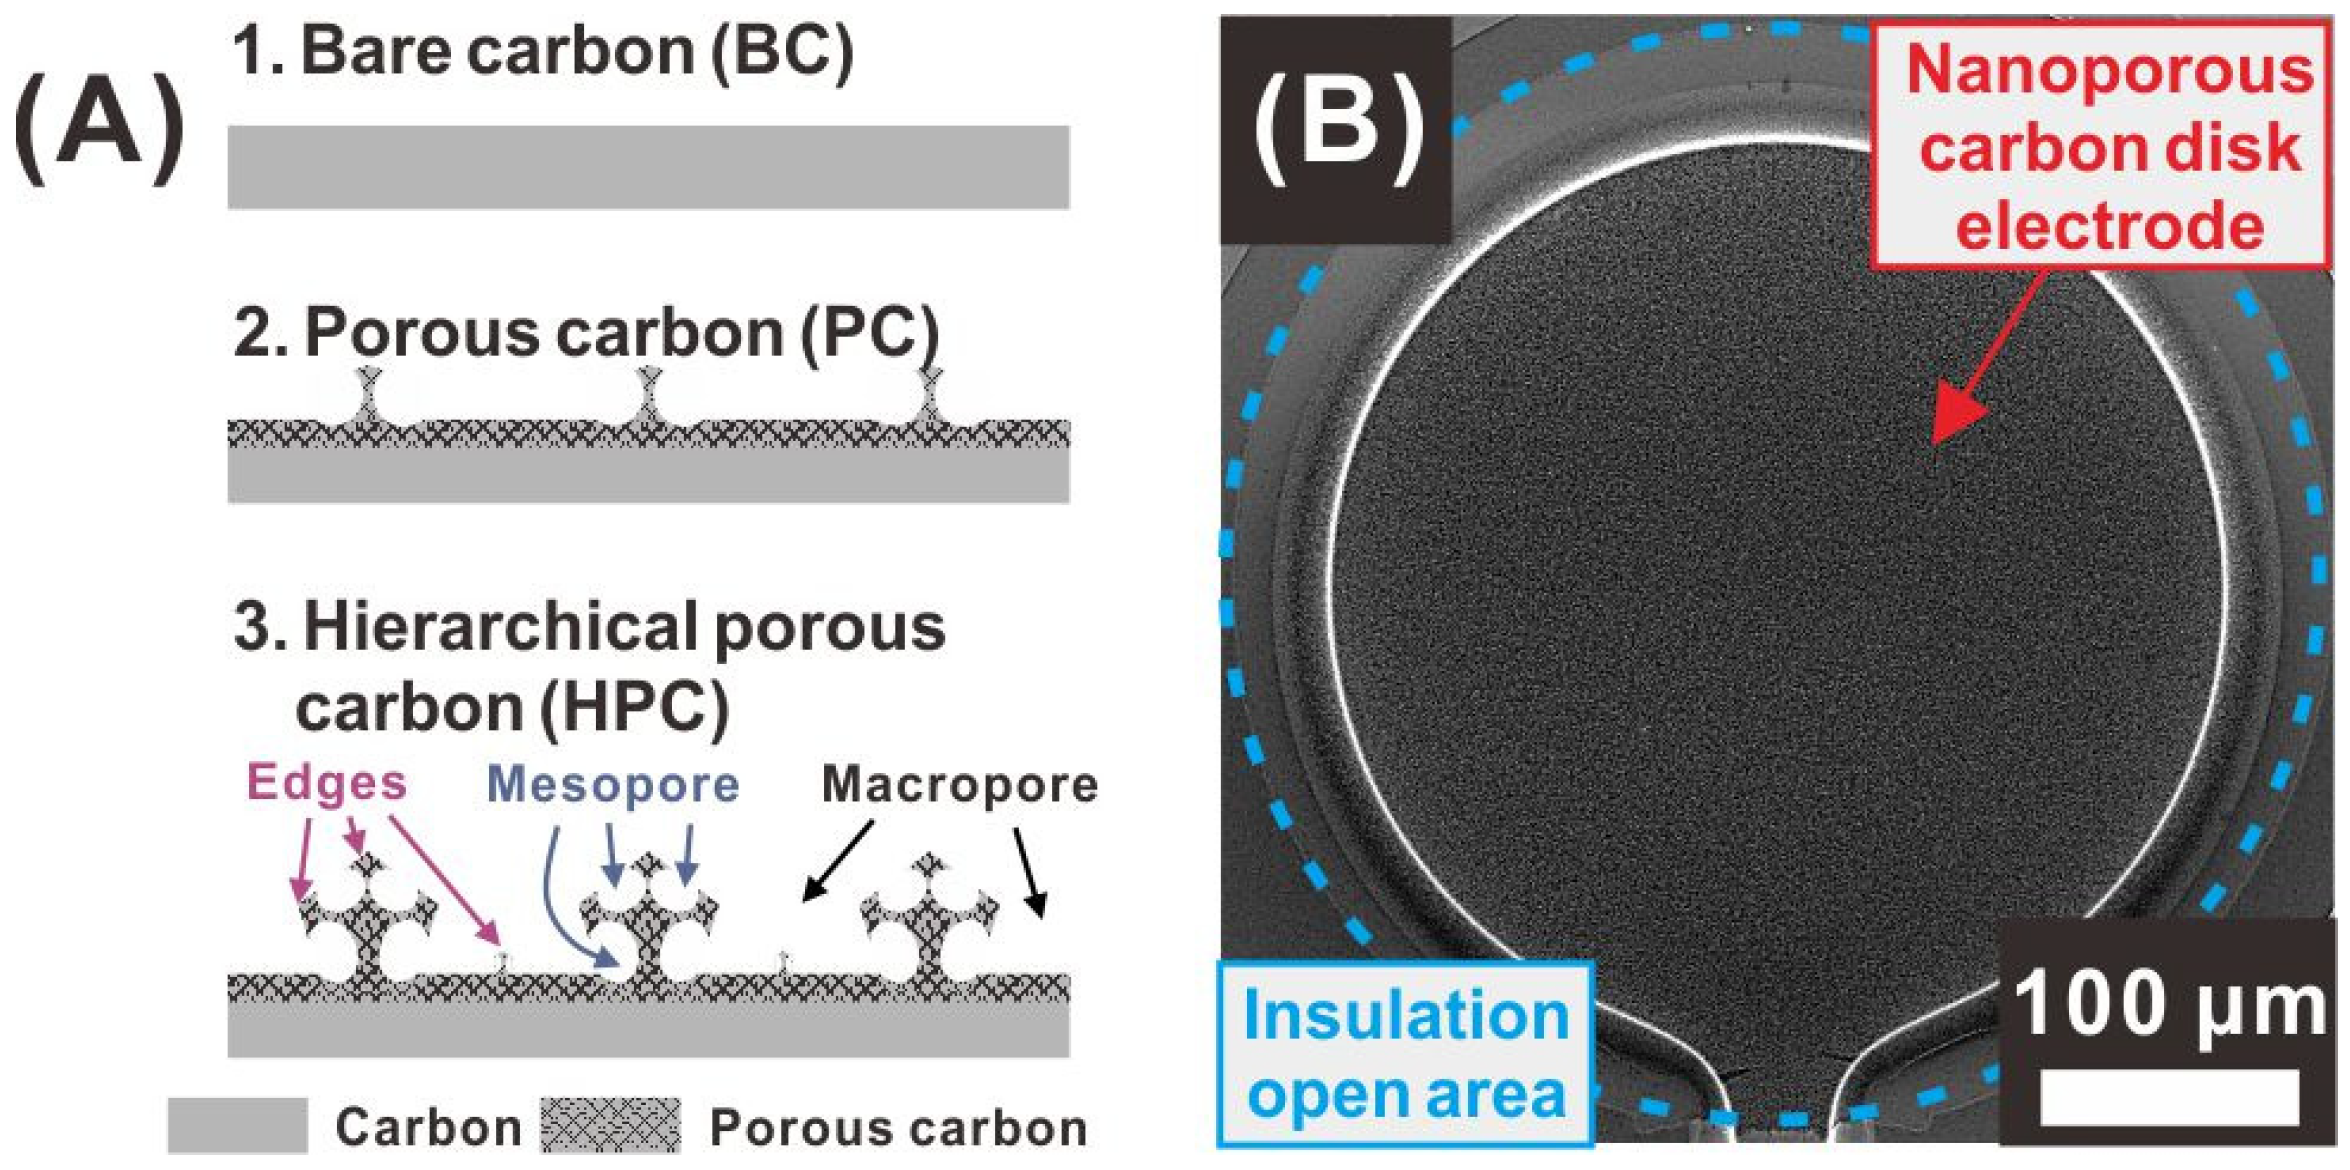
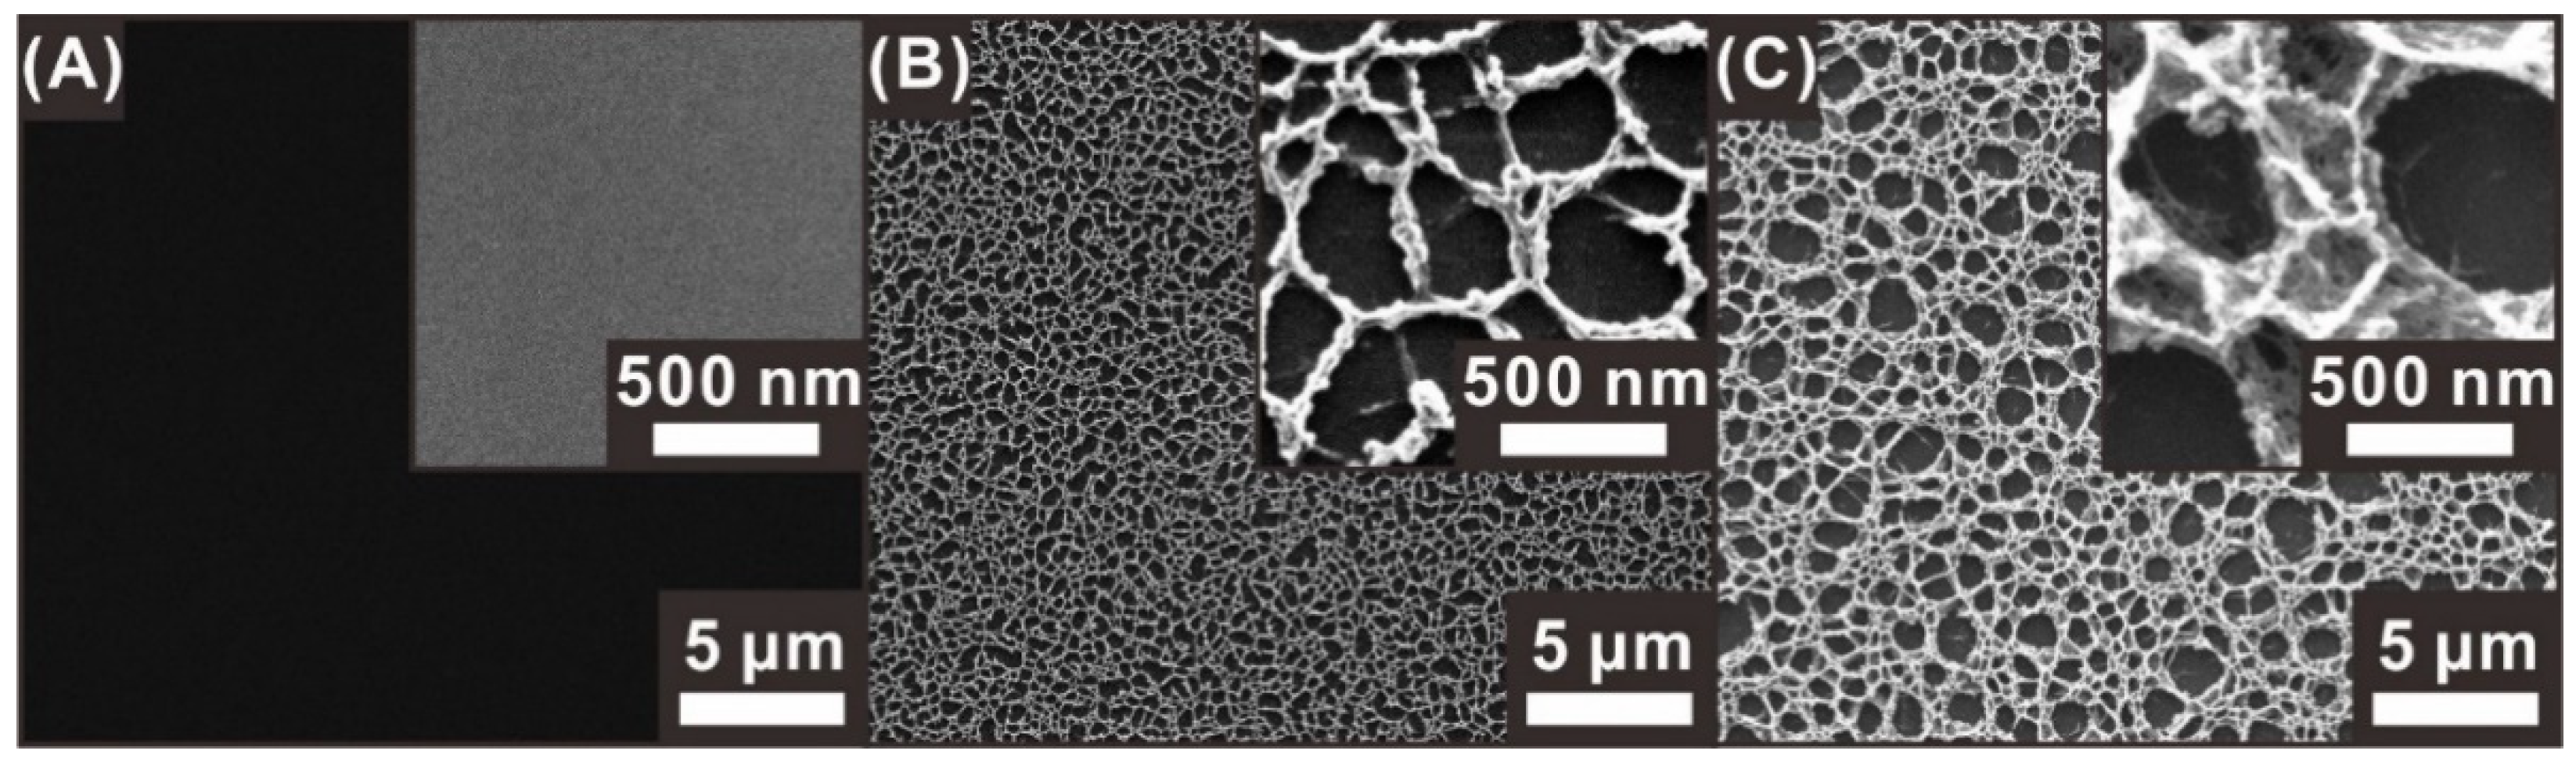
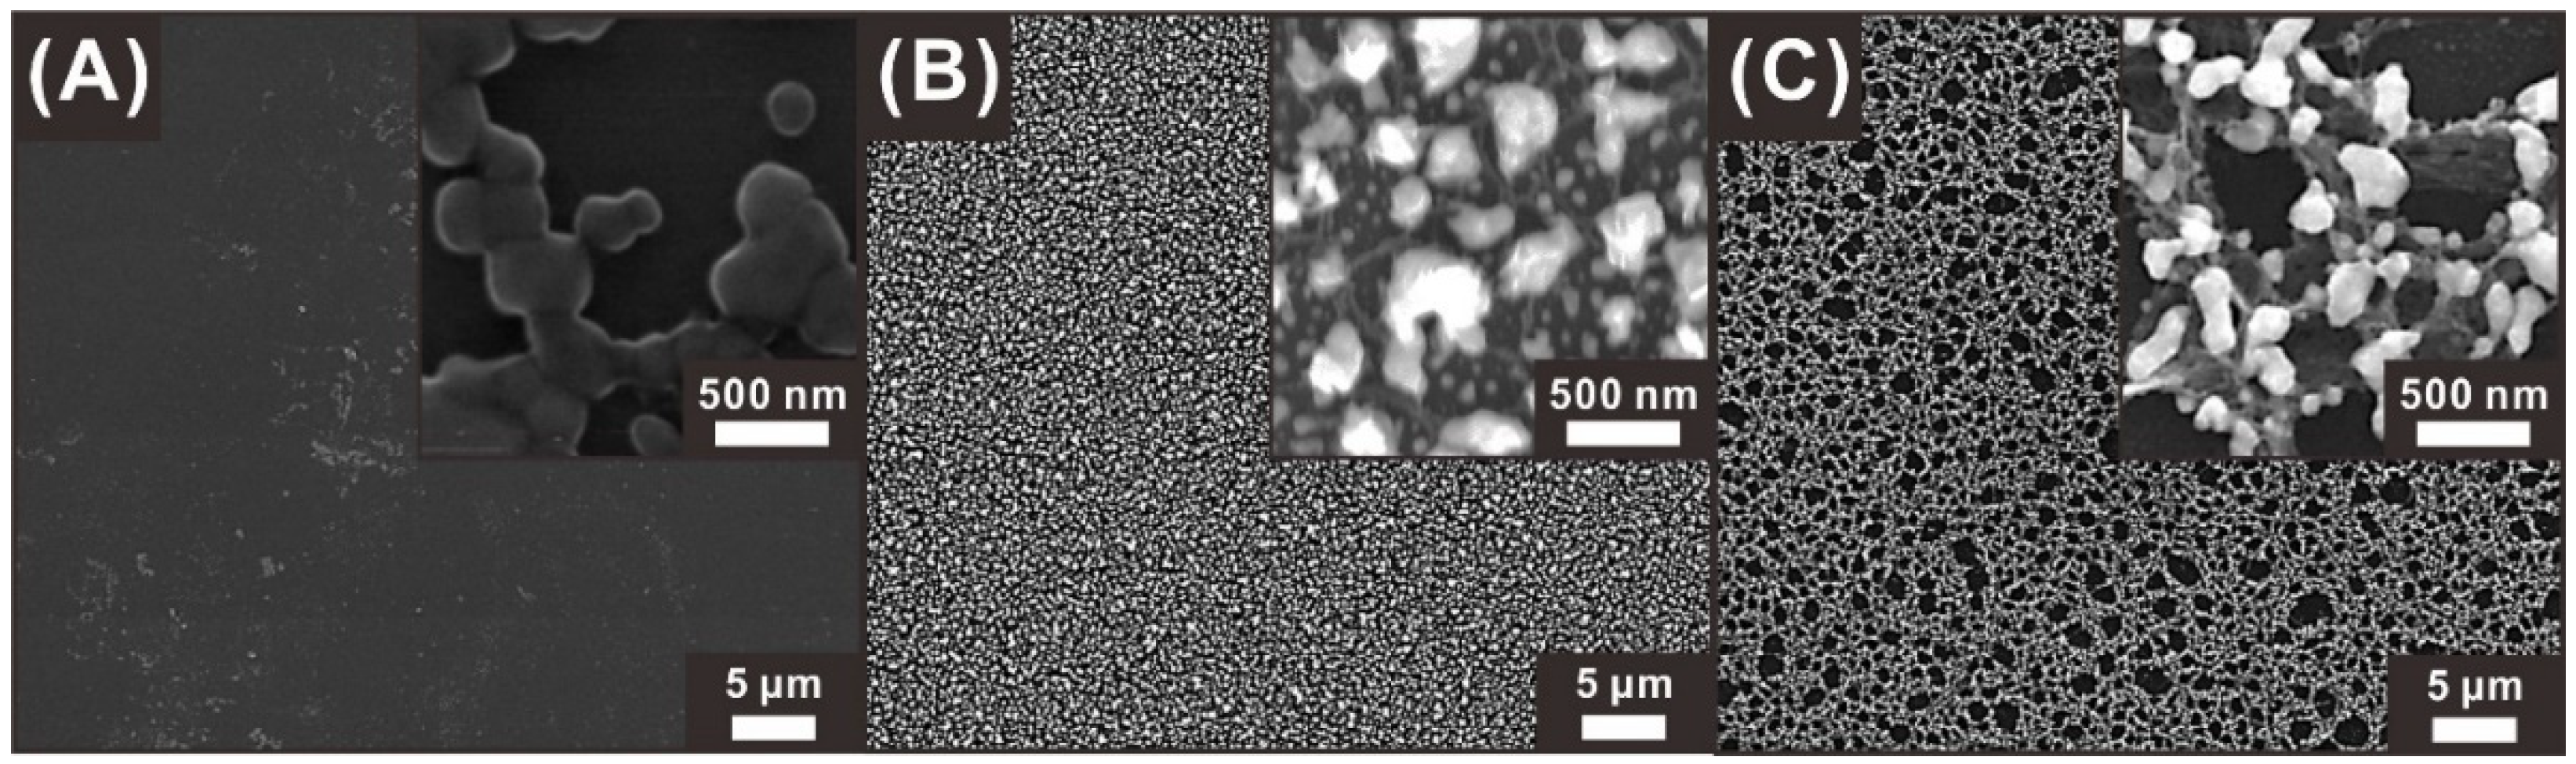
3.1. Morphology of the Nanoporous Carbon Electrode with a Sponge-Like Edge Structure

Three types of carbon electrodes with different porosities and surface morphologies are categorized as bare carbon (BC), porous carbon (PC), and hierarchical porous carbon (HPC), based on the surface porosity achieved depending on the O2-plasma-etching time (Figure 2A). In this study, microwave plasma was used to form nanoporous sponge-like networks on the surface of SU-8 photoresist structures. This negative photoresist polymer contains antimony ions that have a high etching resistance to O2 plasma, and these ions act as etch masks. In addition to this self-mask material, the difference between the etching rates of the aromatic and aliphatic parts of the photoresist also causes the formation of a nanoporous surface [37,40]. Furthermore, the microwave plasma-etching process generates etching species with low ion bombardment energy, leading to isotropic etching. Therefore, sponge-like nanoporous networks consisting of pores and narrow edge structures are formed instead of vertically aligned nanostructures, as illustrated in the sectional schematics of the PC and HPC electrodes (Figure 2A). As the plasma-etching proceeds, the polymer surface is removed progressively, and, thus, the top macropore size increases and additional nanoporous layers are formed below the top macropores, leading to the formation of sponge-like hierarchical porous networks, as shown in the sectional view of the HPC electrode in Figure 2A. The HPC, PC, and BC electrodes were prepared in the form of disks of 400 μm diameter, as shown in Figure 2B.
The surface morphology of each electrode was observed by scanning electron microscopy (SEM). Before the O2-plasma-polymer-etching process, the pyrolyzed carbon electrode (BC electrode) exhibited a smooth surface without any micro/nanostructures, as shown in Figure 3A. The PC electrode obtained by pyrolyzing a negative photoresist structure treated with an O2 plasma process for 300 s exhibited nanoscale edge networks, with micrometer-sized cavities, as shown in Figure 3B. A longer O2-plasma-etching process (900 s) resulted in the HPC electrode with a 3D sponge-like hierarchical nanoporous network, as shown in Figure 3C. This HPC electrode exhibited the largest cavity (50 nm to 2 μm) at the top surface and additional smaller porous networks formed below the pre-formed larger pore structures, leading to a higher surface area, compared to those of the PC and BC electrodes, as demonstrated in the ensuing section.

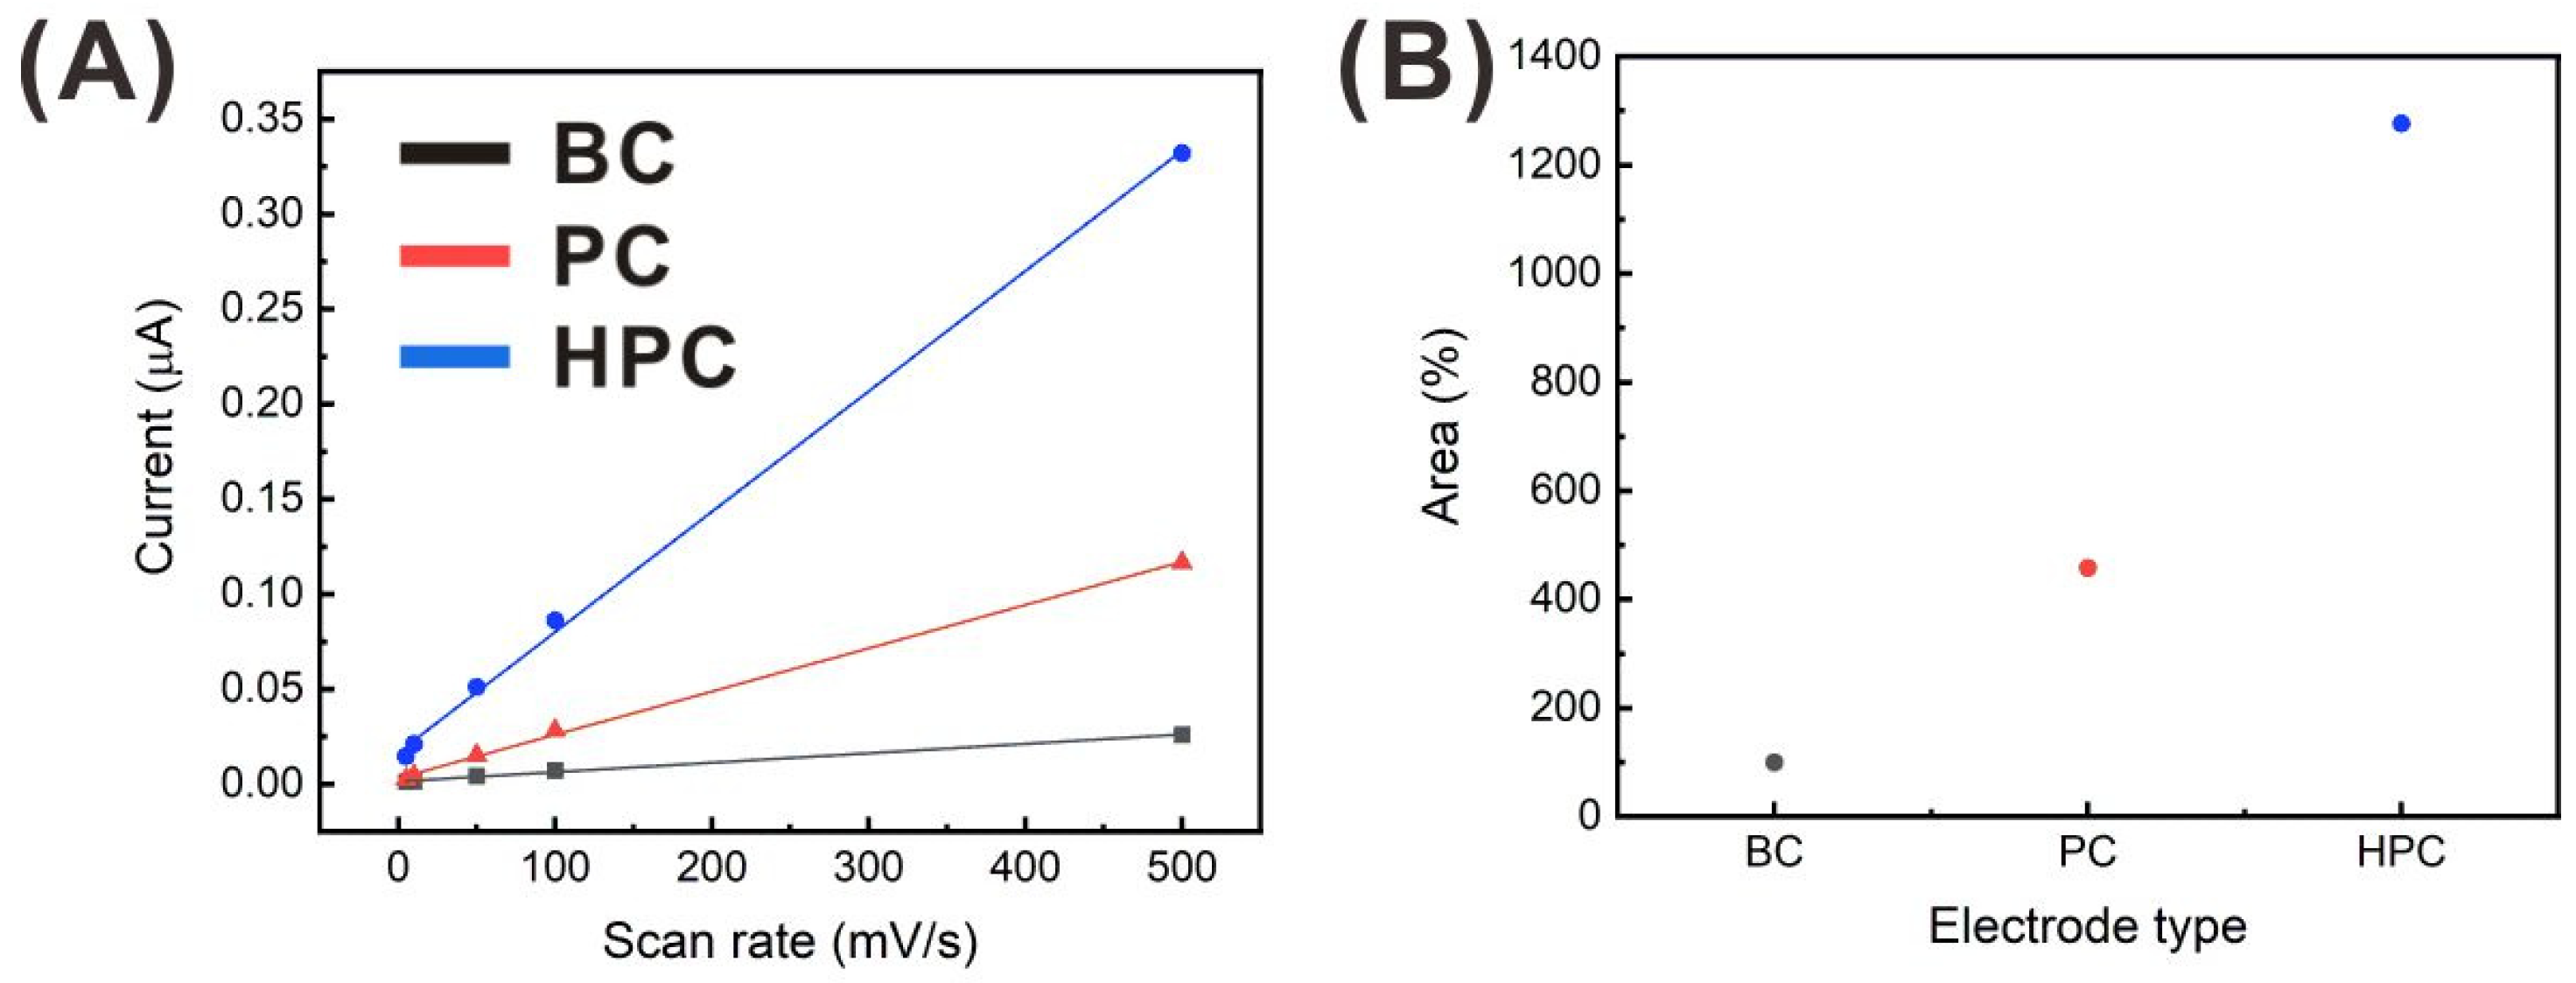
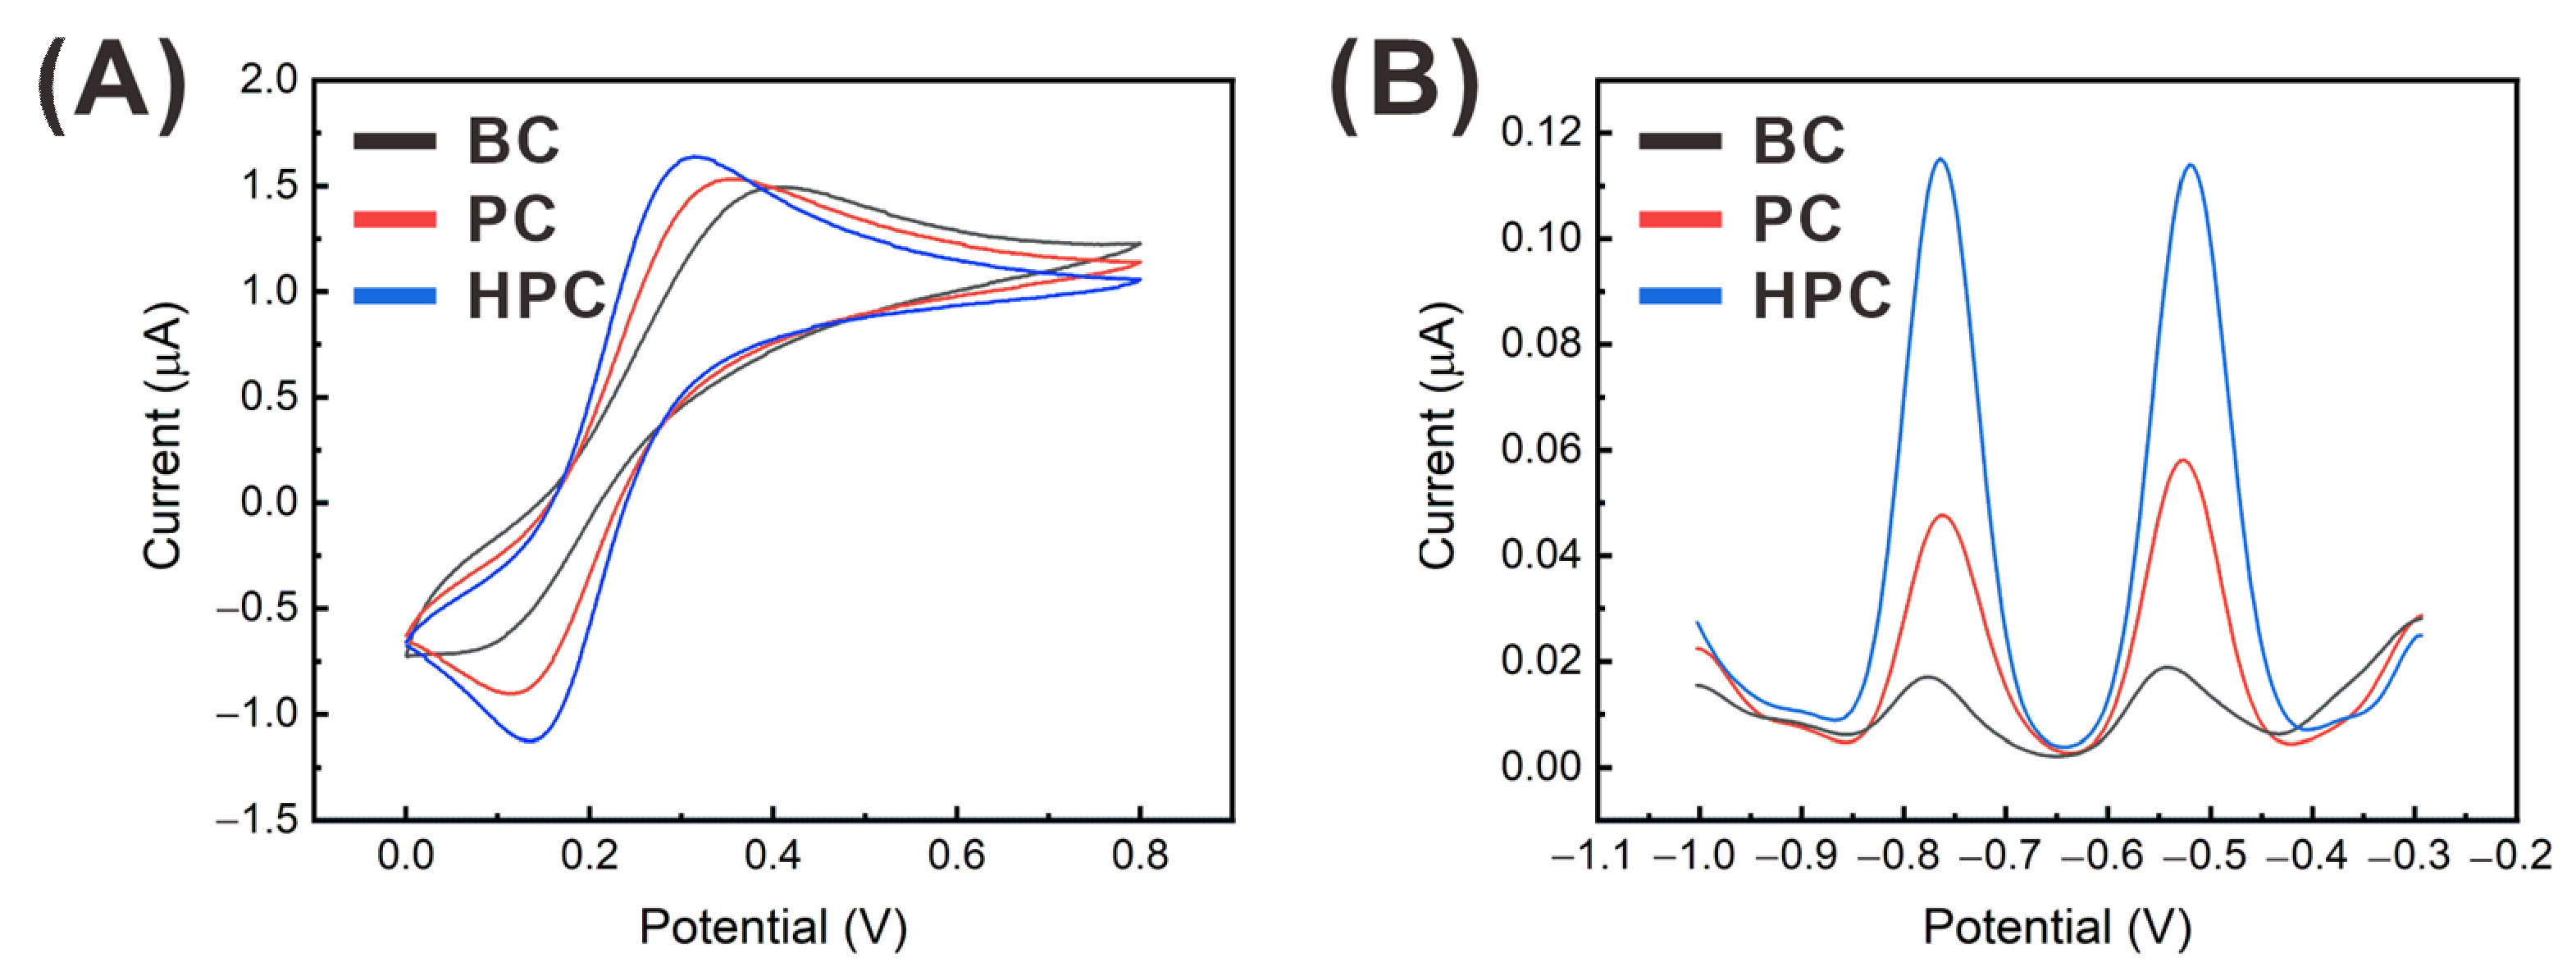
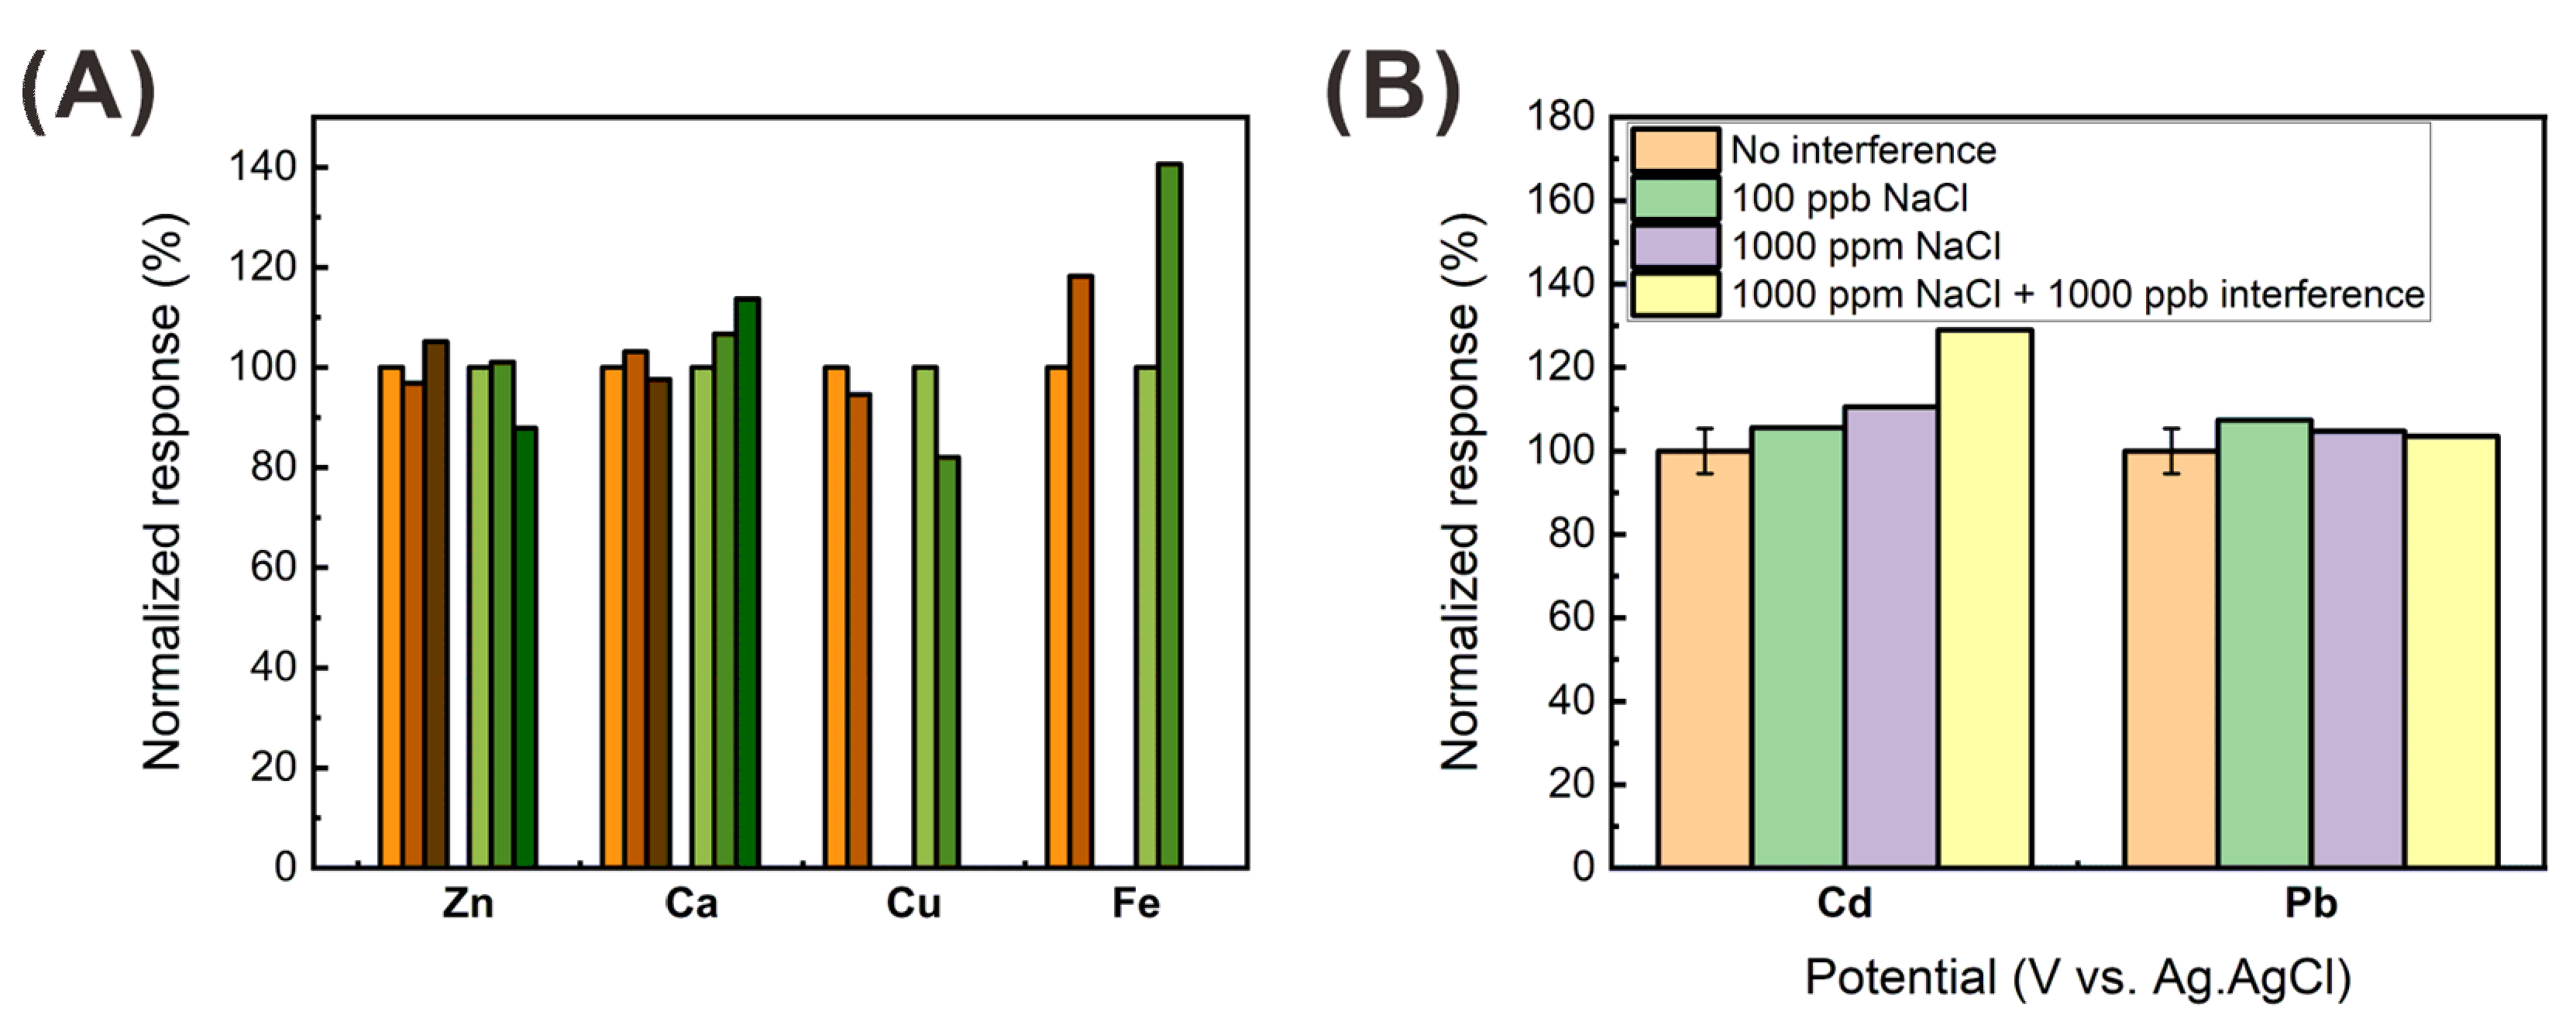
3.2. Effect of the Electrode Surface Properties on the Heavy Metal Detection

The effect of the plasma-etching time-dependent nanoporous morphology on the electrochemically active surface area (EASA) of the carbon electrodes was evaluated by using their double-layer capacitances calculated from CVs, as described by the following:
EASA = Cdl/Cs
where Cdl is the double-layer capacitance, and Cs is the specific capacitance of the standard materials [41,42]. First, the CVs were collected from a 0.2 M potassium sulfate solution at various scan rates, as shown in Supplementary Materials Figure S1. Then, the double-layer capacitance, which corresponds to the slope of the linear regression curve of the difference between the currents at the middle of the potential window ((ianodic, 0.4 V – icathodic, 0.4 V)/2) versus the scan rate (Figure 4A), was determined. The specific capacitance of the standard materials was assumed to be the same for all electrodes. Thus, the relative ratios of the EASA of the nanoporous electrodes (PC and HPC), compared to that of the BC electrode were estimated (Figure 4B), according to the linear relationship between the EASA and double-layer capacitance. The PC and HPC electrodes exhibited 4.6 and 12.8 times greater EASA than that of the BC electrode, respectively. As mentioned earlier, the hierarchical porous networks were well-developed in the HPC electrode, leading to the largest surface area.
The electrochemical properties of the carbon electrodes were characterized by using CV of 10 mM ferrocyanide in 0.5 M KCl, as shown in Figure 5A. As the porosity increased, the peak-to-peak separation (ΔEp) decreased, indicating enhanced surface reactivity. However, the diffusion-limited current did not change significantly and even decreased with the porosity, although the EASA values of the nanoporous electrodes were significantly higher than that of the BC electrode. This is because most of the electrochemical species are consumed at the top of the nanoporous surface, owing to the efficient electron transfer rate, and the deeper pore regions far from the bulk solution do not participate in the redox reaction [43]. In addition, it should be emphasized that the thickness of the carbon electrodes decreased with the O2-plasma-etching time (thickness: BC, 4.5 μm; PC, 3.7 μm; HPC, 3.4 μm), and, thus, the overall surface area was reduced.
The effect of the surface porosity of the carbon electrode on the SWASV-based heavy metal detection was evaluated with 10 μg L−1 of each of cadmium and lead, and 400 μg L−1 of bismuth in a NaAc buffer solution. The stripping peak currents were observed between −0.7 and −0.8 V for cadmium and −0.45 to −0.6 for lead, and the current signals increased with increasing the porosity, as shown in Figure 5B. Compared to the increase in the electrochemical performance with the porosity demonstrated by the CV tests, the SWASV peak current was more significantly enhanced. For further analyzing the reason for the enhanced sensing performance of the HPC electrode, the preconcentration behaviors were investigated according to the surface morphology.
In the preconcentration step, the deposition behavior of the heavy metal ions is affected by the surface morphology of the electrode, and this behavior strongly affects the anodic current signals in the detection of heavy metal ions. Thus, the effect of the porous surface morphology on the heavy metal detection was investigated by studying the electrodeposition behavior of the alloys of cadmium and lead with bismuth on the three carbon electrodes (BC, PC, and HPC). For a clear observation of the heavy metal alloy, excessive amounts of cadmium (10 mg L−1) and lead (10 mg L−1) were electrodeposited on each type of the electrode for 30 min (–1.4 V vs. Ag/AgCl electrode), without an anodic stripping step. The bismuth concentration was fixed at the heavy metal detection condition (400 μg L−1 in the NaAc buffer). The heavy metal alloy deposition differed in shape and distribution, depending on the surface porosity of the electrodes, as shown in SEM images and corresponding energy-dispersive X-ray spectroscopy (EDS) mapping. The BC electrode exhibited relatively large heavy metal alloy islands that were irregularly distributed at a low density (Figure 6A and Supplementary Materials Figure S2). The EDS mapping exhibited a negligible amount of Bi, because excessive amount of Pb and Cd were deposited as mentioned above. In contrast, metal alloy particles were deposited at a significantly higher density on the PC electrode surface. Specifically, the metal particles were mainly located on the edges of the macropores, as shown in Figure 6B and Supplementary Materials Figure S3. The HPC also exhibited similar behavior as that of the PC electrode, but the metal particles were distributed deeper in the hierarchical nanoporous network with smaller particle sizes than those on the PC electrode (Figure 6C and Supplementary Materials Figure S4). During the electrodeposition, protruded features of the electrode function as more electrochemically active sites, owing to the enhanced local electric field, leading to more efficient deposition on them than on the planar electrode region [22,23]. Therefore, metal particles were deposited along the sponge-like edge networks of the nanoporous carbon electrode surface, resulting in conformal and dense particle deposits. In addition, as the porosity increased, the particle size decreased due to the enlarged active sites under the fixed metal ion concentration condition. Therefore, this conformal and dense deposition of heavy metal alloy particles enhanced the anodic-stripping current signal. Moreover, the smaller metal particles formed on the HPC electrode facilitated more efficient anodic stripping, owing to the larger surface-to-volume ratio of the particle.
The XPS measurements were carried out to analyze the composition change of the pyrolyzed carbon electrodes, according to O2-plasma-etching time. In the C1s region, no significant difference in peak intensity at 283.7 eV, which represents aromatic and aliphatic carbons, was shown between BC, PC, and HPC electrodes (Supplementary Materials Figure S5A). In contrast, the PC and HPC electrodes show higher peak intensities compared to the BC electrode in the O1s spectra region (Supplementary Materials Figure S5B). Therefore, the atomic ratio of O/C increases with the oxygen-plasma-etching time. The reason for this can be inferred from the previous study on the oxygen-plasma-treated SU-8, using XPS by Lim et al. [38]: As the O2 plasma etching proceeds, the atomic ratio of O/C increases due to the partial oxidation on the SU-8 surface [44]. Thus, the enhancement of the adsorption of the heavy metal ions in the oxygen-plasma-treated carbon can be attributed to the evolved oxygen-containing functional groups [26].
In conclusion, the increased EASA of the hierarchical nanoporous electrode did not significantly enhance the Faradaic reaction, but the well-developed networks of sponge-like edges and enhanced oxygen functional group facilitated the formation of dense small metal alloy particles, leading to enhanced heavy-metal-detection capability.

3.3. Optimization of the Preconcentration Conditions

As stated in the previous section, the HPC exhibited the best heavy-metal-sensing capability, owing to its enhanced surface reactivity and adsorption capability. Therefore, the HPC electrode was used for further heavy-metal-sensing studies. First, the effects of preconcentration conditions, including the pH, potential, duration, and Bi concentration on the anodic stripping current signal, were analyzed, using the HPC electrode. The maximum stripping current response was obtained at pH 4.5 for both the cadmium and lead ions, as shown in Supplementary Materials Figure S6A. The peak current response increased as the HPC electrode was biased at higher magnitudes of the negative potential and decreased beyond −1.4 V, because of the adverse effect of hydrogen evolution (Supplementary Materials Figure S6B). With the pH and potential fixed at 4.5 and –1.4 V, respectively, the duration and Bi concentration of the preconcentration step were optimized. The current signals corresponding to both the ions, cadmium and lead, increased continuously with increasing preconcentration time (until 300 s) and Bi concentration (up to 400 μg L−1), and then saturated (Supplementary Materials Figure S6C,D). Therefore, these conditions were selected for heavy metal sensing.

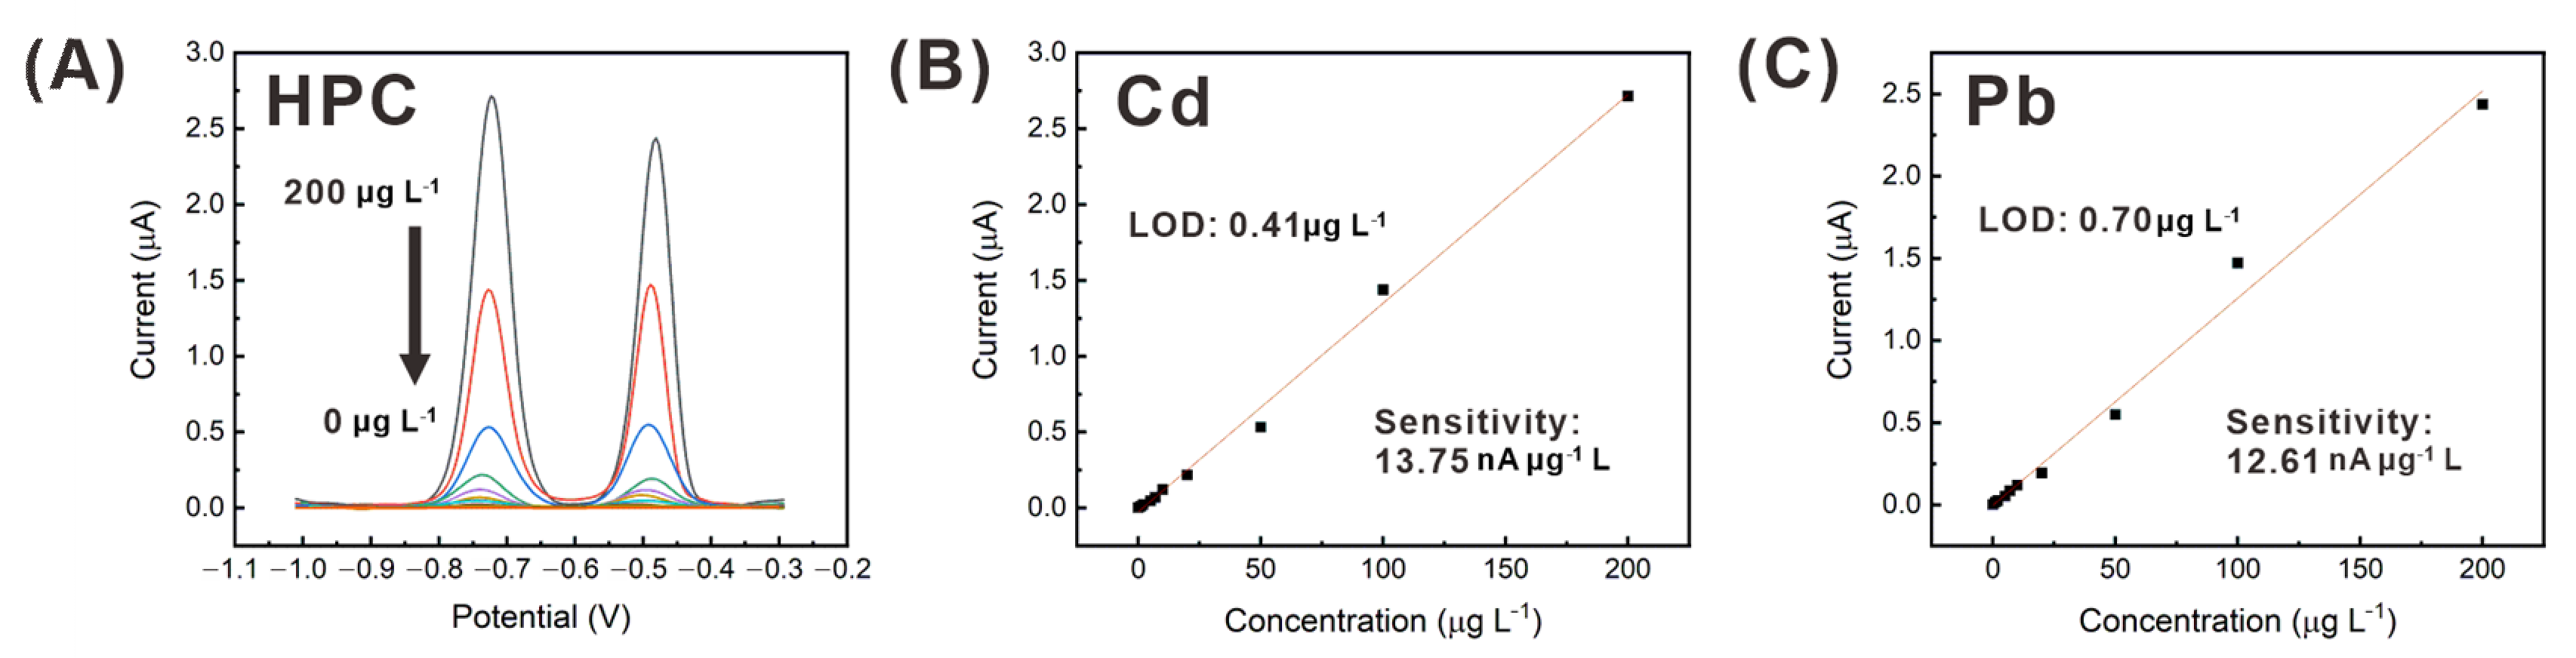
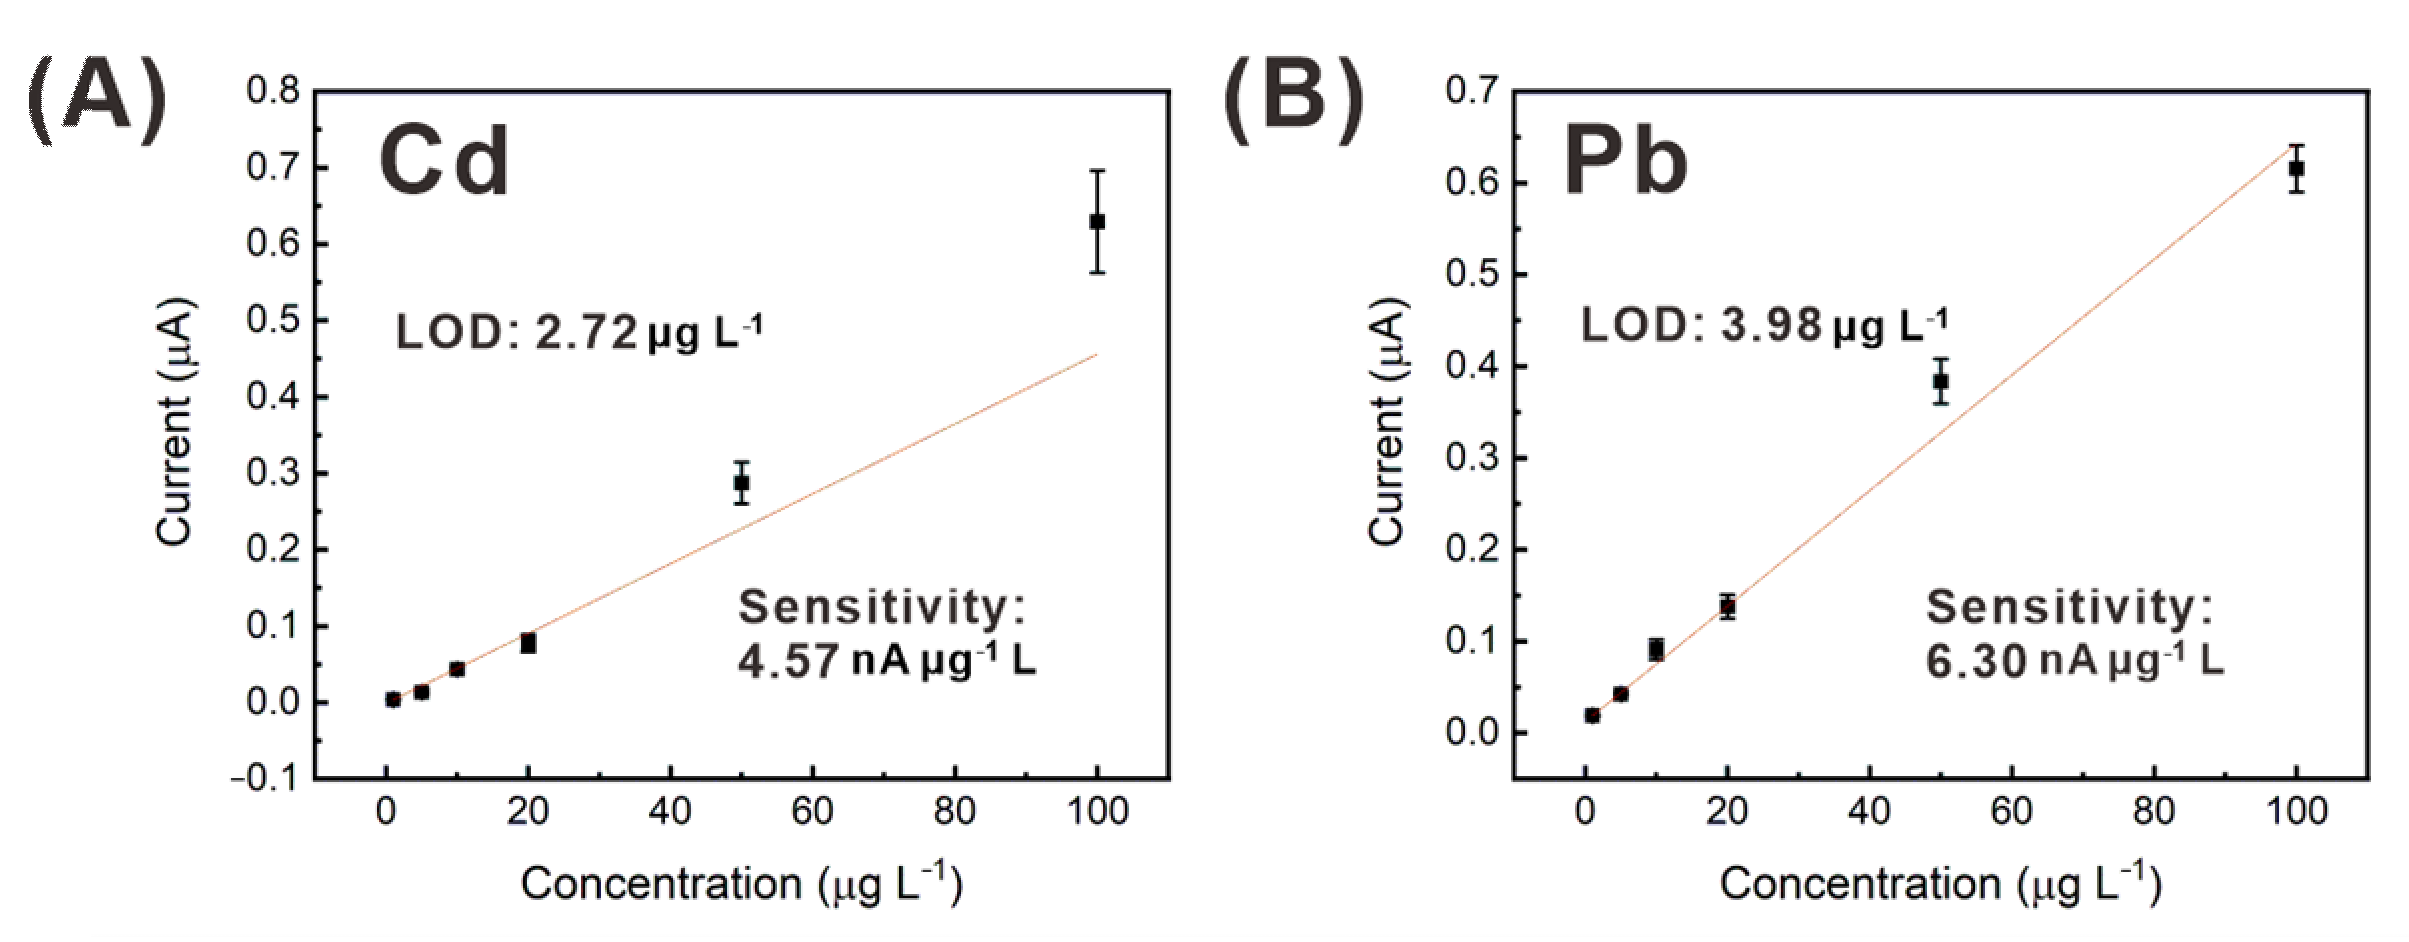
3.4. Simultaneous Detection of Cadmium and Lead, Using the HPC Electrode

Based on the in situ formation of the bismuth alloy and the acquisition of the current signal by SWASV, cadmium and lead were detected simultaneously at various concentrations (0–200 μg L−1), using HPC electrodes. Distinct peak currents in the ranges of −0.7 to −0.8 V and −0.45 to −0.55 V were obtained from cadmium and lead, respectively, as shown in Figure 7A. A shift in the peak potential was observed upon varying the heavy metal concentrations. Nevertheless, the peak potentials from cadmium and lead in the concentration range of 0 to 200 μg L−1 could be clearly distinguished. Further, the peak current signals from the SWASV results (Figure 7A) were plotted as a function of the heavy metal concentration to analyze the performance of the HPC electrode-based heavy metal sensors, as represented in Figure 7B,C. The sensor showed a linear relationship between the peak current signal and concentration over a wide range of the heavy metal concentration (0–200 μg L−1). Thus, the reliability of the sensor in the detection of cadmium and lead was evaluated by using a linear regression line. The HPC electrode showed a linear correlation with good R2 value (cadmium: 0.996, lead: 0.990) over the entire concentration range, facilitating excellent LOD (cadmium: 0.41 μg L−1, lead: 0.7 μg L−1, S/N = 3). The LOD values were calculated based on the linear regression line of the current signals at various heavy metal concentrations, as described in Equation (2):
LOD = a + 3Sa
where a is the y-intercept, and Sa is the standard deviation of the y-intercept [45]. These LOD values are much lower than the EPA standard for drinking water (cadmium: 5 μg L−1, lead: 15 μg L−1) [2]. Such detection of cadmium and lead at very low concentrations, using the small-sized electrode (0.1256 mm2), was enabled by the high sensitivity per unit sensing area (cadmium: 109.45 nA μg−1 L mm−2, lead: 100.37 nA μg−1 L mm−2), owing to the good surface reactivity and large active site area of the hierarchical sponge-like edge structures.
To investigate the applicability of the present heavy metal sensor based on HPC to practical applications, the reproducibility and long-term stability were tested. Five different HPC electrodes were prepared, and their electrochemical current signals of 200 ppb of Cd and Pb were measured once a month over two months. As shown in Figure 8, the sensors exhibited a relatively good reproducibility of 7.8% RSD, when comparing the sensor signals between sensors. In addition, the current signal from sensors exhibited a slight deviation of 6.6% RSD when the sensors were reused after each one-month storage at atmospheric conditions.
The selectivity of the HPC-based heavy metal sensor was evaluated in the presence of other potentially interfering metal ions and inorganic anions, such as Cu, Zn, Ca, Fe, Na, and Cl. Tap water in Ulsan, South Korea, was reported to contain negligible amounts of Cd, Pb, Cu, and Fe, and 41.5 ppm of chloride ion, according to the accredited test result of Korea Laboratory Accreditation Scheme, which was signed by the ILAC-MRA. In addition, we confirmed that negligible amounts of Cd, Pb, Cu, and Fe were contained in the tap-water sample, using ICP-MS, as shown in Supplementary Materials Table S1. Thus, in this study, the peak current signals of 20 ppb cadmium and lead were measured with the presence of 100 ppb Zn, Ca, Cu, and Fe, as shown in Figure 9A. This test was also performed with excessive amounts of Ca and Zn (20 ppm). In the presence of Zn and Ca, the current signals of Cd and Pb changed to less than 3.2 and 6.7%. In contrast, Cu and Fe induced comparably larger signal change. However, this relatively large signal change (Cd: ~18%, Pb: ~40%) corresponds to only 2.9 and 6.2 ppb difference in Cd and Pb detection, respectively, owing to the high sensitivity of the HPC-based sensor. The effect of NaCl on the heavy metal detection was also evaluated by measuring the peak currents of Pb and Cd, in the presence of various concentrations of NaCl and the mixture of 1000 ppm NaCl and 1000 ppb metal ions (Zn, Ca, Cu, Fe), as shown in Figure 9B. The organic anion also exhibited minor change in Cd and Pb detection by 1.7 and 0.7 ppb, respectively. Considering that Cu and Fe are contained in the tap water less than 100 ppb, the presented heavy metal sensor showed acceptable selectivity for the detection of Cd and Pb ions in the presence of the various interfering metal and inorganic ions.

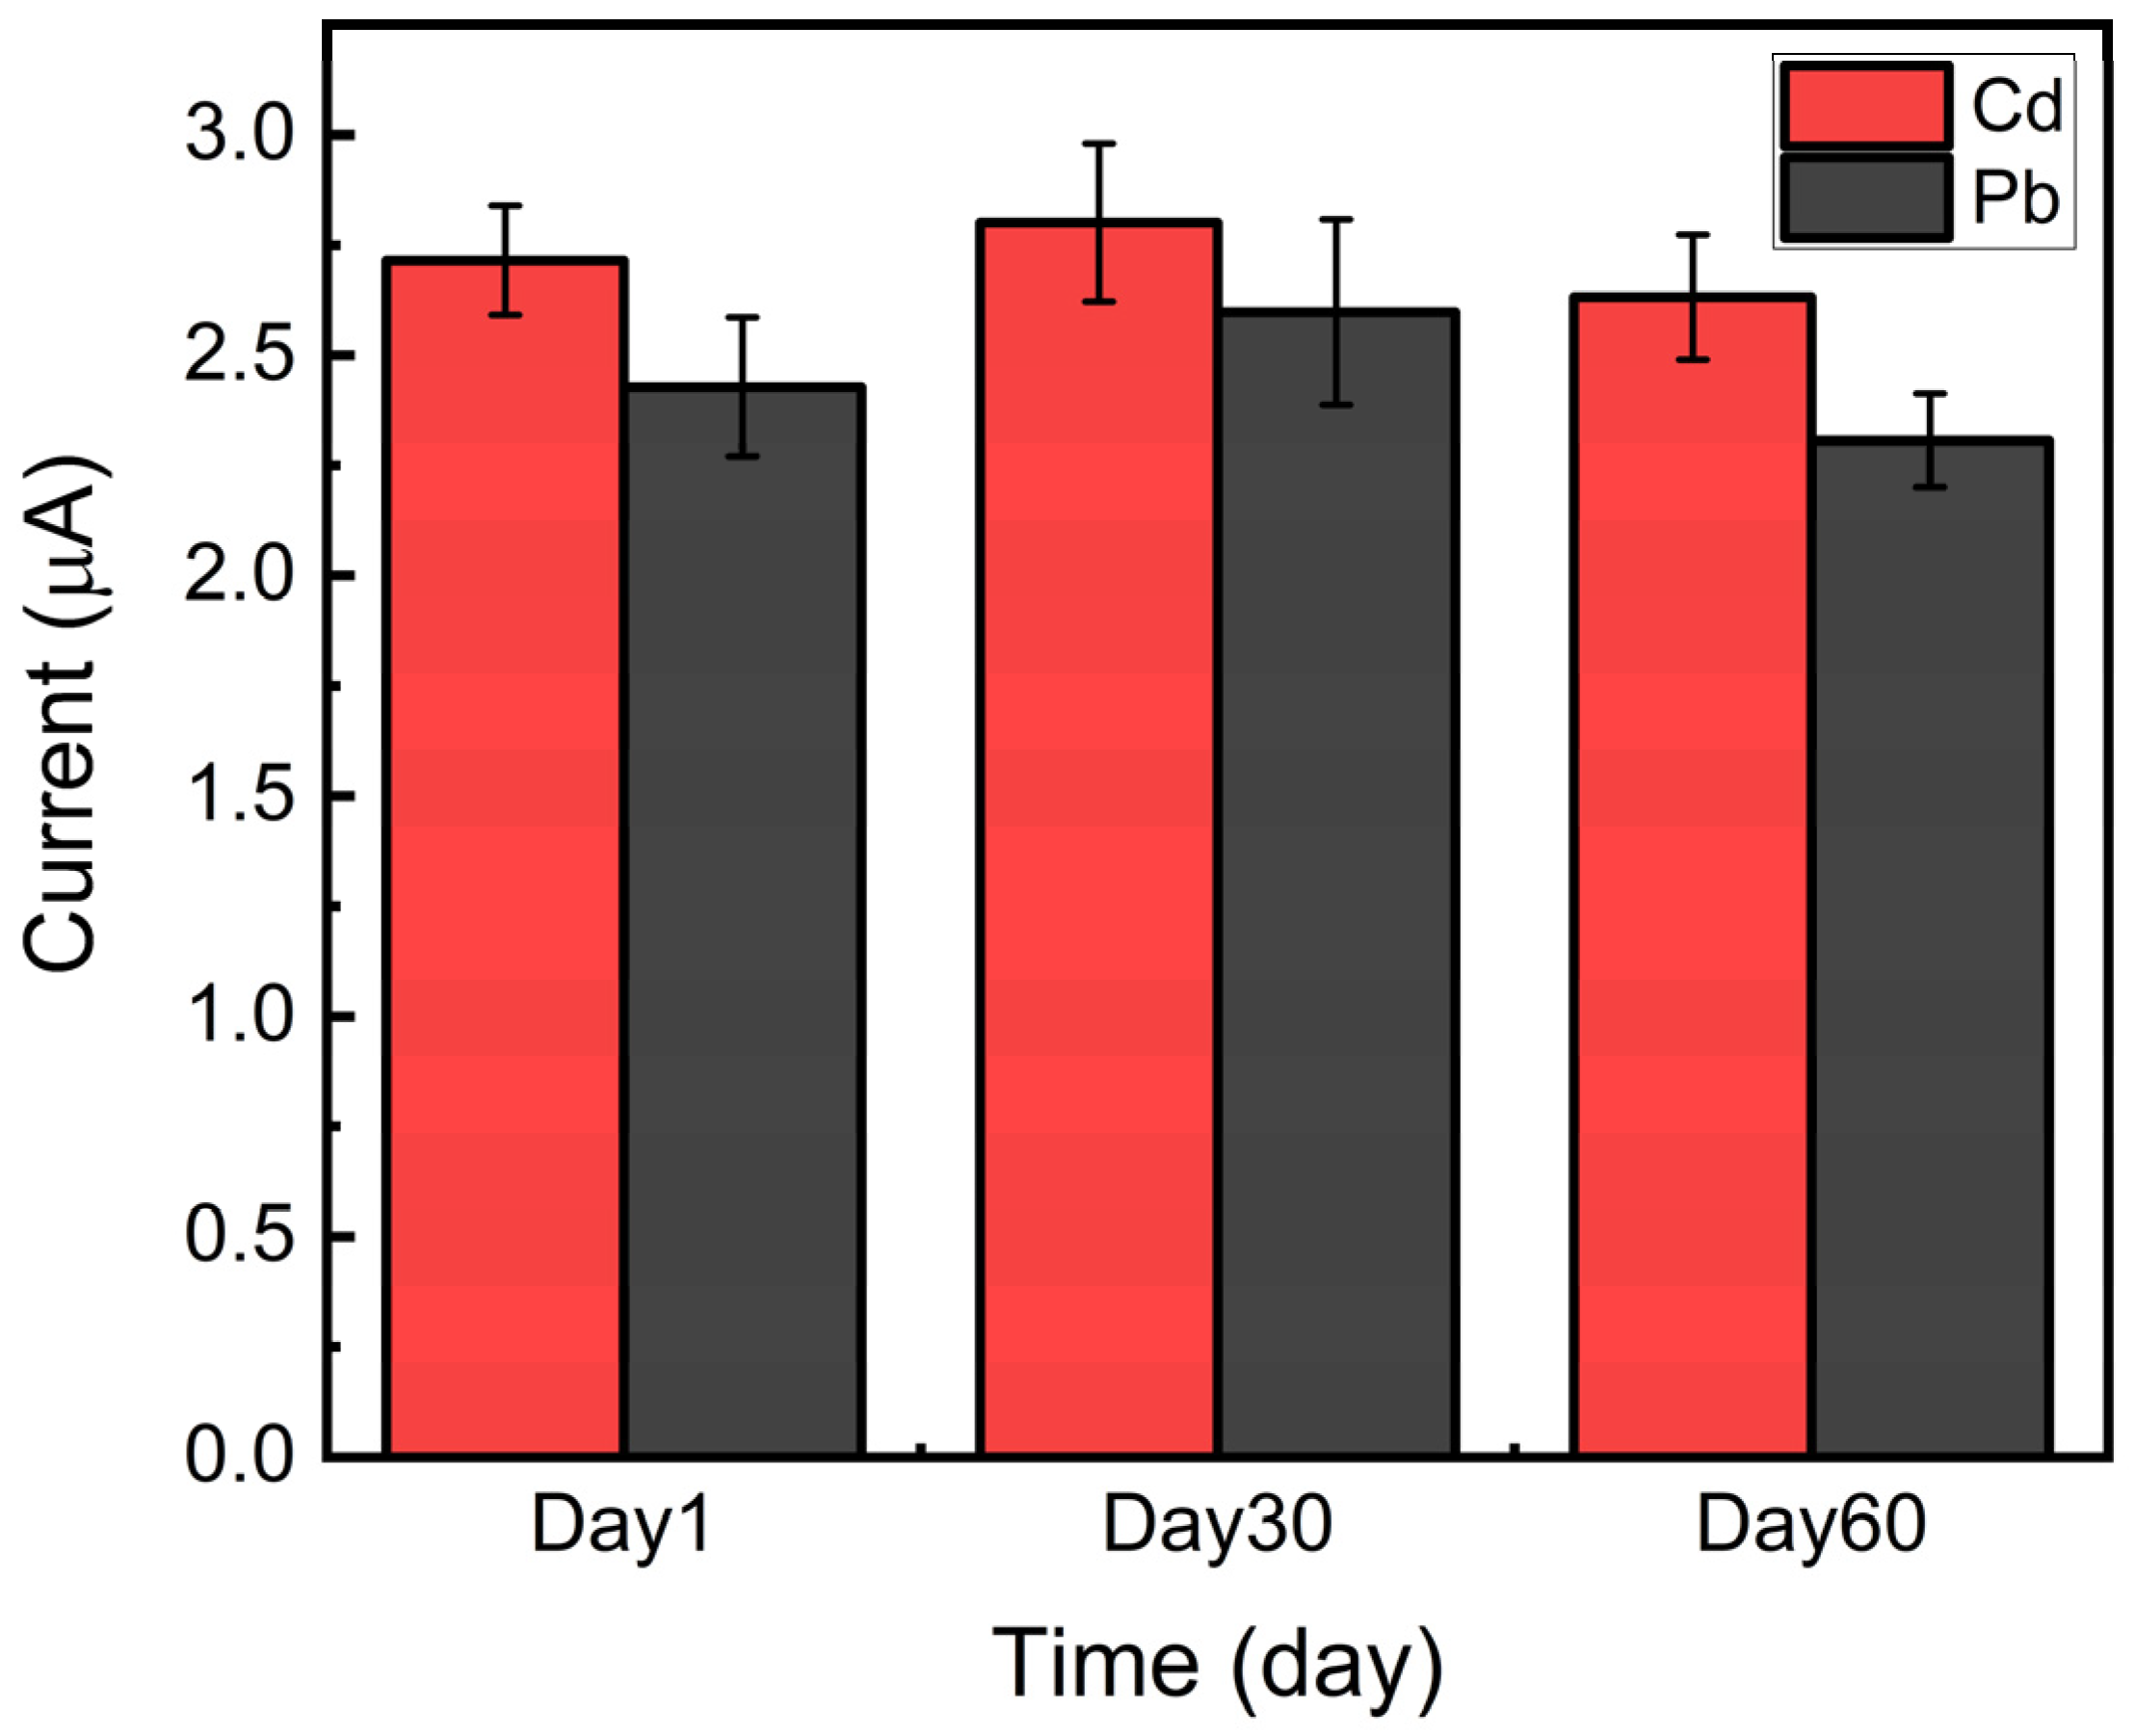
3.5. Heavy Metal Detection in a Real Water Sample

The performance of the HPC-based heavy metal sensor in the analysis of real water sample was evaluated, using tap water. For the comparative correlation study, the real samples with addition of Cd and Pb were analyzed, using both ICP-MS and HPC electrodes. The HPC electrode showed good agreement with the ICP-MS results with relative errors less than 7% as shown in Table 1. The %RSD values of the measurement using the HPC electrode were greater, compared to ICP-MS. However, considering the EPA standard (Cd 5 ppb and Pb 15 ppb), it is considered acceptable for testing tap-water samples. Supplementary Materials Figure S7 shows the SWASV curves of the HPC electrode obtained from a tap-water sample spiked with cadmium and lead at known concentrations. Peak current signals obtained from tap-water samples spiked with 0–100 μg L−1 cadmium and lead are shown in Figure 10. For the linear regression, the mean values of the peak currents measured using five different HPC-based sensors were used. The linear fitting curves show relatively good R2 values of 0.921 and 0.9757 for cadmium and lead, respectively, but the sensitivity of the HPC-based sensor was lower for the tap water, compared to that for deionized water-based samples (Figure 7B,C). However, the HPC-based sensor exhibited sufficient LOD (cadmium: 2.72 μg L−1, lead: 3.98 μg L−1) in the analysis of the real tap-water sample, to enable the detection of metal ions, at concentrations as low as the EPA standard for drinking water.

4. Conclusions

In this study, a sensitive heavy metal sensor was developed based on a micrometer-scale sponge-like hierarchical nanoporous carbon electrode. The recently developed electrochemical heavy metal sensors have employed various types of nanostructured electrodes with large surface area and excellent surface reactivity, facilitating the detection of heavy metals at low concentrations (0.2~20 ppb), as listed in Table 2. However, these sensors did not exhibit sufficient sensitivity per unit sensing area, to enable stable current signal measurement with a miniaturized sensor. The presented HPC electrode-based heavy metal sensor exhibited high sensitivity and low LOD at a small electrode size. This was facilitated by the sponge-like edge structure, which allows conformal and dense preconcentration of the heavy metal alloy, in addition to the large surface area and efficient electron transfer rate of the electrode. Thus, the HPC electrode showed superior sensitivity per unit sensing area (Cd, 109.45 nA μg−1 L mm−2; Pb, 100.37 nA μg−1 L mm−2) to those of the other nanoporous electrode-based heavy metal sensors (Table 2). Furthermore, the LOD (Cd: 2.72 μg L−1, Pb: 3.98 μg L−1) and sensing range (0.5–200 μg L−1) of the present heavy metal sensor with a micrometer-sized electrode are comparable to those of other heavy metal sensors, satisfying the EPA standard for drinking water. Moreover, HPC electrodes were successfully fabricated at a wafer-scale, using only batch microfabrication methods including C-MEMS and O2 plasma etching. This simple manufacturing process is compatible with other MEMS fabrication technologies that facilitate the integration of counter and reference electrodes for the cost-effective production of miniaturized heavy metal sensors.

Supplementary Materials

The following are available online, at https://www.mdpi.com/1424-8220/21/4/1346/s1. Figure S1: Cyclic voltammograms of (A) bare carbon (BC), (B) porous carbon (PC), and (C) hierarchical porous carbon (HPC) electrodes in 0.2 M K2SO4 at different scan rates. Figure S2: (A) SEM image and (B–D) EDS mapping of a BC electrode with electrodeposited heavy metal alloys (Cd, 10 mg L−1; Pb, 10 mg L−1; Bi, 400 μg L−1). Figure S3: (A) SEM image and (B–D) EDS mapping of a PC electrode with electrodeposited heavy metal alloys (Cd, 10 mg L−1; Pb, 10 mg L−1; Bi, 400 μg L−1). Figure S4: (A) SEM image and (B–D) EDS mapping of an HPC electrode with electrodeposited heavy metal alloys (Cd, 10 mg L−1; Pb, 10 mg L−1; Bi, 400 μg L−1). Figure S5: XPS spectrum of BC, PC, and HPC electrodes in (A) C1s and (B) O1s regions. Figure S6: Anodic stripping peak current responses of 50 μg L−1 cadmium (black line) and 50 μg L−1 lead (red line) in SWASV under different preconcentration conditions: (A) pH, (B) preconcentration potential, (C) preconcentration time, and (D) Bi concentration. Figure S7: SWASV curves obtained at various concentrations (0, 1, 5, 10, 20, 50, and 100 μg L−1) of cadmium and lead spiked in tap water buffered with a NaAc solution, using the HPC-based heavy metal sensor. Table S1: ICP-MS analysis of tap-water samples.

Author Contributions

Conceptualization, J.L.; investigation, J.L.; optimization, S.K.; validation, J.L. and S.K.; formal analysis, J.L.; writing—original draft preparation, J.L.; writing—review and editing, H.S.; supervision, H.S.; project administration, H.S.; funding acquisition, H.S. All authors have read and agreed to the published version of the manuscript.

Funding

This research was supported by Basic Science Research Program through the National Research Foundation of Korea(NRF) funded by the Ministry of Science and ICT (2016R1A2B4010031, 2020R1F1A1065132) and the Ministry of Education (2020R1A6A1A03040570), and Institute of Information & communications Technology Planning & Evaluation (IITP) grant funded by the Korea government(MSIT) (No. 2018-0-00756).

Institutional Review Board Statement

Not applicable.

Informed Consent Statement

Not applicable.

Data Availability Statement

The data presented in this study are available on request from the corresponding author.

Acknowledgments

We are grateful for technical assistance from the staff members at UCRF, in UNIST.

Conflicts of Interest

The authors declare no conflict of interest.

References

  1. Aragay, G.; Pons, J.; Merkoci, A. Recent trends in macro-, micro-, and nanomaterial-based tools and strategies for heavy-metal detection. Chem. Rev. 2011, 111, 3433–3458. [Google Scholar] [CrossRef]
  2. US Environmental Protection Agency. Seminar Publication: Risk Assessment, Management and Communication of Drinking Water Contamination; National Service Center for Environmental Publications: Cincinnati, OH, USA, 1989.
  3. Habila, M.A.; ALOthman, Z.A.; El-Toni, A.M.; Labis, J.P.; Soylak, M. Synthesis and application of Fe3O4@ SiO2@ TiO2 for photocatalytic decomposition of organic matrix simultaneously with magnetic solid phase extraction of heavy metals prior to ICP-MS analysis. Talanta 2016, 154, 539–547. [Google Scholar] [CrossRef]
  4. Narin, İ.; Soylak, M.; Elçi, L.; Doğan, M. Determination of trace metal ions by AAS in natural water samples after preconcentration of pyrocatechol violet complexes on an activated carbon column. Talanta 2000, 52, 1041–1046. [Google Scholar] [CrossRef]
  5. Marguí, E.; Zawisza, B.; Sitko, R. Trace and ultratrace analysis of liquid samples by X-ray fluorescence spectrometry. TrAC Trends Anal. Chem. 2014, 53, 73–83. [Google Scholar] [CrossRef]
  6. Rex, M.; Hernandez, F.E.; Campiglia, A.D. Pushing the limits of mercury sensors with gold nanorods. Anal. Chem. 2006, 78, 445–451. [Google Scholar] [CrossRef]
  7. Wagner, K.A.; Levine, K.E.; Jones, B.T. A simple, low cost, multielement atomic absorption spectrometer with a tungsten coil atomizer. Spectrochim. Acta Part B 1998, 53, 1507–1516. [Google Scholar] [CrossRef]
  8. Waggoner, J.W.; Milstein, L.S.; Belkin, M.; Sutton, K.L.; Caruso, J.A.; Fannin, H.B. Application of a low power/reduced pressure helium ICP ionization source for mass spectrometric detection of organobromine compounds and derivatized organotin compounds. J. Anal. At. Spectrom. 2000, 15, 13–18. [Google Scholar] [CrossRef]
  9. Zhou, S.; Yuan, Z.; Cheng, Q.; Zhang, Z.; Yang, J. Rapid in situ determination of heavy metal concentrations in polluted water via portable XRF: Using Cu and Pb as example. Environ. Pollut. 2018, 243, 1325–1333. [Google Scholar] [CrossRef] [PubMed]
  10. Barton, J.; García, M.B.G.; Santos, D.H.; Fanjul-Bolado, P.; Ribotti, A.; McCaul, M.; Diamond, D.; Magni, P. Screen-printed electrodes for environmental monitoring of heavy metal ions: A review. Microchim. Acta 2016, 183, 503–517. [Google Scholar] [CrossRef]
  11. Braga, M.S.; Jaimes, R.F.; Borysow, W.; Gomes, O.F.; Salcedo, W.J. Portable multispectral colorimeter for metallic ion detection and classification. Sensors 2017, 17, 1730. [Google Scholar] [CrossRef] [PubMed] [Green Version]
  12. Sriram, G.; Bhat, M.P.; Patil, P.; Uthappa, U.T.; Jung, H.Y.; Altalhi, T.; Kurkuri, M.D. Paper-based microfluidic analytical devices for colorimetric detection of toxic ions: A review. TrAC Trends Anal. Chem. 2017, 93, 212–227. [Google Scholar] [CrossRef]
  13. Gan, Y.; Liang, T.; Hu, Q.; Zhong, L.; Wang, X.; Wan, H.; Wang, P. In-situ detection of cadmium with aptamer functionalized gold nanoparticles based on smartphone-based colorimetric system. Talanta 2020, 208, 120231. [Google Scholar] [CrossRef]
  14. Li, M.; Li, D.W.; Li, Y.T.; Xu, D.K.; Long, Y.T. Highly selective in situ metal ion determination by hybrid electrochemical “adsorption–desorption” and colorimetric methods. Anal. Chim. Acta 2011, 701, 157–163. [Google Scholar] [CrossRef] [PubMed]
  15. Xu, G.; Li, X.; Cheng, C.; Yang, J.; Liu, Z.; Shi, Z.; Liu, Q. Fully integrated battery-free and flexible electrochemical tag for on-demand wireless in situ monitoring of heavy metals. Sens. Actuators B Chem. 2020, 310, 127809. [Google Scholar] [CrossRef]
  16. Yi, W.J.; Li, Y.; Ran, G.; Luo, H.Q.; Li, N.B. Determination of cadmium (II) by square wave anodic stripping voltammetry using bismuth–antimony film electrode. Sens. Actuators B Chem. 2012, 166, 544–548. [Google Scholar] [CrossRef]
  17. Li, M.; Gou, H.; Al-Ogaidi, I.; Wu, N. Nanostructured sensors for detection of heavy metals: A review. ACS Sustain. Chem. Eng. 2013, 1, 713–723. [Google Scholar] [CrossRef]
  18. Vyskočil, V.; Barek, J. Mercury electrodes–possibilities and limitations in environmental electroanalysis. Crit. Rev. Anal. Chem. 2009, 39, 173–188. [Google Scholar] [CrossRef]
  19. Daniele, S.; Bragato, C.; Baldo, M.A.; Ciani, I. Application of thin-shielded mercury microelectrodes in anodic stripping voltammetry. Talanta 2008, 77, 235–240. [Google Scholar] [CrossRef]
  20. Wang, J. Stripping analysis at bismuth electrodes: A review. Electroanalysis 2005, 17, 1341–1346. [Google Scholar] [CrossRef]
  21. Zou, Z.; Jang, A.; Macknight, E.; Wu, P.M.; Do, J.; Bishop, P.L.; Ahn, C.H. Environmentally friendly disposable sensors with microfabricated on-chip planar bismuth electrode for in situ heavy metal ions measurement. Sens. Actuators B Chem. 2008, 134, 18–24. [Google Scholar] [CrossRef]
  22. Zhang, C.H.; Li, G.-J.; Wang, J.-H. Application of nanopore and porous materials for heavy metal ion detection. Chin. J. Anal. Chem. 2014, 42, 607–615. [Google Scholar] [CrossRef]
  23. Kim, S.; Dong, W.J.; Gim, S.; Sohn, W.; Park, J.Y.; Yoo, C.J.; Jang, H.W.; Lee, J.L. Shape-controlled bismuth nanoflakes as highly selective catalysts for electrochemical carbon dioxide reduction to formate. Nano Energy 2017, 39, 44–52. [Google Scholar] [CrossRef]
  24. Zhu, C.; Li, H.; Fu, S.; Du, D.; Lin, Y. Highly efficient nonprecious metal catalysts towards oxygen reduction reaction based on three-dimensional porous carbon nanostructures. Chem. Soc. Rev. 2016, 45, 517–531. [Google Scholar] [CrossRef] [PubMed]
  25. Sun, J.; Li, M.; Zhang, Z.; Guo, J. Unravelling the adsorption disparity mechanism of heavy-metal ions on the biomass-derived hierarchically porous carbon. Appl. Surf. Sci. 2019, 471, 615–620. [Google Scholar] [CrossRef]
  26. Yuan, X.; An, N.; Zhu, Z.; Sun, H.; Zheng, J.; Jia, M.; Liu, N. Hierarchically porous nitrogen-doped carbon materials as efficient adsorbents for removal of heavy metal ions. Process. Saf. Environ. Prot. 2018, 119, 320–329. [Google Scholar] [CrossRef]
  27. Li, J.; Liu, K.; Gao, X.; Yao, B.; Huo, K.; Cheng, Y.; Ding, D. Oxygen-and nitrogen-enriched 3D porous carbon for supercapacitors of high volumetric capacity. ACS Appl. Mater. Interfaces 2015, 7, 24622–24628. [Google Scholar] [CrossRef]
  28. Guan, J.; Fang, Y.; Zhang, T.; Wang, L.; Zhu, H.; Du, M.; Zhang, M. Kelp-Derived Activated Porous Carbon for the Detection of Heavy Metal Ions via Square Wave Anodic Stripping Voltammetry. Electrocatalysis 2020, 11, 59–67. [Google Scholar] [CrossRef]
  29. Wang, C.; Madou, M. From MEMS to NEMS with carbon. Biosens. Bioelectron. 2005, 20, 2181–2187. [Google Scholar] [CrossRef]
  30. Kostecki, R.; Schnyder, B.; Alliata, D.; Song, X.; Kinoshita, K.; Kötz, R. Surface studies of carbon films from pyrolyzed photoresist. Thin Solid Films 2001, 396, 36–43. [Google Scholar] [CrossRef]
  31. Sharma, S. Glassy carbon: A promising material for micro-and nanomanufacturing. Materials 2018, 11, 1857. [Google Scholar] [CrossRef] [Green Version]
  32. VanDersarl, J.J.; Mercanzini, A.; Renaud, P. Integration of 2D and 3D thin film glassy carbon electrode arrays for electrochemical dopamine sensing in flexible neuroelectronic implants. Adv. Funct. Mater. 2015, 25, 78–84. [Google Scholar] [CrossRef]
  33. Sharma, D.; Lee, J.; Seo, J.; Shin, H. Development of a Sensitive Electrochemical Enzymatic Reaction-Based Cholesterol Biosensor Using Nano-Sized Carbon Interdigitated Electrodes Decorated with Gold Nanoparticles. Sensors 2017, 17, 2128. [Google Scholar] [CrossRef] [PubMed] [Green Version]
  34. Mohamed Hassan, Y.; Caviglia, C.; Hemanth, S.; Mackenzie, D.M.A.; Petersen, D.H.; Keller, S.S. Pyrolytic carbon microelectrodes for impedance based cell sensing. ECS Trans. 2016, 72, 35–44. [Google Scholar] [CrossRef] [Green Version]
  35. Thiha, A.; Ibrahim, F.; Muniandy, S.; Dinshaw, I.J.; Teh, S.J.; Thong, K.L.; Leo, B.F.; Madou, M. All-carbon suspended nanowire sensors as a rapid highly-sensitive label-free chemiresistive biosensing platform. Biosens. Bioelectron. 2018, 107, 145–152. [Google Scholar] [CrossRef]
  36. Mardegan, A.; Kamath, R.; Sharma, S.; Scopece, P.; Ugo, P.; Madou, M. Optimization of Carbon Electrodes Derived from Epoxy-based Photoresist. J. Electrochem. Soc. 2013, 160, B132–B137. [Google Scholar] [CrossRef] [Green Version]
  37. Du, K.; Wathuthanthri, I.; Liu, Y.; Kang, Y.T.; Choi, C. Fabrication of polymer nanowires via maskless O2 plasma etching. Nanotechnology 2014, 25, 165301. [Google Scholar] [CrossRef]
  38. Lim, Y.; Woo, J.; Joo, S.H.; Shin, H. Patternable nanoporous carbon electrodes for use as supercapacitors. J. Electrochem. Soc. 2016, 163, A1886. [Google Scholar] [CrossRef]
  39. Lim, Y.; Chu, J.H.; Kwon, S.Y.; Shin, H. Increase in graphitization and electrical conductivity of glassy carbon nanowires by rapid thermal annealing. J. Alloys Compd. 2017, 702, 465–471. [Google Scholar] [CrossRef]
  40. Tsougeni, K.; Vourdas, N.; Tserepi, A.; Gogolides, E. Mechanisms of Oxygen Plasma Nanotexturing of Organic Polymer Surfaces: From Stable Super Hydrophilic to Super Hydrophobic Surfaces. Langmuir 2009, 25, 11748–11759. [Google Scholar] [CrossRef]
  41. Deng, H.; Zhang, C.; Xie, Y.; Tumlin, T.; Giri, L.; Karna, S.P.; Lin, J. Laser induced MoS 2/carbon hybrids for hydrogen evolution reaction catalysts. J. Mater. Chem. A 2016, 4, 6824–6830. [Google Scholar] [CrossRef] [Green Version]
  42. Łukaszewski, M.; Soszko, M.; Czerwiński, A. Electrochemical methods of real surface area determination of noble metal electrodes—An overview. Int. J. Electrochem. Sci. 2016, 11, 4442–4469. [Google Scholar] [CrossRef]
  43. Park, S.; Song, Y.J.; Han, J.H.; Boo, H.; Chung, T.D. Structural and electrochemical features of 3D nanoporous platinum electrodes. Electrochim. Acta 2010, 55, 2029–2035. [Google Scholar] [CrossRef]
  44. Walther, F.; Davydovskaya, P.; Zürcher, S.; Kaiser, M.; Herberg, H.; Gigler, A.M.; Stark, R.W. Stability of the hydrophilic behavior of oxygen plasma activated SU-8. J. Micromech. Microeng. 2007, 17, 524. [Google Scholar] [CrossRef] [Green Version]
  45. Stone, D.; Ellis, J. Calibration and Linear Regression Analysis: A Self-Guided Tutorial. In CHM314 Instrumental Analysis; Department of Chemistry, University of Toronto: Toronto, ON, Canada, 2003. [Google Scholar]
  46. Deshmukh, S.; Kandasamy, G.; Upadhyay, R.K.; Bhattacharya, G.; Banerjee, D.; Maity, D.; Roy, S.S. Terephthalic acid capped iron oxide nanoparticles for sensitive electrochemical detection of heavy metal ions in water. J. Electroanal. Chem. 2017, 788, 91–98. [Google Scholar] [CrossRef]
  47. Liao, J.; Yang, F.; Wang, C.Z.; Lin, S. The crystal facet-dependent electrochemical performance of TiO2 nanocrystals for heavy metal detection: Theoretical prediction and experimental proof. Sens. Actuators B Chem. 2018, 271, 195–202. [Google Scholar] [CrossRef] [Green Version]
  48. Xuan, X.; Park, J.Y. A miniaturized and flexible cadmium and lead ion detection sensor based on micro-patterned reduced graphene oxide/carbon nanotube/bismuth composite electrodes. Sens. Actuators B Chem. 2018, 255, 1220–1227. [Google Scholar] [CrossRef]
  49. Yao, Y.; Wu, H.; Ping, J. Simultaneous determination of Cd (II) and Pb (II) ions in honey and milk samples using a single-walled carbon nanohorns modified screen-printed electrochemical sensor. Food Chem. 2019, 274, 8–15. [Google Scholar] [CrossRef] [PubMed]
  50. Wang, N.; Zhao, W.; Shen, Z.; Sun, S.; Dai, H.; Ma, H.; Lin, M. Sensitive and selective detection of Pb (II) and Cu (II) using a metal-organic framework/polypyrrole nanocomposite functionalized electrode. Sens. Actuators B Chem. 2020, 304, 127286. [Google Scholar] [CrossRef]
Figure 1. Schematic of the fabrication steps for hierarchical nanoporous carbon electrodes (PR, photoresist; RTA, rapid thermal annealing; BOE, buffered oxide etch).
Sensors 21 01346 g001
Figure 2. (A) Schematic sectional views of nanoporous carbon electrodes, according to their porosity. (B) Scanning electron microscopy image of a hierarchical porous carbon (HPC) disk electrode.
Sensors 21 01346 g002
Figure 3. SEM images of carbon electrodes with different surface porosities formed depending on the O2-plasma-etching time: (A) bare carbon (BC) electrode (no plasma etching process), (B) porous carbon (PC) electrode (300 s plasma etching), and (C) HPC electrode (900 s plasma etching).
Sensors 21 01346 g003
Figure 4. (A) Capacitive current difference at the middle of the potential window, according to the scan rate, and (B) the corresponding electrochemically active surface area (EASA) ratios of the HPC and PC electrodes, compared to that of the BC electrode.
Sensors 21 01346 g004
Figure 5. (A) Cyclic voltammograms of 10 mM ferrocyanide in 0.5 M KCl at the scan rate of 0.05 V/s. (B) Square wave anodic stripping voltammetry (SWASV) current signals from 10 μg L−1 of each of cadmium and lead, along with 400 μg L−1 of bismuth in a NaAc buffer measured by using the BC, PC, and HPC electrodes.
Sensors 21 01346 g005
Figure 6. SEM images of (A) BC, (B) PC, and (C) HPC electrodes with the electrodeposited heavy metal alloys (Cd, 10 mg L−1; Pb, 10 mg L−1; Bi, 400 μg L−1).
Sensors 21 01346 g006
Figure 7. (A) SWASV plots obtained at various concentrations (0, 1, 2, 5, 7, 10, 20, 50, 100, and 200 μg L−1) of cadmium and lead in a NaAc buffer, and peak current signals at various concentrations of (B) cadmium and (C) lead measured by using a 400 μm diameter disk HPC electrode.
Sensors 21 01346 g007
Figure 8. Reproducibility and stability test, using five different HPC electrodes for a two-month period (red bar, 200 ppb Cd; black bar, 200 ppb Pb).
Sensors 21 01346 g008
Figure 9. Interference effect on the heavy metal detection of the HPC-based heavy metal sensor: (A) normalized peak current signals of 20 ppb Cd (brown color) and Pb (green color) against metal ion interferences (Zn, Ca, Cu, and Fe) of 100 and 20 ppm; (B) normalized peak current signals of 20 ppb Cd (left bars) and Pb (right bars) against NaCl and NaCl with metal ion interferences (Zn, Ca, Cu, and Fe).
Sensors 21 01346 g009
Figure 10. SWASV peak current signals from a real tap-water sample spiked with (A) cadmium and (B) lead at various concentrations (0, 1, 5, 10, 20, 50, and 100 μg L−1), obtained by using the HPC-based heavy metal sensor.
Sensors 21 01346 g010
Table 1. Cd and Pb concentrations in tap-water samples spiked with standard heavy metal solutions measured, using ICP-MS and HPC electrodes.
ICP-MSHPC ElectrodeRelative Error (%)
AnalyteAdded
(μg L−1)
Found
(μg L−1)
RecoveryAnalyteAdded
(μg L−1)
Found
(μg L−1)
Recovery
Cd56.11 ± 0.14 122.2Cd55.70 ± 0.681146.7
Pb54.53 ± 0.19 90.6Pb54.26 ± 0.20 85.26.0
Cd5051.94 ± 0.19103.9Cd5048.36 ± 4.5996.76.9
Pb5046.09 ± 0.17392.2Pb5058.42 ± 3.68116.86.3
Table 2. Summary of the sensing performances of various heavy metal sensors, using SWASV method.
Electrode MaterialHeavy MetalLOD
(ppb)
Sensing Range
(ppb)
* Sensitivity
per Unit Sensing Area
(nA ppb−1 mm−2)
Electrode
Size (mm2)
Real SampleReference
(Fe3O4/TA)NPs modified GCECd22.4844.96–123.75.50819.625River water[46]
Pb8.2982.88–227.92.105
TiO2 nanocrystals modified GCECd-22.48–112.421.646-River water[47]
Pb-41.44–207.220.131
rGO/CNT/
Bismuth composite
Cd0.620–2002.621.5Drinking water[48]
Pb0.220–2009.26
SWCNHs modified SPECd0.21–600.1147Milk, Honey[49]
Pb0.41–600.041
AuNPs/BiNPsmodified CECd1.51100–30018.33810Solution in cup[15]
Pb2.2050–30015.31
Functionalizedgold electrodePb0.3151–400-12.56Tap water[50]
Kelp-derived porous carbon electrodeCd2.621.12–56.233.377.065Tap water[28]
Pb2.362.07–103.636.487.065
HPCCd0.410.5–200109.450.1256Tap waterThis work
Pb0.70.5–200100.37
* The sensitivity per unit sensing area of each sensor was calculated by dividing the slope of the linear regression line of the detection result by the electrode area. TA, terephthalic acid; NPs, nanoparticles; GCE, glassy carbon electrode; rGO, reduced graphene oxide; CNT, carbon nano tube; SWCNHs, single-walled carbon nanohorns; SPE, screen-printed electrode; CE, carbon electrode; LOD, limit of detection.
Publisher’s Note: MDPI stays neutral with regard to jurisdictional claims in published maps and institutional affiliations.

