
An Anatomical Thermal 3D Model in Preclinical Research: Combining CT and Thermal Images

 ,
,  , , , ,
  , and
, and
Abstract
1. Introduction
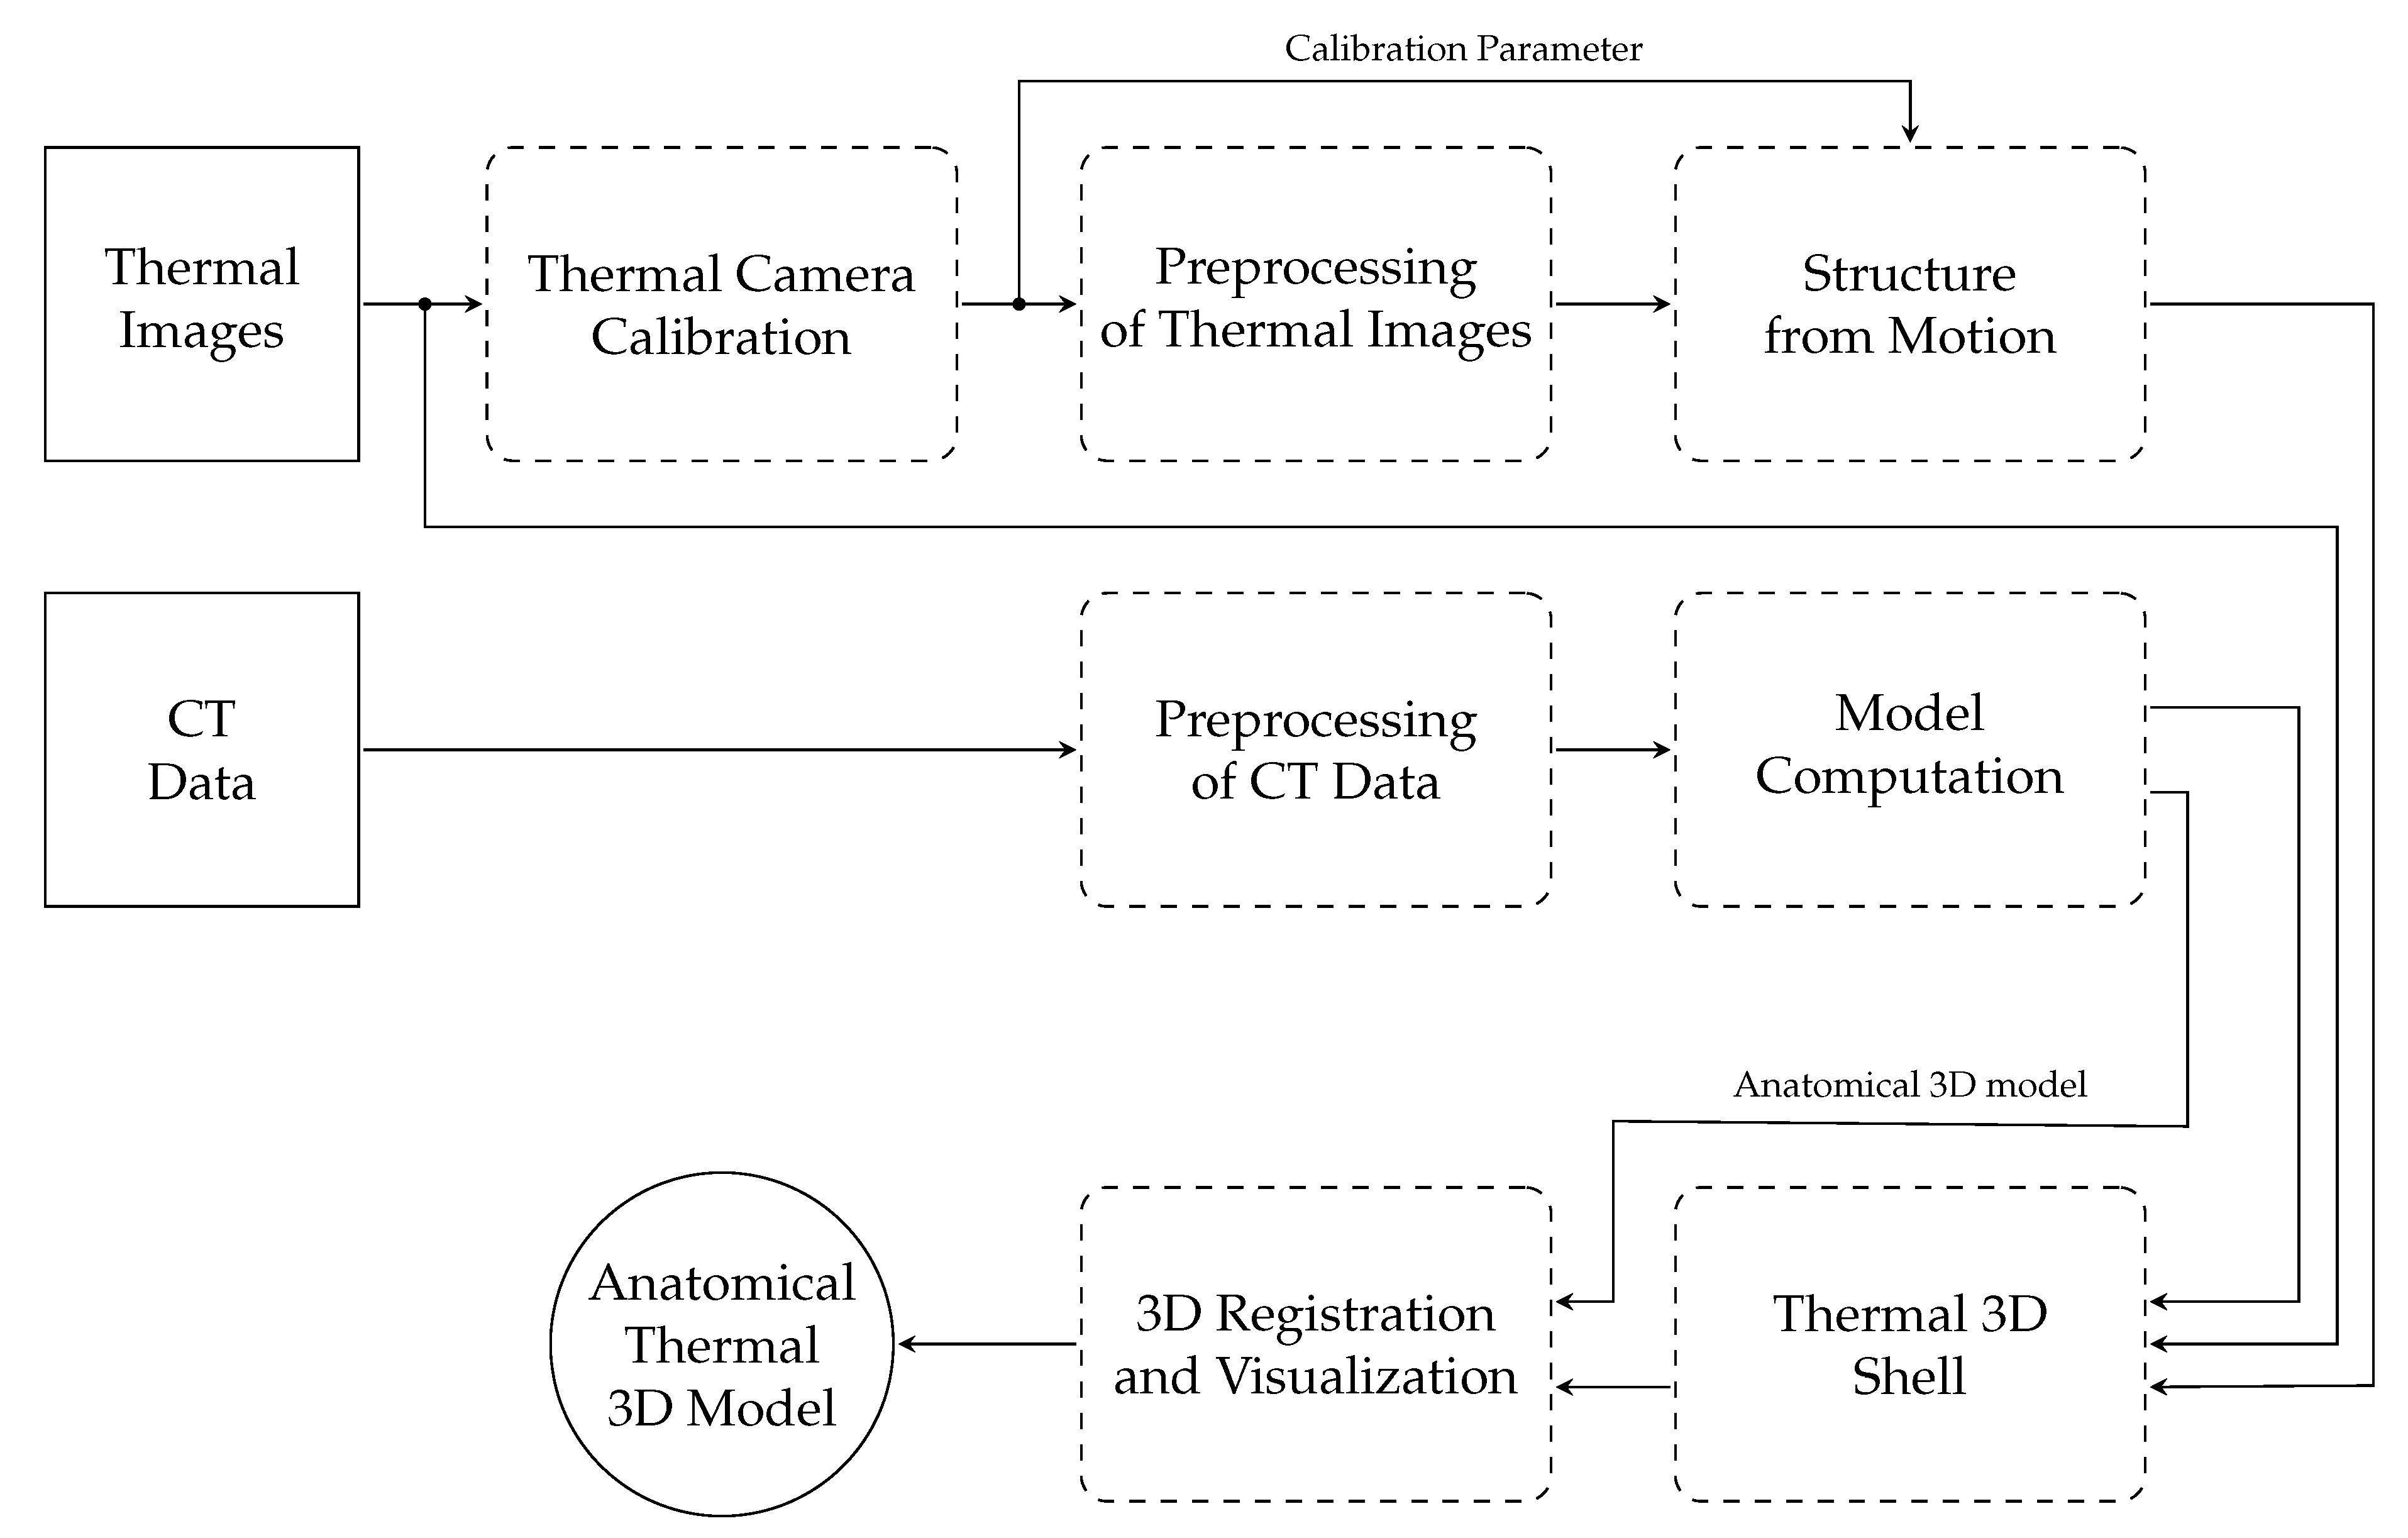
2. Methodology
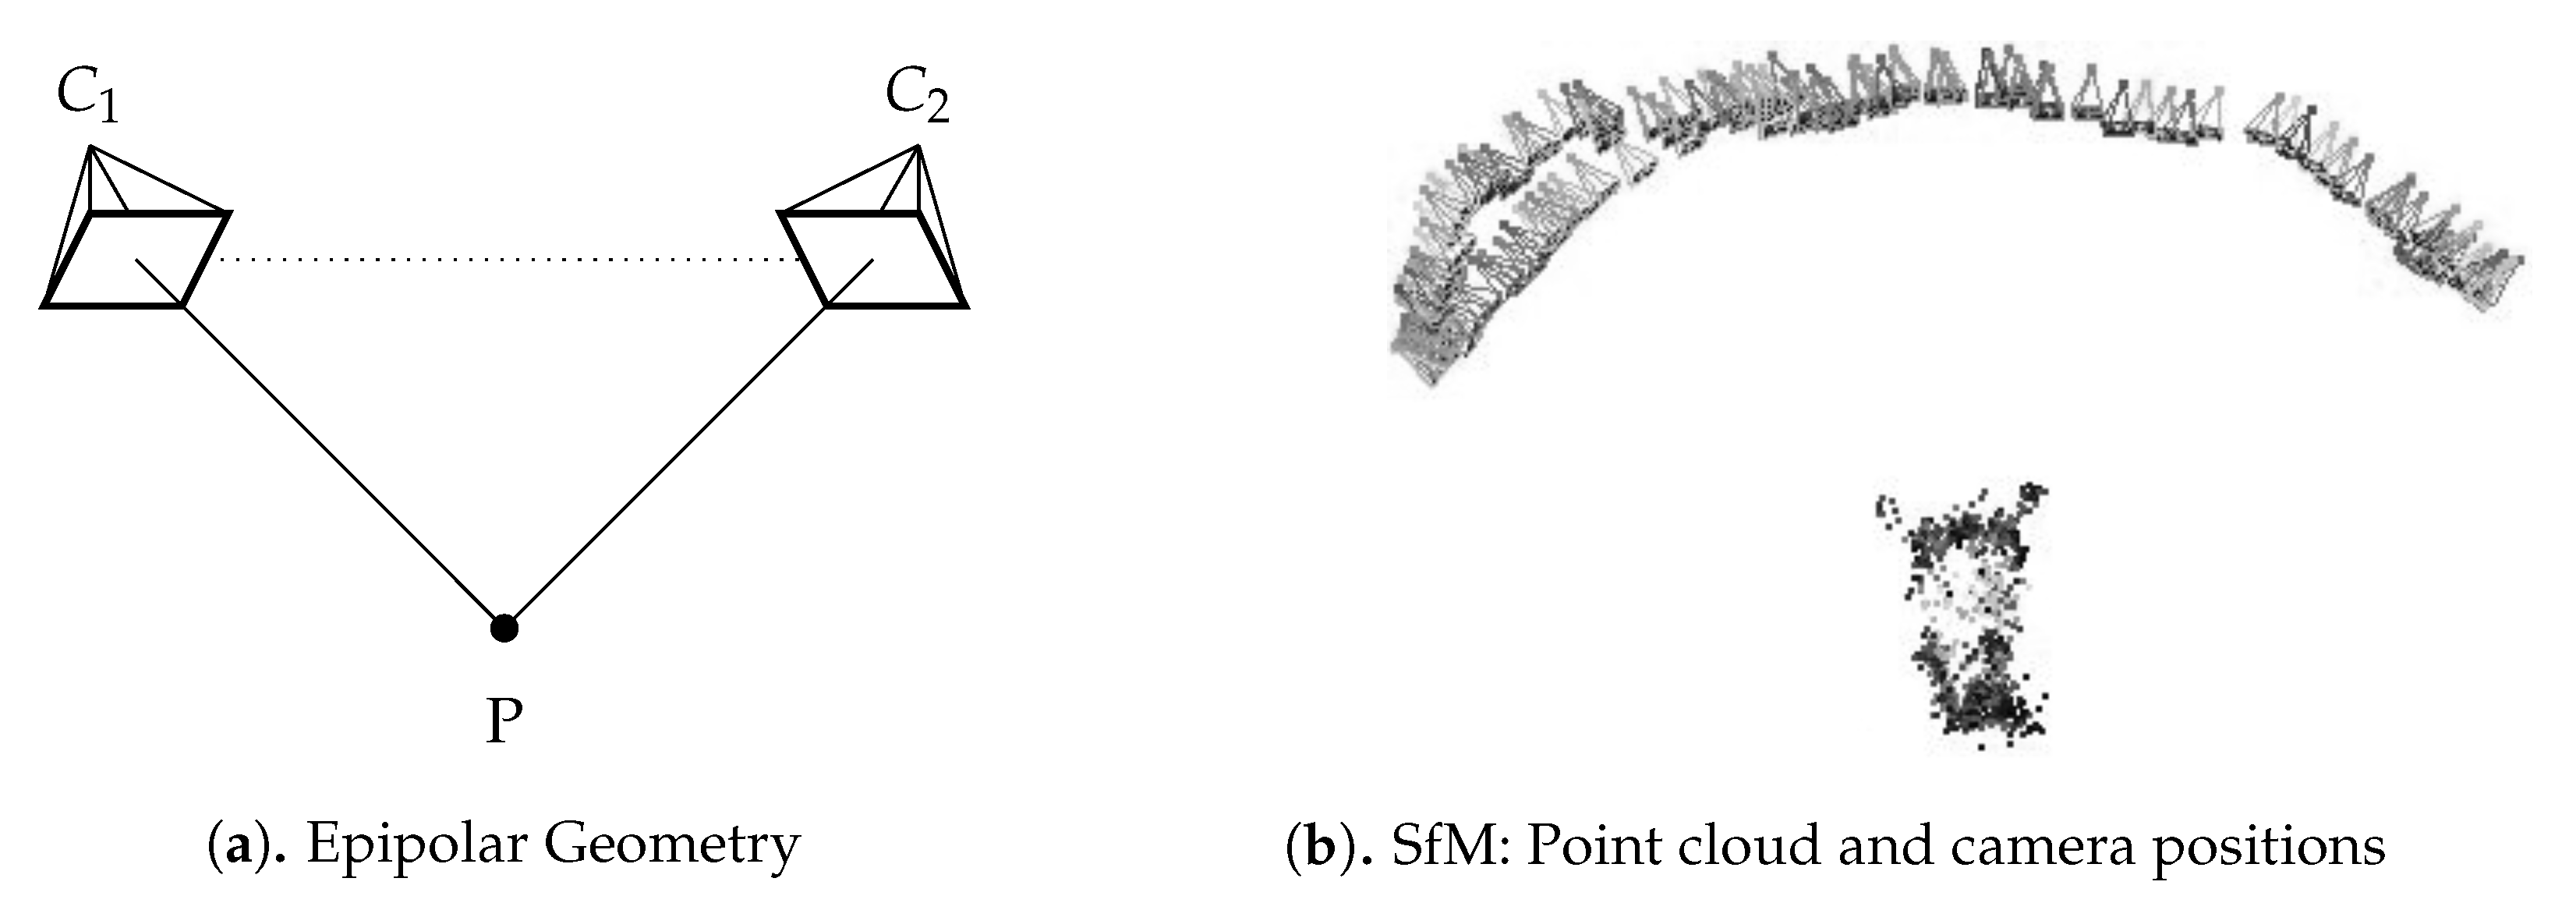
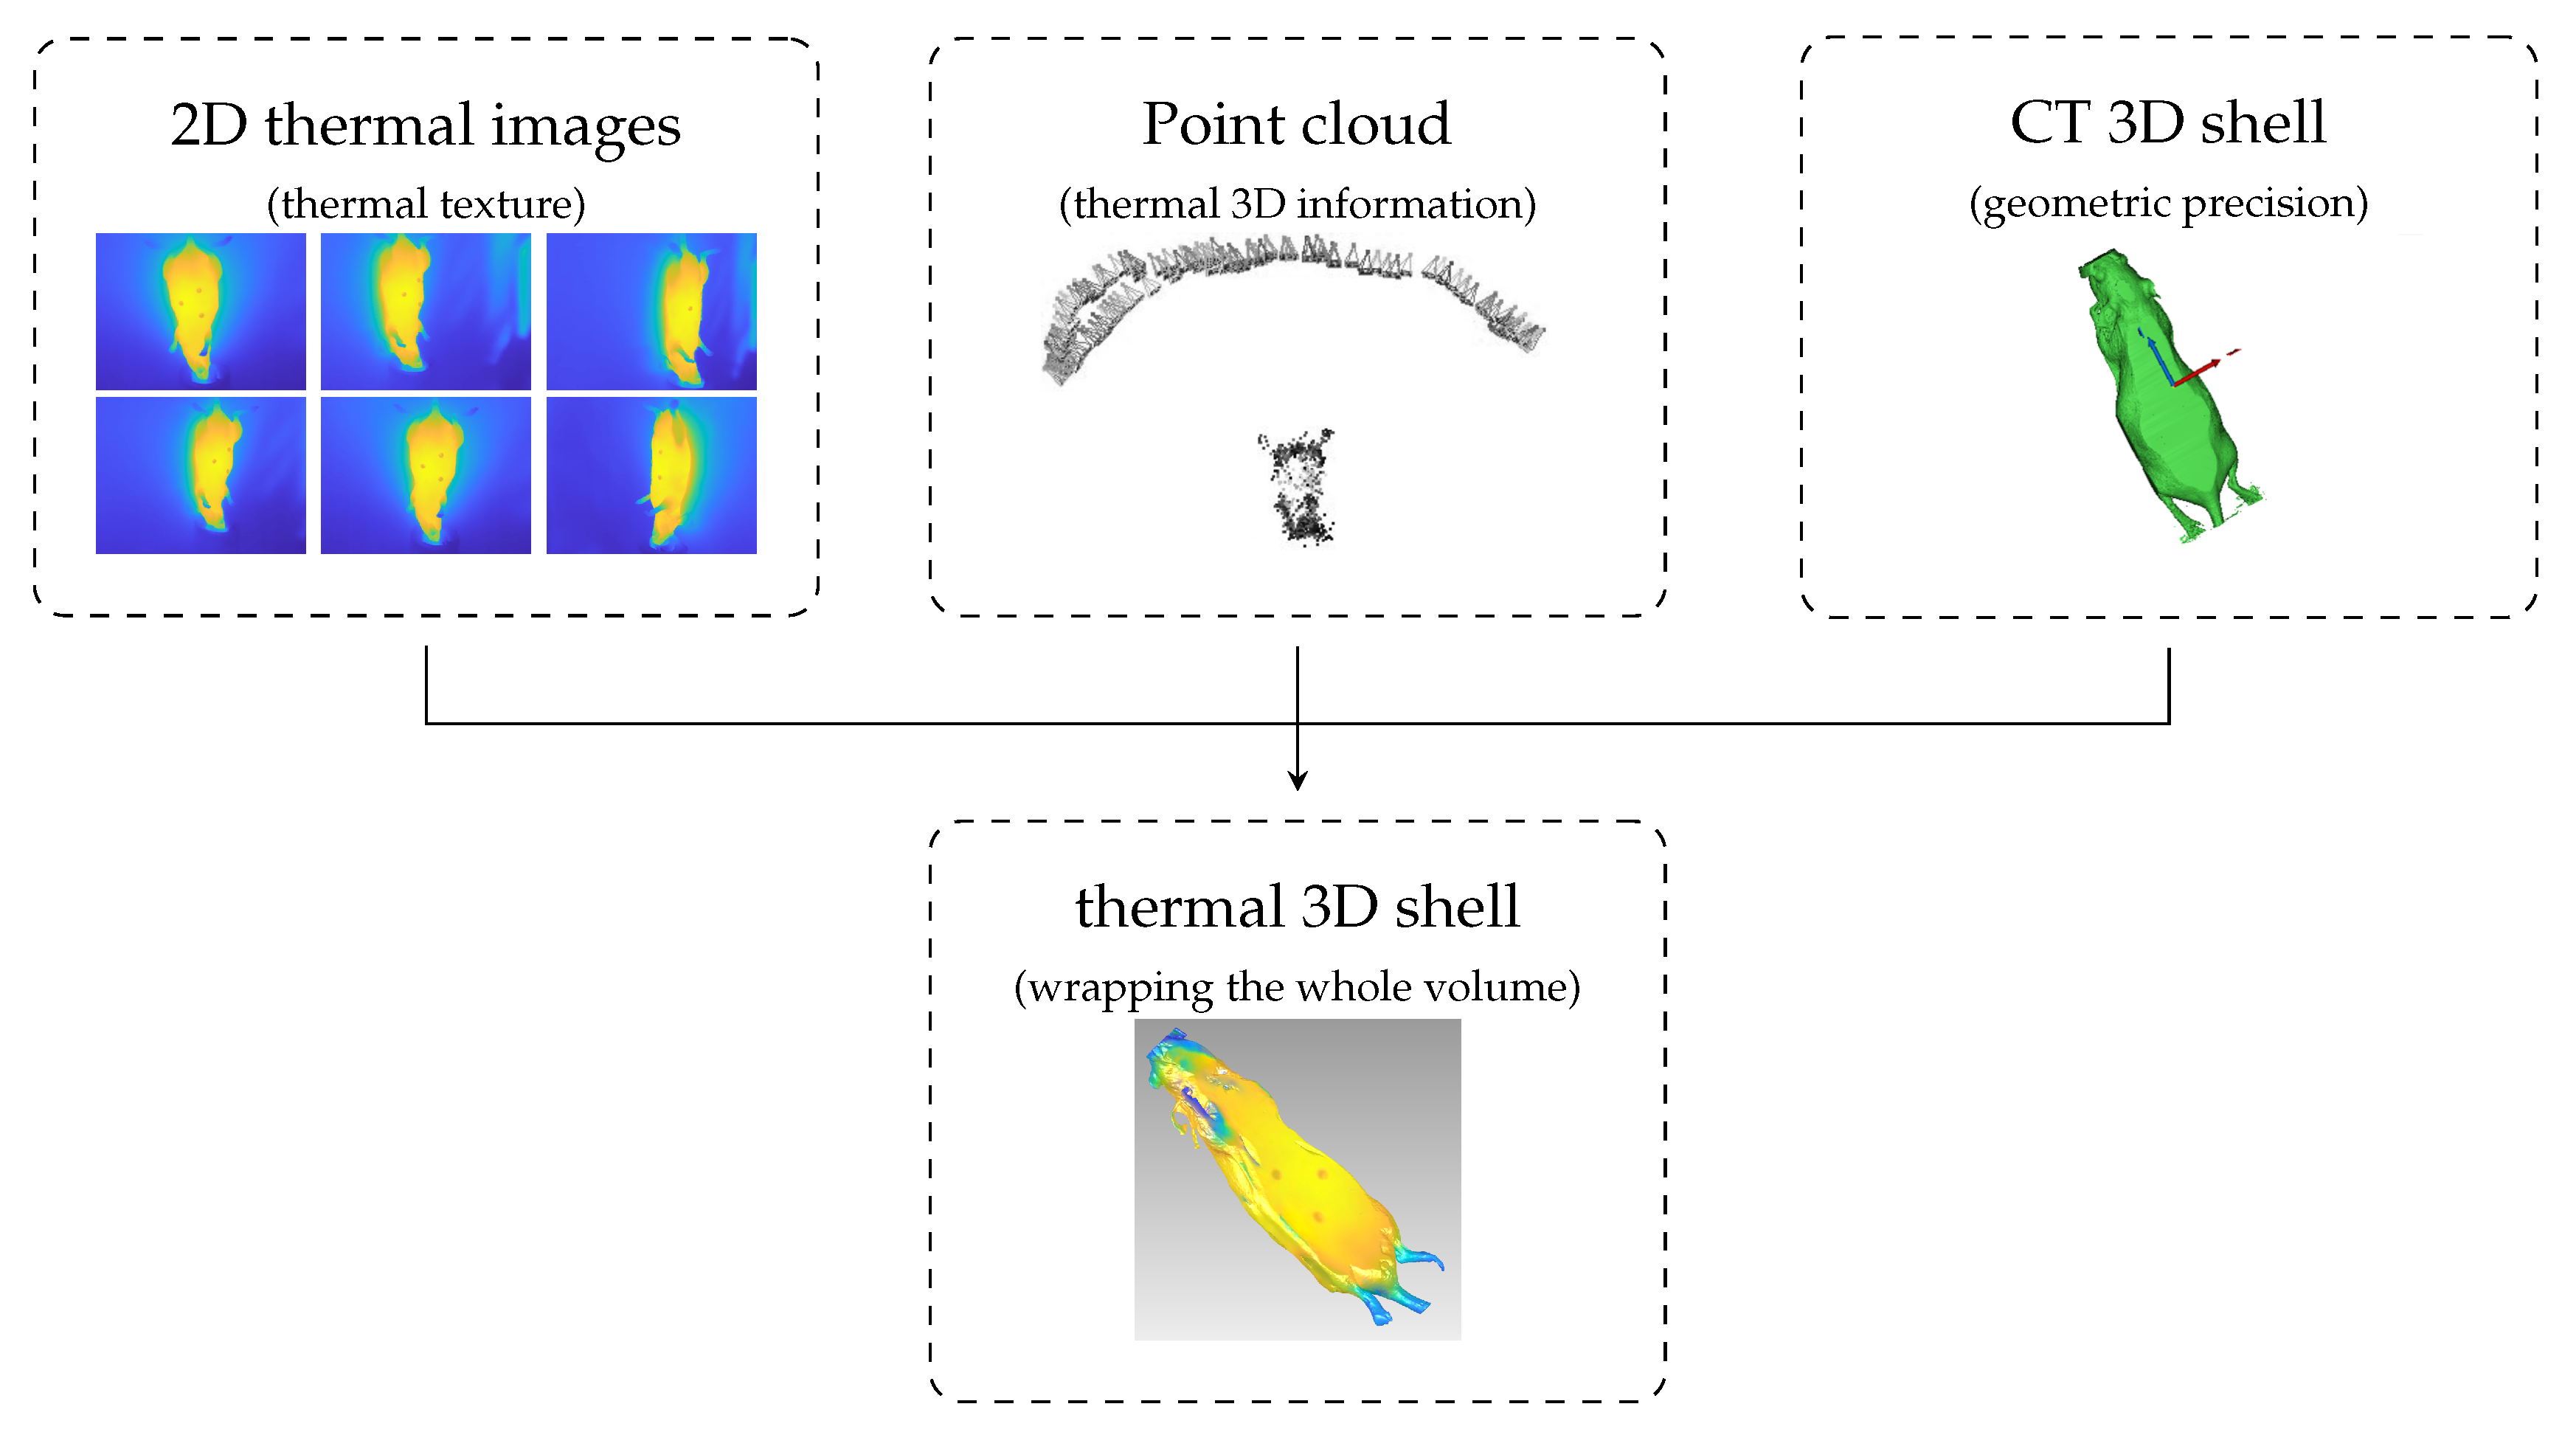
- Point cloud: 3D point cloud of the thermal images generated with the structure from motion (SfM) algorithm.
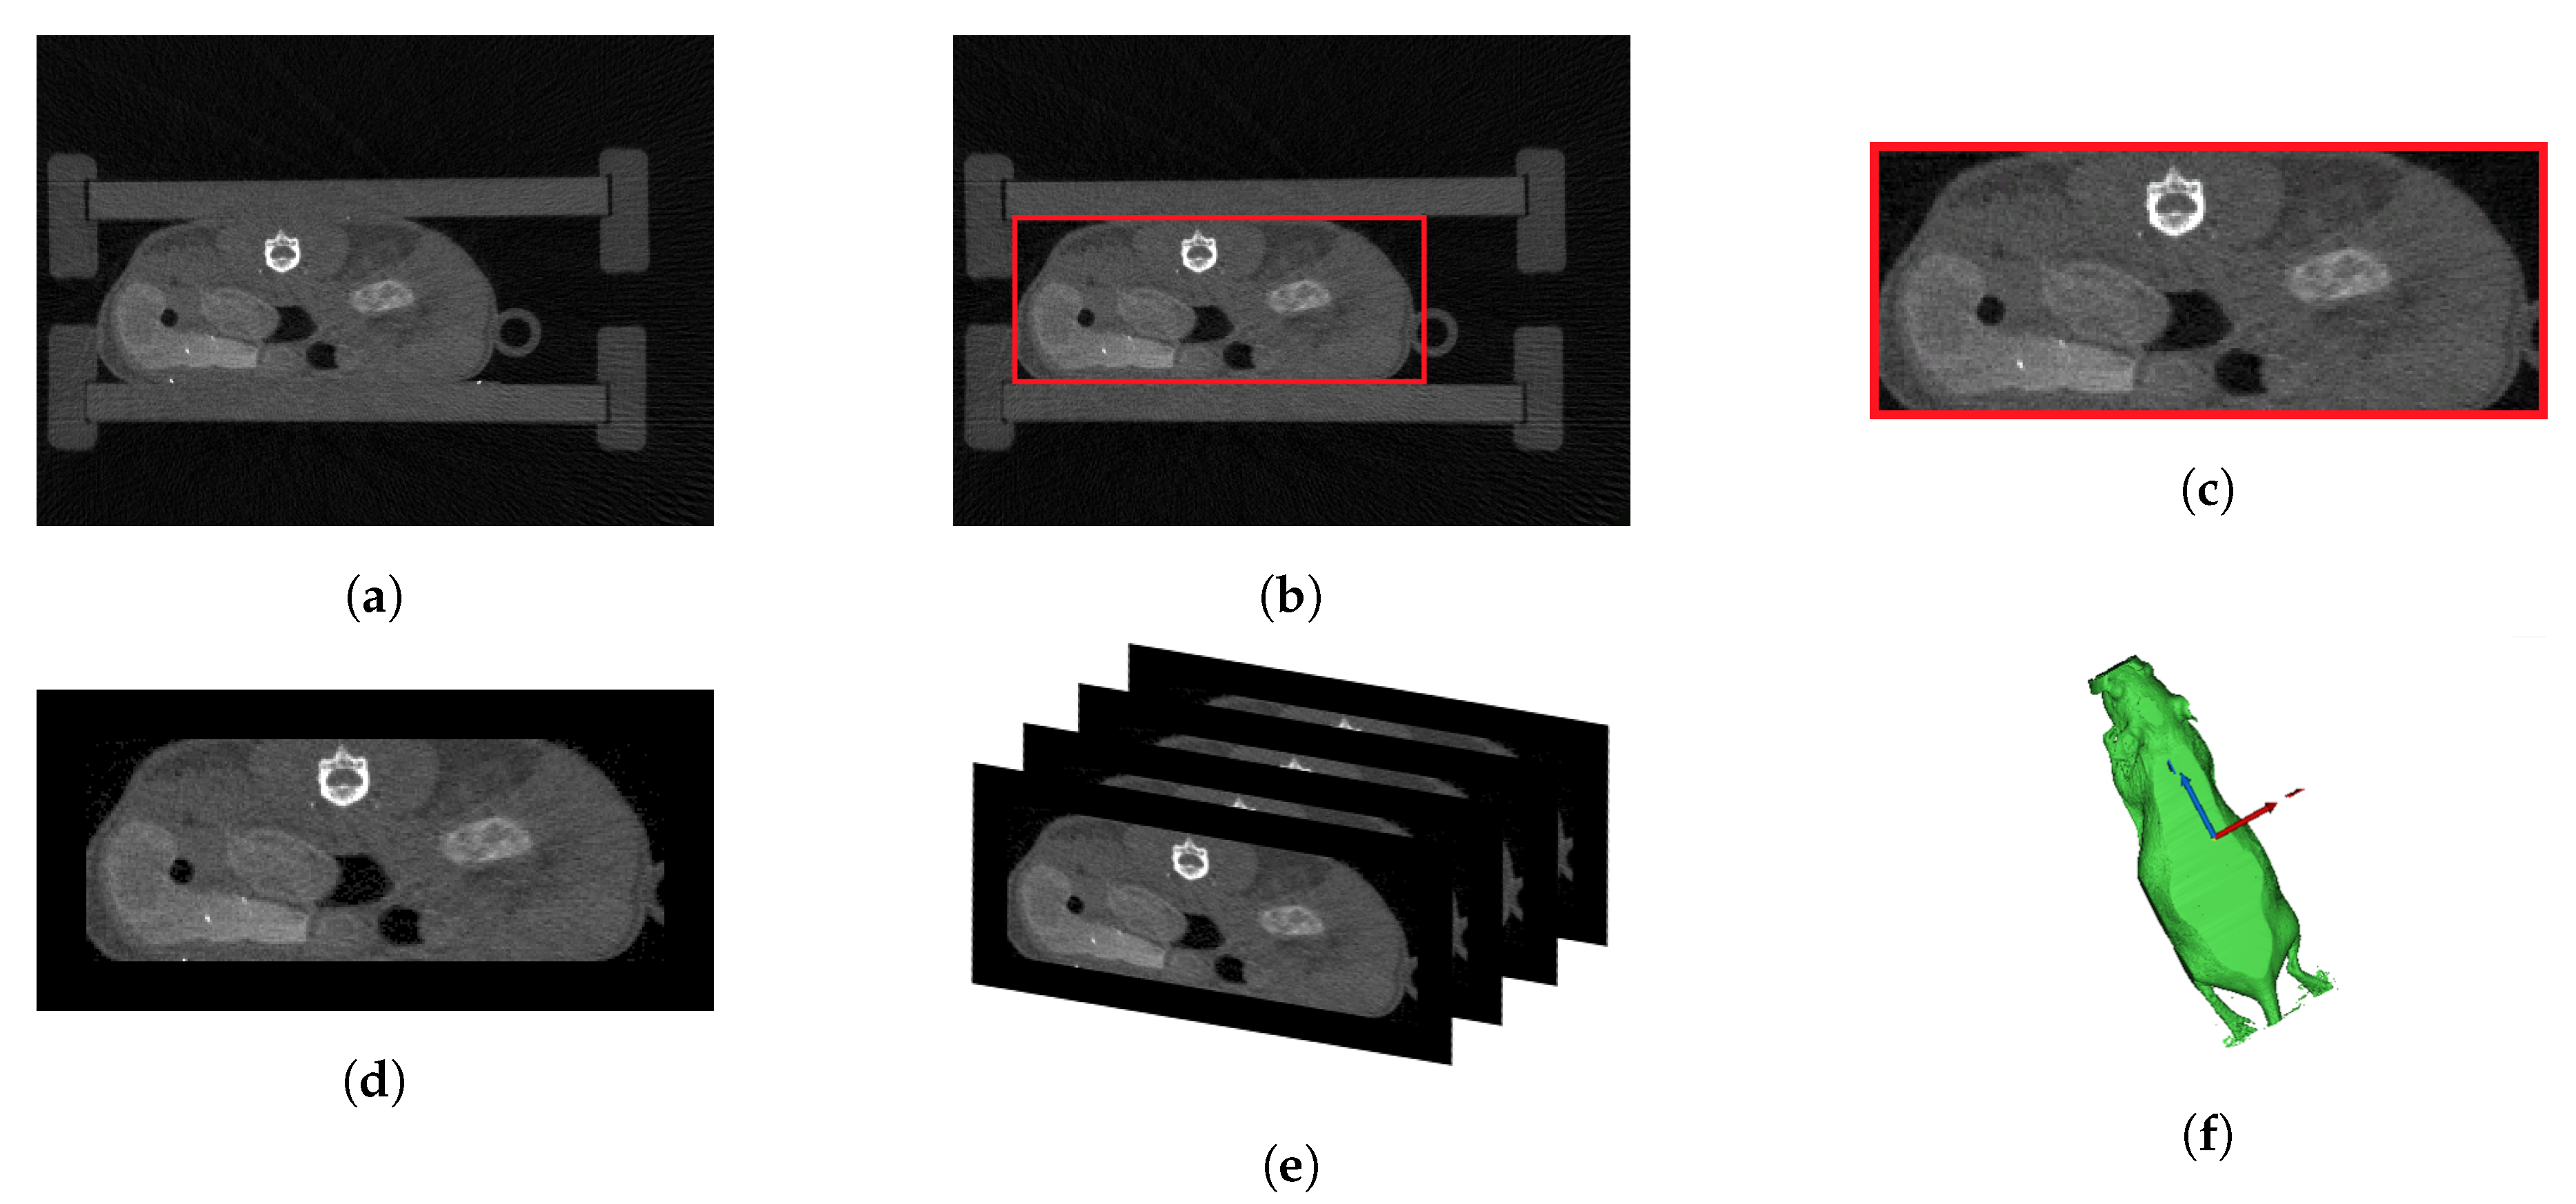
- 3D CT shell: Outer 3D shell based on CT data.
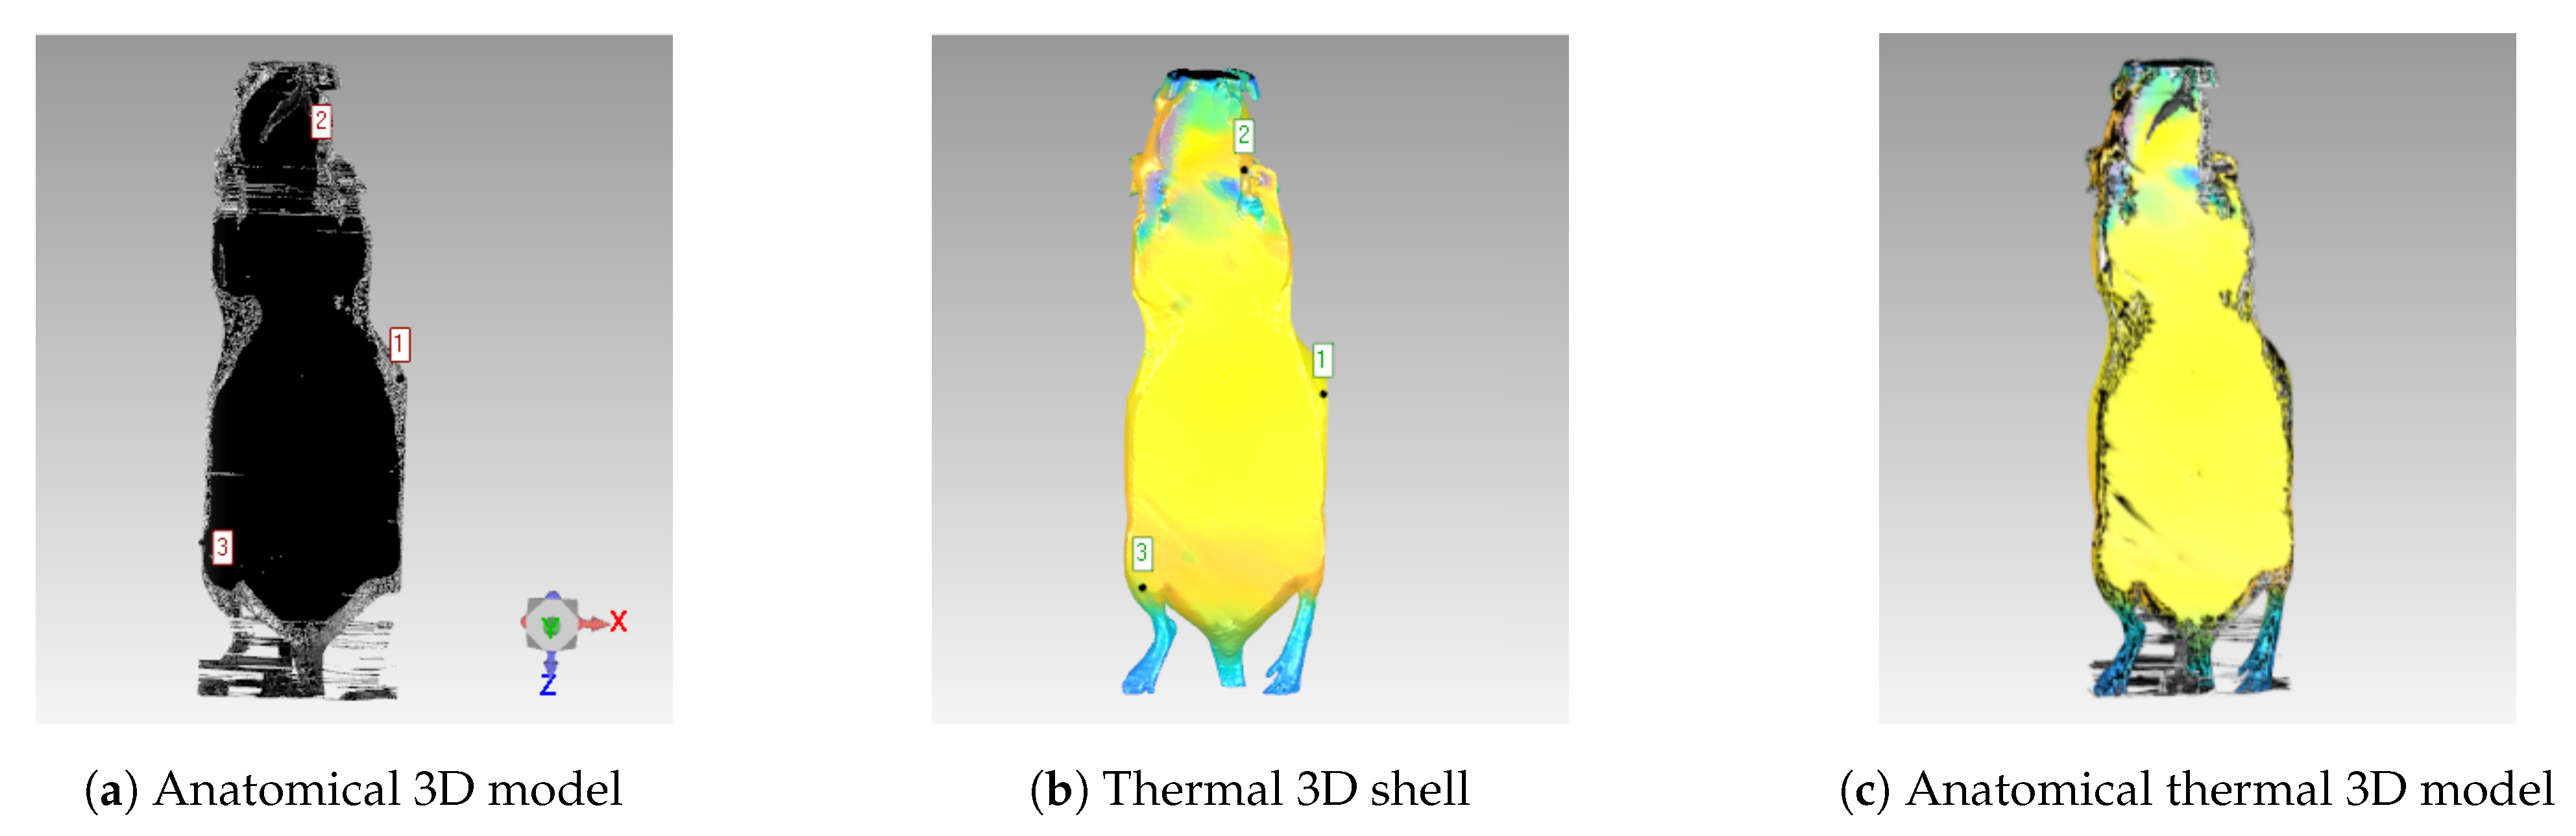
- Anatomical 3D model: 3D inner information based on CT data.
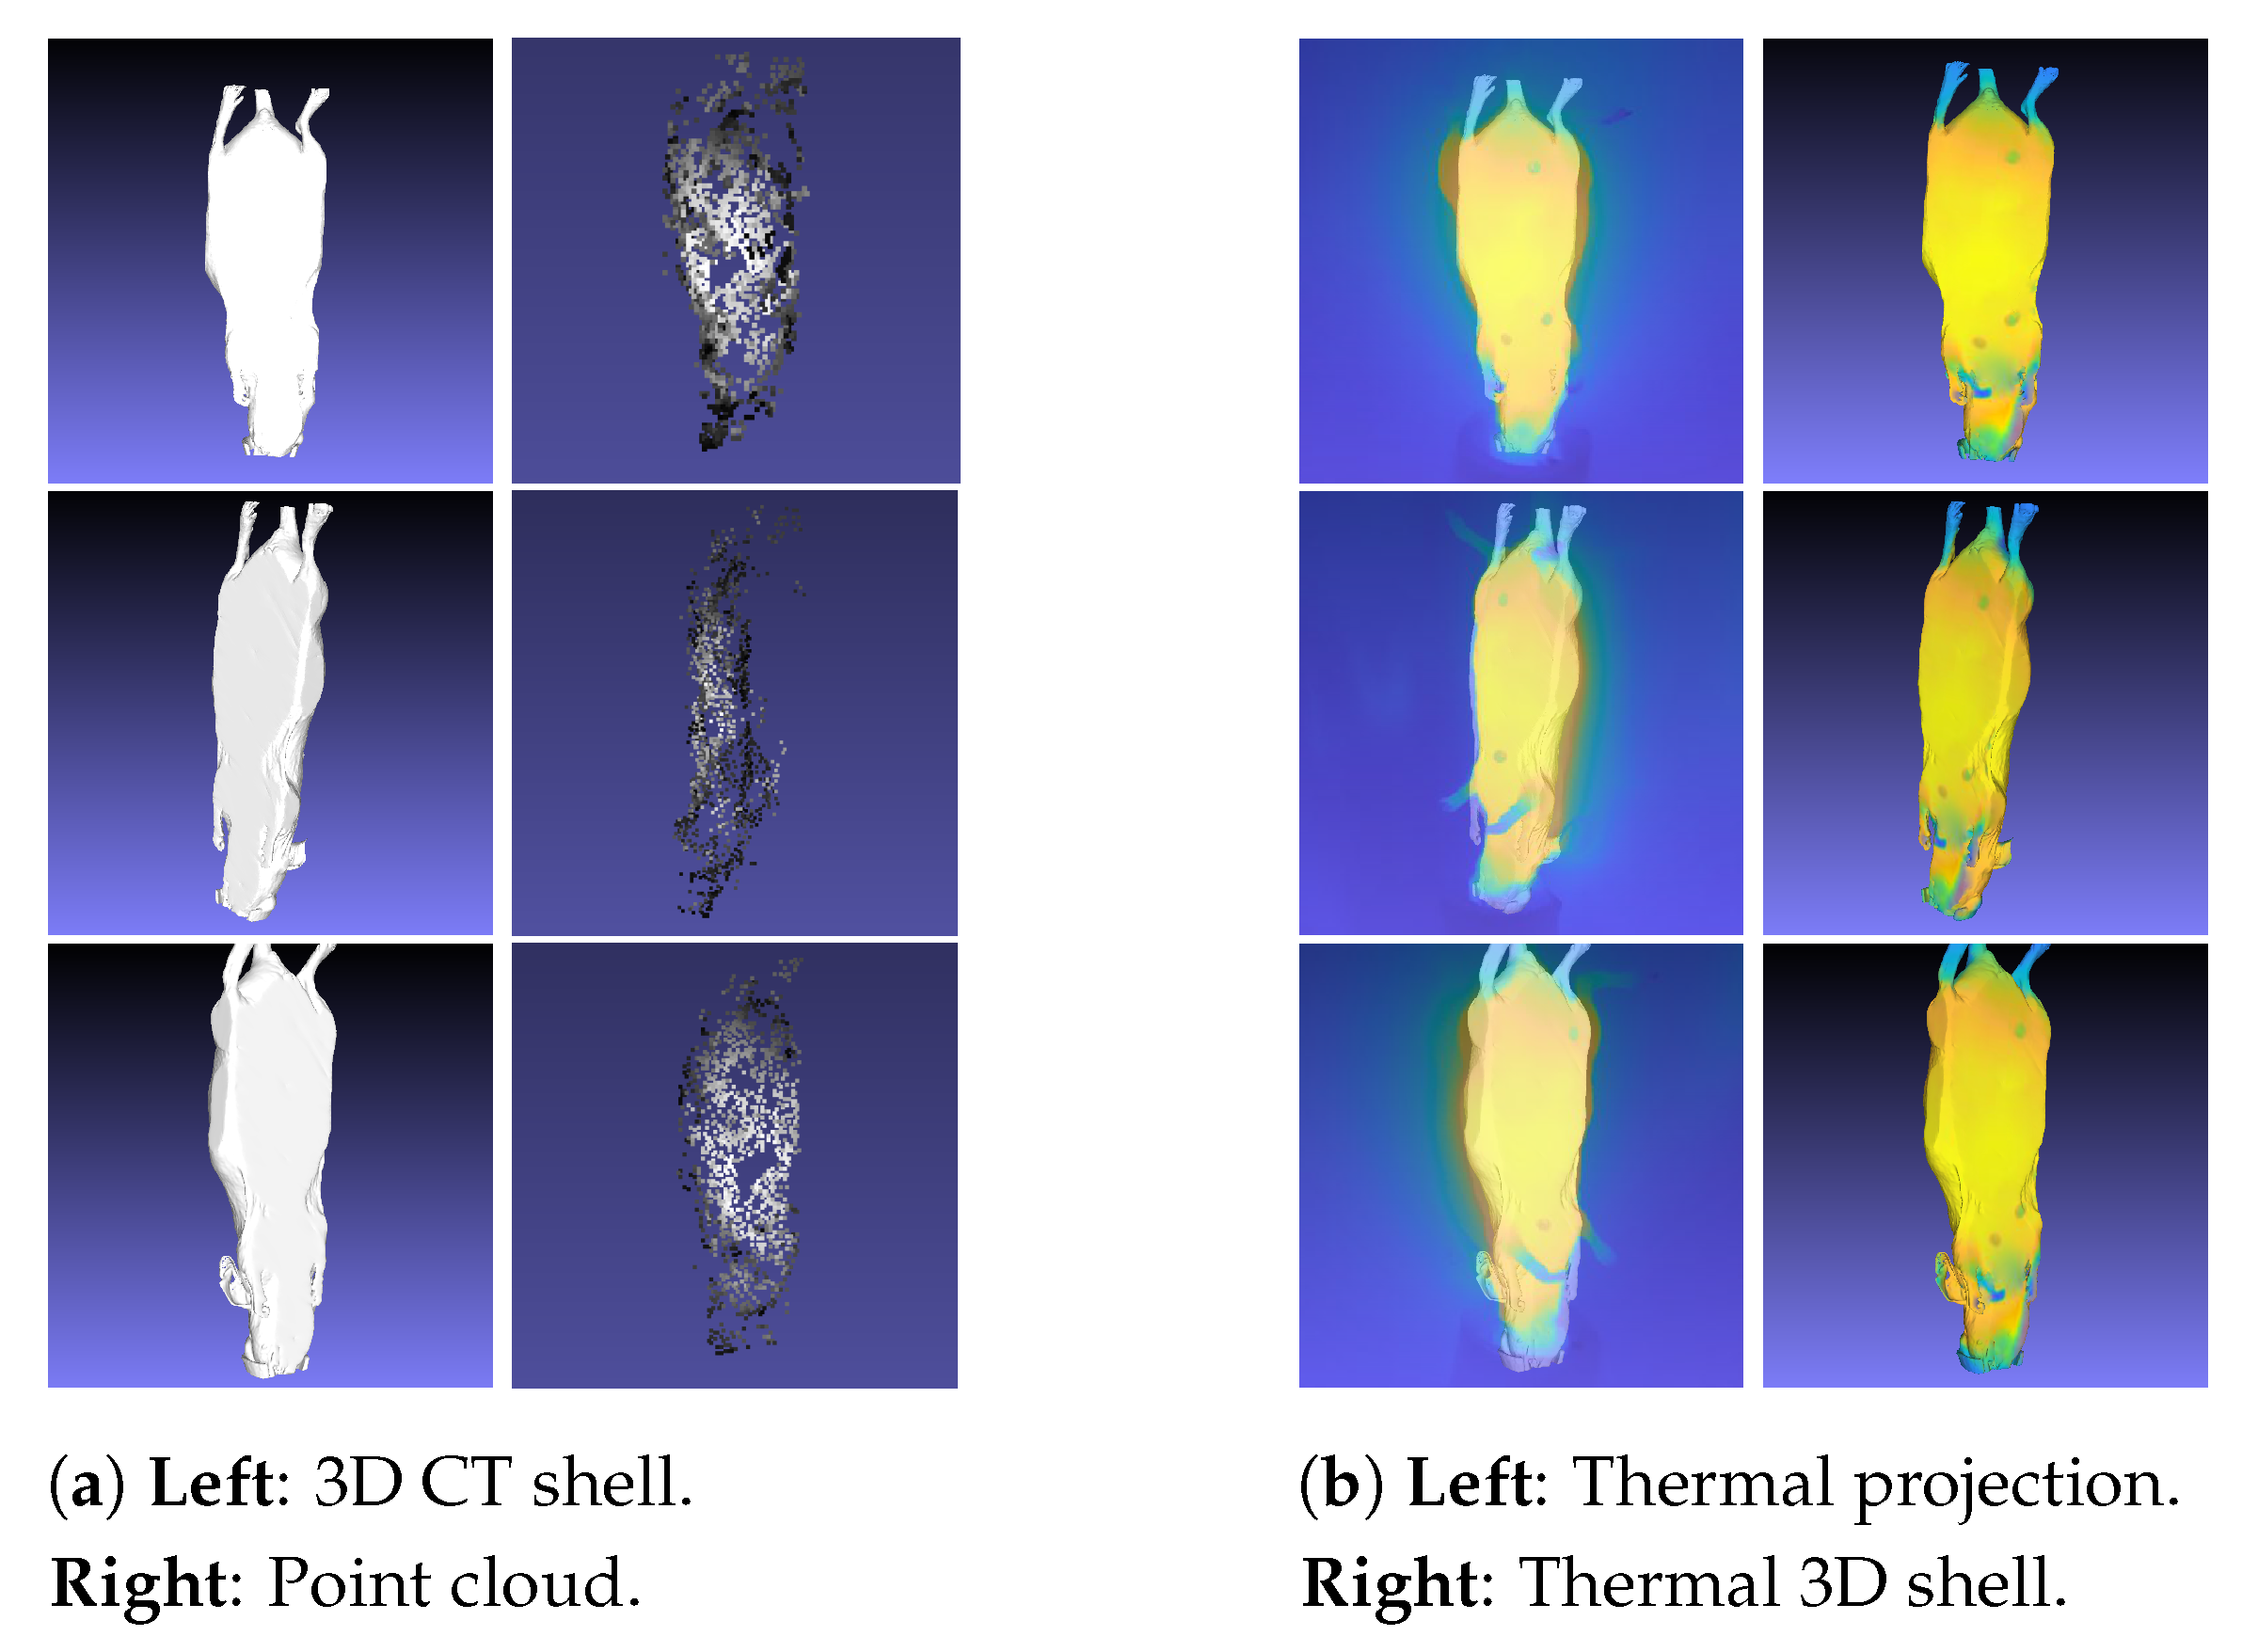
- Thermal 3D shell: 3D shell computed using the thermal images, point cloud, and 3D CT shell.
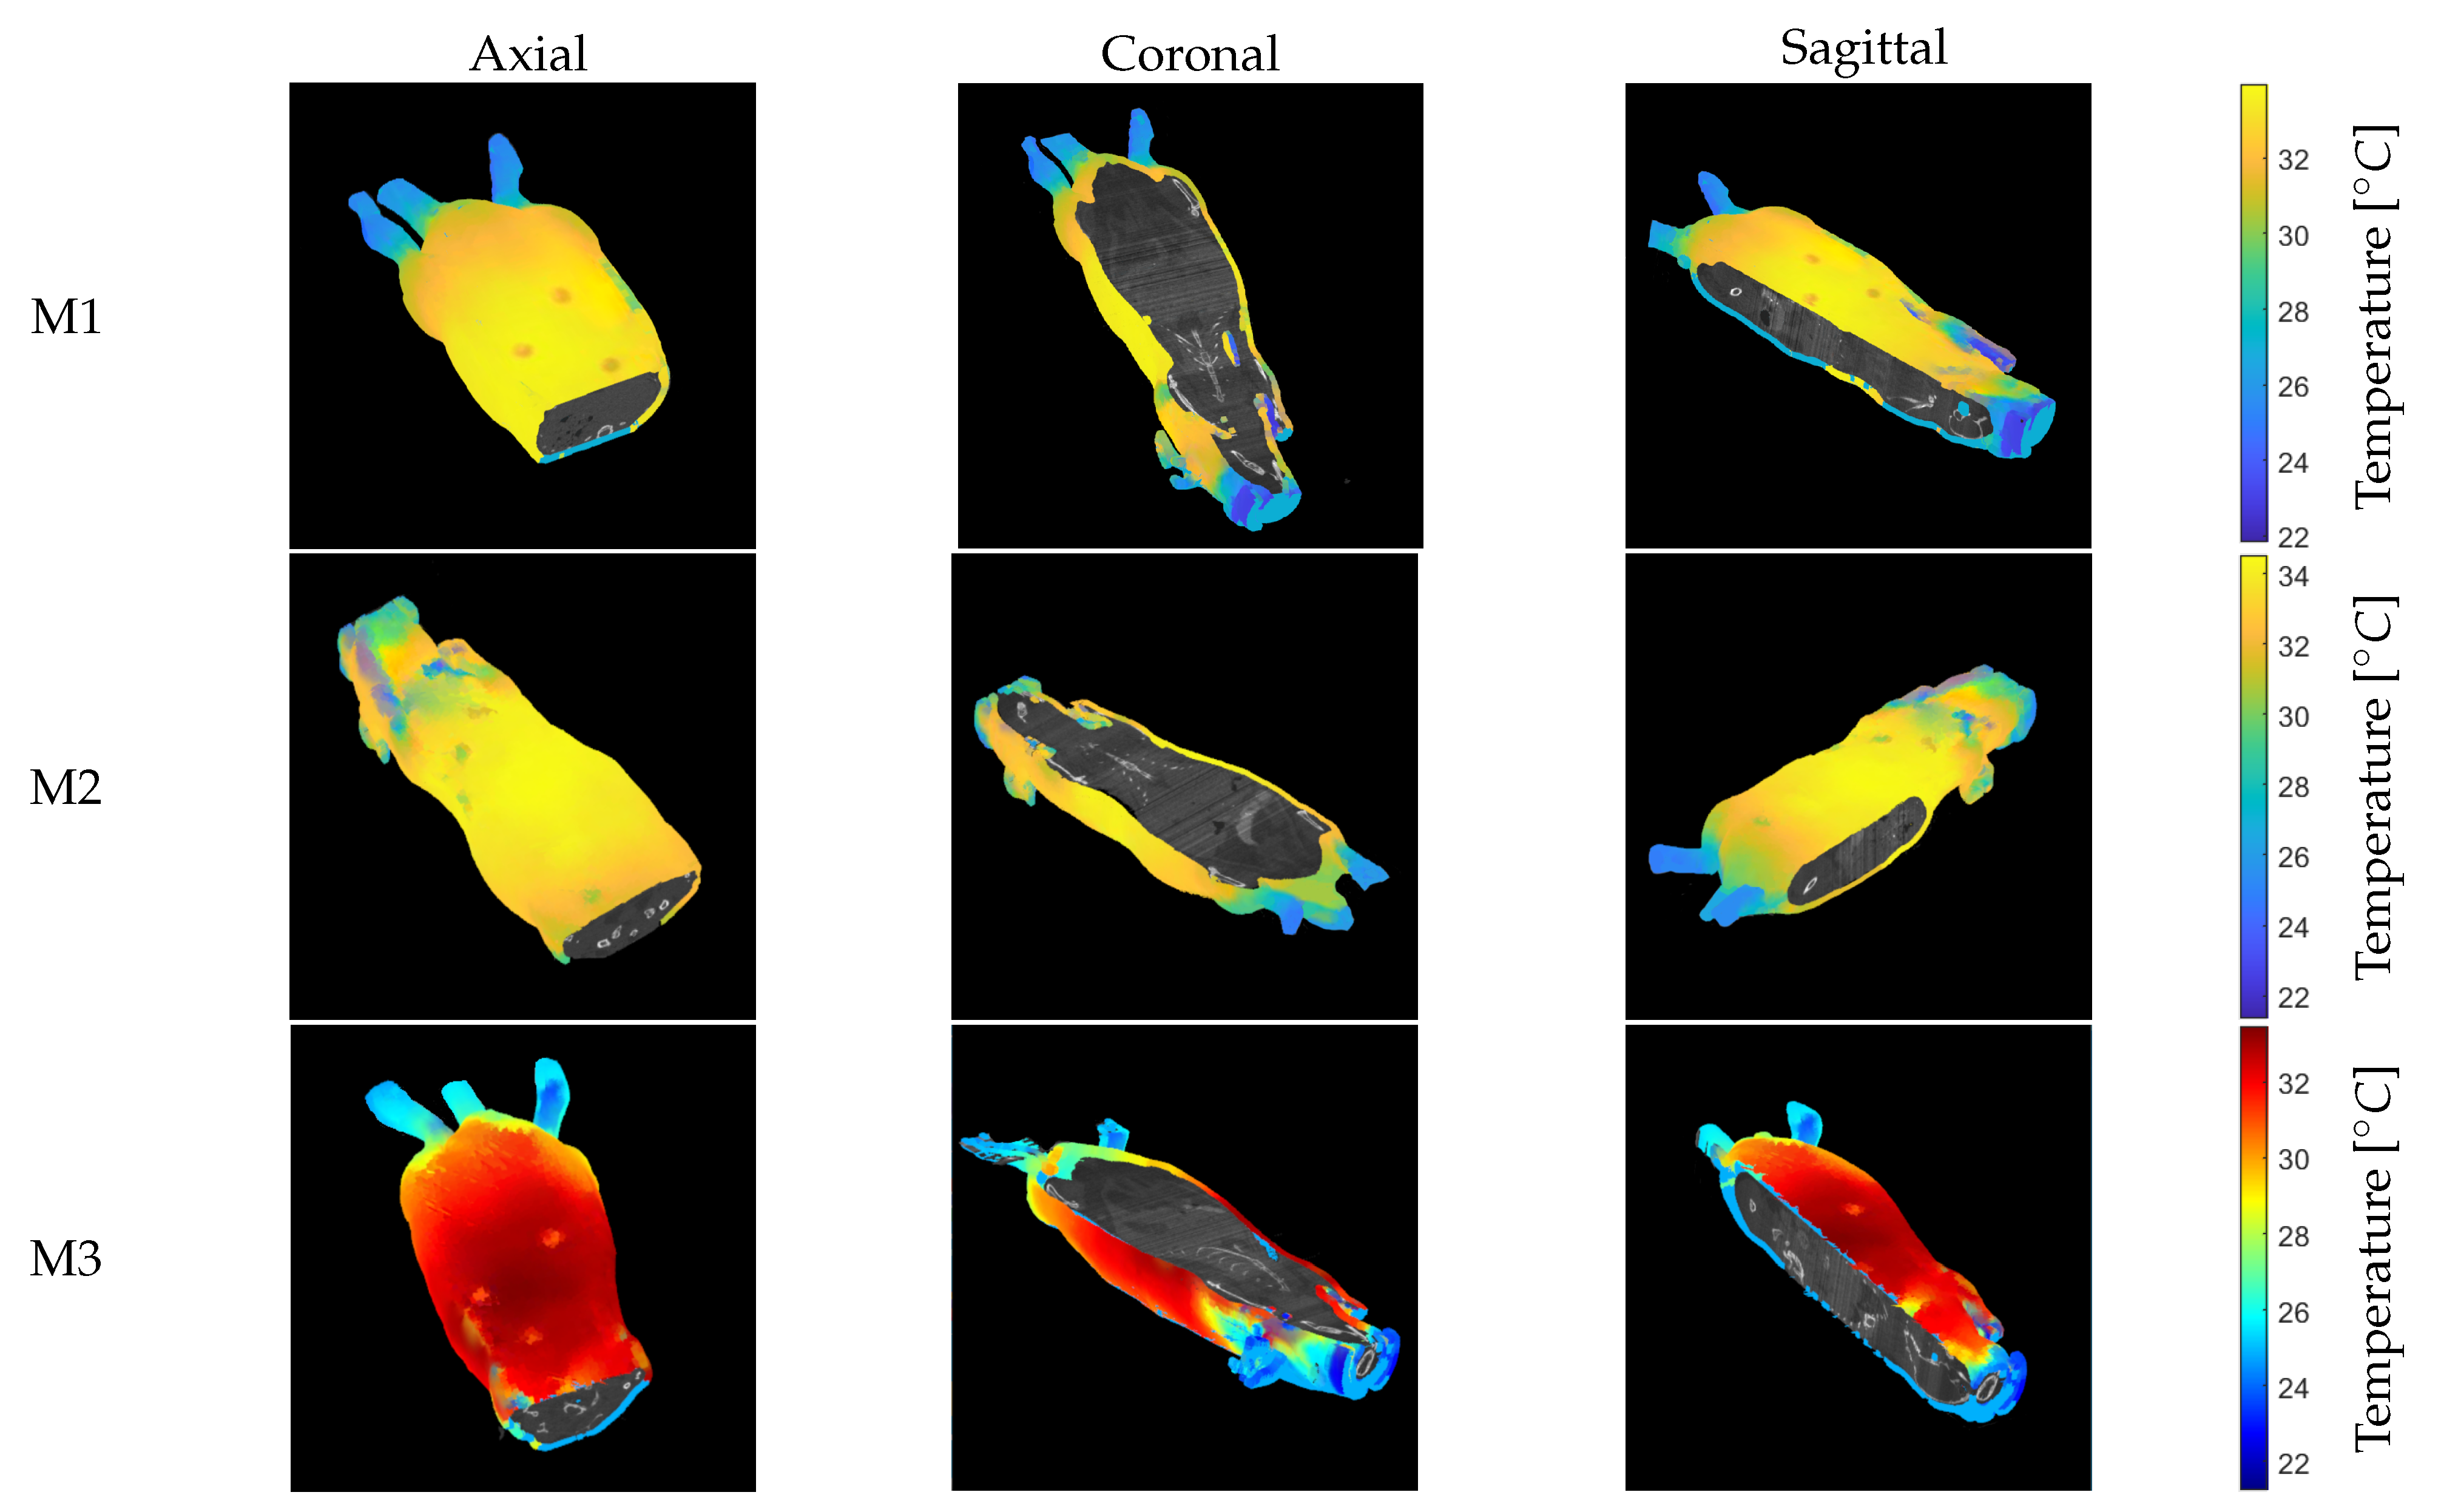
- Anatomical thermal 3D model: 3D combination of inner information (anatomical 3D model) and outer temperature distribution. (thermal 3D shell): anatomical 3D model + thermal 3D shell.
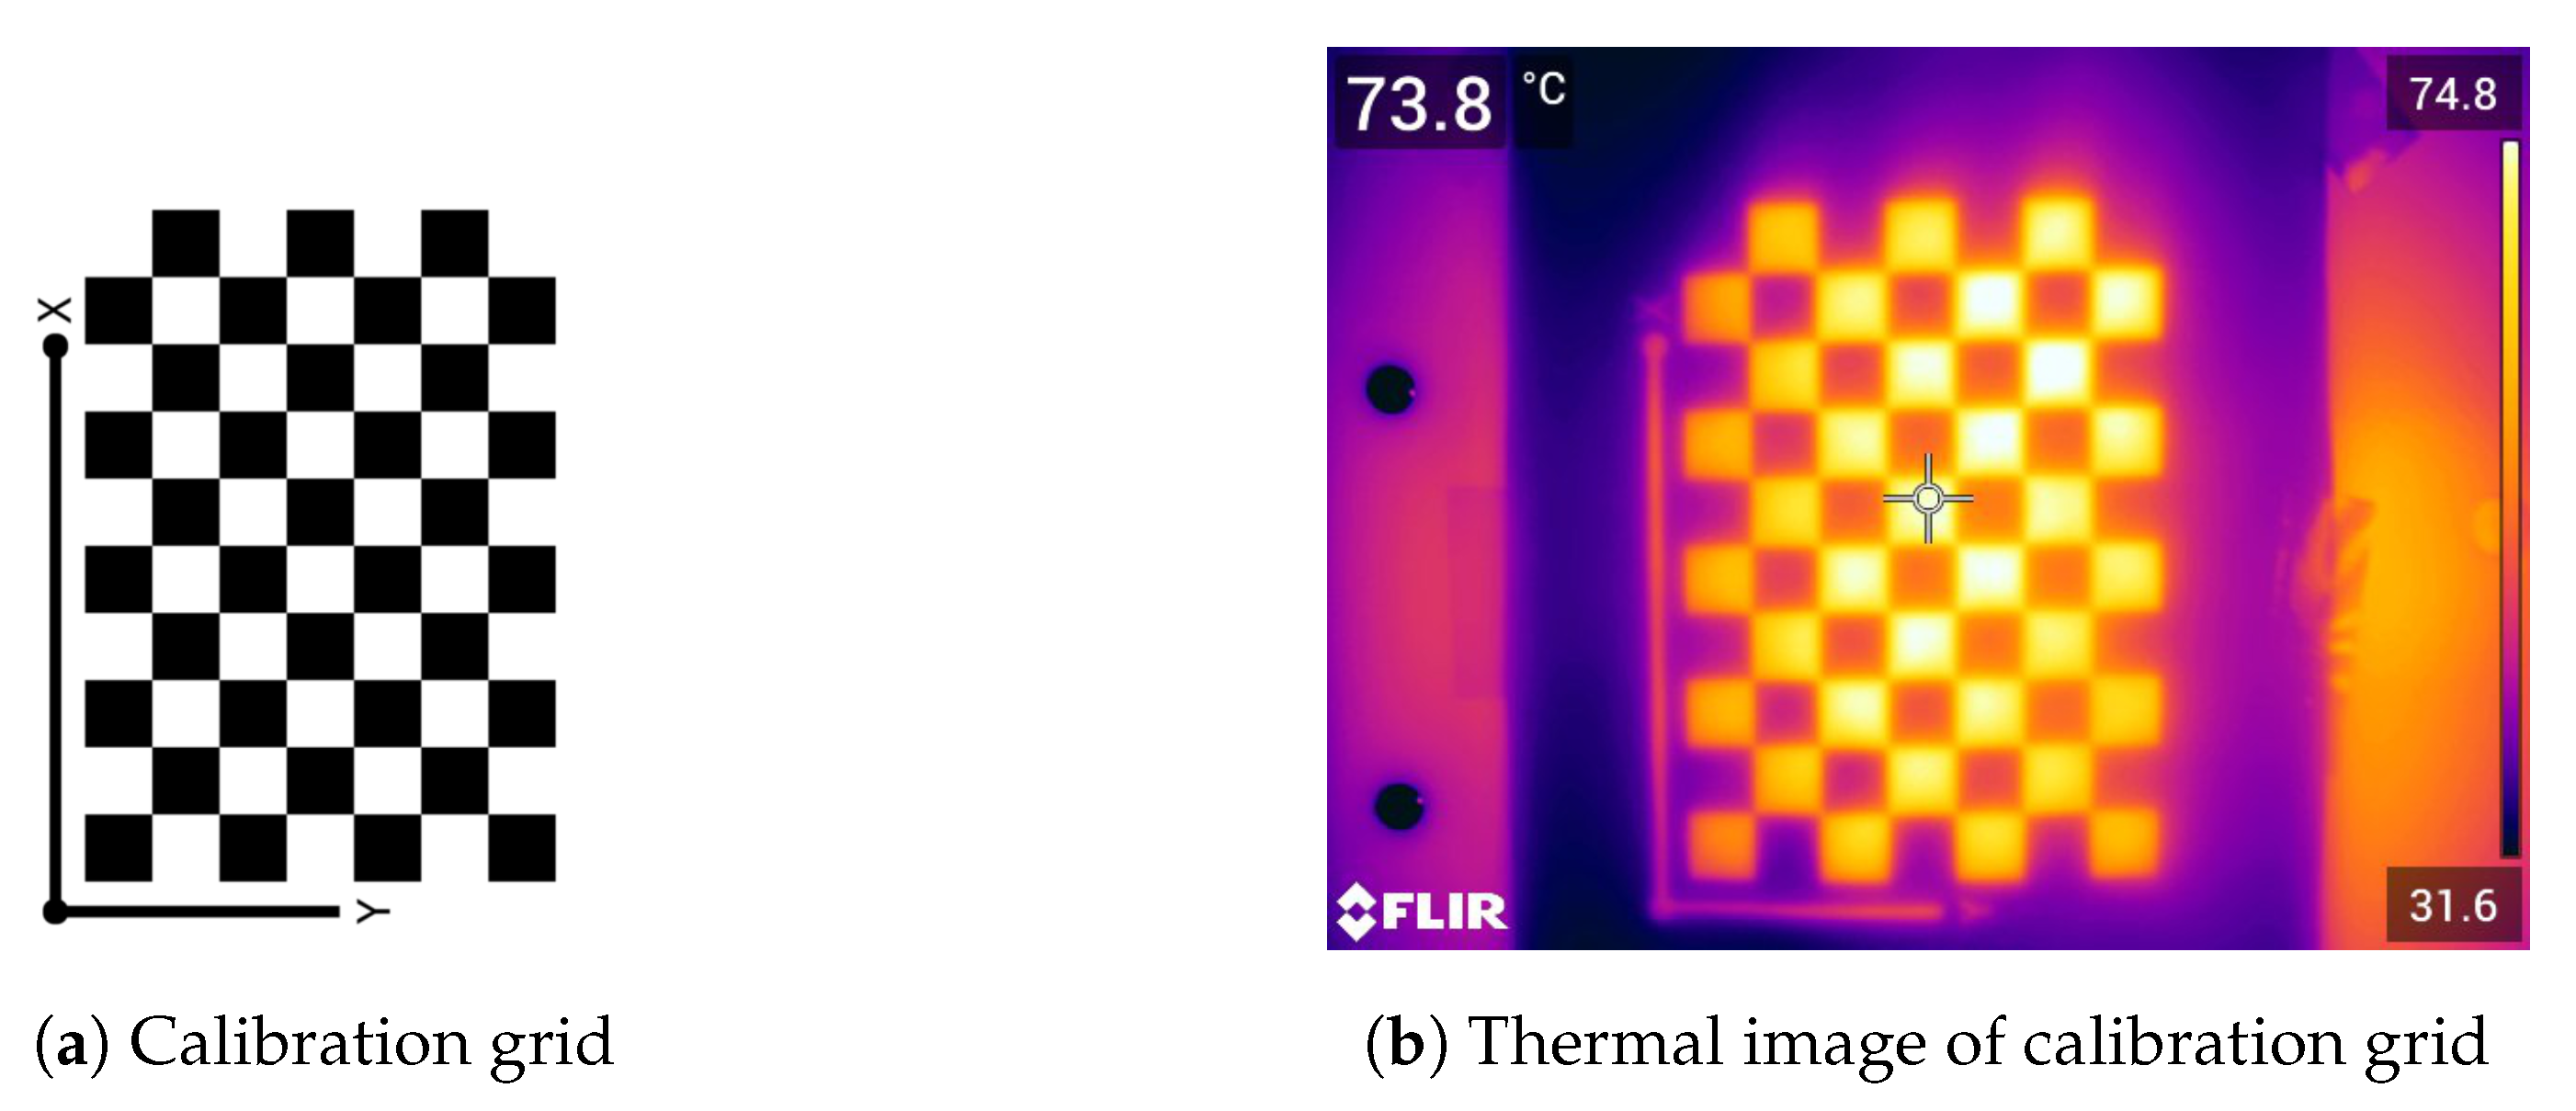
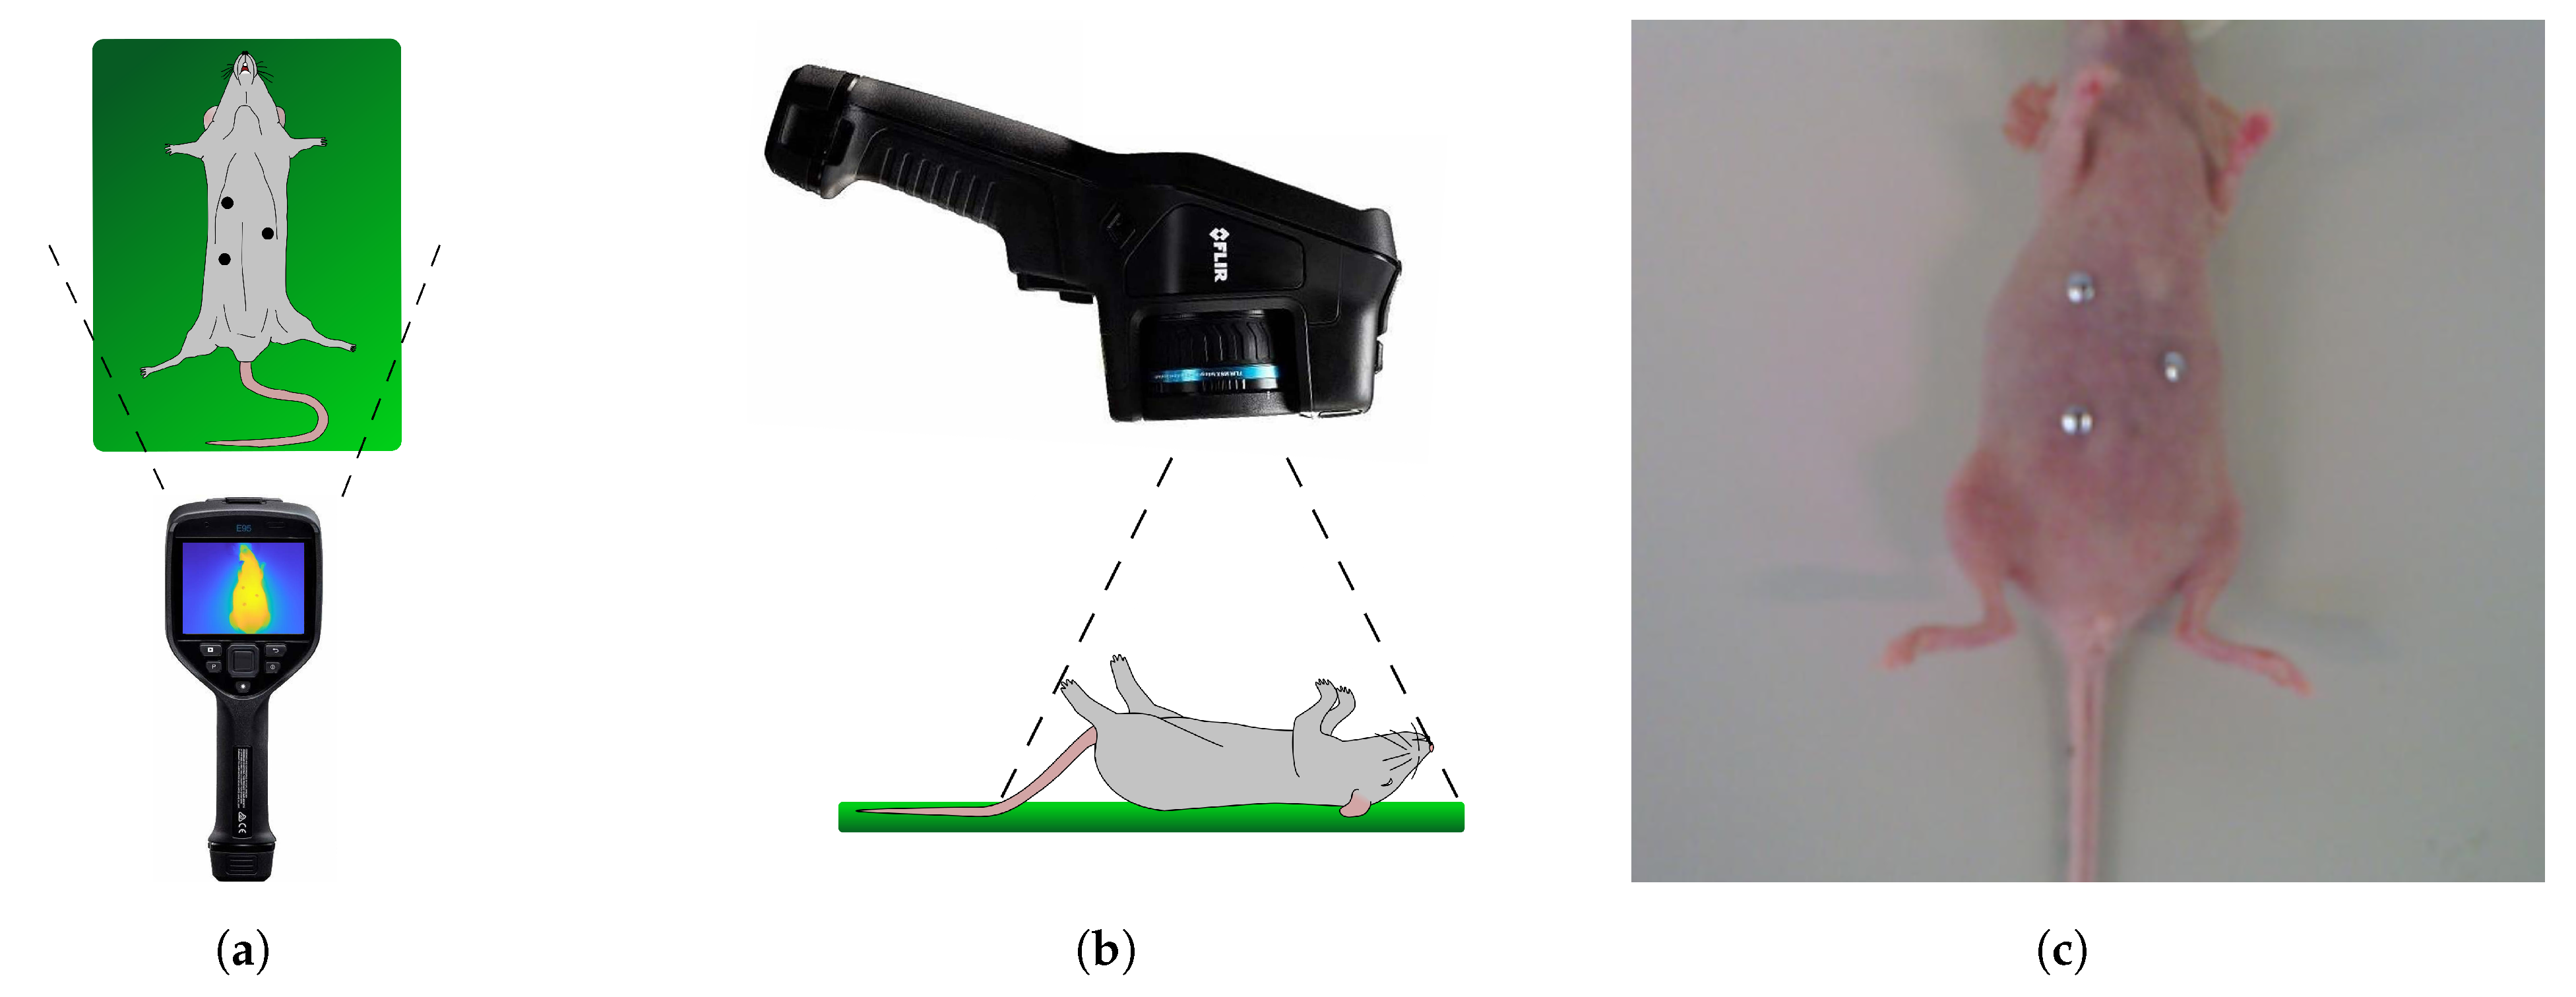
2.1. Thermal Camera Calibration
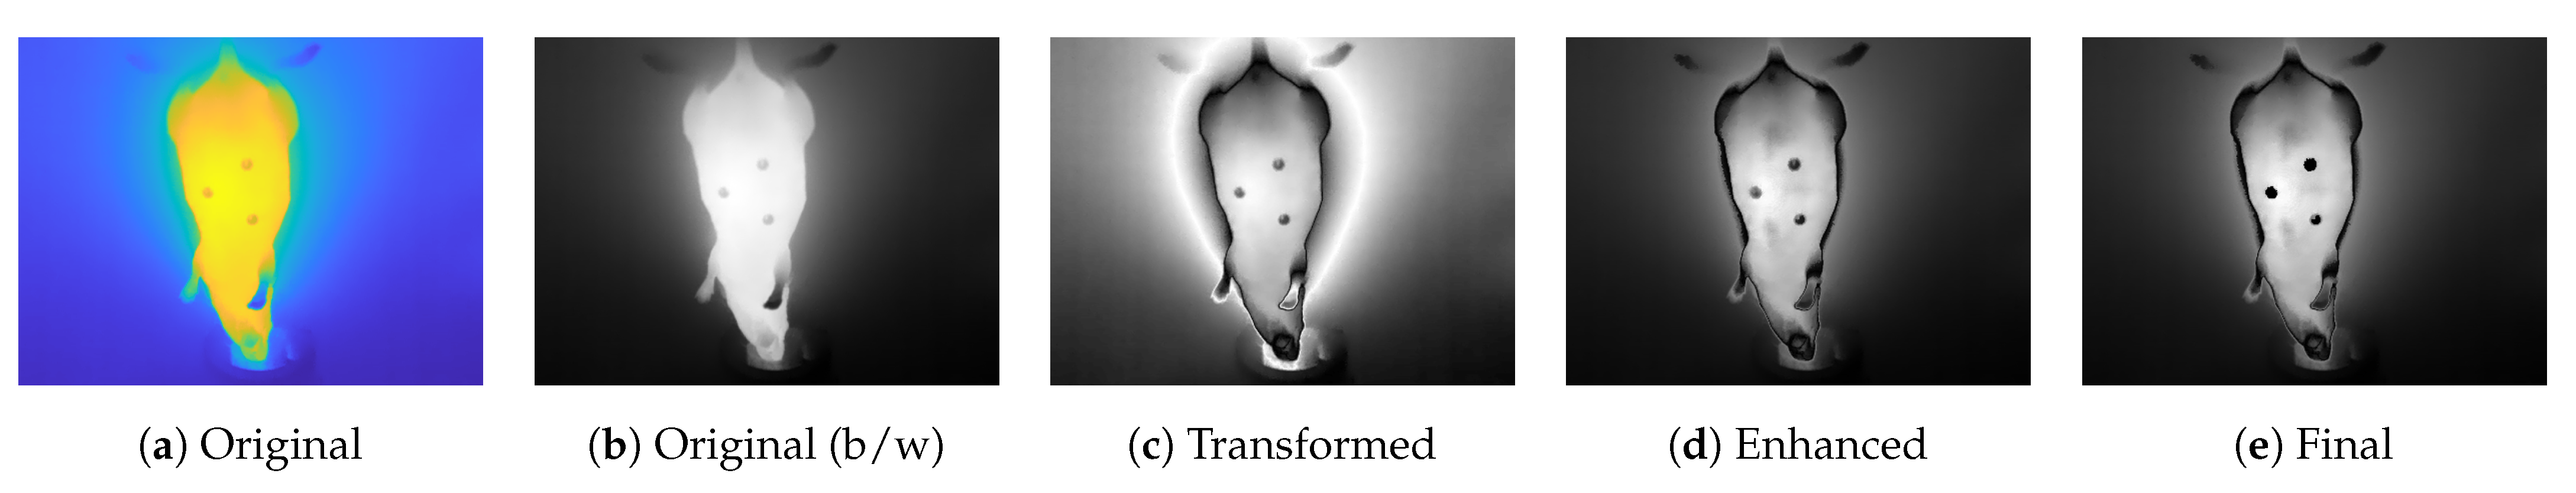
2.2. Preprocessing of Thermal Images
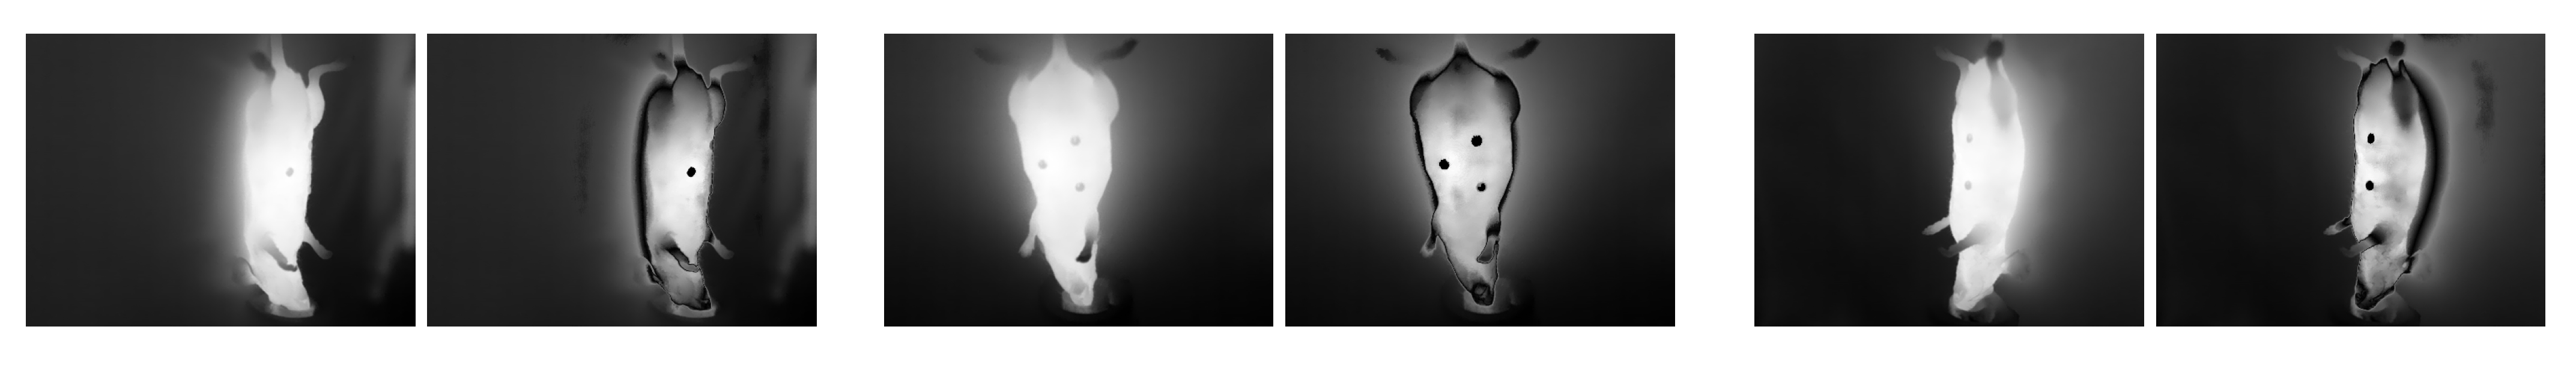
2.3. Structure from Motion
2.4. Preprocessing of CT Data and Model Computation
2.5. Thermal 3D Shell
2.6. 3D Registration and Visualization
3. Experimental Protocol
4. Results
5. Discussion
6. Conclusions
Supplementary Materials
Author Contributions
Funding
Institutional Review Board Statement
Informed Consent Statement
Data Availability Statement
Conflicts of Interest
Abbreviations
| CT | Computed tomography |
| GUI | Graphical user interface |
| SfM | Structure from motion |
| ROI | Region of interest |
References
- Andersen, M.L.; Winter, L.M. Animal models in biological and biomedical research—Experimental and ethical concerns. An. Acad. Bras. Ciências 2019, 91, e20170238. [Google Scholar] [CrossRef] [PubMed]
- Russell, W.M.S.; Burch, R.L. The Principles of Humane Experimental Technique, special ed.; UFAW: Potters Bar, UK, 1992. [Google Scholar]
- Pereira, C.; Kunczik, J.; Zieglowski, L.; Tolba, R.; Abdelrahman, A.; Zechner, D.; Vollmar, B.; Janssen, H.; Thum, T.; Czaplik, M. Remote Welfare Monitoring of Rodents Using Thermal Imaging. Sensors 2018, 18, 3653. [Google Scholar] [CrossRef] [PubMed]
- Jiminez, J.A.; Uwiera, T.C.; Douglas Inglis, G.; Uwiera, R.R.E. Animal models to study acute and chronic intestinal inflammation in mammals. Gut Pathog. 2015, 7, 29. [Google Scholar] [CrossRef] [PubMed]
- Chromy, A.; Klima, O. A 3D Scan Model and Thermal Image Data Fusion Algorithms for 3D Thermography in Medicine. J. Healthc. Eng. 2017, 2017, 1–9. [Google Scholar] [CrossRef]
- Tattersall, G.J. Infrared thermography: A non-invasive window into thermal physiology. Comp. Biochem. Physiol. Part Mol. Integr. Physiol. 2016, 202, 78–98. [Google Scholar] [CrossRef]
- Grubišić, I.; Gjenero, L.; Lipić, T.; Sović, I.; Skala, T. Active 3D scanning based 3D thermography system and medical applications. In Proceedings of the 34th International Convention MIPRO, Opatija, Croatia, 23–27 May 2011; pp. 269–273. [Google Scholar]
- Soerensen, D.D.; Pedersen, L.J. Infrared skin temperature measurements for monitoring health in pigs: A review. Acta Vet. Scand. 2015, 57, 5. [Google Scholar] [CrossRef]
- Pereira, C.B.; Kunczik, J.; Bleich, A.; Haeger, C.; Kiessling, F.; Thum, T.; Tolba, R.; Lindauer, U.; Treue, S.; Czaplik, M. Perspective review of optical imaging in welfare assessment in animal-based research. J. Biomed. Opt. 2019, 24, 1. [Google Scholar] [CrossRef]
- Casas-Alvarado, A.; Mota-Rojas, D.; Hernández-Ávalos, I.; Mora-Medina, P.; Olmos-Hernández, A.; Verduzco-Mendoza, A.; Reyes-Sotelo, B.; Martínez-Burnes, J. Advances in infrared thermography: Surgical aspects, vascular changes, and pain monitoring in veterinary medicine. J. Ther. Biol. 2020, 92, 102664. [Google Scholar] [CrossRef]
- Brzezinski, R.Y.; Ovadia-Blechman, Z.; Lewis, N.; Rabin, N.; Zimmer, Y.; Levin-Kotler, L.; Tepper-Shaihov, O.; Naftali-Shani, N.; Tsoref, O.; Grossman, E.; et al. Non-invasive thermal imaging of cardiac remodeling in mice. Biomed. Opt. Express 2019, 10, 6189. [Google Scholar] [CrossRef]
- Całkosiński, I.; Dobrzyński, M.; Rosińczuk, J.; Dudek, K.; Chrószcz, A.; Fita, K.; Dymarek, R. The Use of Infrared Thermography as a Rapid, Quantitative, and Noninvasive Method for Evaluation of Inflammation Response in Different Anatomical Regions of Rats. Biomed. Res. Int. 2015, 2015, 1–9. [Google Scholar] [CrossRef]
- Brzezinski, R.Y.; Levin-Kotler, L.; Rabin, N.; Ovadia-Blechman, Z.; Zimmer, Y.; Sternfeld, A.; Finchelman, J.M.; Unis, R.; Lewis, N. Tepper-Shaihov, O.; et al. Automated thermal imaging for the detection of fatty liver disease. Sci. Rep. 2020, 10, 15532. [Google Scholar] [CrossRef]
- Nosrati, Z.; Bergamo, M.; Rodríguez-Rodríguez, C.; Saatchi, K.; Häfeli, U.O. Refinement and Validation of Infrared Thermal Imaging (IRT): A Non-Invasive Technique to Measure Disease Activity in a Mouse Model of Rheumatoid Arthritis. Arthritis Res. Ther. 2020, 22, 281. [Google Scholar] [CrossRef]
- Hoffer, O.A.; Ben-David, M.A.; Katz, E.; Zoltnik Kirshenabum, D.; Alezra, D.; Zimmer, Y.; Kelson, I.; Gannot, I. Thermal imaging as a tool for evaluating tumor treatment efficacy. J. Biomed. Opt. 2018, 23, 1. [Google Scholar] [CrossRef] [PubMed]
- van Doremalen, R.F.M.; van Netten, J.J.; van Baal, J.G.; Vollenbroek-Hutten, M.M.R.; van der Heijden, F. Infrared 3D Thermography for Inflammation Detection in Diabetic Foot Disease: A Proof of Concept. J. Diabetes Sci. Technol. 2020, 14, 46–54. [Google Scholar] [CrossRef]
- de Souza, M.A.; Krefer, A.G.; Benvenutti Borba, G.; Vizinoni e Silva, G.J.; Franco, A.P.G.O.; Gamba, H.R. Generation of 3D thermal models for dentistry applications. In Proceedings of the 2016 38th Annual International Conference of the IEEE Engineering in Medicine and Biology Society (EMBC), Orlando, FL, USA, 16–20 August 2016; pp. 1397–1400. [Google Scholar] [CrossRef]
- Abreu de Souza, M.; Chagas Paz, A.A.; Sanches, I.J.; Nohama, P.; Gamba, H.R. 3D thermal medical image visualization tool: Integration between MRI and thermographic images. In Proceedings of the 2014 36th Annual International Conference of the IEEE Engineering in Medicine and Biology Society, Chicago, IL, USA, 26–30 August 2014; pp. 5583–5586. [Google Scholar] [CrossRef]
- Krefer, A.G.; Lie, M.M.I.; Borba, G.B.; Gamba, H.R.; Lavarda, M.D.; Abreu de Souza, M. A method for generating 3D thermal models with decoupled acquisition. Comput. Methods Programs Biomed. 2017, 151, 79–90. [Google Scholar] [CrossRef]
- Sengupta, D. A Comparative Study of Some Well Known begin Image Registration Techniques. In Proceedings of the 2018 Conference on Information and Communication Technology (CICT), Jabalpur, India, 26–28 October 2018; pp. 1–5. [Google Scholar]
- Butt, M.M.; Hai, Z.; XiaoChen, Q. A benchmark for rotation extraction between two images in visual navigation. In Proceedings of the2018 IEEE CSAA Guidance, Navigation and Control Conference (CGNCC), Xiamen, China, 10–12 August 2018; pp. 1–4. [Google Scholar] [CrossRef]
- Vacca, G. Overview Begin of Open Source Software for Close Range Photogrammetry. Isprs Int. Arch. Photogramm. Remote. Sens. Spat. Inf. Sci. 2019, XLII-4/W14, 239–245. [Google Scholar] [CrossRef]
- Eynard, B.; Nigrelli, V.; Oliveri, S.M.; Peris-Fajarnes, G.; Rizzuti, S. (Eds.) Advances on Mechanics, Design Engineering and Manufacturing, Proceedings of the International Joint Conference on Mechanics, Design Engineering & Advanced Manufacturing (JCM 2016), 14–16 September, 2016, Catania, Italy; Springer International Publishing: Cham, Switzerland, 2017; Lecture Notes in Mechanical Engineering. [Google Scholar] [CrossRef]
- Bamrungthai, P.; Wongkamchang, P. A novel method for camera calibration and image alignment of a thermal/visible image fusion system. In Fourth International Conference on Photonics Solutions (ICPS2019); Mankong, U., Kanprachar, S., Kawanishi, T., Anukool, W., Eds.; SPIE: Chiang Mai, Thailand, 2020; p. 29. [Google Scholar]
- Lagüela, S.; González-Jorge, H.; Armesto, J.; Herráez, J. High performance grid for the metric calibration of thermographic cameras. Meas. Sci. Technol. 2012, 23, 015402. [Google Scholar] [CrossRef]
- Chuang, Y.; Minghui, D.; Xin, H.; Xiaoguang, X.; Xin, Z.; Qinfeng, W.; Xuliang, Z.; Mingzheng, Z. Review of Temperature Measurement Technology With Infrared Thermal Imager. In Proceedings of the 2018 China International begin Conference on Electricity Distribution (CICED), Tianjin, China, 17–19 September 2018; pp. 1065–1067. [Google Scholar] [CrossRef]
- Mfolozi, S.; Malan, A.; Bello-Ochende, T.; Martin, L.J. Numeric Analysis of Temperature Distribution in Man using a 3D Human Model; Cold Spring Harbor Laboratory: Cold Spring Harbor, NY, USA, 2018. [Google Scholar] [CrossRef]
- Zotti, C.; Luo, Z.; Lalande, A.; Jodoin, P.M. Convolutional Neural Network With Shape Prior Applied to Cardiac MRI Segmentation. IEEE J. Biomed. Health Inform. 2019, 23, 1119–1128. [Google Scholar] [CrossRef]
- Rosenhain, S.; Magnuska, Z.A.; Yamoah, G.G.; Rawashdeh, W.A.; Kiessling, F.; Gremse, F. A preclinical micro-computed tomography database including 3D whole body organ segmentations. Sci. Data 2018, 5, 180294. [Google Scholar] [CrossRef]
- Kasturi, M.M.; Sutha, P.; Jayanthi, V.E. Efficient edge detection method for diagnosis of 2D and 3D lung and liver images. In Proceedings of the 2017 International Conference on Inventive Systems and Control (ICISC), Coimbatore, India, 19–20 January 2017; pp. 1–5. [Google Scholar] [CrossRef]
- Manisha; Radhakrishnan, B.; Suresh, L.P. Tumor region extraction using edge detection method in brain MRI images. In Proceedings of the 2017 International Conference on Circuit, Power and Computing Technologies (ICCPCT), Kollam, India, 20–21 April 2017; pp. 1–5. [Google Scholar] [CrossRef]
- McInerney, S.; Carr, E.J.; Simpson, M.J. Parameterising continuum models of heat transfer in heterogeneous living skin using experimental data. Int. J. Heat Mass Transf. 2019, 128, 964–975. [Google Scholar] [CrossRef]
- Zhai, L.; Spano, F.; Li, J.; Rossi, R.M. Development of a multi-layered skin simulant for burn injury evaluation of protective fabrics exposed to low radiant heat. Fire Mater. 2019, 43, 144–152. [Google Scholar] [CrossRef]
- Bayareh, R.; Vera, A.; Leija, L.; Gutierrez, M.I. Simulation of the temperature distribution on a diabetic foot model: A first approximation. In Proceedings of the 2016 13th International Conference on Electrical Engineering, Computing Science and Automatic Control (CCE), Mexico City, Mexico, 26–30 September 2016; pp. 1–5. [Google Scholar] [CrossRef]
- Glowacz, A. Fault diagnosis of electric impact drills using thermal imaging. Measurement 2021, 171, 108815. [Google Scholar] [CrossRef]
- Lin, Q.Y.; Yang, H.Q.; Xie, S.S.; Chen, S.Q.; Ye, Z. Finite Element Analysis for Temperature Distribution of Breast. In Proceedings of the IEEE/ICME International Conference on Complex Medical Engineering, Beijing, China, 23–27 May 2007; pp. 1075–1080. [Google Scholar] [CrossRef]
- Gannot, I.; Ben-David, M.; Hopper, O.; Sholomov, M.; Katz, E.; Kelson, I. A portable thermal imaging device as a feedback system for breast cancer treatment. In Optical Fibers and Sensors for Medical Diagnostics and Treatment Applications XVIII; Gannot, I., Ed.; SPIE: San Francisco, CA, USA, 2018; p. 27. [Google Scholar] [CrossRef]


| Number of Camera Positions | Points | Projections | |
|---|---|---|---|
| Preprocessed Images (with camera information) | 124 () | 1701 | 13,047 |
| Preprocessed Images (without camera information) | 124 () | 918 | 8078 |
| Original Images | 52 () | 137 | 1851 |
Publisher’s Note: MDPI stays neutral with regard to jurisdictional claims in published maps and institutional affiliations. |
© 2021 by the authors. Licensee MDPI, Basel, Switzerland. This article is an open access article distributed under the terms and conditions of the Creative Commons Attribution (CC BY) license (http://creativecommons.org/licenses/by/4.0/).
Share and Cite
Schollemann, F.; Barbosa Pereira, C.; Rosenhain, S.; Follmann, A.; Gremse, F.; Kiessling, F.; Czaplik, M.; Abreu de Souza, M. An Anatomical Thermal 3D Model in Preclinical Research: Combining CT and Thermal Images. Sensors 2021, 21, 1200. https://doi.org/10.3390/s21041200
Schollemann F, Barbosa Pereira C, Rosenhain S, Follmann A, Gremse F, Kiessling F, Czaplik M, Abreu de Souza M. An Anatomical Thermal 3D Model in Preclinical Research: Combining CT and Thermal Images. Sensors. 2021; 21(4):1200. https://doi.org/10.3390/s21041200
Chicago/Turabian StyleSchollemann, Franziska, Carina Barbosa Pereira, Stefanie Rosenhain, Andreas Follmann, Felix Gremse, Fabian Kiessling, Michael Czaplik, and Mauren Abreu de Souza. 2021. "An Anatomical Thermal 3D Model in Preclinical Research: Combining CT and Thermal Images" Sensors 21, no. 4: 1200. https://doi.org/10.3390/s21041200
APA StyleSchollemann, F., Barbosa Pereira, C., Rosenhain, S., Follmann, A., Gremse, F., Kiessling, F., Czaplik, M., & Abreu de Souza, M. (2021). An Anatomical Thermal 3D Model in Preclinical Research: Combining CT and Thermal Images. Sensors, 21(4), 1200. https://doi.org/10.3390/s21041200