
A Multi-Feature Fusion Slam System Attaching Semantic Invariant to Points and Lines


Abstract
1. Introduction
- An improved line segment matching method is proposed. We apply the results of semantic segmentation to line segment matching to improve the data association of line segments.
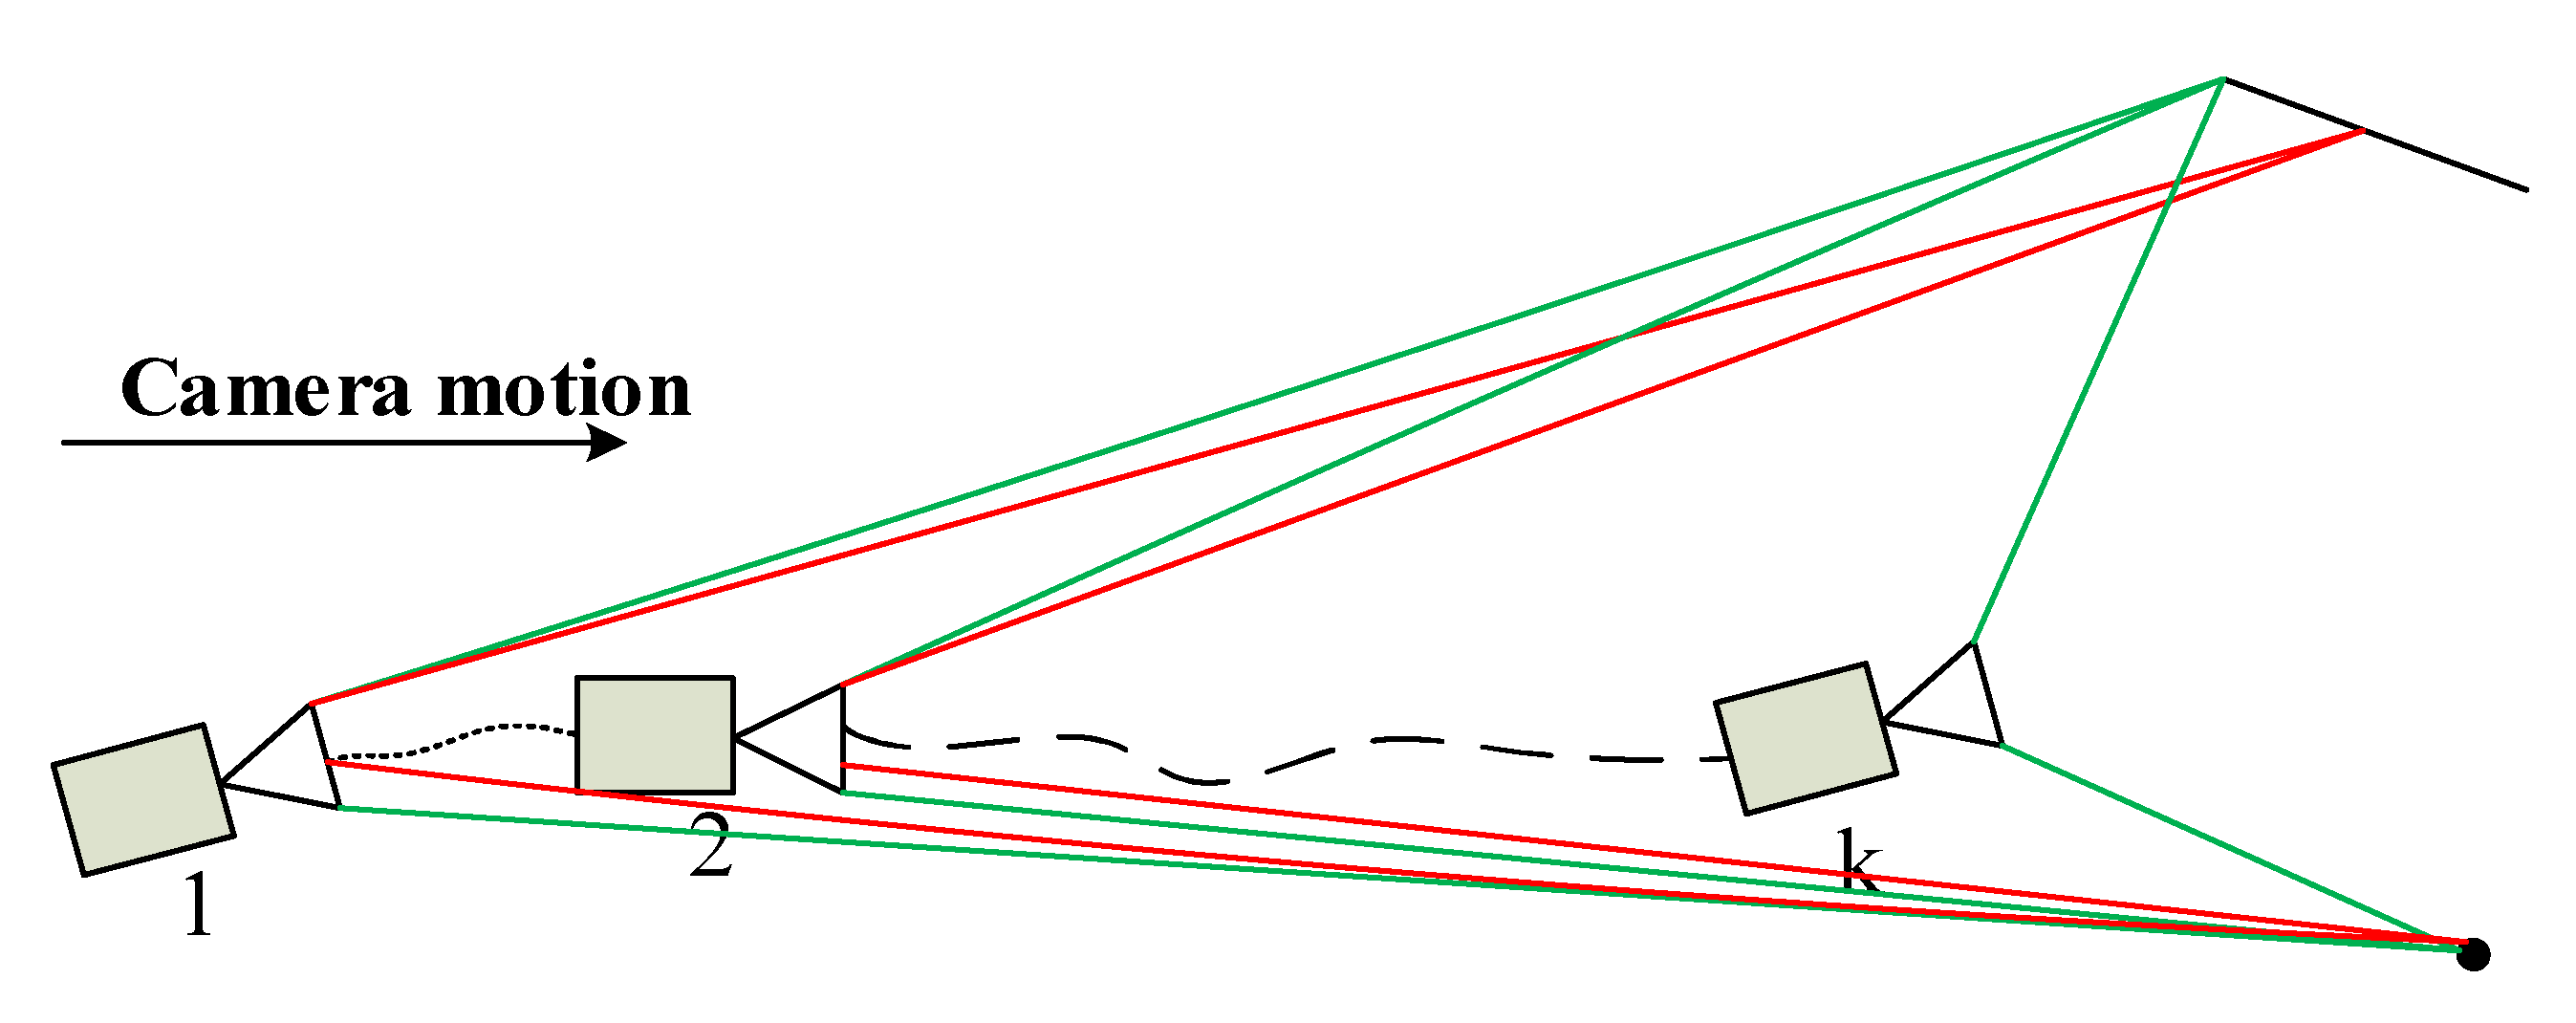
- We define the semantic reprojection error function of line segments and apply it to the pose optimization process to improve the robustness of data association. In this way, the mid-term tracking of line segments is achieved, and the drift problem of trajectories is reduced.
2. Related Work
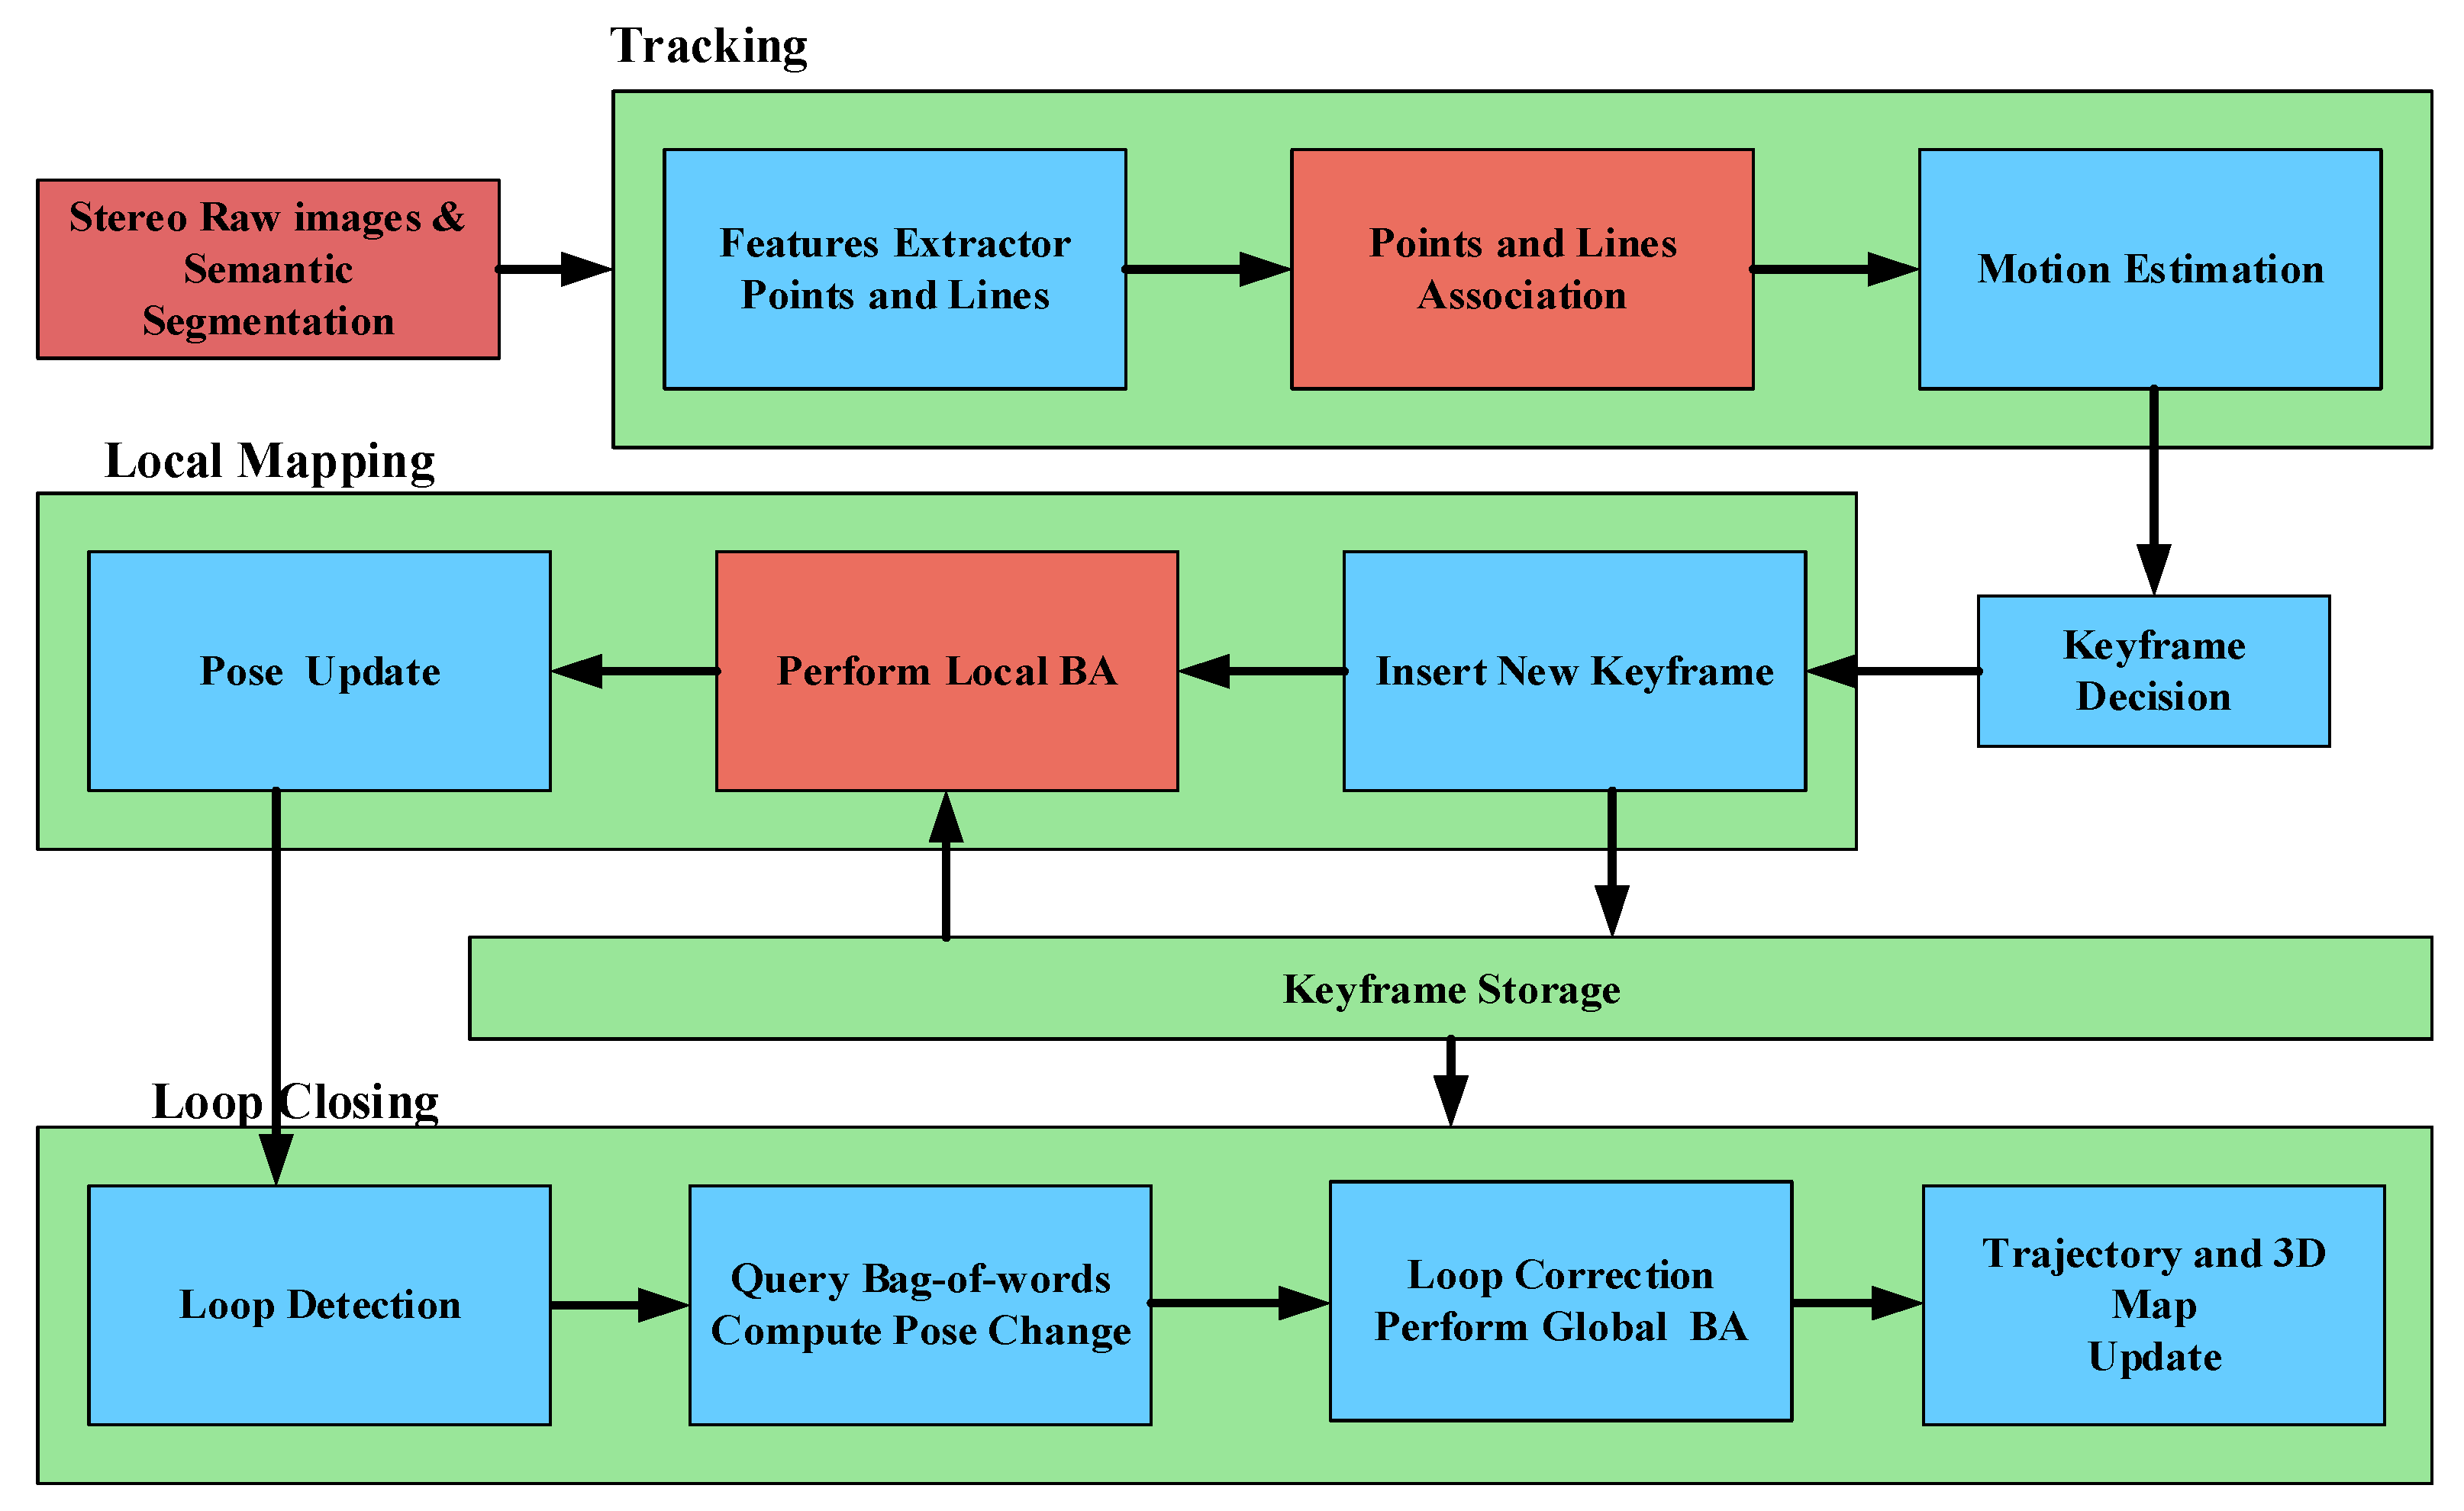
3. System Overview
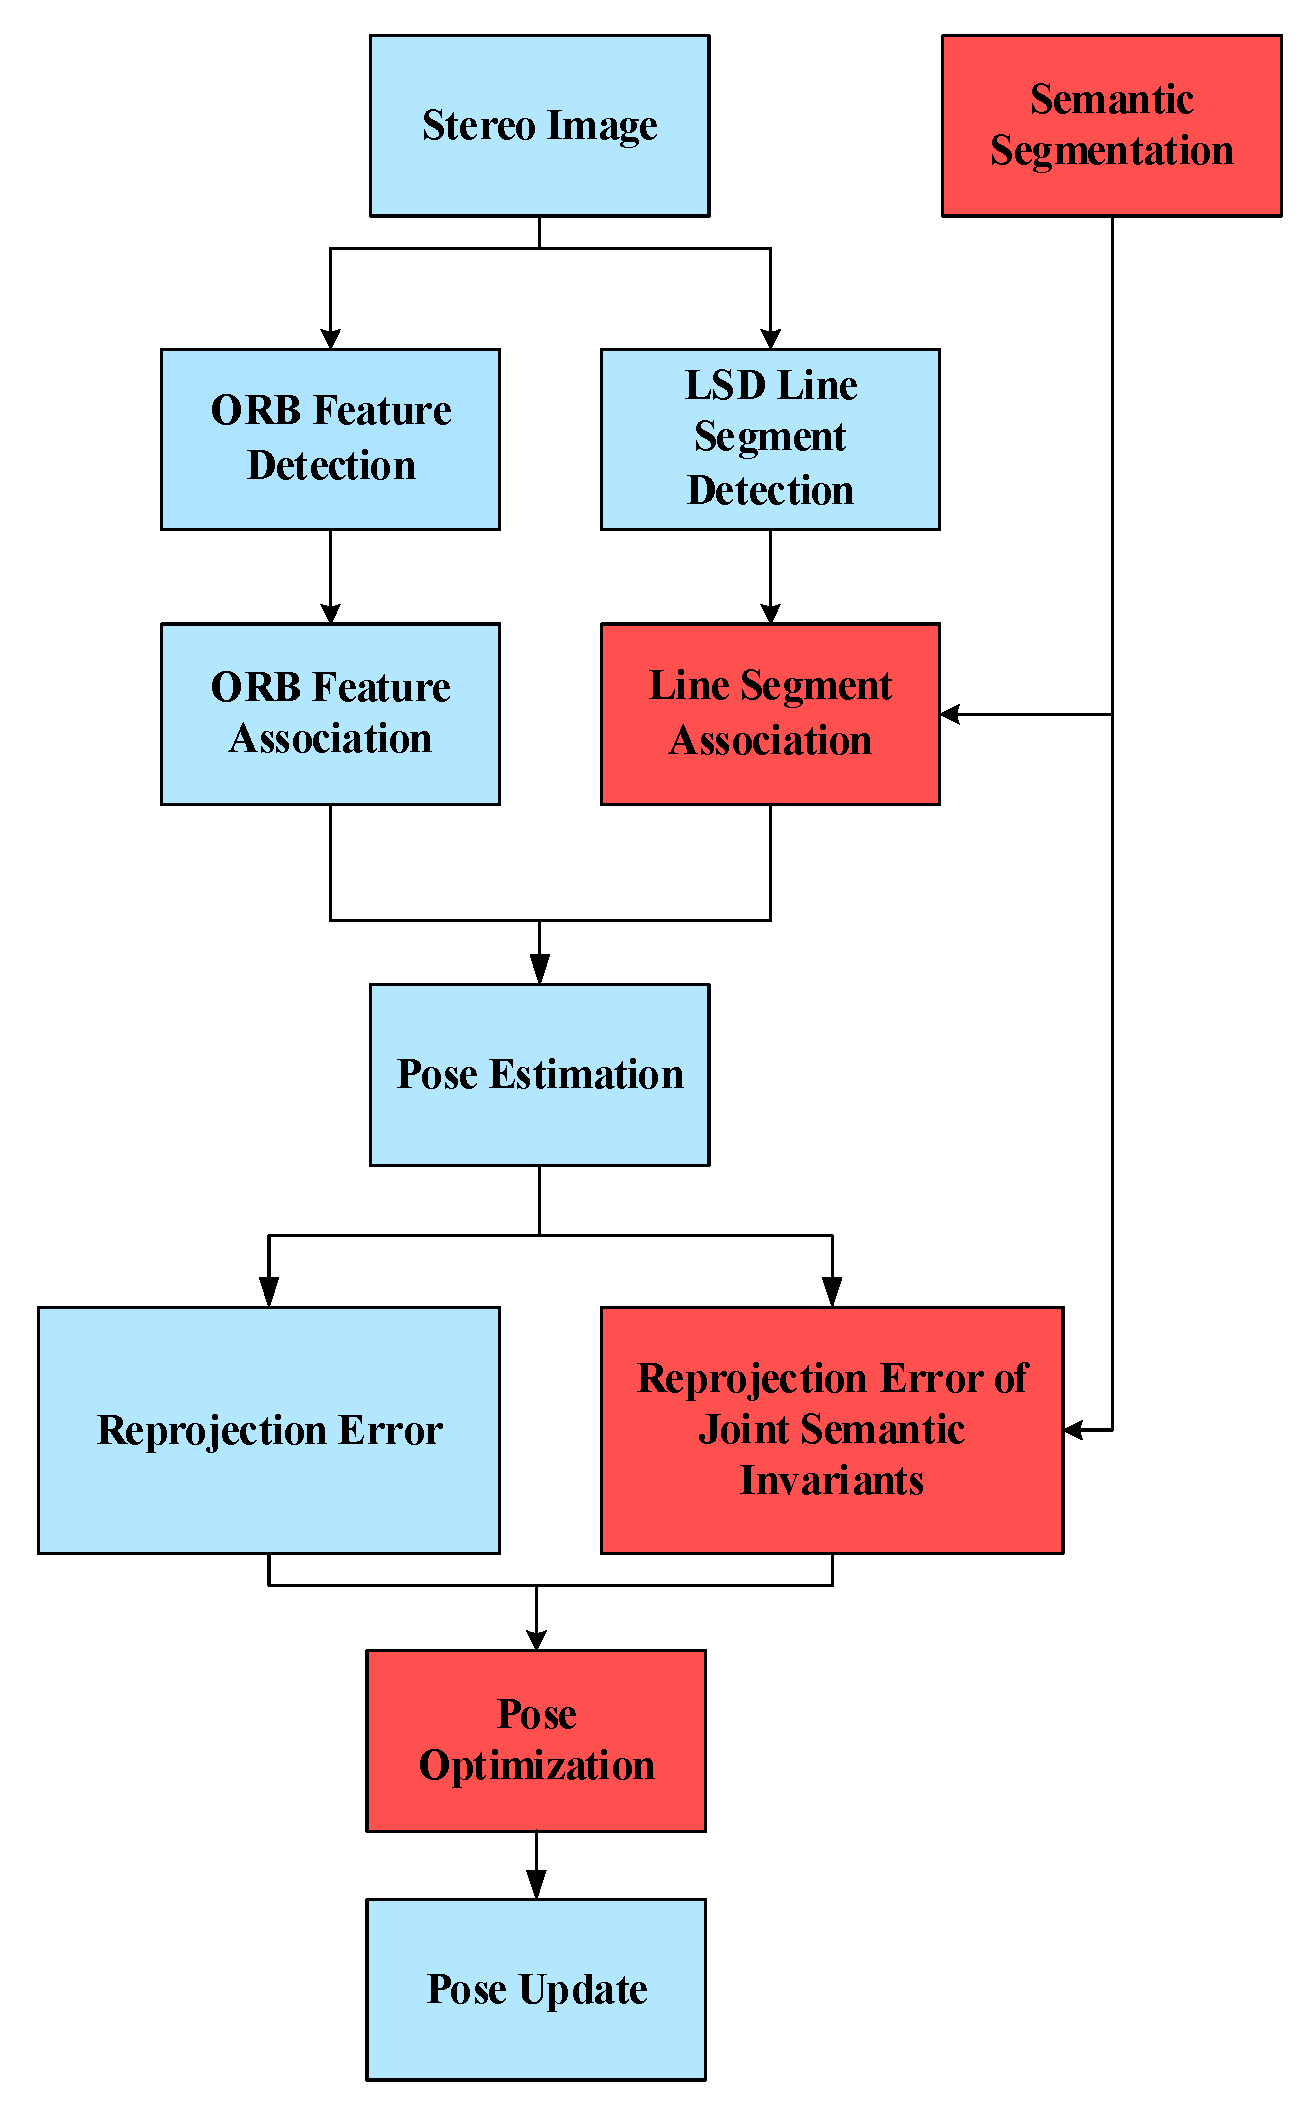
4. Semantic Invariants in Line Segment Association and Pose Optimization
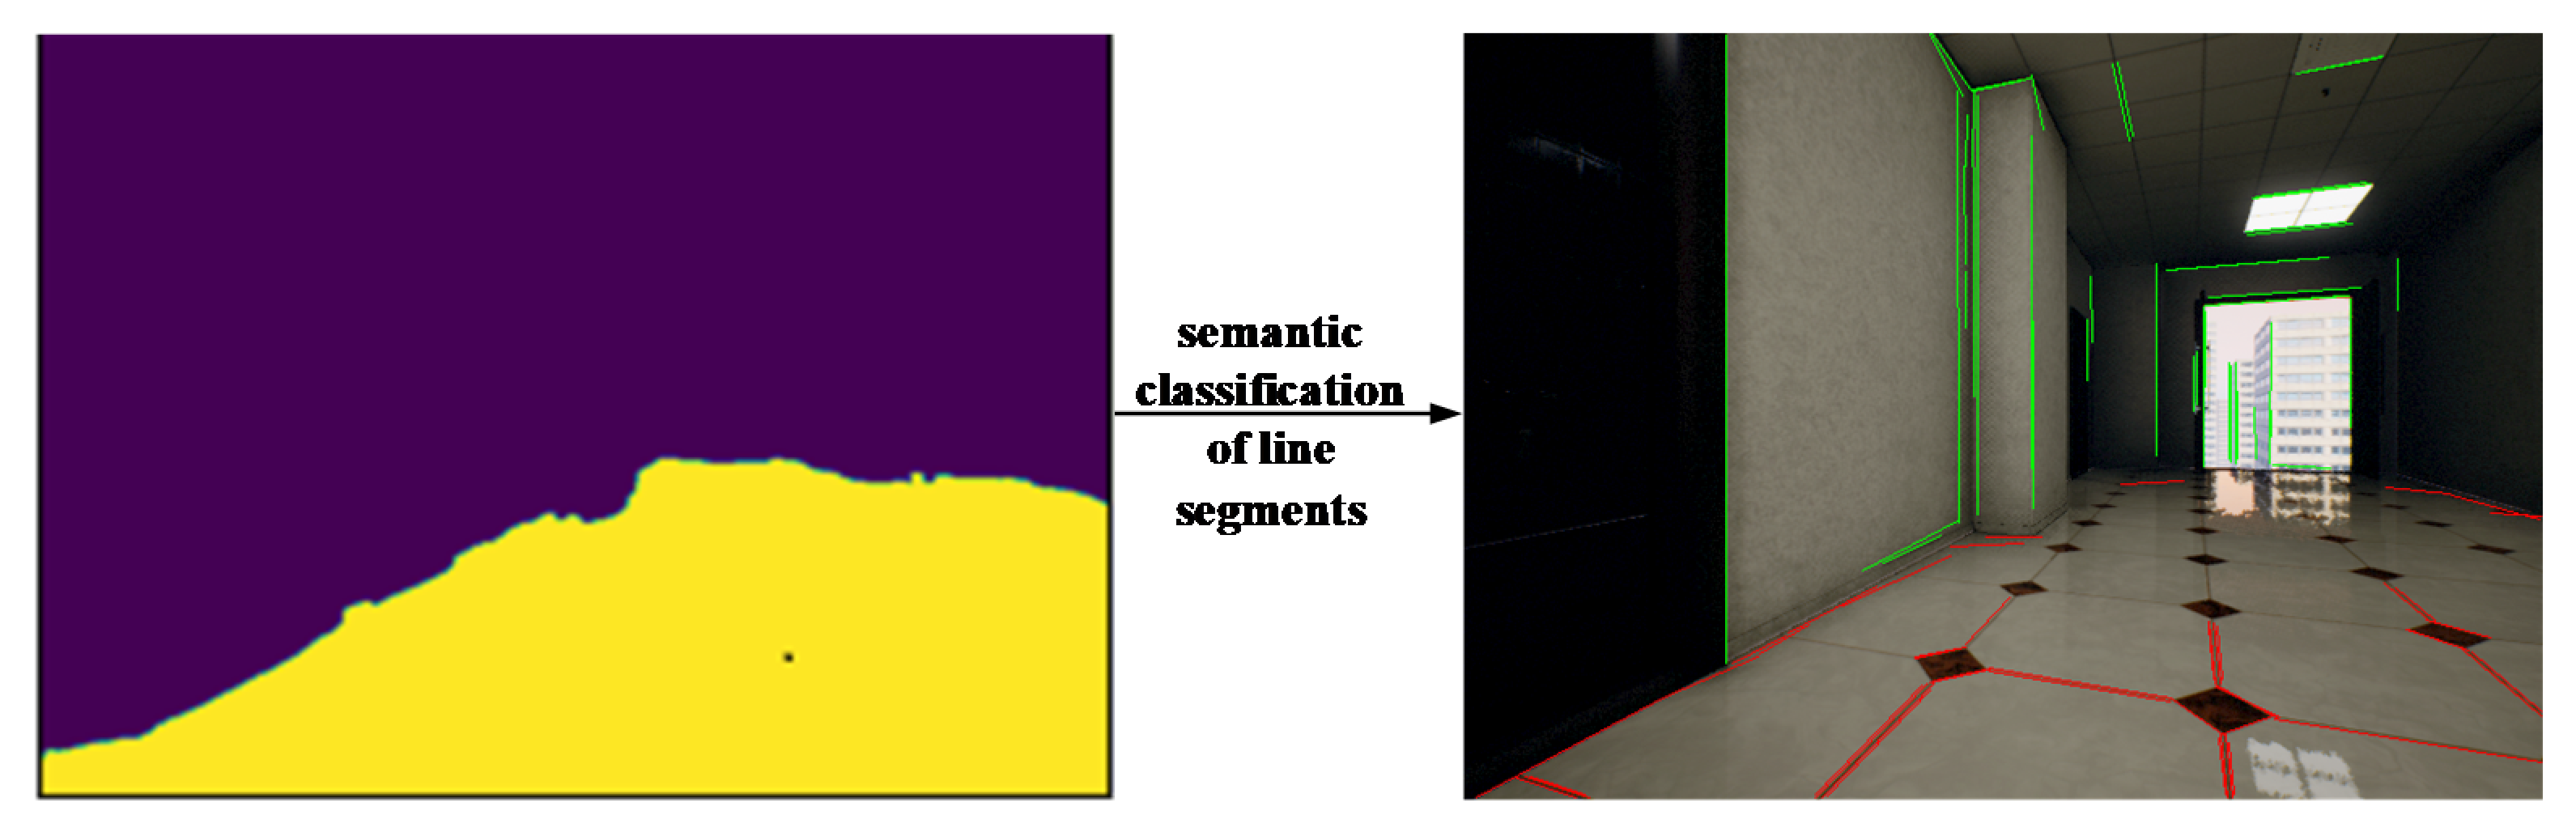
4.1. Pre-Processing and Association of Line Segments
- The length of the detected line segment in the category region is greater than the parameter set as threshold D.
- If the detected line segment lies on the boundary of several semantic categories, it is marked as the category with the highest probability.
4.2. Fusion of Semantic Invariants for Point and Line Reprojection Error Functions
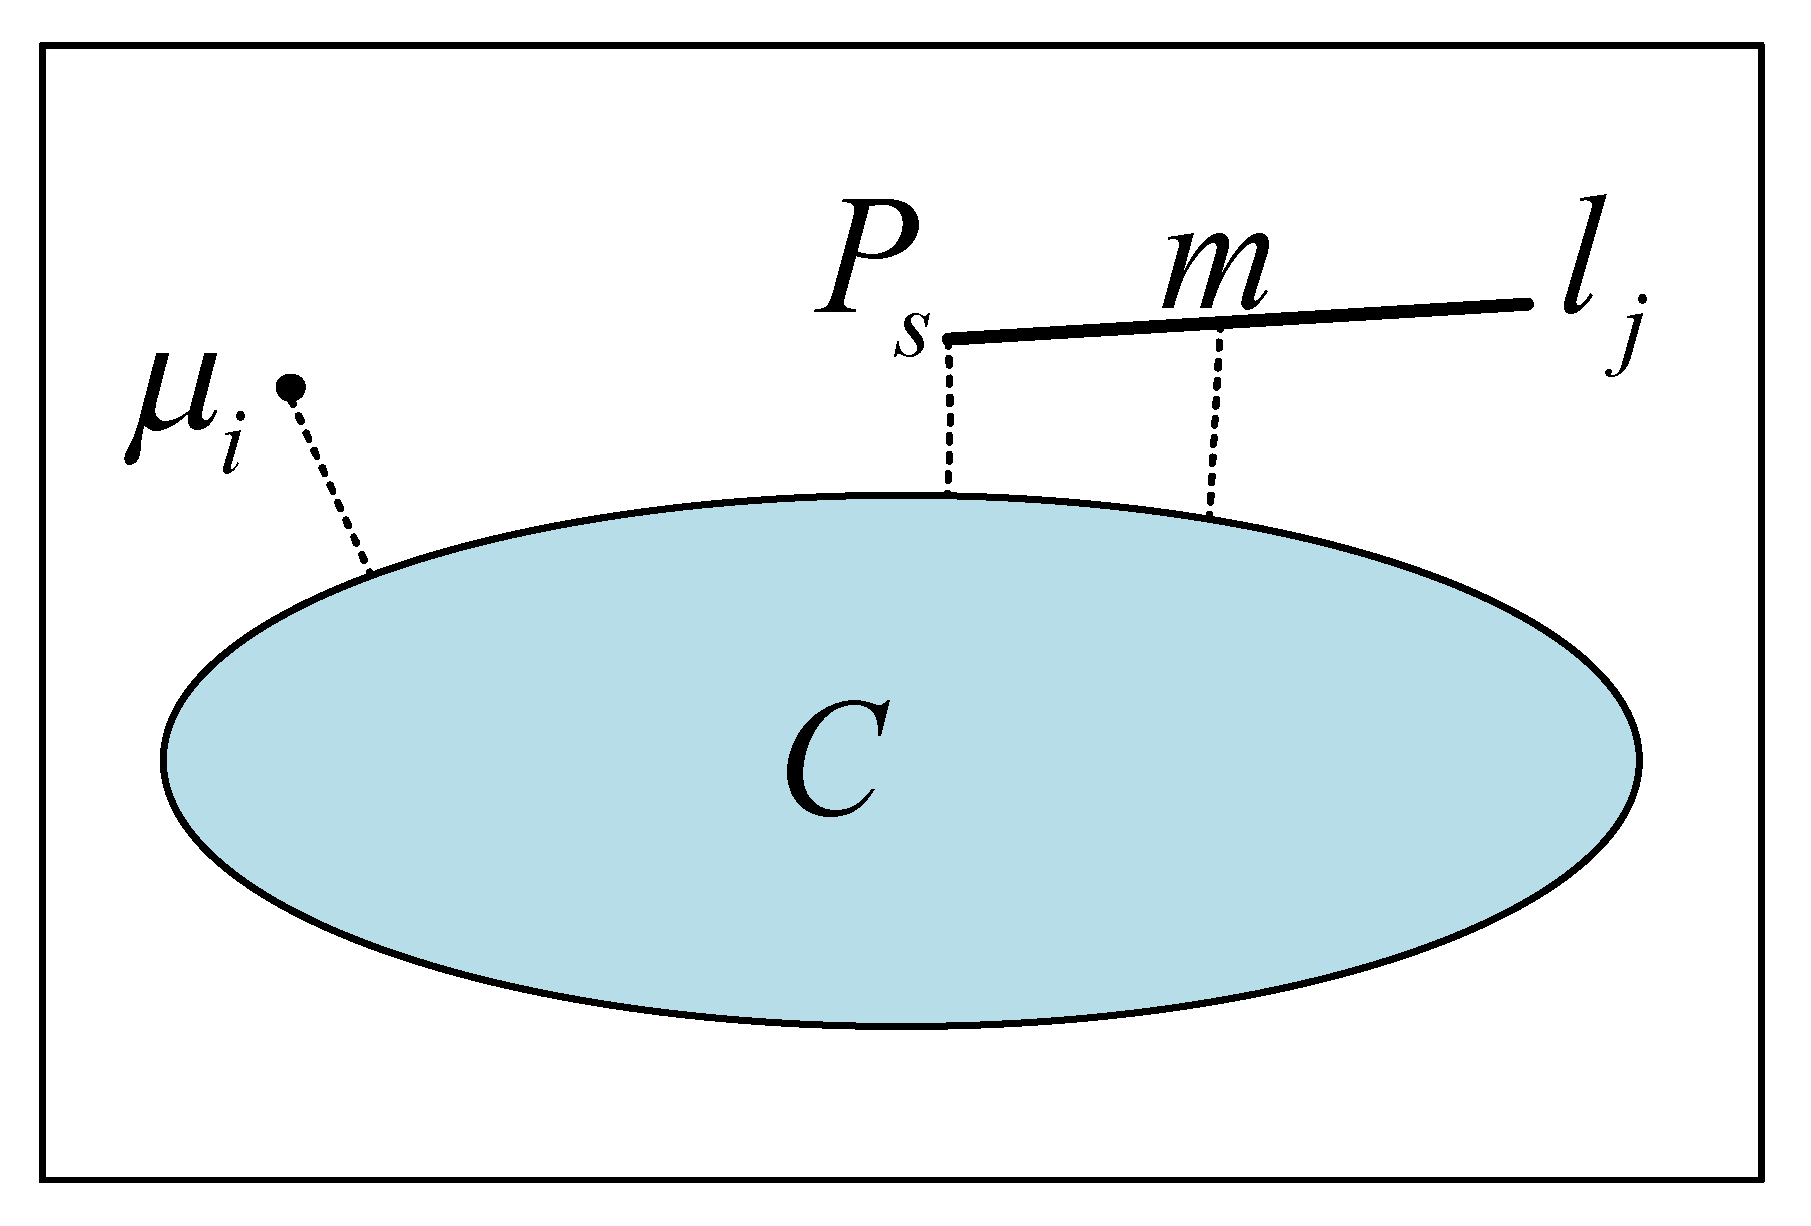
4.2.1. Definition of
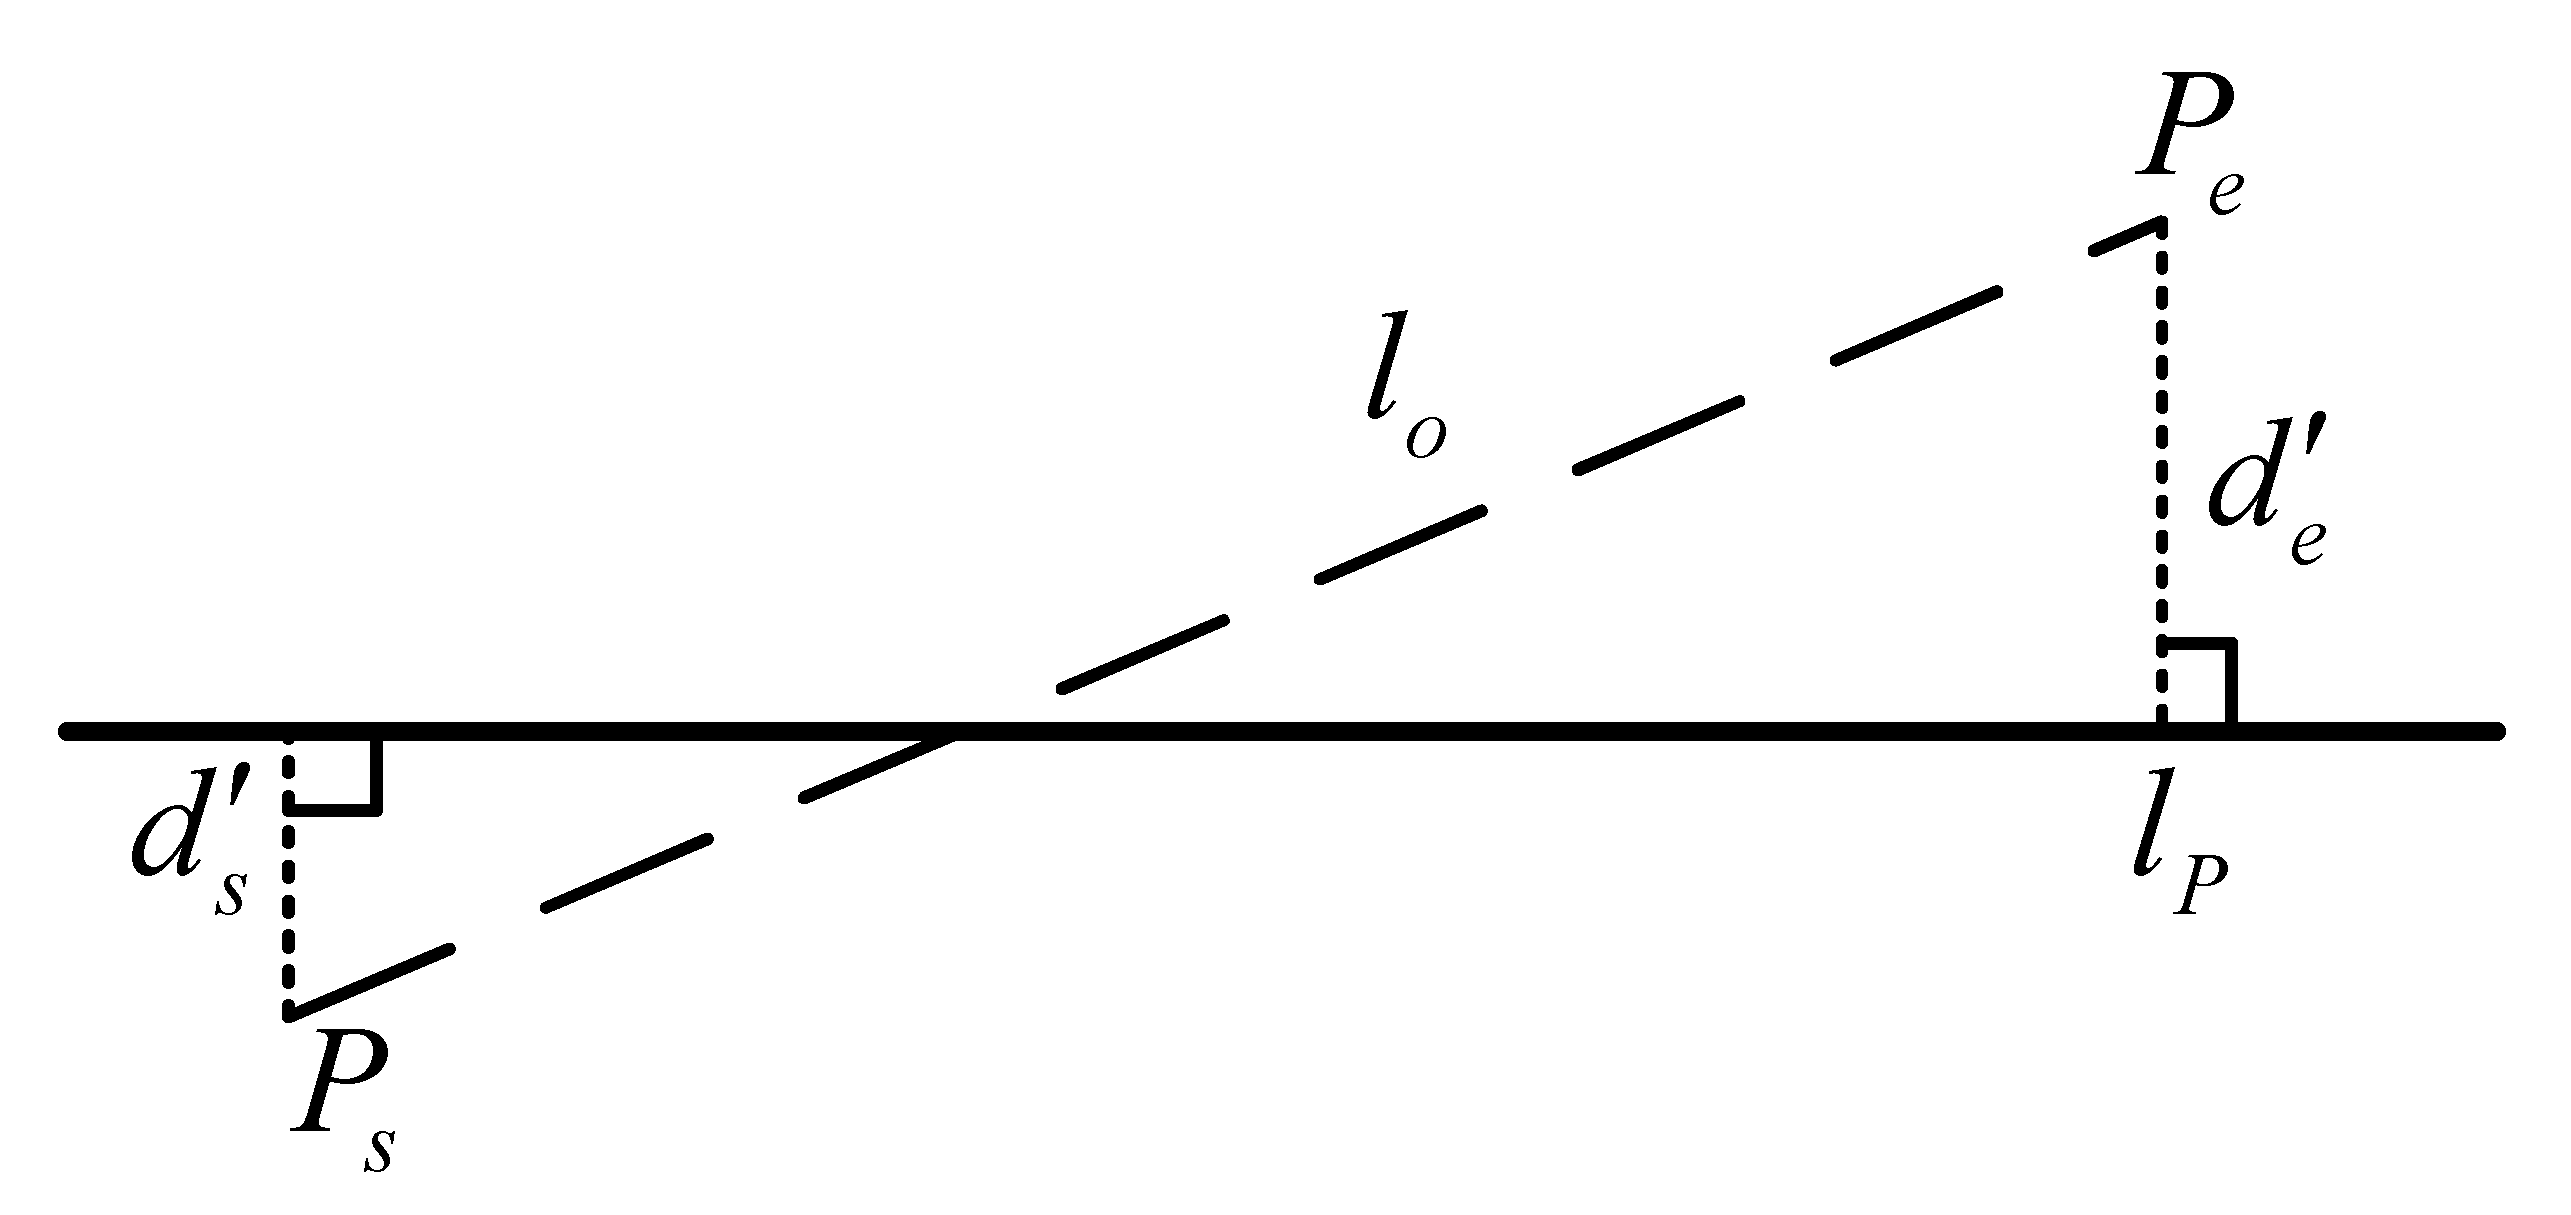
4.2.2. Definition of
5. Results
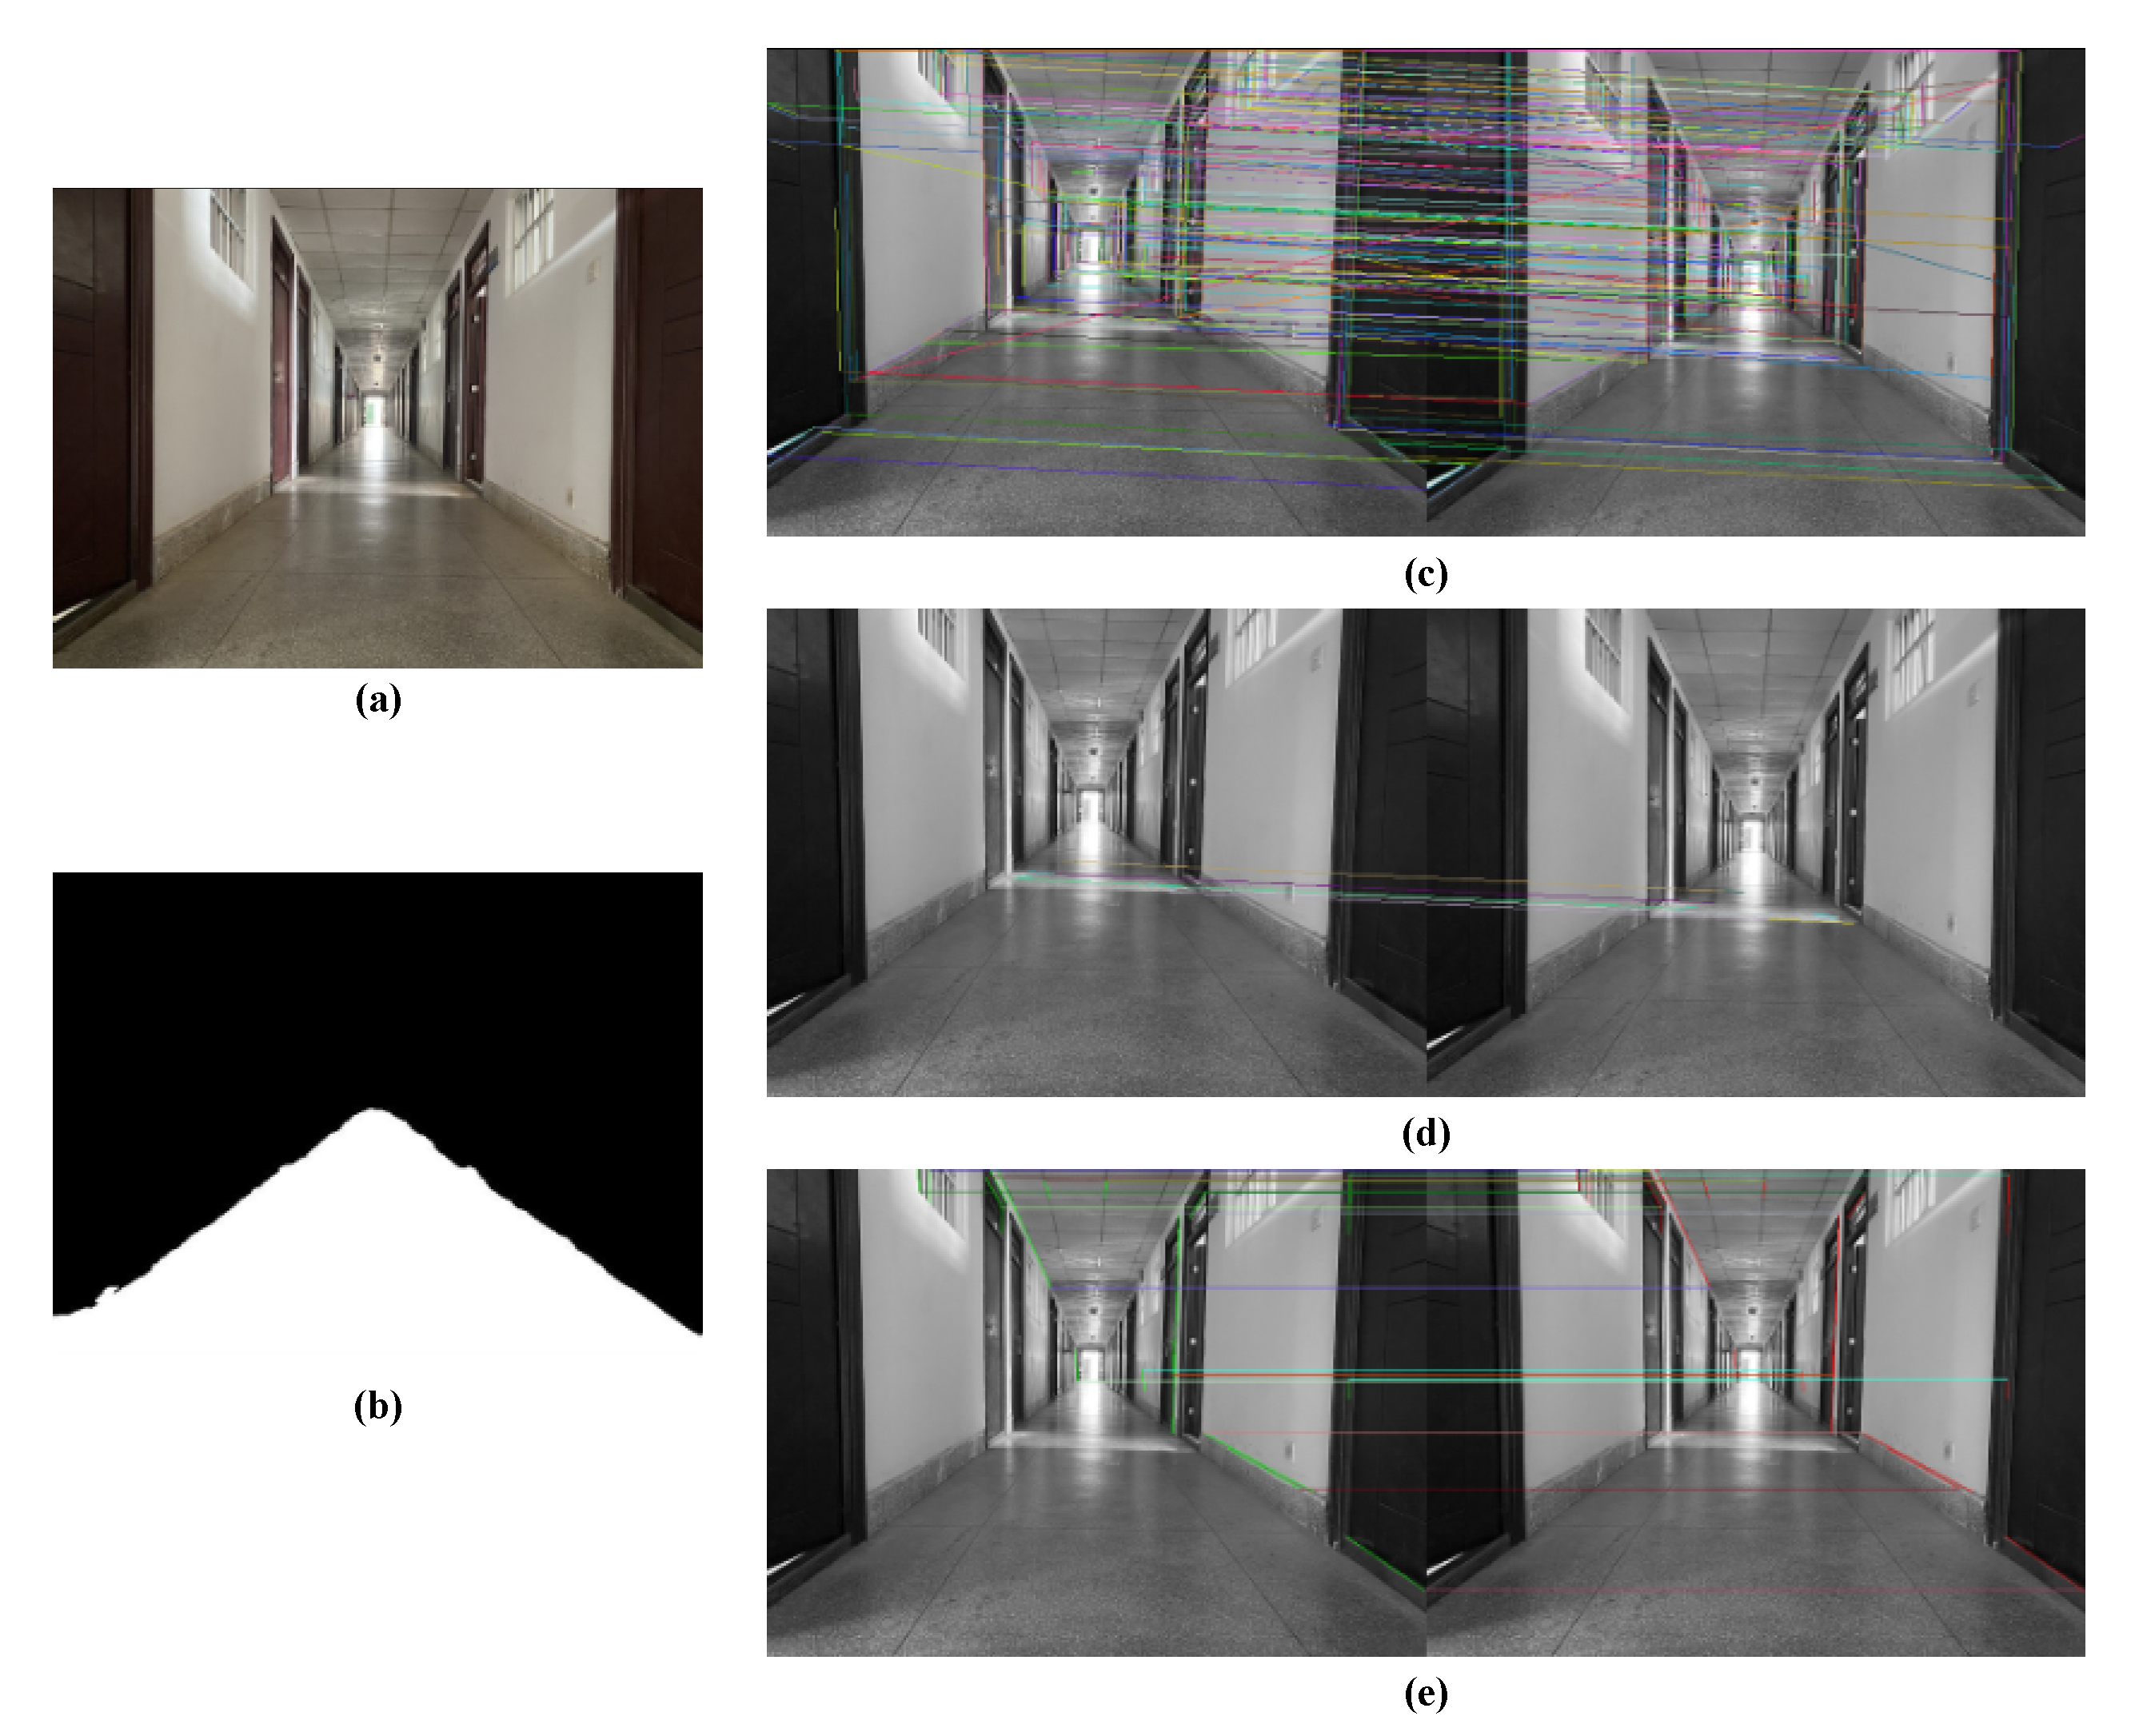
5.1. Fusion of Semantic Invariants for Line Feature Matching
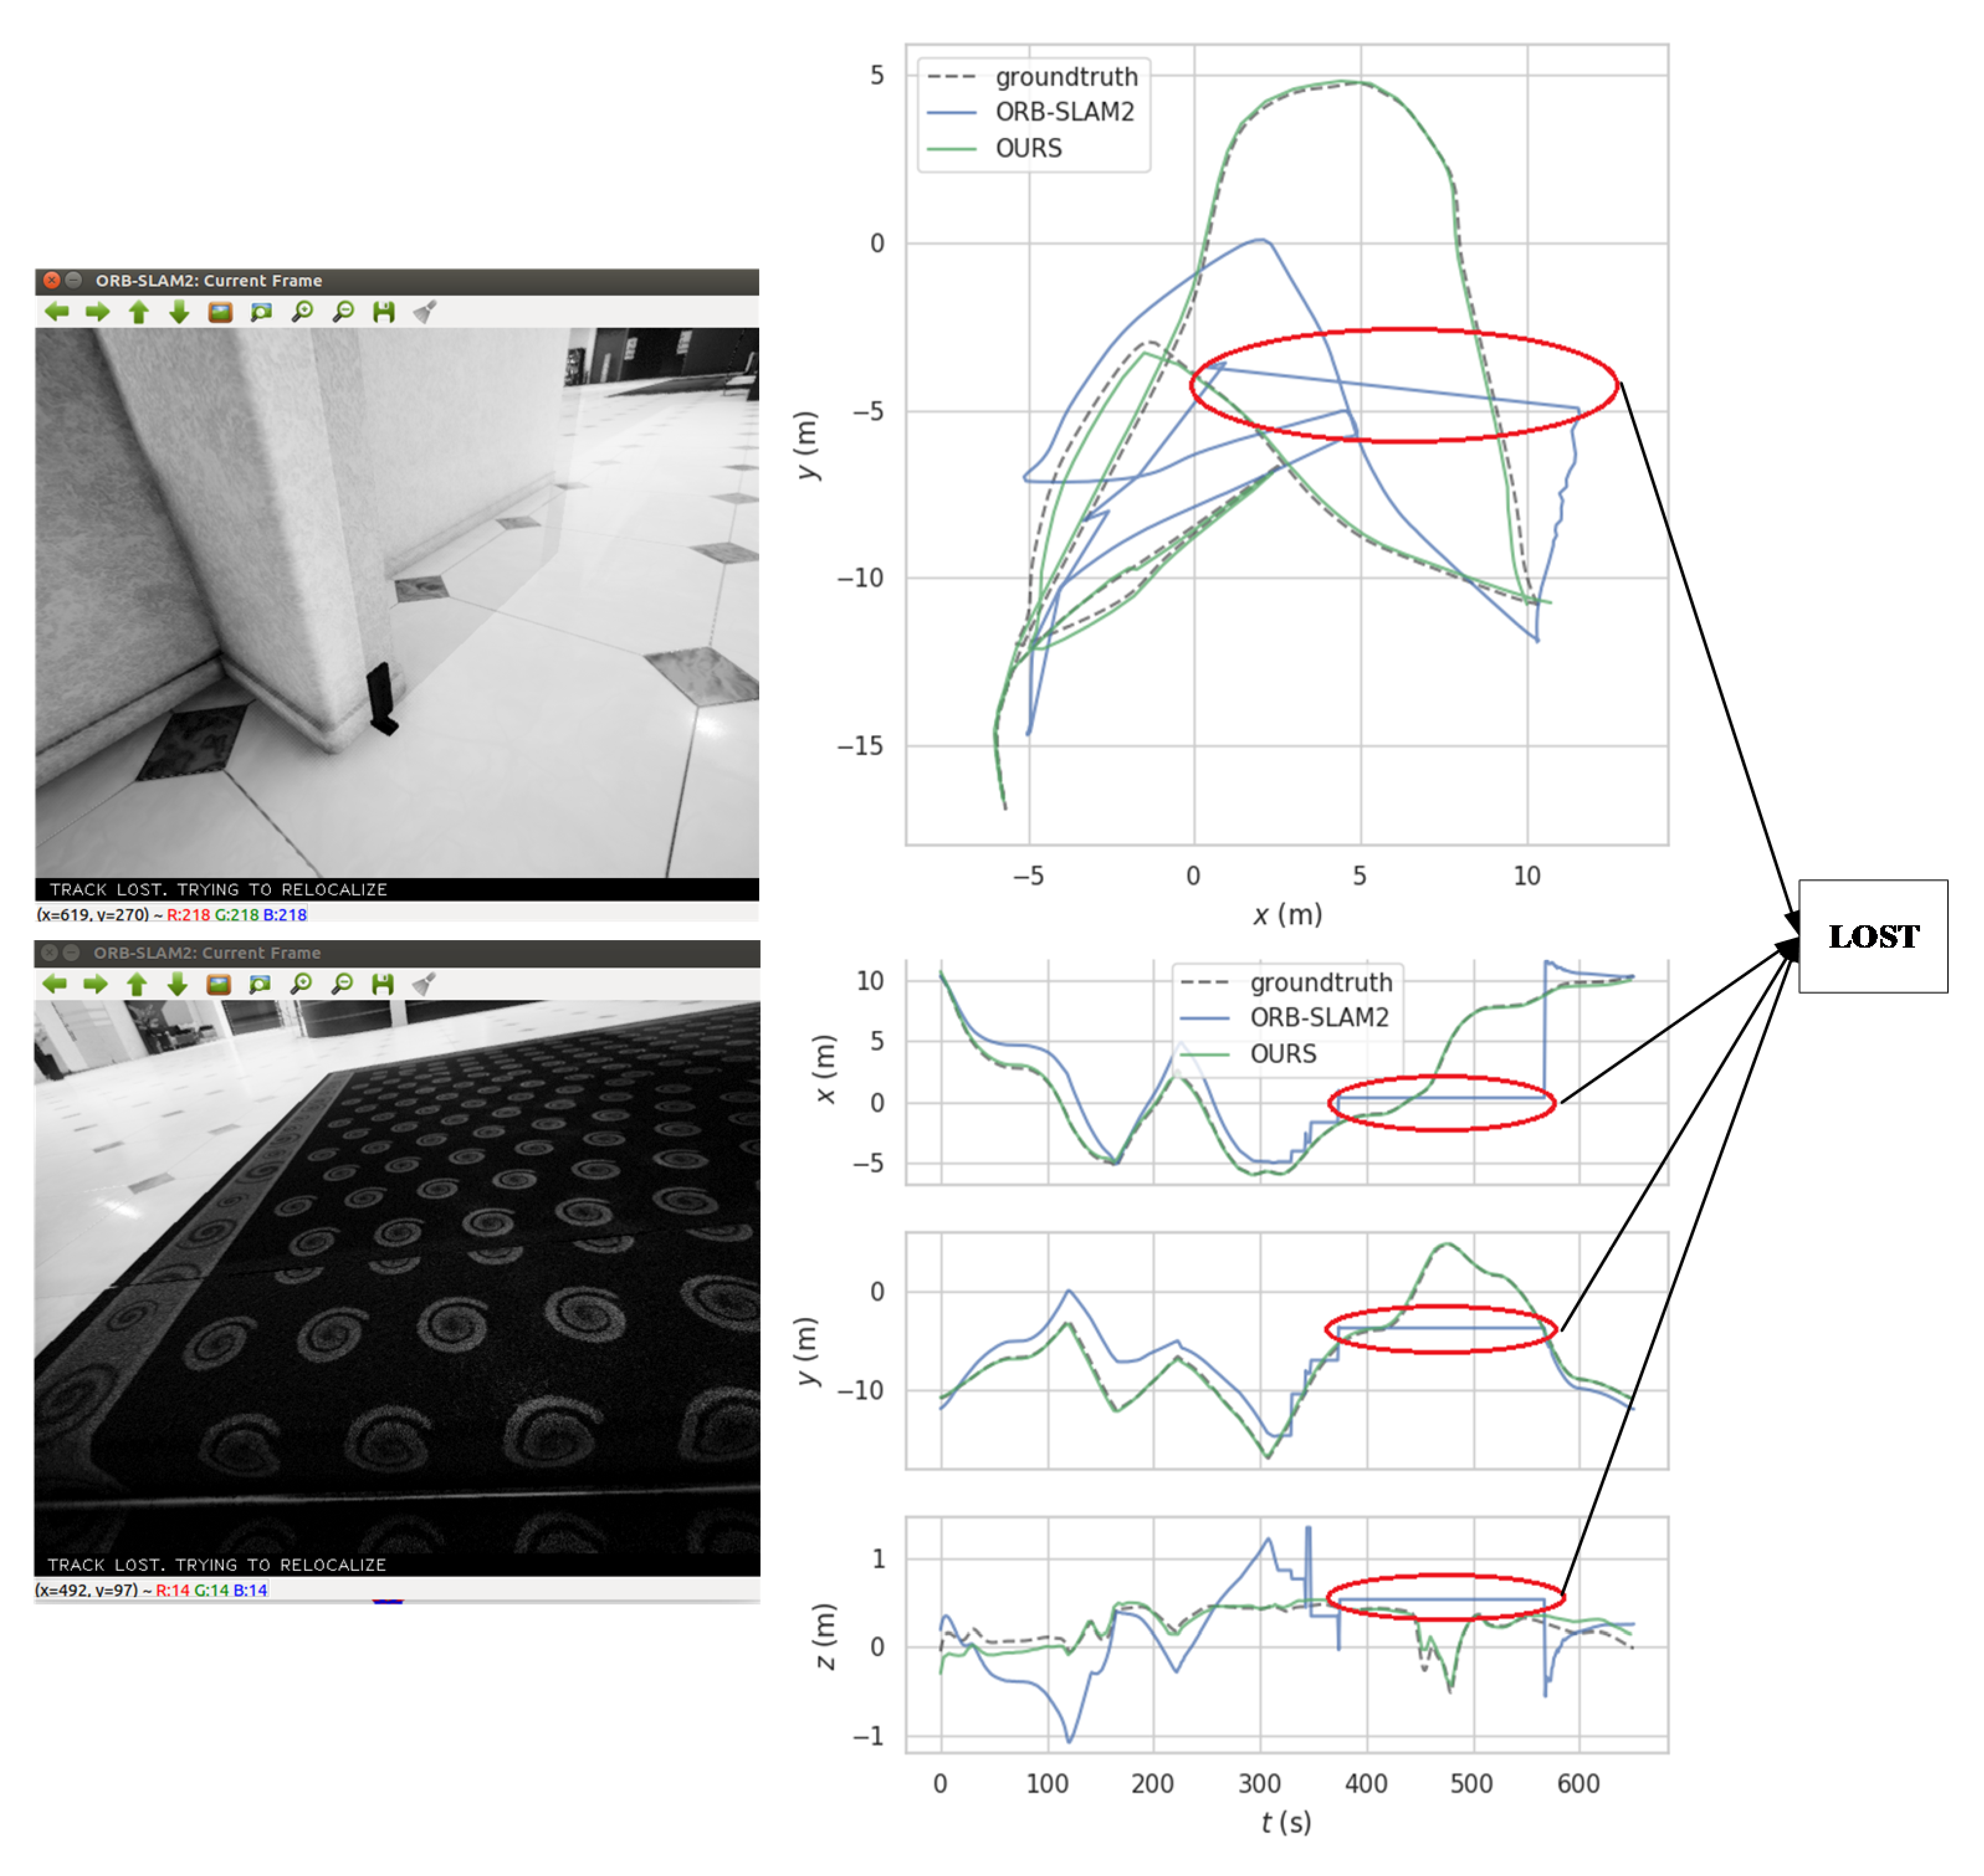
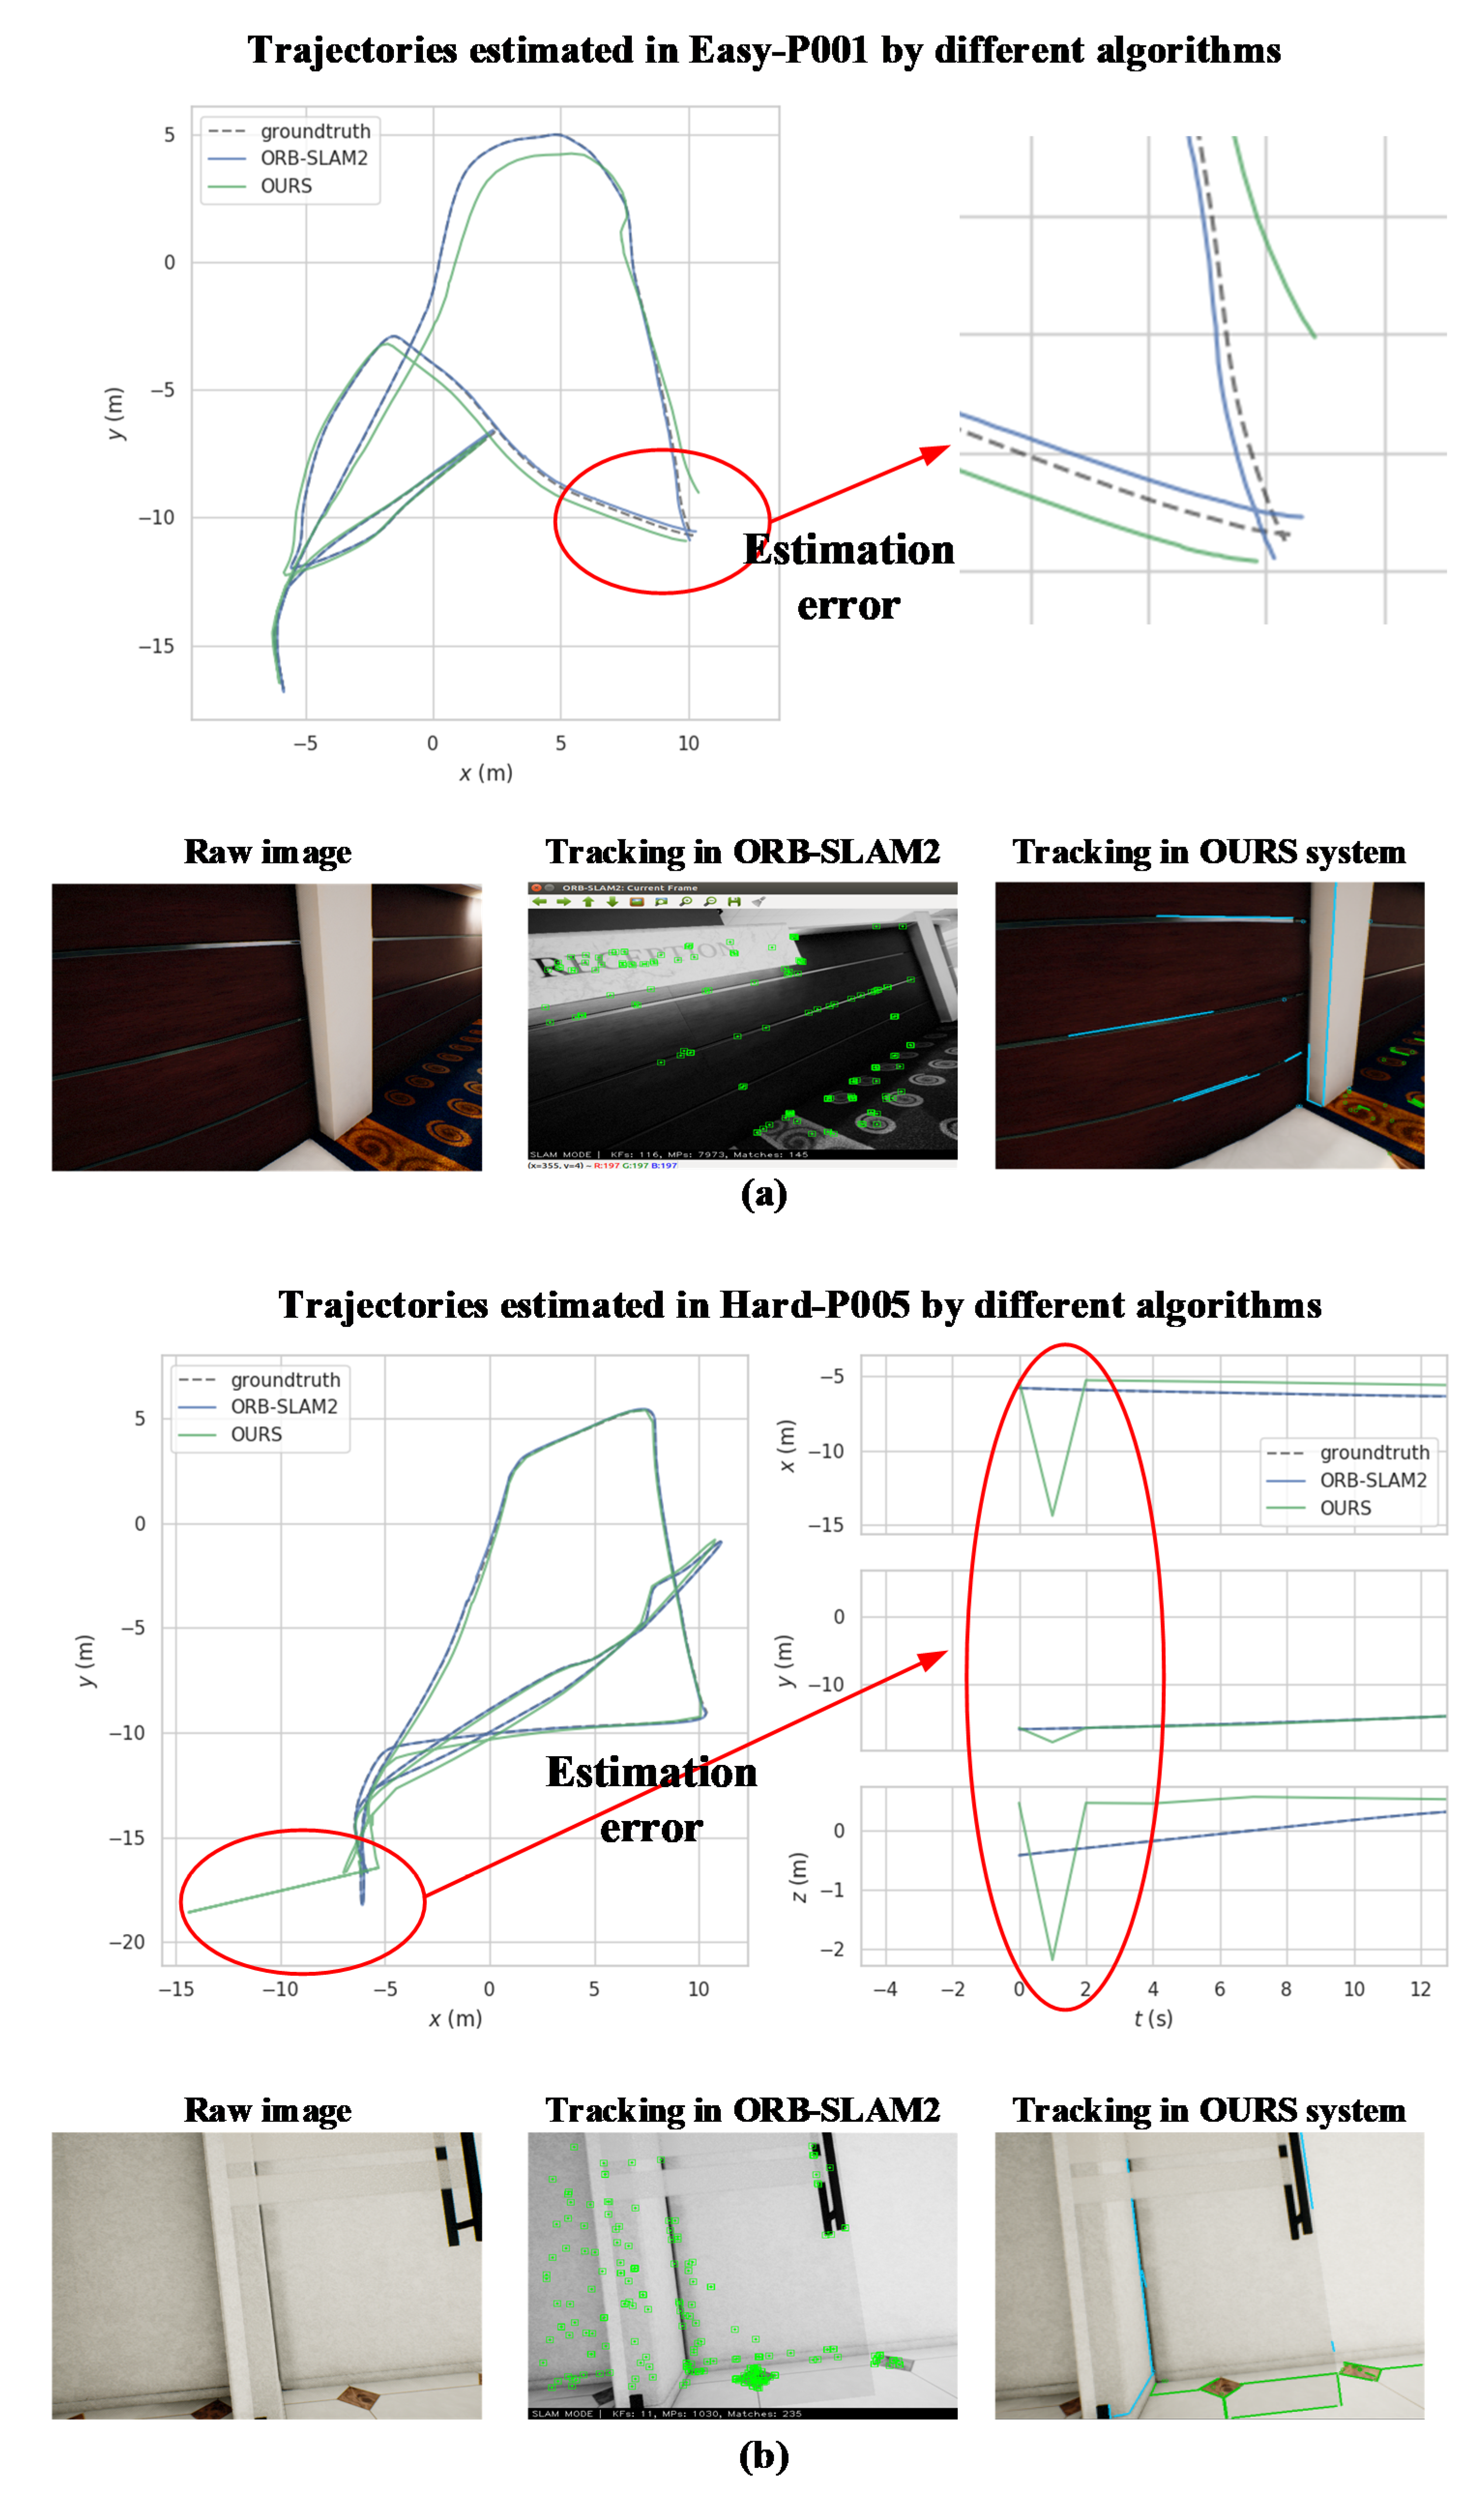
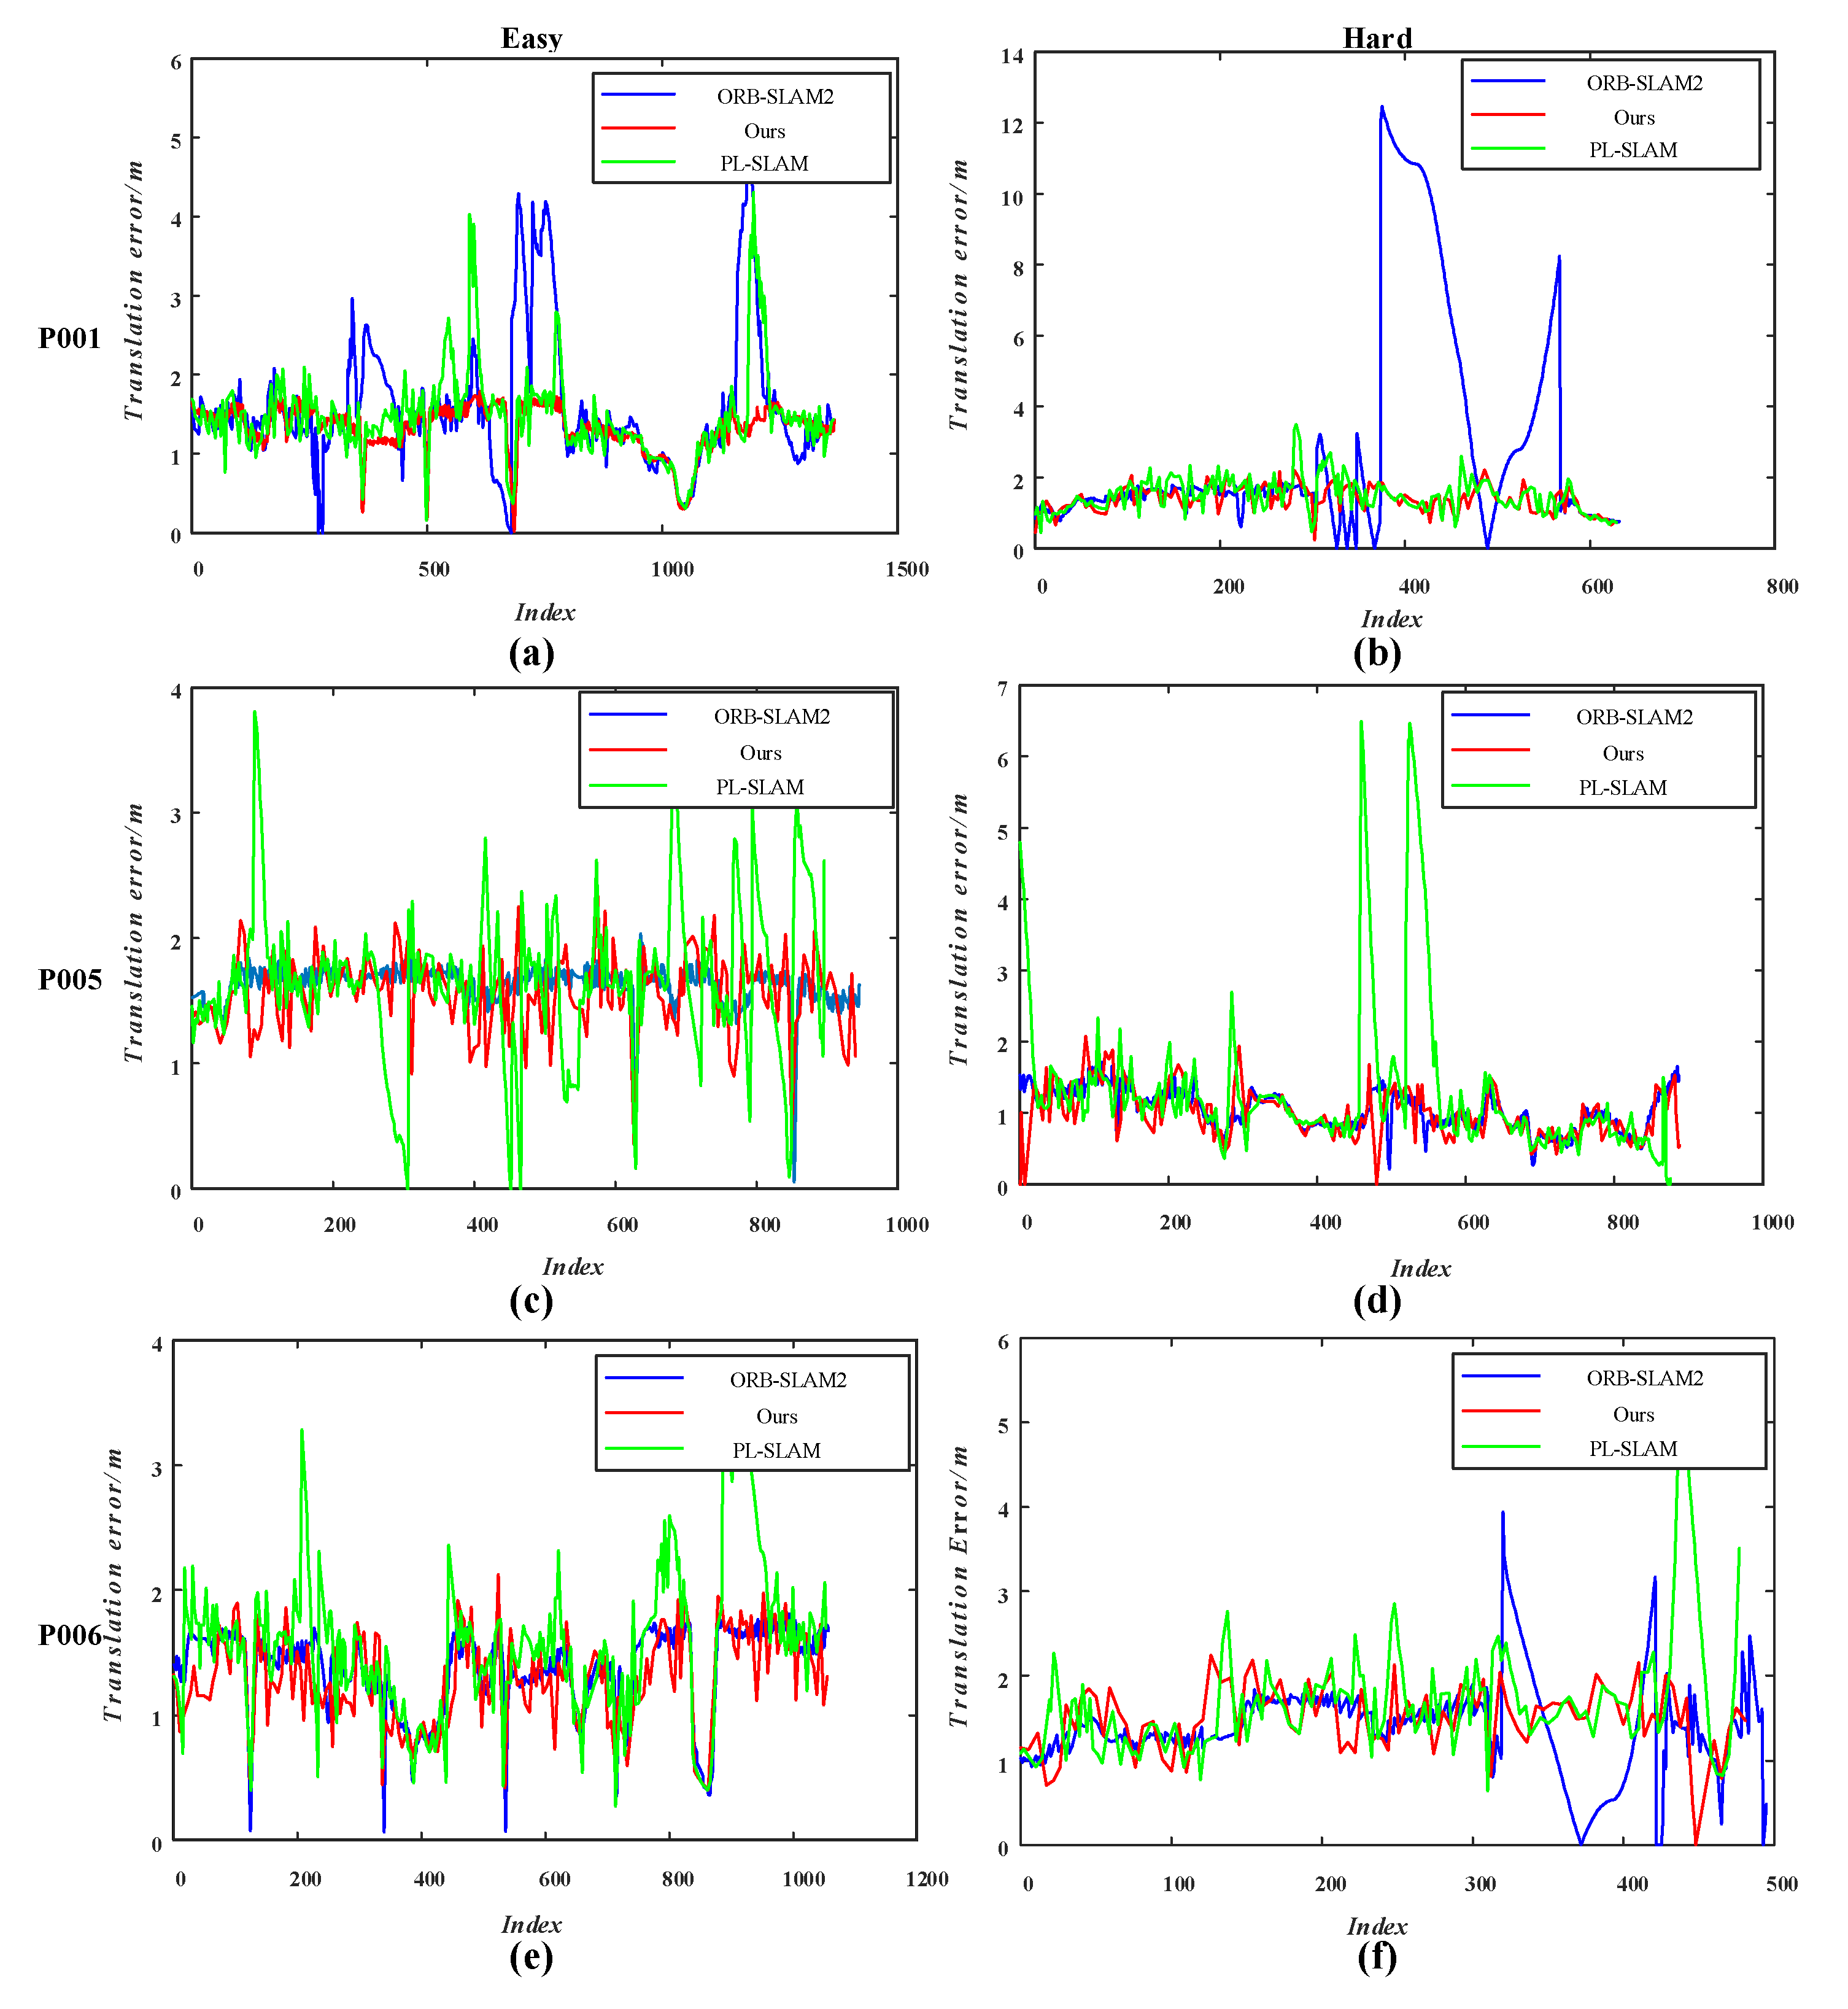
5.2. TartanAir Dataset
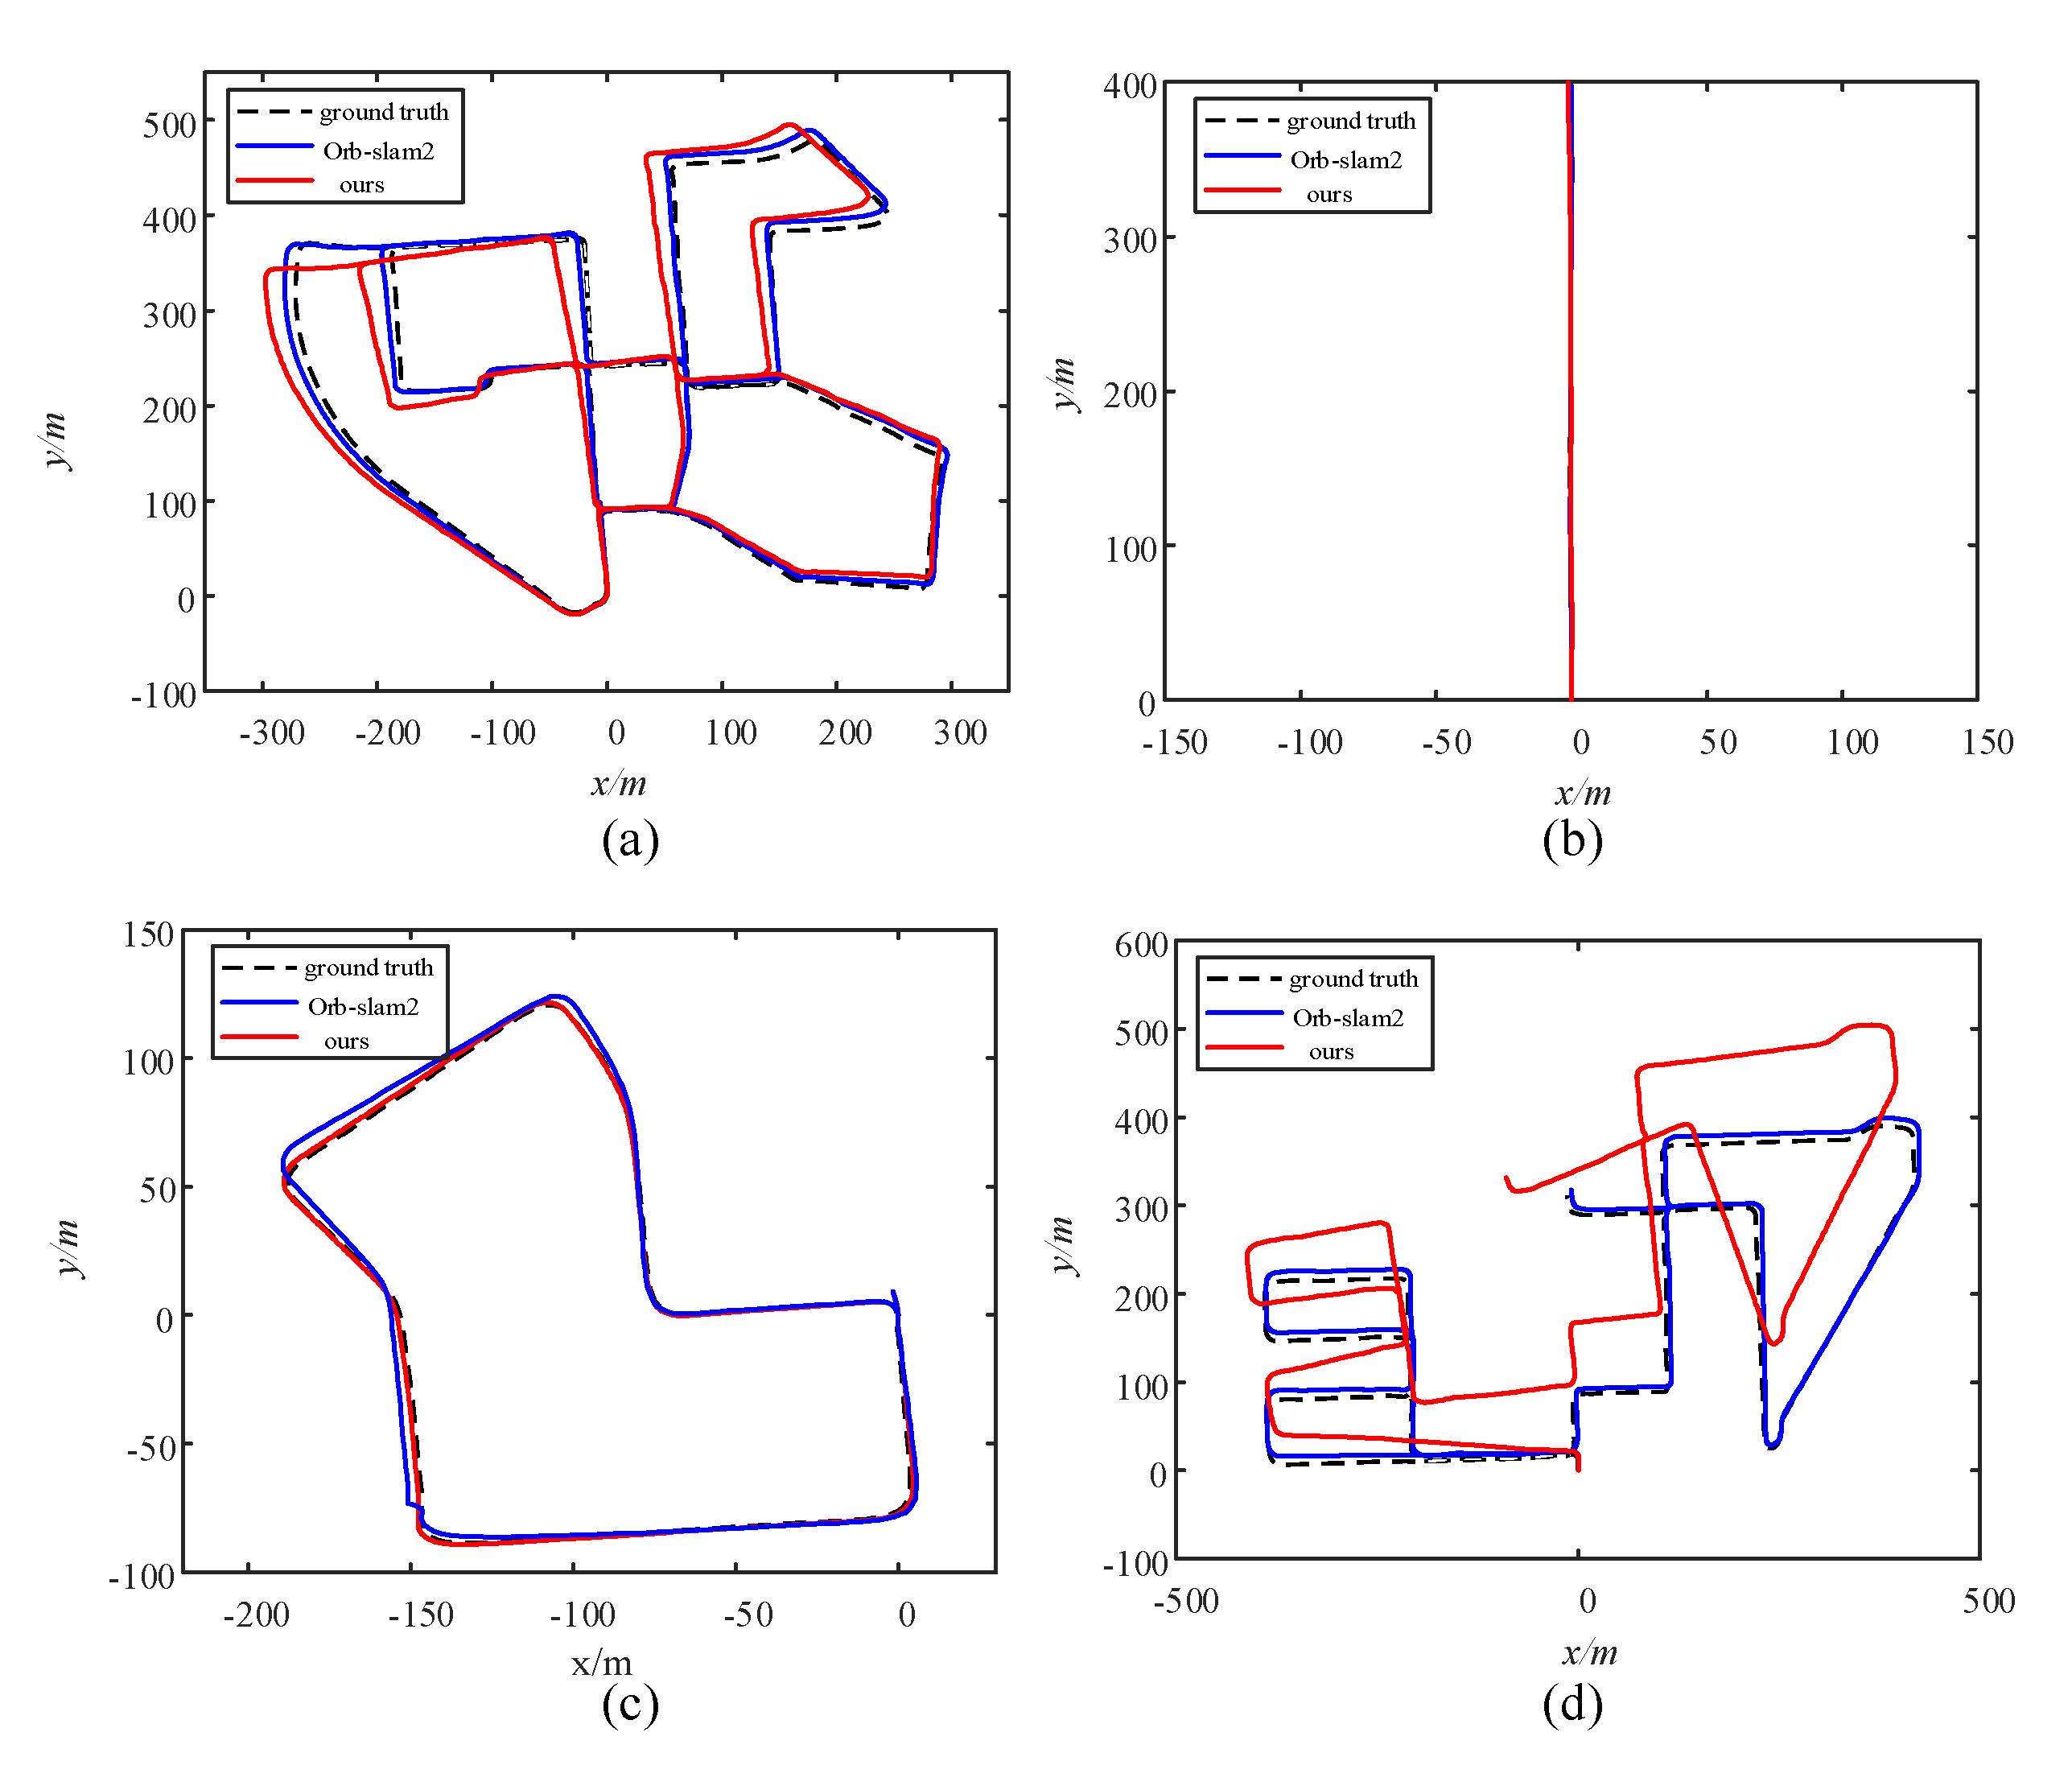
5.3. KITTI Dataset
5.4. Timing Results
6. Conclusions
Author Contributions
Funding
Institutional Review Board Statement
Informed Consent Statement
Conflicts of Interest
References
- Durrant-Whyte, H.; Bailey, T. Simultaneous localization and mapping: Part I. IEEE Robot. Autom. Mag. 2006, 13, 99–110. [Google Scholar] [CrossRef]
- Liu, H.; Zhang, G.; Bao, H. A survey of monocular simultaneous localization and mapping. J. Computer-Aided Des. Comp. Graph. 2016, 28, 855–868. [Google Scholar]
- Fuentes-Pacheco, J.; Ruiz-Ascencio, J.; Manuel Rendon-Mancha, J. Visual simultaneous localization and mapping: A survey. Artif. Intell. Rev. 2012, 43, 55–81. [Google Scholar] [CrossRef]
- Cadena, C.; Carlone, L.; Carrillo, H.; Latif, Y.; Scaramuzza, D.; Neira, J.; Reid, I.; Leonard, J.J. Past, Present, and Future of Simultaneous Localization and Mapping: Toward the Robust-Perception Age. IEEE Trans. Robot. 2016, 32, 1309–1332. [Google Scholar] [CrossRef]
- Engel, J.; Schöps, T.; Cremers, D. LSD-SLAM: Large-scale direct monocular SLAM. In Proceedings of the European Conference on Computer Vision, Zurich, Switzerland, 6–12 September 2014; pp. 834–849. [Google Scholar]
- Engel, J.; Koltun, V.; Cremers, D. Direct sparse odometry. IEEE Trans. Pattern Anal. Mach. Intell. 2017, 40, 611–625. [Google Scholar] [CrossRef] [PubMed]
- Forster, C.; Pizzoli, M.; Scaramuzza, D. SVO: Fast semi-direct monocular visual odometry. In Proceedings of the IEEE International Conference on Robotics and Automation (ICRA), Hong Kong, China, 31 May–7 June 2014; pp. 15–22. [Google Scholar]
- Klein, G.; Murray, D. Parallel tracking and mapping for small AR workspaces. In Proceedings of the 6th IEEE and ACM International Symposium on Mixed and Augmented Reality, Nara, Japan, 13–16 November 2007; pp. 225–234. [Google Scholar]
- Mur-Artal, R.; Tardós, J.D. ORB-SLAM2: An Open-Source SLAM system for Monocular, Stereo, and RGB-D Cameras. IEEE Trans. Robot. 2017, 33, 1255–1262. [Google Scholar] [CrossRef]
- Endres, F.; Hess, J.; Sturm, J.; Cremers, D.; Burgard, W. 3-D Mapping With an RGB-D Camera. IEEE Trans. Robot. 2014, 30, 177–187. [Google Scholar] [CrossRef]
- Kerl, C.; Sturm, J.; Cremers, D. Dense visual SLAM for RGB-D cameras. In Proceedings of the IEEE/RSJ International Conference on Intelligent Robots and Systems, Tokyo, Japan, 3–7 November 2013; pp. 2100–2106. [Google Scholar]
- Chen, X.; Cai, Y.; Tang, Y. A Visual SLAM Algorithm Based on Line Point Invariants. Robot 2020, 42, 485–493. [Google Scholar]
- Smith, P.; Reid, I.; Davison, A. Real-Time Monocular SLAM with Straight Lines. In Proceedings of the British Machine Vision Conference, Edinburgh, UK, 4–7 September 2006; pp. 17–26. [Google Scholar]
- Zhang, G.; Jin, H.; Lim, J.; Suh, I.H. Building a 3-d line-based map using stereo SLAM. IEEE Trans. Robot. 2015, 31, 1364–1377. [Google Scholar] [CrossRef]
- Zhou, H.; Zou, D.; Pei, L.; Ying, R.; Liu, P. StructSLAM: Visual SLAM with building structure lines. IEEE Trans. Veh. Technol. 2015, 64, 1364–1375. [Google Scholar] [CrossRef]
- Vakhitov, A.; Funke, J.; Moreno-Noguer, F. Accurate and Linear Time Pose Estimation from Points and Lines. In European Conference on Computer Vision, Amsterdam, The Netherlands, 8–16 October 2016; Springer: Cham, Switzerland.
- Gomez-Ojeda, R.; Moreno, F.A.; Scaramuzza, D.; Gonzalez-Jimenez, J. PL-SLAM: A Stereo SLAM System through the Combination of Points and Line Segments. arXiv 2017, arXiv:1705.09479. [Google Scholar] [CrossRef]
- Zuo, X.; Xie, X.; Liu, Y.; Huang, G. Robust visual SLAM with point and line features. In Proceedings of the IEEE/RSJ International Conference on Intelligent Robots and Systems (IROS), Vancouver, BC, Canada, 24–28 September 2017; pp. 1775–1782. [Google Scholar]
- Pumarola, A.; Vakhitov, A.; Agudo, A.; Sanfeliu, A.; Moreno-Noguer, F. PL-SLAM: Real-time monocular visual SLAM with points and lines. In Proceedings of the IEEE International Conference on Robotics and Automation (ICRA), Singapore, 29 May–3 June 2017; pp. 4503–4508. [Google Scholar]
- Wang, R.; Di, K.; Wan, W.; Wang, Y. Improved Point-Line Feature Based Visual SLAM Method for Indoor Scenes. Sensors 2018, 18, 3559. [Google Scholar] [CrossRef]
- Zhang, N.; Zhao, Y. Fast and Robust Monocular Visua-Inertial Odometry Using Points and Lines. Sensors 2019, 19, 4545. [Google Scholar] [CrossRef] [PubMed]
- Zou, Y.; Eldemiry, A.; Li, Y.; Chen, W. Robust RGB-D SLAM Using Point and Line Features for Low Textured Scene. Sensors 2020, 20, 4984. [Google Scholar] [CrossRef] [PubMed]
- Garcia-Garcia, A.; Orts-Escolano, S.; Oprea, S.; Villena-Martinez, V.; Garcia-Rodriguez, J. A Review on Deep Learning Techniques Applied to Semantic Segmentation. arXiv 2017, arXiv:1704.06857. [Google Scholar]
- Xia, L.L.; Cui, J.S.; Shen, R.; Xu, X.; Gao, Y.P.; Li, X.Y. A Survey of Image Semantics-based Visual Simultaneous Localization and Mapping: Application-oriented Solutions to Autonomous Navigation of Mobile Robots. Int. J. Adv. Robot. Syst. 2020, 17, 4158. [Google Scholar] [CrossRef]
- Bowman, S.L.; Atanasov, N.; Daniilidis, K.; Pappas, G.J. Probabilistic data association for semantic SLAM. In Proceedings of the IEEE International Conference on Robotics and Automation (ICRA), Singapore, 29 May–3 June 2017; pp. 1722–1729. [Google Scholar]
- Konstantinos-Nektarios, L.; Schönberger, J.; Marc, P.; Torsten, S. VSO: Visual Semantic Odometry. In Proceedings of the 15th European Conference, Munich, Germany, 8–14 September 2018; pp. 246–263. [Google Scholar]
- Hirose, K.; Saito, H. Fast line description for line-based SLAM. In Proceedings of the British Machine Vision Conference, Guildford, UK, 3–7 September 2012. [Google Scholar]
- Rublee, E.; Rabaud, V.; Konolige, K.; Bradski, G. ORB: An efficient alternative to SIFT or SURF. In Proceedings of the International Conference on Computer Vision, Barcelona, Spain, 6–13 November 2011; pp. 2564–2571. [Google Scholar]
- Bay, H.; Ess, A.; Tuytelaars, T.; Gool, L.V. Speeded-Up Robust Features (SURF). Comput. Vis. Image Underst. 2008, 110, 346–359. [Google Scholar] [CrossRef]
- Lindeberg, T. Scale invariant feature transform. Scholarpedia 2012, 7, 2012–2021. [Google Scholar] [CrossRef]
- Von Gioi, R.G.; Jakubowicz, J.; Morel, J.-M.; Randall, G. LSD: A line segment detector. Image Process. Line 2012, 2, 35–55. [Google Scholar] [CrossRef]
- Zhang, L.; Koch, R. An efficient and robust line segment matching approach based on LBD descriptor and pairwise geometric consistency. J. Vis. Commun. Image Represent. 2013, 24, 794–805. [Google Scholar] [CrossRef]
- Suleymanov, T.; Gadd, M.; Kunze, L.; Newman, P. LiDAR Lateral Localisation Despite Challenging Occlusion from Traffic. In Proceedings of the IEEE/ION Position, Location and Navigation Symposium (PLANS), Portland, OR, USA, 20–23 April 2020; pp. 334–341. [Google Scholar]
- Gálvez-López, D.; Tardos, J.D. Bags of binary words for fast place recognition in image sequences. IEEE Trans. Robot. 2012, 28, 1188–1197. [Google Scholar] [CrossRef]
- Hartley, R.; Zisserman, A. Multiple View Geometry in Computer Vision, 2nd ed.; Cambridge University Press: Cambridge, UK, 2004; ISBN 0521540518. [Google Scholar]
- Wang, W.; Zhu, D.; Wang, X.; Hu, Y.; Qiu, Y.; Wang, C.; Hu, F.; Ashish, K.; Scherer, S. TartanAir: A Dataset to Push the Limits of Visual SLAM. arXiv 2020, arXiv:2003.14338. [Google Scholar]
- Geiger, A.; Lenz, P.; Stiller, C.; Urtasun, R. Vision meets robotics: The KITTI dataset. Int. J. Robot. Res. 2013, 32, 1231–1237. [Google Scholar] [CrossRef]
- Facebook AI Research. Detectron2. Available online: https://github.com/facebookresearch/detectron2 (accessed on 23 December 2020).
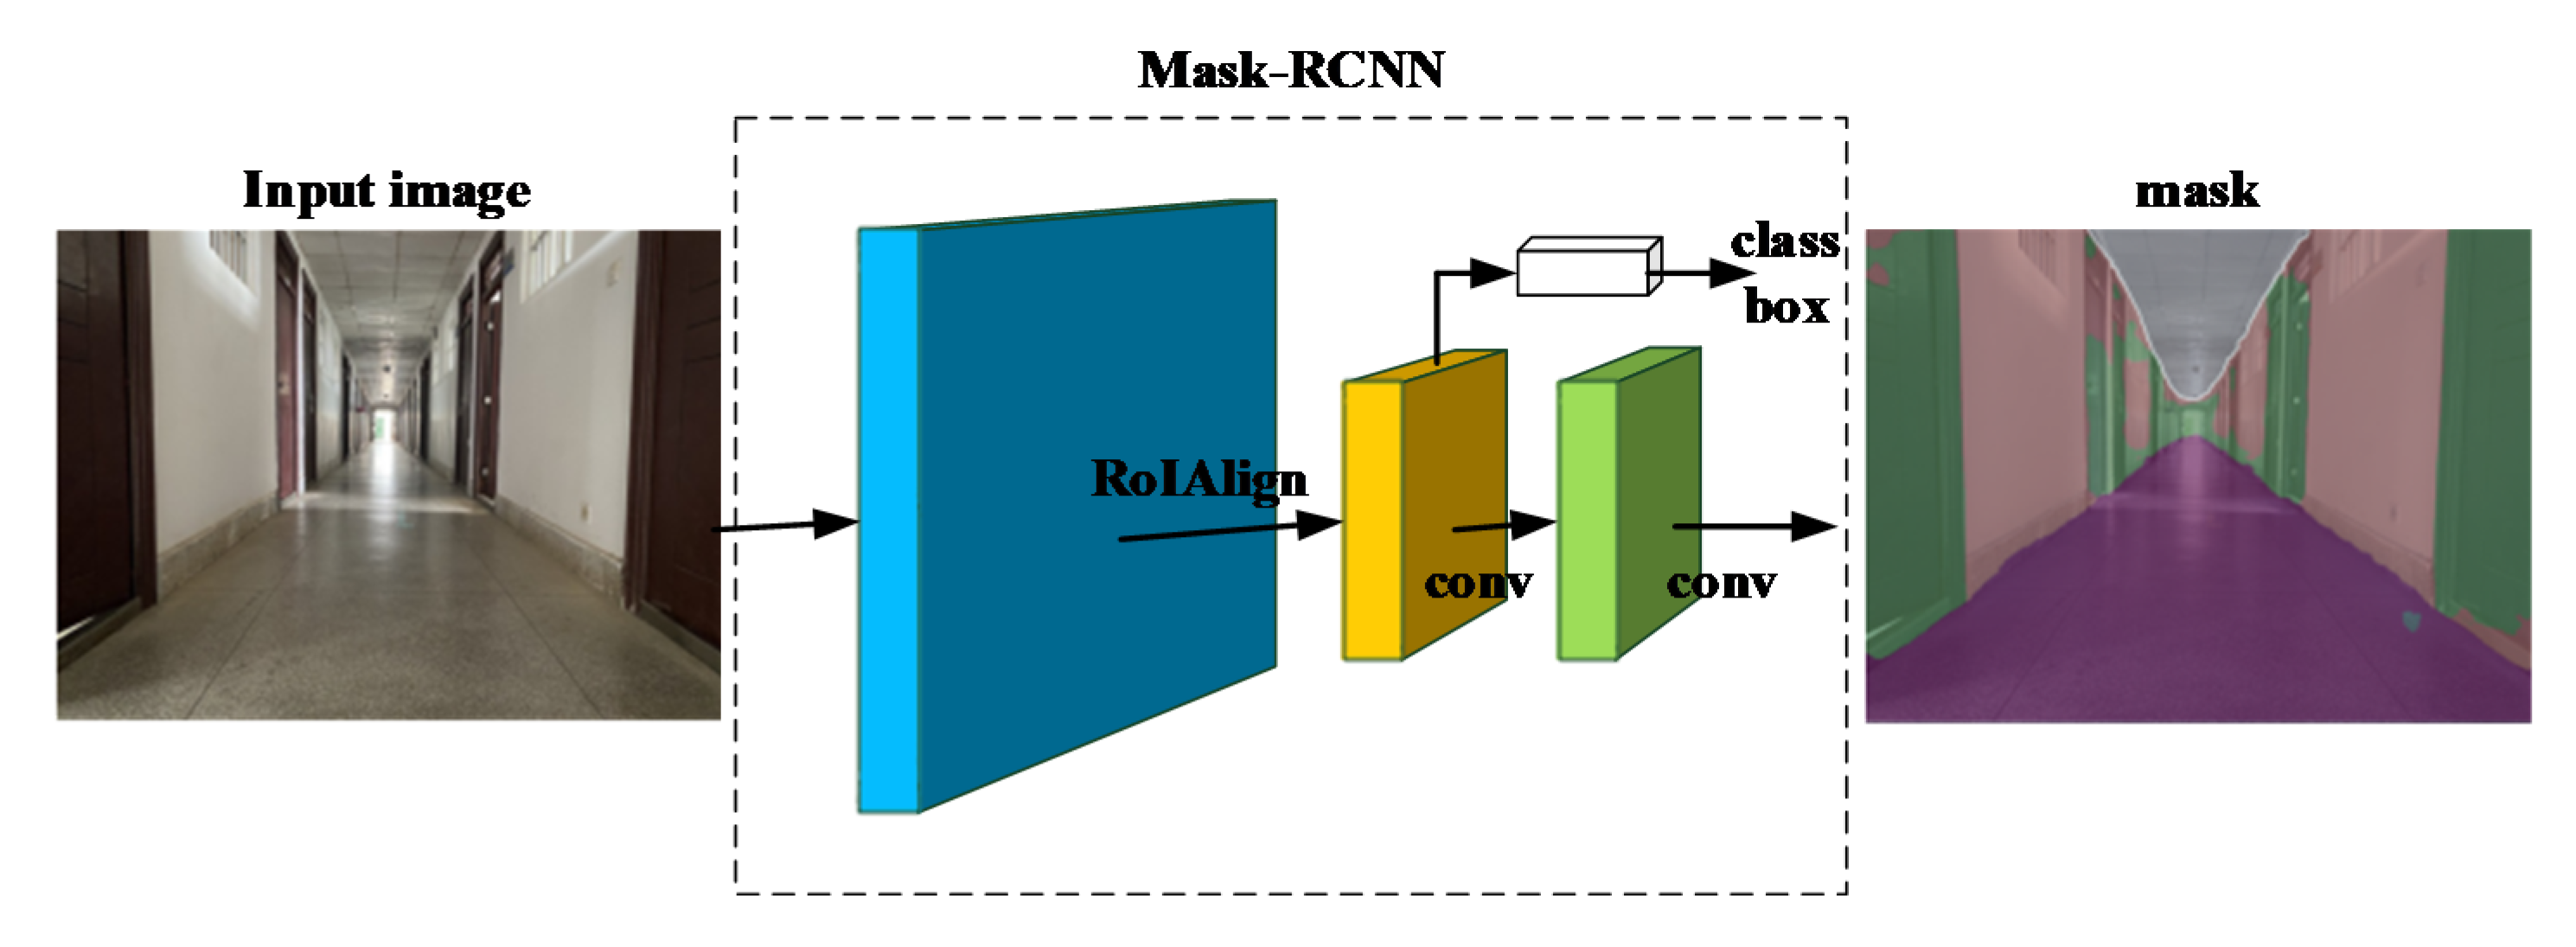
- He, K.; Gkioxari, G.; Dollár, P.; Girshick, R. Mask R-CNN. IEEE Trans. Pattern Anal. Mach. Intell. 2020, 42, 386–397. [Google Scholar] [CrossRef] [PubMed]
- OpenCV Developers Team. Open Source Computer Vision (OpenCV) Library. Available online: http://opencv.org (accessed on 23 December 2020).


| Number of Detected Line Segments | Number of Data Associations | Number of Correct Data Associations | |
|---|---|---|---|
| Classical method | 203 | 178 | 108 |
| Improved method | 46 | 37 | 37 |
| Sequence | ORB-SLAM2 | PL-SLAM | Ours | ||||
|---|---|---|---|---|---|---|---|
| trel (m) | Rrel (°) | trel (m) | Rrel (°) | trel (m) | Rrel (°) | ||
| P001 | Easy | 1.33 | 16.15 | 1.63 | 16.55 | 1.37 | 16.07 |
| Hard | 1.68 | 8.73 | 1.53 | 7.65 | 1.40 | 7.62 | |
| P005 | Easy | 1.63 | 13.24 | 1.61 | 18.16 | 1.57 | 13.47 |
| Hard | 1.04 | 7.13 | 1.72 | 10.35 | 1.19 | 9.15 | |
| P006 | Easy | 1.37 | 12.17 | 1.71 | 13.41 | 1.28 | 11.77 |
| Hard | 1.48 | 5.68 | 1.86 | 4.93 | 1.47 | 5.05 | |
| Sequence | 00 | 04 | 07 | 08 |
|---|---|---|---|---|
| Ours | 5.223 | 2.220 | 4.545 | 9.584 |
| ORB-SLAM2 | 3.020 | 2.229 | 4.805 | 4.492 |
| TartanAir, 640 × 480, 25 fps | KITTI, 1241 × 376, 10 fps | ||
|---|---|---|---|
| Visual Odometry | ORB-SLAM2 | 36.09 ms | 100.07 ms |
| PL-SLAM | 46.66 ms | 123.11 ms | |
| OURS | 43.84 ms | 108.49 ms | |
| Local Mapping | ORB-SLAM2 | 142.31 ms | 239.03 ms |
| PL-SLAM | 105.91 ms | 160.93 ms | |
| OURS | 169.40 ms | 253.71 ms | |
| Loop Closing | ORB-SLAM2 | 4.12 ms | 9.36 ms |
| PL-SLAM | 4.67 ms | 24.60 ms | |
| OURS | 4.89 ms | 38.61 ms | |
Publisher’s Note: MDPI stays neutral with regard to jurisdictional claims in published maps and institutional affiliations. |
© 2021 by the authors. Licensee MDPI, Basel, Switzerland. This article is an open access article distributed under the terms and conditions of the Creative Commons Attribution (CC BY) license (http://creativecommons.org/licenses/by/4.0/).
Share and Cite
Li, G.; Zeng, Y.; Huang, H.; Song, S.; Liu, B.; Liao, X. A Multi-Feature Fusion Slam System Attaching Semantic Invariant to Points and Lines. Sensors 2021, 21, 1196. https://doi.org/10.3390/s21041196
Li G, Zeng Y, Huang H, Song S, Liu B, Liao X. A Multi-Feature Fusion Slam System Attaching Semantic Invariant to Points and Lines. Sensors. 2021; 21(4):1196. https://doi.org/10.3390/s21041196
Chicago/Turabian StyleLi, Gang, Yawen Zeng, Huilan Huang, Shaojian Song, Bin Liu, and Xiang Liao. 2021. "A Multi-Feature Fusion Slam System Attaching Semantic Invariant to Points and Lines" Sensors 21, no. 4: 1196. https://doi.org/10.3390/s21041196
APA StyleLi, G., Zeng, Y., Huang, H., Song, S., Liu, B., & Liao, X. (2021). A Multi-Feature Fusion Slam System Attaching Semantic Invariant to Points and Lines. Sensors, 21(4), 1196. https://doi.org/10.3390/s21041196