
Estimating Sleep Stages Using a Head Acceleration Sensor


Abstract
1. Introduction
2. Subjects and Methodology
2.1. Subjects
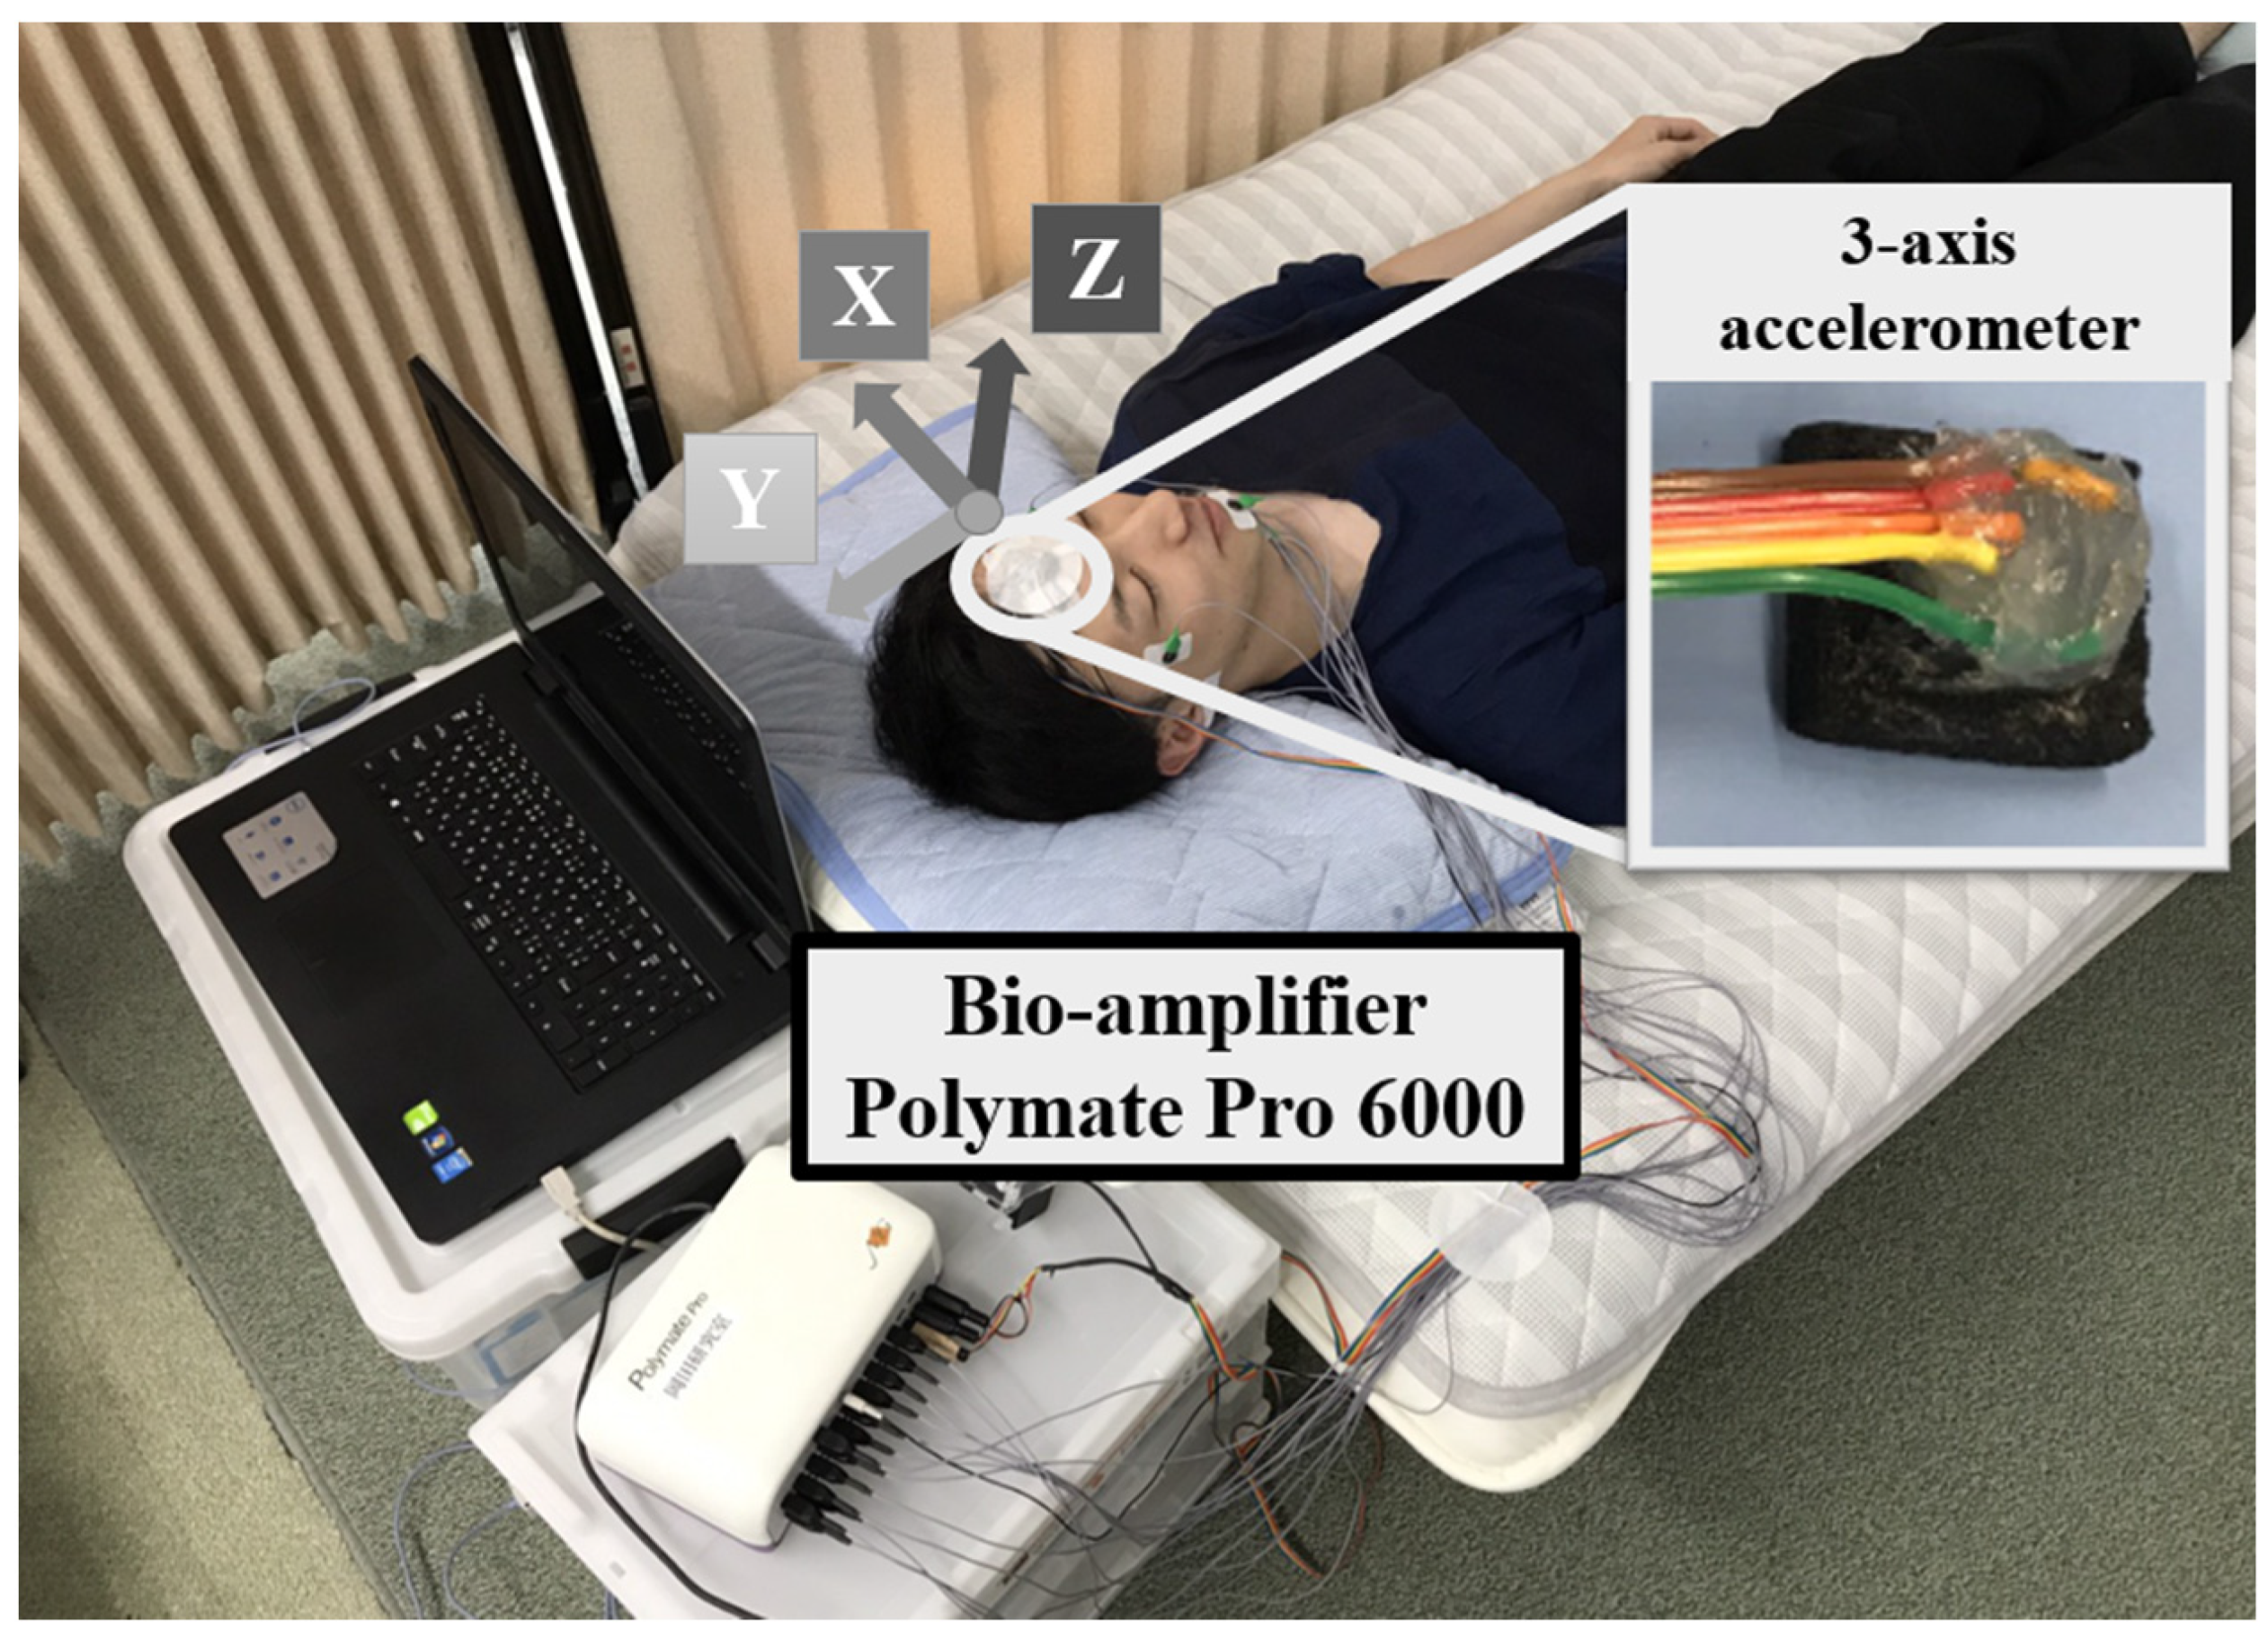
2.2. Experiment
2.3. Methodology
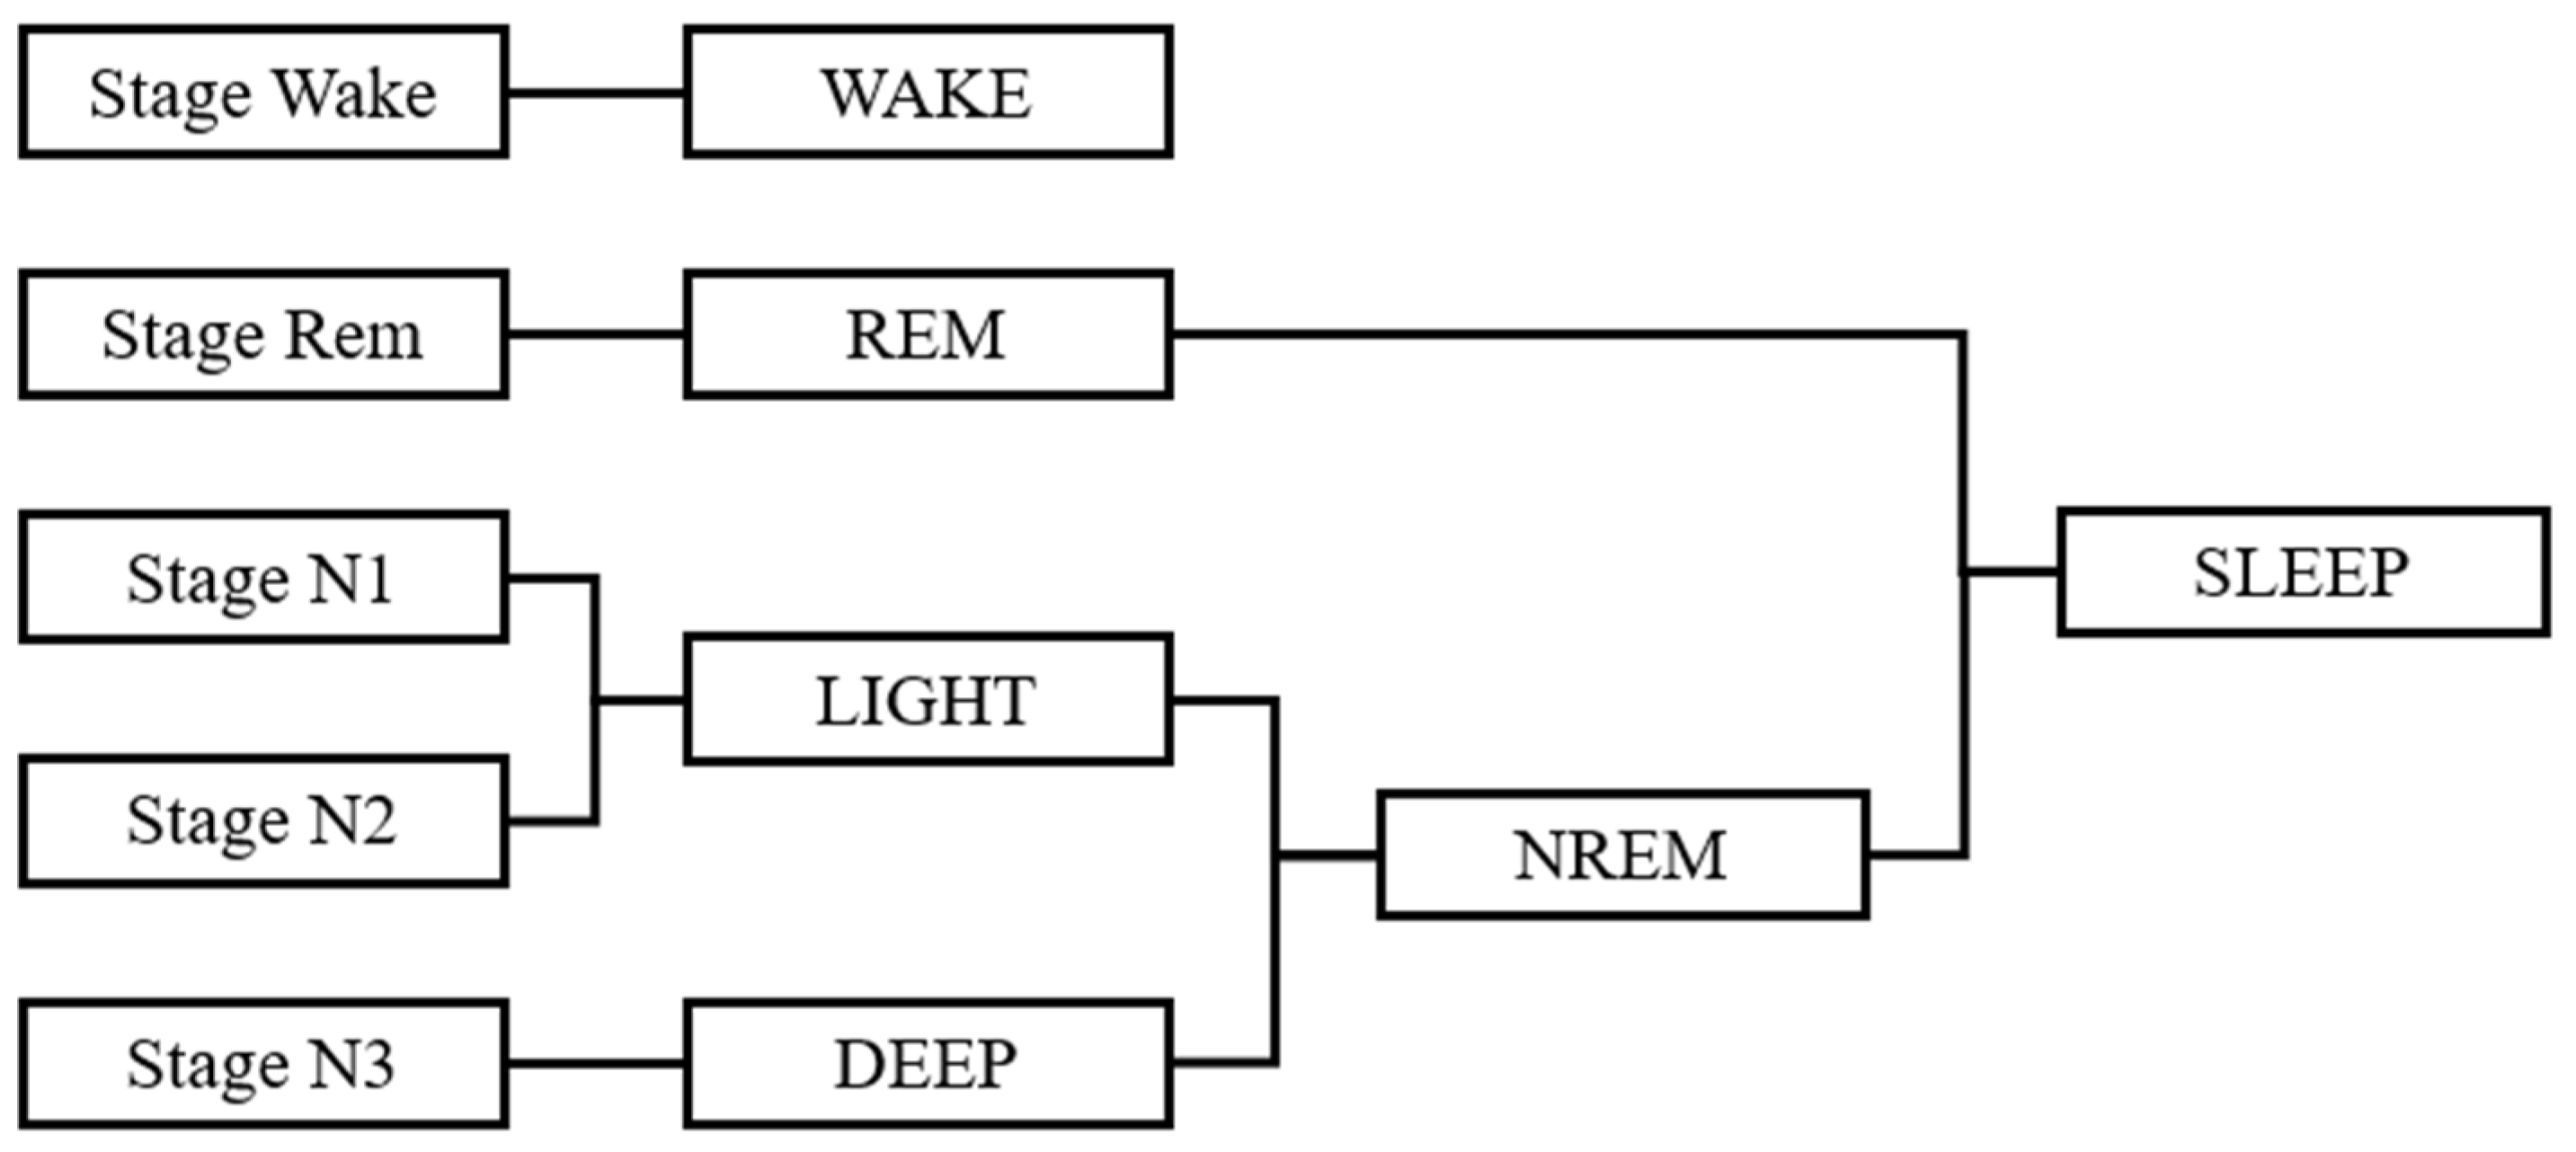
2.3.1. Defining the Sleep Stage
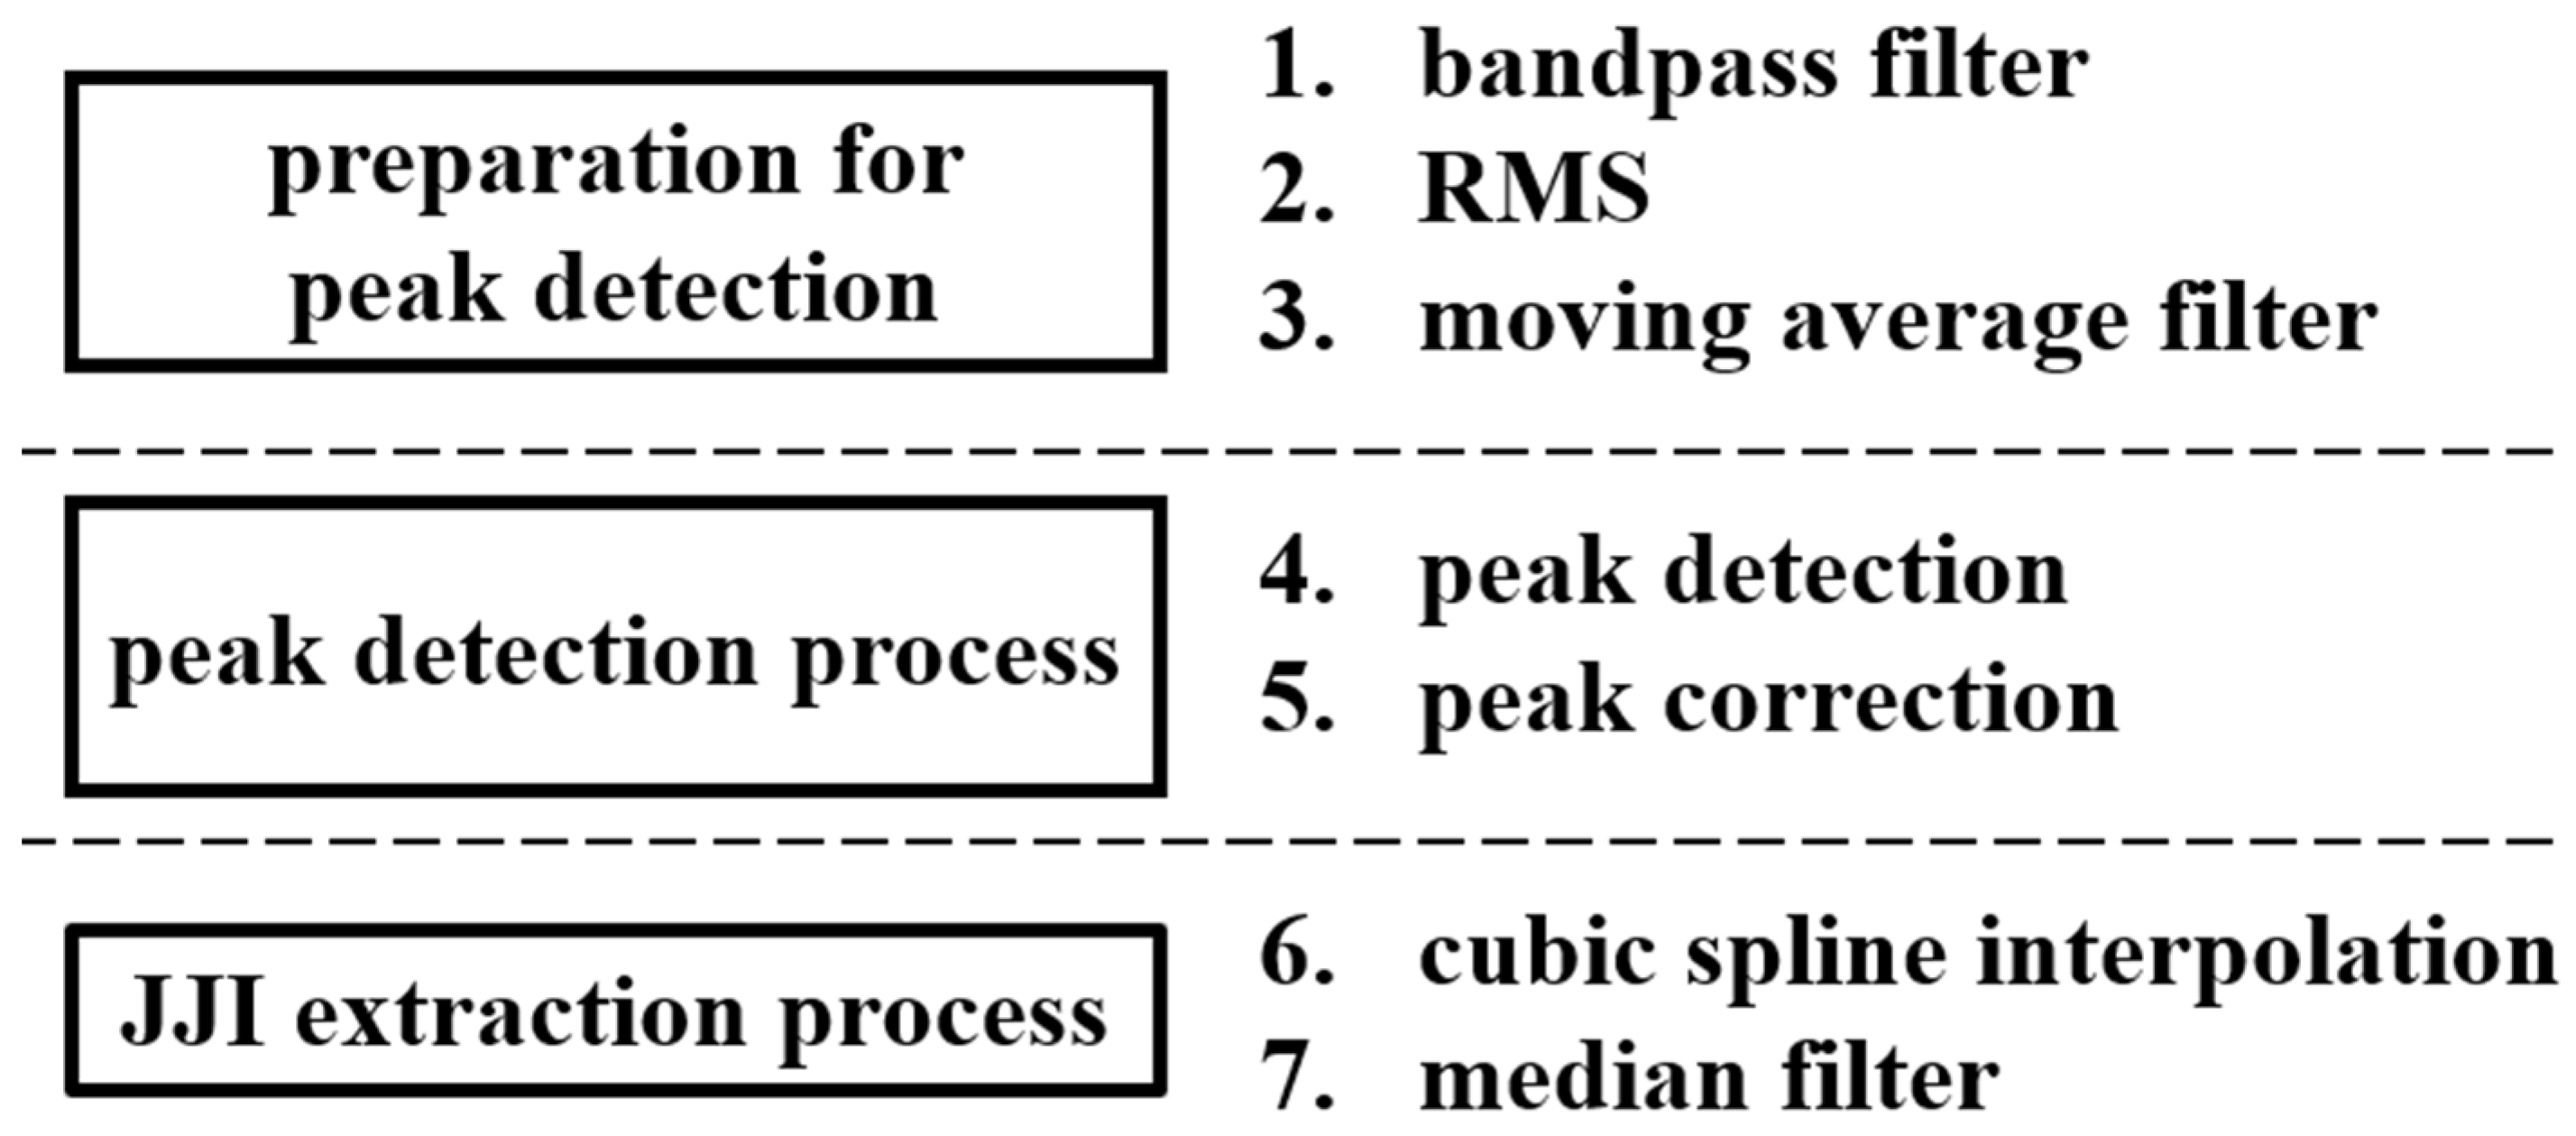
2.3.2. Sleep Stage Estimating
2.3.3. Evaluation Methods
3. Results
3.1. Results of Sleep Stages Used as Correct Data
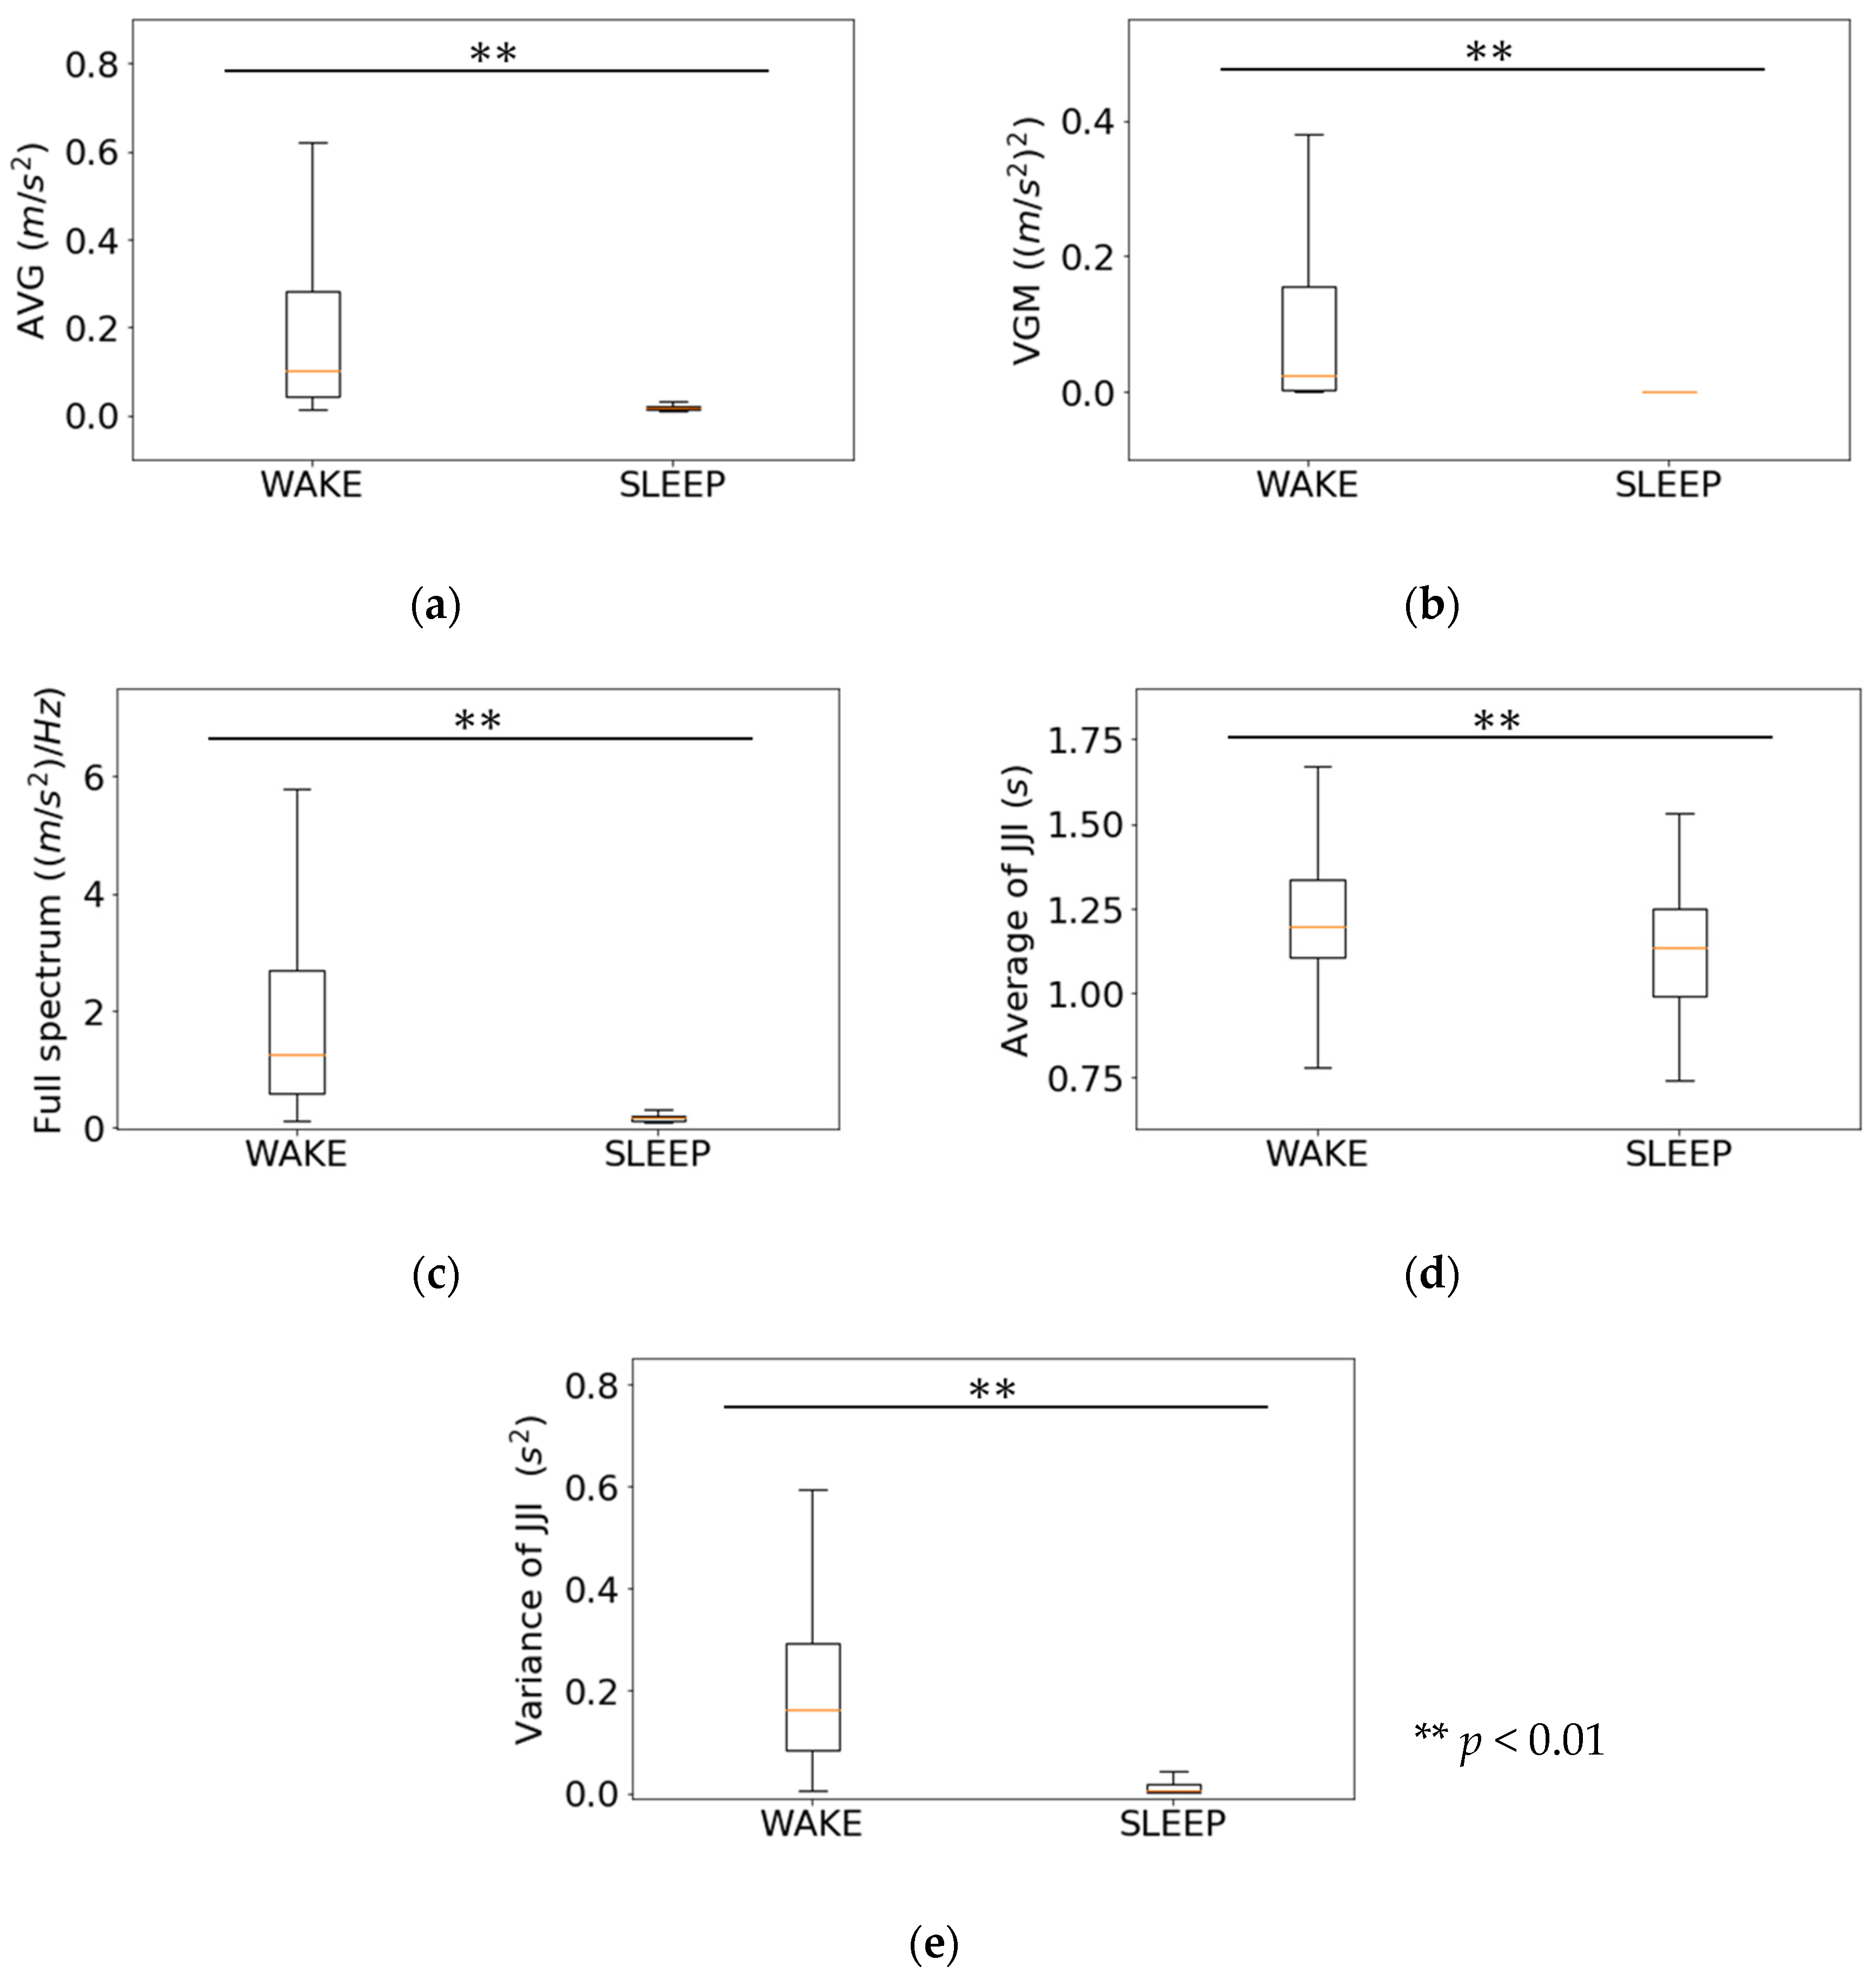
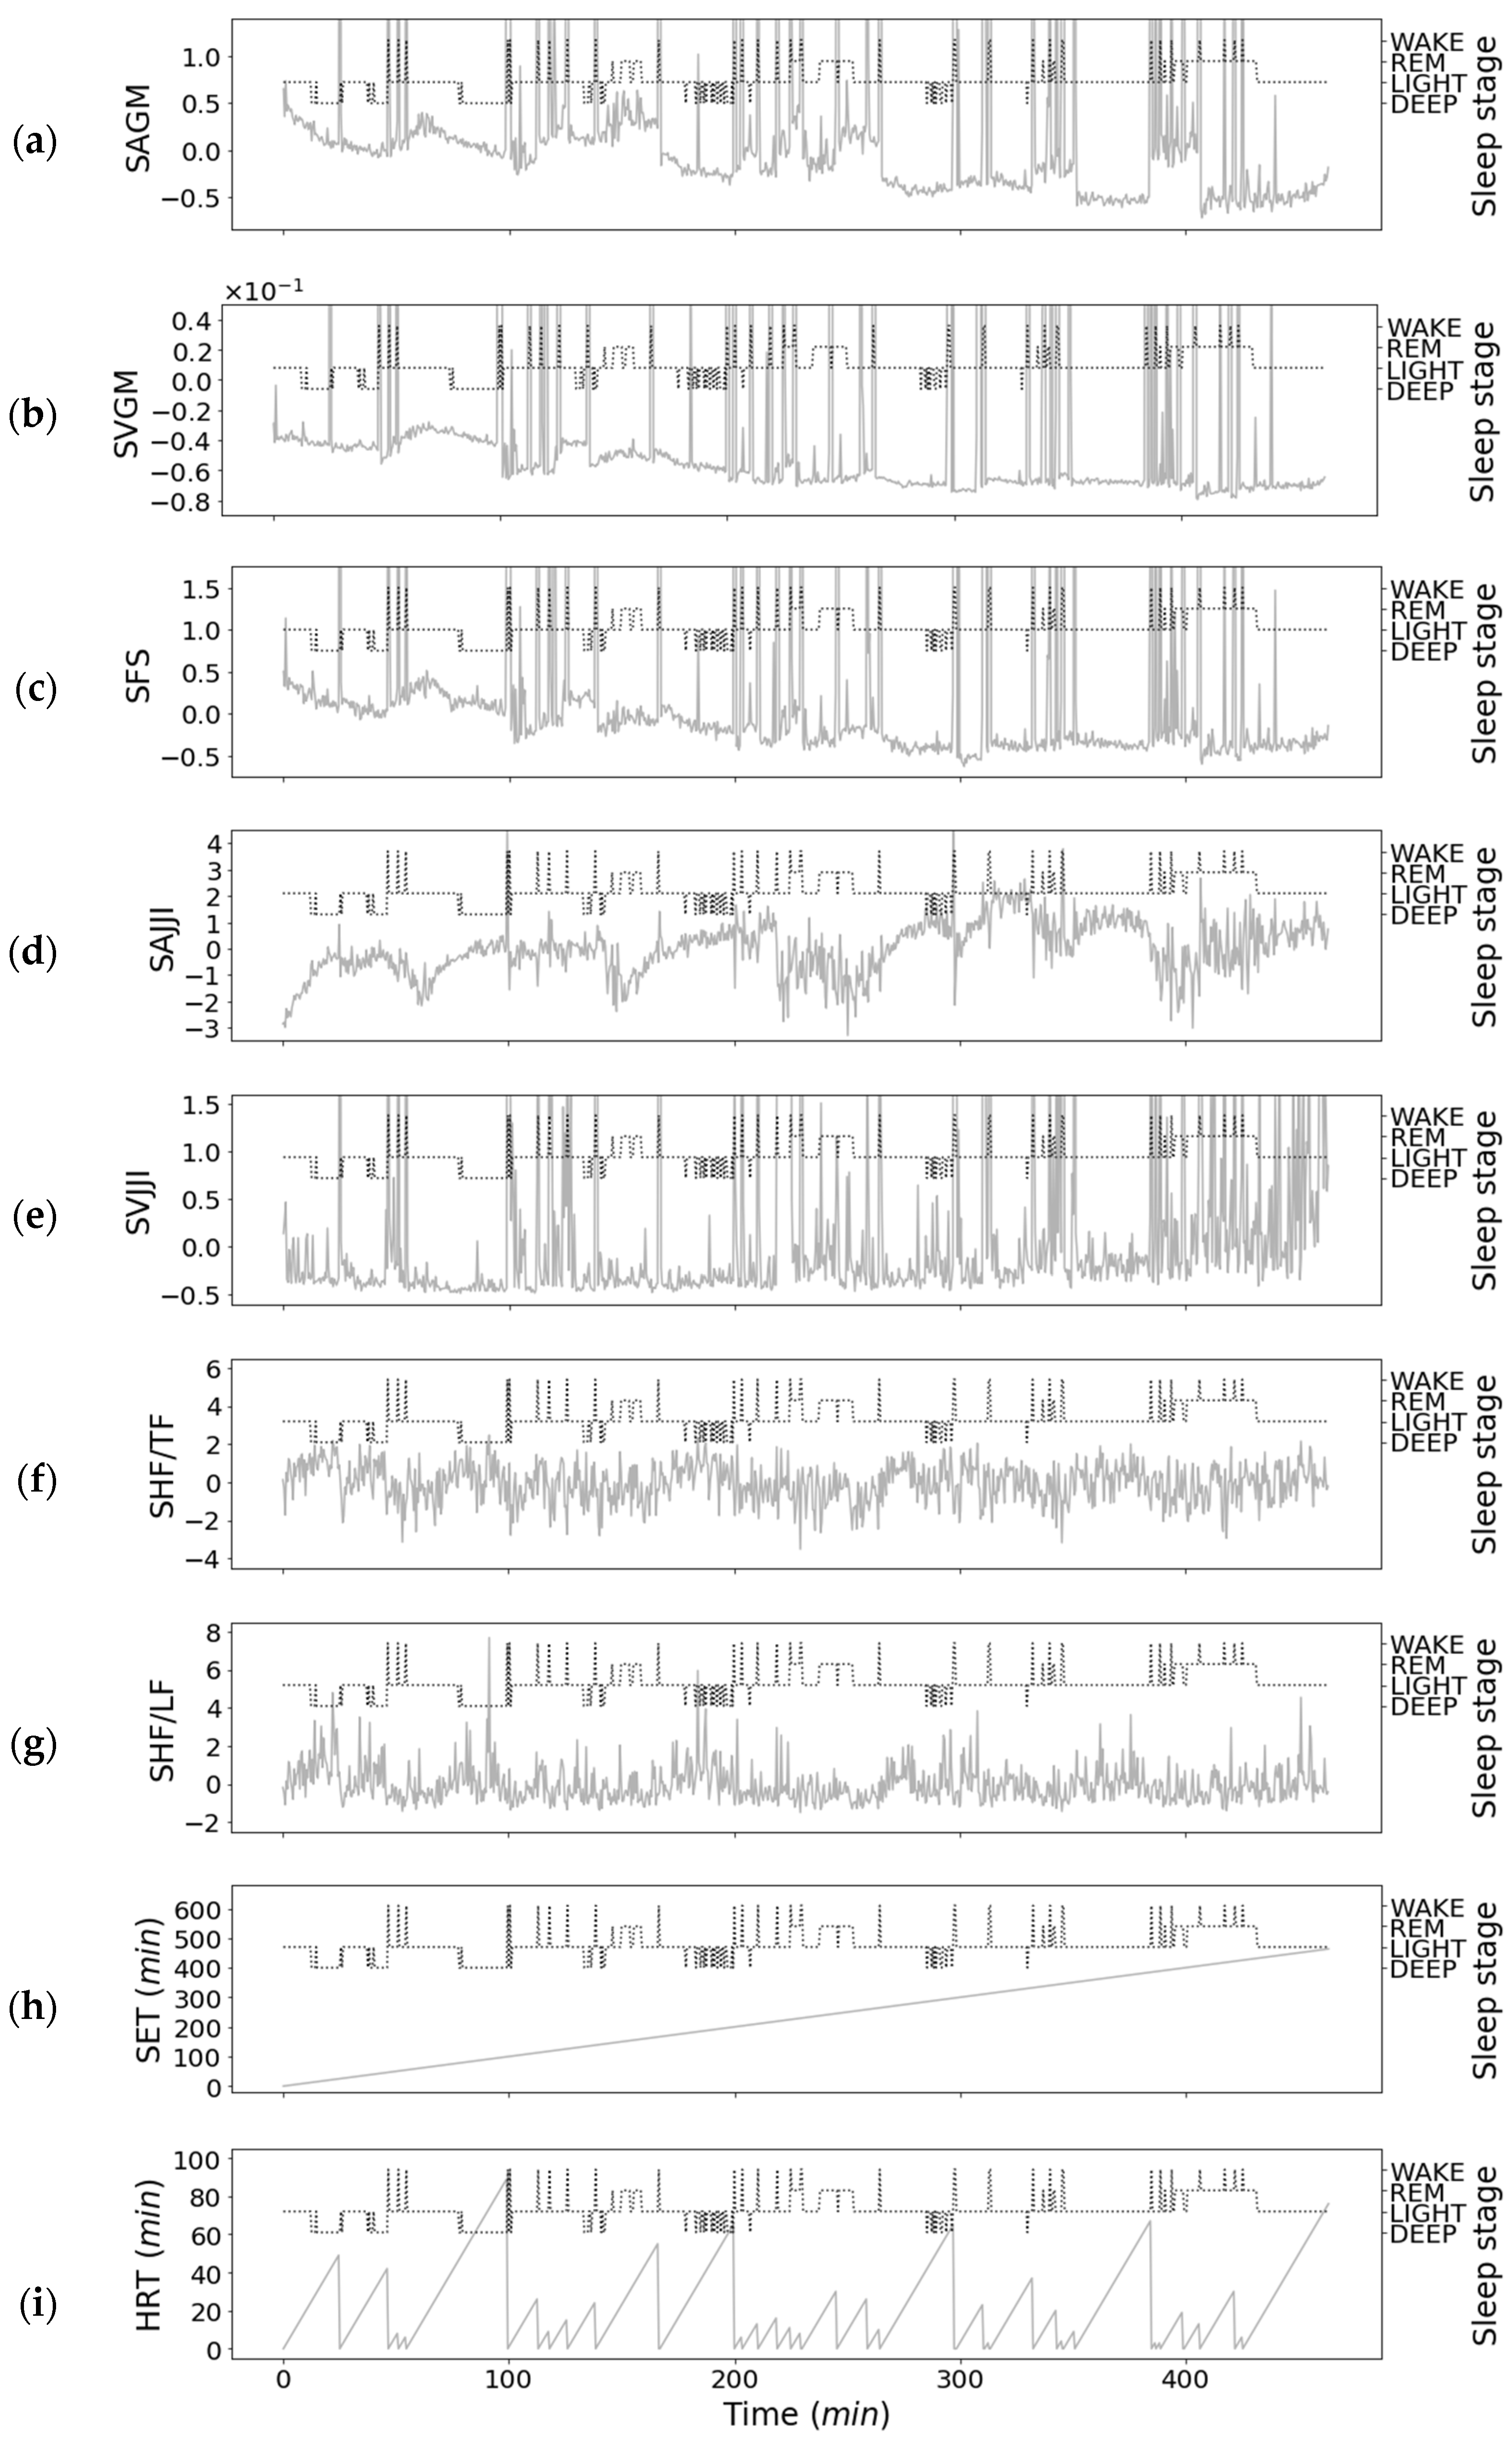
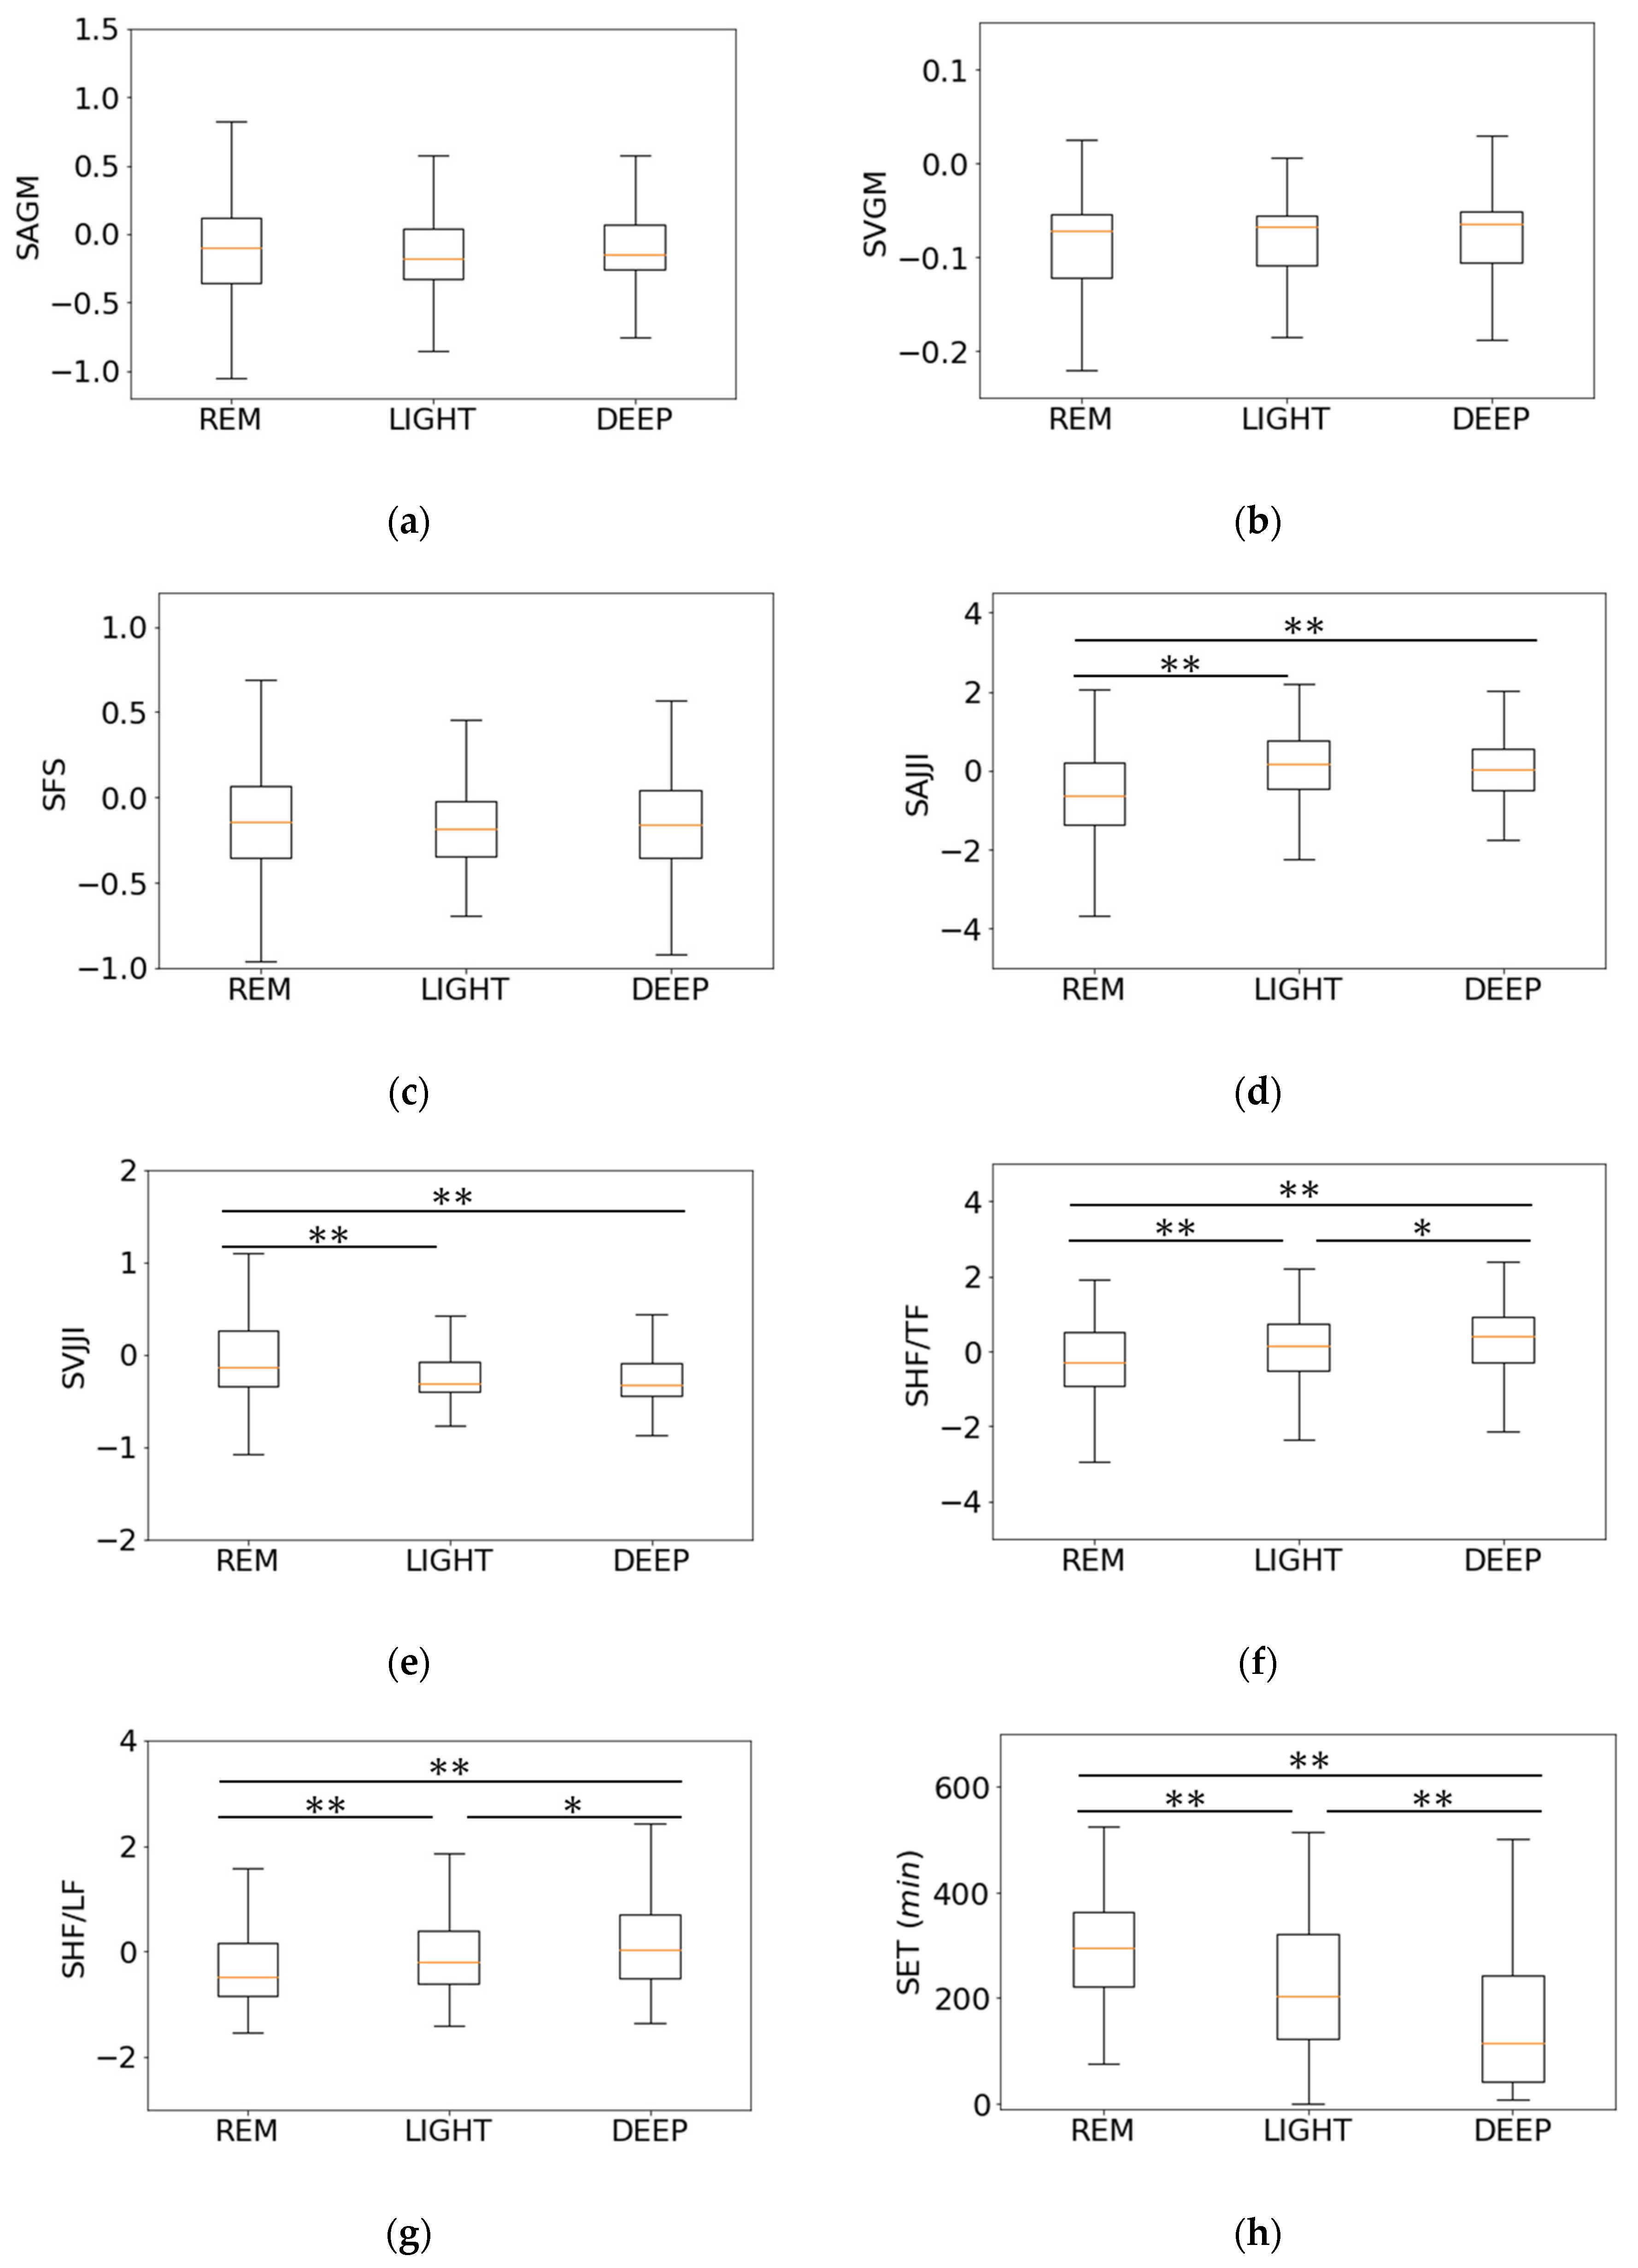
3.2. Relationship between Features of First-Step Classifier and Sleep Stages
3.3. Relationship between Features of Second-Step Classifier and Sleep Stages
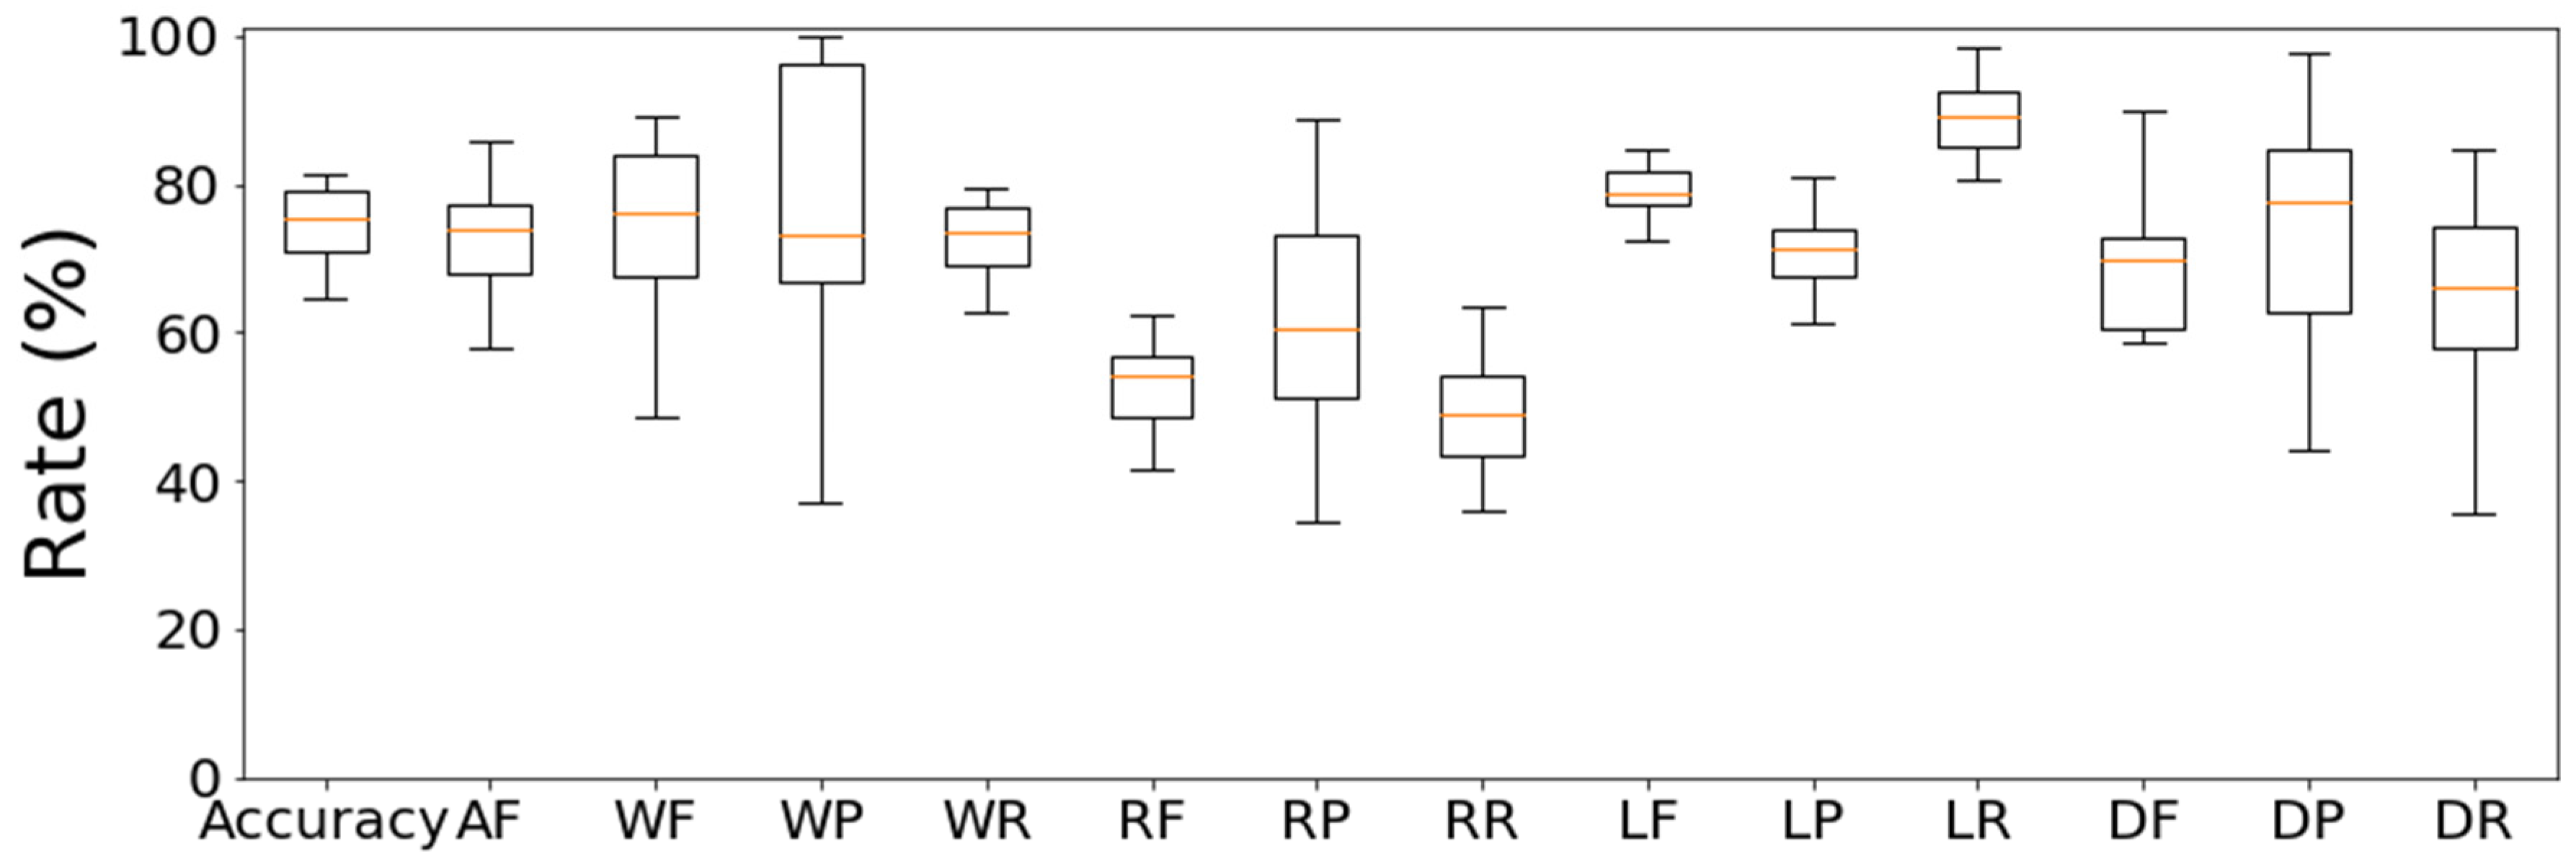
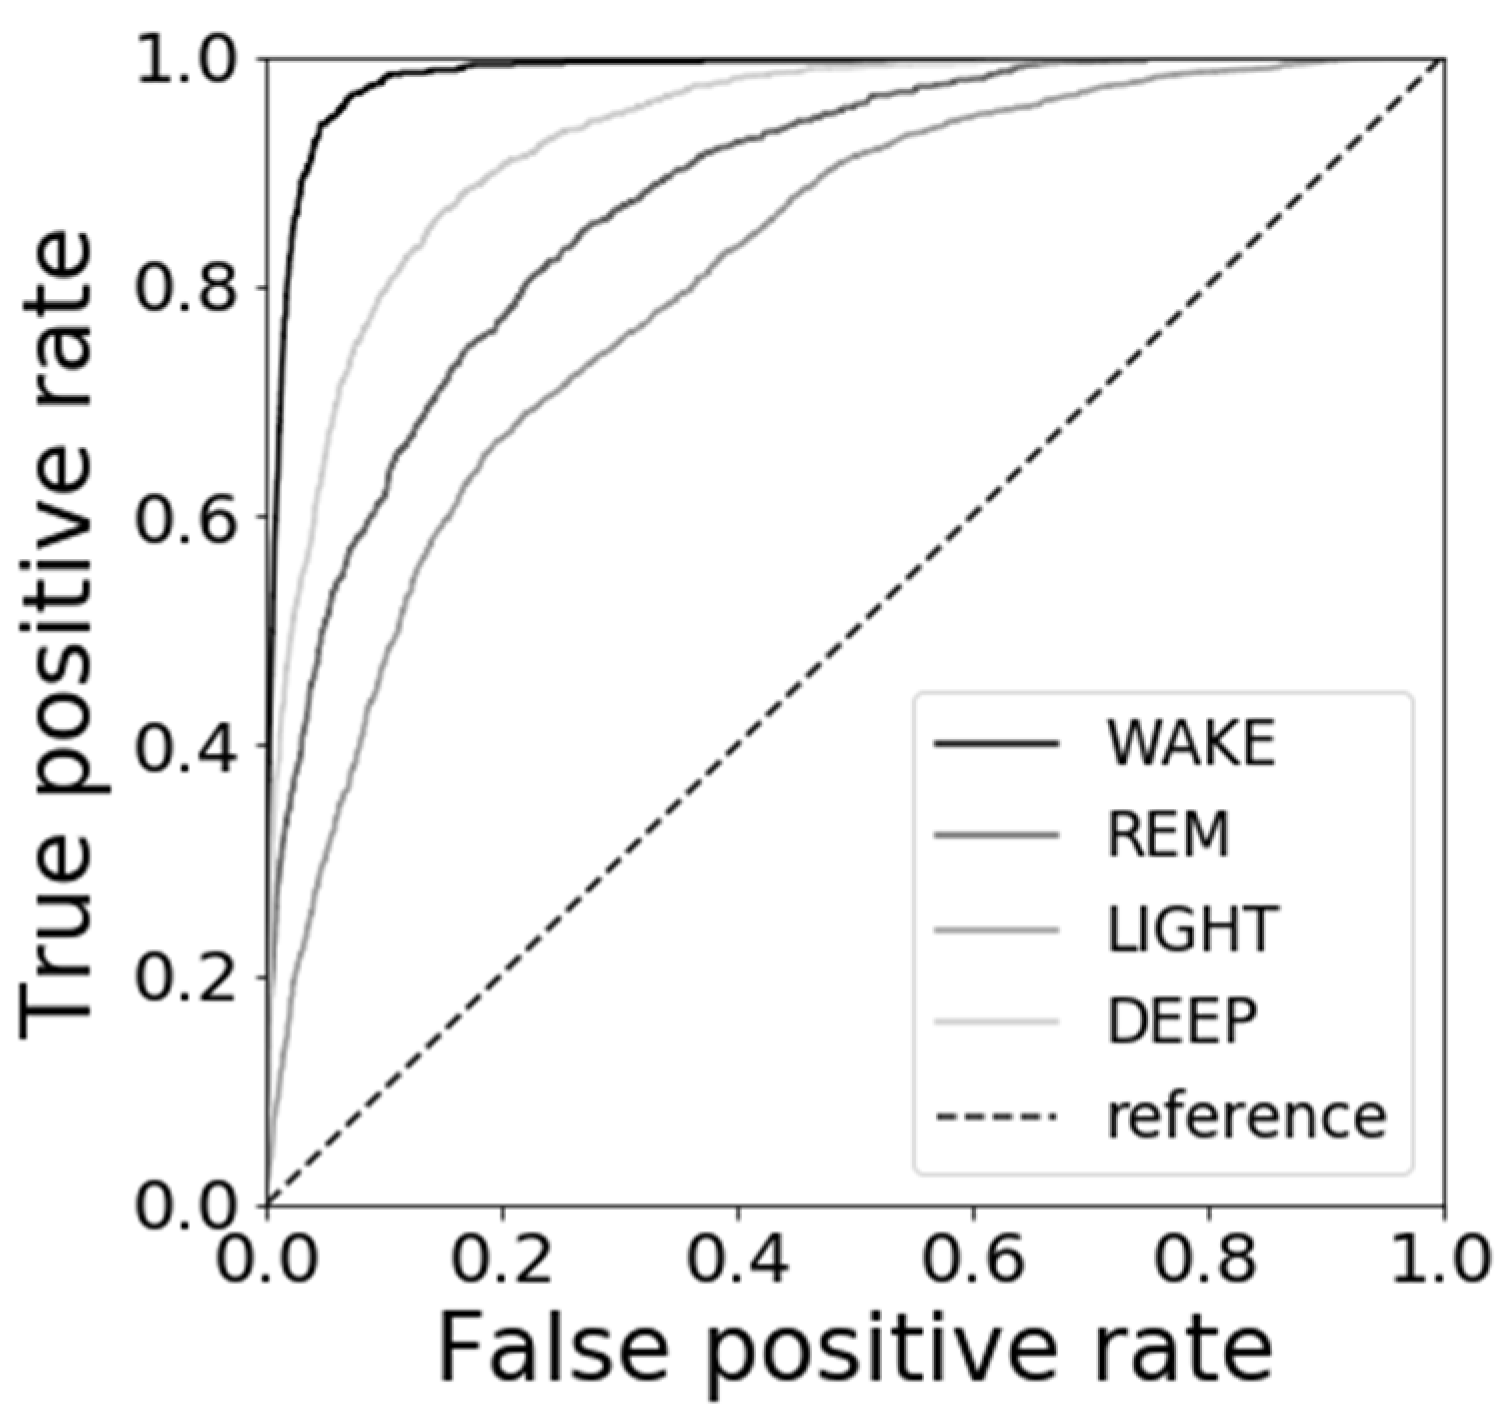
3.4. Results of Sleep Stage Estimations
4. Discussion
5. Conclusions
Author Contributions
Funding
Institutional Review Board Statement
Informed Consent Statement
Data Availability Statement
Acknowledgments
Conflicts of Interest
References
- Kim, K.; Uchiyama, M.; Okawa, M.; Liu, X.; Ogihara, R. An epidemiological study of insomnia among the Japanese general population. Am. Acad. Sleep Med. 2000, 23, 41–47. [Google Scholar] [CrossRef]
- Doi, Y. Prevalence and health impacts of sleep disorders in Japan. J. Nat. Inst. Public Health 2012, 61, 3–10. [Google Scholar]
- Japanese Society of Sleep Research (Ed.) Handbook of Sleep Science and Sleep Medicine; Asakura Shoten: Tokyo, Japan, 1994. [Google Scholar]
- Scatena, M.; Dittoni, S.; Maviflia, R.; Testani, E.; Vollono, C.; Losudo, A.; Colicchio, S.; Gnoni, V.; Labriola, C.; Farina, B.; et al. An integrated video-analysis software system designed for movement detection and sleep analysis. Validation of a tool for the behavioural study of sleep. Clin. Neurophysiol. 2012, 134, 318–323. [Google Scholar] [CrossRef] [PubMed]
- Shinkoda, H.; Park, M.; Matsumoto, K. A Basic Study on the Use of a Wrist Actigraph for Identifying Human Various Activities and Sleep/Wakefulness. J. Sci. Labour. 1998, 74, 255–265. [Google Scholar]
- Jo, K.; Hagiwara, H. Evaluation of body movement during sleep using an infrared motion sensor. Trans. Jpn. Soc. Med. Biol. Eng. 2009, 47, 7–14. [Google Scholar]
- Erina, V. The significance of the time interrelationships in ballistocardiographic analysis. Transl. Ter. Arkhiv. 1960, 32, 77–85. [Google Scholar]
- He, D.; Winokur, E.; Sodini, C. A continuous wearable and wireless heart monitor using head ballistocardiogram (BCG) and head electrocardiogram (ECG). In Proceedings of the 2011 Annual International Conference of the IEEE Engineering in Medicine and Biology Society, Boston, MA, USA, 30 August–3 September 2011; pp. 4729–4732. [Google Scholar]
- Fukuda, T.; Wakuda, Y.; Hasegawa, Y.; Arai, F.; Kawaguchi, M.; Noda, A. Sleep Quality Estimation based on Chaos Analysis for Heart Rate Variability. Trans. Inst. Electric. Eng. Jpn. 2005, 125, 43–49. [Google Scholar]
- Liu, J.; Kubo, M.; Aoki, H.; Terauchi, F. The transfer function of human body on vertical sinusoidal vibration. Jpn. J. Ergon. 1996, 32, 29–38. [Google Scholar]
- Kato, M.; Hagiwara, H. Extraction of Body Movement Characteristics during Sleep by Measuring at Different Body Sites. Trans. Jpn. Soc. Med. Biol. Eng. 2014, 52, 175–180. [Google Scholar]
- Yousefian, P.; Shin, S.; Mousavi, A.; Kim, C.; Finegan, B.; McMurtry, M.; Mukkamala, R.; Jang, D.; Kwon, U.; Kim, Y.; et al. Physiological Association between Limb Ballistocardiogram and Arterial Blood Pressure Waveforms: A Mathematical Model-Based Analysis. Sci. Rep. 2019, 9, 5146. [Google Scholar] [CrossRef]
- Hassan, M.; Malik, A.; Fofi, D.; Saad, N.; Karasfi, B.; Ali, Y.; Meriaudeau, F. Heart rate estimation using facial video: A review. Biomed. Signal Process. Control 2017, 38, 346–360. [Google Scholar] [CrossRef]
- Guha, B.; Fredo, D.; John, G. Detecting Pulse from Head Motions in Video. In Proceedings of the IEEE Conference on Computer Vision and Pattern Recognition (CVPR), Portland, OR, USA, 23–28 June 2013; pp. 3430–3437. [Google Scholar]
- Cook, J.; Prairie, M.; Plante, D. Utility of the Fitbit Flex to evaluate sleep in major depressive disorder: A comparison against polysomnography and wrist-worn actigraphy. J. Affect. Disord. 2017, 217, 299–305. [Google Scholar] [CrossRef] [PubMed]
- Curzi-Dascalova, L.; Mirmiran, L. Manual of Methods for Recording and Analyzing Sleep-Wakefulness States in Preterm and Full-Term Infant; Les Editions INSERM: Paris, France, 1996. [Google Scholar]
- Smagula, S.; Stone, K.; Fabio, A.; Cauley, j. Risk factors for sleep disturbances in older adults: Evidence from prospective studies. Sleep Med. Rev. 2016, 25, 21–30. [Google Scholar] [CrossRef]
- Tada, Y.; Yoshizaki, T.; Tanaka, I.; Kanehara, R.; Kato, M.; Hatta, N.; Hida, A.; Kawano, Y. Higher energy intake at dinner decreases parasympathetic activity during nighttime sleep in menstruating women: A randomized controlled trial. Physiol. Behav. 2018, 194, 252–259. [Google Scholar] [CrossRef] [PubMed]
- Gunn, H.; Lee, S.; Eberhardt, K.; Buxton, O.; Troxel, W. Nightly sleep-wake concordance and daily marital interactions. Sleep Health 2021, in press. [Google Scholar] [CrossRef] [PubMed]
- Garefelt, J.; Platts, L.; Hyde, M.; Hanson, L.; Westerlund, H.; Akerstedt, T. Reciprocal relations between work stress and insomnia. J. Sleep Res. 2019, 29, e12949. [Google Scholar] [PubMed]
- Noda, A.; Koike, Y. Polysomnography. Trans. Jpn. Soc. Med. Biol. Eng. 2008, 46, 134–143. [Google Scholar]
- Yang, D.; Li, Y.; Zhang, L.; Wang, X. Ballistocardiogram Insusceptibility Detection and Analysis System on FPGA. Procedia Eng. 2012, 29, 1607–1611. [Google Scholar] [CrossRef][Green Version]
- Raman, M.; Alon, A. Sleep Stages and Scoring Technique. In Atlas of Sleep Medicine; Elsevier: Amsterdam, The Netherlands, 2014; pp. 77–99. [Google Scholar]
- Eckberg, D.; Kuusela, T. Human vagal baroreflex sensitivity fluctuates widely. J. Physiol. 2005, 567, 1011–1019. [Google Scholar] [CrossRef]
- Bernardi, L.; Valle, F.; Coco, M.; Calciati, A.; Sleight, P. Physical activity influences heart rate variability and very-low-frequency components in Holter electrocardiograms. Cardiovasc. Res. 1996, 32, 234–237. [Google Scholar] [CrossRef]
- Tanida, K.; Yanagihashi, R.; Honda, T.; Shibata, M. Comparisons of Power Spectral Indices of Heart Rate Variability. J Jpn. Soc. Nurs. Res. 2011, 34, 191–198. [Google Scholar]
- Cabon, S.; Poree, F.; Simon, A.; Met-Montot, B.; Pladys, P.; Rosec, O.; Nardi, N. Audio- and video-based estimation of the sleep stages of newborns in Neonatal Intensive Care Unit. Biomed. Signal Process. Control 2019, 52, 362–370. [Google Scholar] [CrossRef]
- Ran, W.; Xinghua, Z.; Jinhai, W.; Xin, D. The research of sleep staging based on single-lead electrocardiogram and deep neural network. Biomed. Eng. Lett. 2018, 8, 87–89. [Google Scholar]
- Supratak, A.; Dong, H.; Wu, C.; Guo, Y. DeepSleepNet: A Model for Automatic Sleep Stage Scoring Based on Raw Single-Channel EEG. IEEE Trans. Neural Syst. Rehabil. Eng. 2017, 25, 1998–2008. [Google Scholar] [CrossRef] [PubMed]
- Alain, M.; Sandra, W.; Gil, F.; Thomas, R.; Jay, S. Assessing sleep architecture and continuity measures through the analysis of heart rate and wrist movement recordings in healthy subjects: Comparison with results based on polysomnography. Sleep Med. 2016, 21, 47–56. [Google Scholar]
- Taylor, J.; Carr, D.; Eckberg, D. Mechanisms underlying very-low-frequency RR-interval oscillations in humans. Cicrulation 1998, 98, 547–555. [Google Scholar] [CrossRef] [PubMed]
- Fleisher, L.; Frank, S.; Sessler, D.; Cheng, C.; Matsukawa, T. Thermoregulation and heart rate variability. Clin. Sci. 1996, 90, 97–103. [Google Scholar] [CrossRef]
- Johannes, B.; Gregory, N.; Urban, W.; Ulf, L. Heart rate variability during sedentary work and sleep in normal and sleep-deprived states. Clin. Physiol. Funct. Imaging 2005, 25, 51–57. [Google Scholar]
- Abdulnasir, H. A soft decision algorithm for obstructive sleep apnea patient classification based on fast estimation of wavelet entropy of RRI data. Technol. Health Care 2005, 13, 151–165. [Google Scholar]
- Mitsukura, Y.; Sumali, B.; Bafura, M.; Fukunaga, K.; Yasui, M. Sleep Stage Estimation from Bed Leg Ballistocardiogram Sensors. Sensors 2020, 20, 5688. [Google Scholar] [CrossRef]
- Willemen, T.; Deun, D.; Verhaert, V.; Vandekerckhove, M.; Exadaktylos, V.; Vervraecken, J.; Huffel, S.; Haex, B.; Sloten, J. An evaluation of cardiorespiratory and movement features with respect to sleep-stage classification. IEEE J. Biomed. Health Inform. 2014, 18, 661–669. [Google Scholar] [CrossRef] [PubMed]
- Zhang, X.; Kou, W.; Chang, E.; Gao, H.; Fan, Y.; Xu, Y. Sleep stage classification based on multi-level feature learning and recurrent. Comput. Biol. Med. 2018, 103, 71–81. [Google Scholar] [CrossRef] [PubMed]
- Nochino, T.; Ohano, Y.; Kato, T.; Taniike, M.; Okada, S. Sleep stage estimation method using a camera for home use. Biomed. Eng. Lett. 2019, 9, 257–265. [Google Scholar] [CrossRef] [PubMed]


| Subject No. | 1 | 2 | 3 | 4 | 5 | 6 | 7 | 8 | Mean | SD |
|---|---|---|---|---|---|---|---|---|---|---|
| Age (years) | 21 | 22 | 22 | 23 | 22 | 21 | 21 | 22 | 21.8 | 0.7 |
| Height (m) | 1.79 | 1.72 | 1.70 | 1.79 | 1.70 | 1.65 | 1.69 | 1.70 | 1.718 | 0.046 |
| Weight (kg) | 83 | 54 | 68 | 67 | 85 | 55 | 63 | 60 | 66.9 | 10.9 |
| No. | Name | Extraction Method |
|---|---|---|
| 1 | Average of gross movements (AGM) | Gross movements |
| 2 | Variance of gross movements (VGM) | Gross movements |
| 3 | Full spectrum (FS) | Spectrum |
| 4 | Average of JJI (AJJI) | Twitch movements |
| 5 | Variance of JJI(VJJI) | Twitch movements |
| No. | Name | Feature Effective for Sleep Stage Estimation |
|---|---|---|
| 1 | Standardized average of gross movements (SAGM) | DEEP |
| 2 | Standardized variance of gross movements (SVGM) | DEEP |
| 3 | Standardized full spectrum (SFS) | REM, LIGHT DEEP |
| 4 | Standardized average of JJI (SAJJI) | REM, LIGHT DEEP |
| 5 | Standardized variance of JJI (SVJJI) | REM |
| 6 | Standardized HF/TF (SHF/TF) | REM, LIGHT, DEEP |
| 7 | Standardized HF/LF (SHF/LF) | REM, LIGHT, DEEP |
| 8 | Sleep elapsed time (SET) | REM, LIGHT, DEEP |
| 9 | Head rest time (HRT) | DEEP |
| Subject No. | 1 | 2 | 3 | 4 | 5 | 6 | 7 | 8 | Mean | SD | %Rate |
|---|---|---|---|---|---|---|---|---|---|---|---|
| Day 2 | |||||||||||
| WAKE (epoch) | 33 | 74 | 95 | 53 | 31 | 52 | 32 | 74 | 55.5 | 22.1 | 6.4 |
| REM (epoch) | 123 | 99 | 85 | 95 | 101 | 135 | 108 | 137 | 110.4 | 18.0 | 12.8 |
| LIGHT (epoch) | 653 | 515 | 471 | 488 | 537 | 597 | 443 | 575 | 534.9 | 65.7 | 62.0 |
| DEEP (epoch) | 119 | 206 | 175 | 184 | 141 | 140 | 157 | 170 | 161.5 | 26.1 | 18.7 |
| Day 3 | |||||||||||
| WAKE (epoch) | 32 | 60 | 85 | 65 | 21 | 57 | 38 | 33 | 48.9 | 20.0 | 5.7 |
| REM (epoch) | 121 | 102 | 4 | 63 | 141 | 156 | 161 | 123 | 108.9 | 49.3 | 12.7 |
| LIGHT (epoch) | 597 | 421 | 581 | 472 | 517 | 562 | 528 | 653 | 541.4 | 68.6 | 63.0 |
| DEEP (epoch) | 150 | 197 | 98 | 138 | 129 | 279 | 171 | 119 | 160.1 | 53.3 | 18.6 |
| Correct Answer Result | |||||
|---|---|---|---|---|---|
| WAKE | REM | LIGHT | DEEP | ||
| Estimation result | WAKE | 604 | 17 | 170 | 27 |
| REM | 11 | 975 | 627 | 47 | |
| LIGHT | 131 | 685 | 6613 | 750 | |
| DEEP | 4 | 73 | 619 | 1651 | |
| References (Years) | Sensor (Number) | Modality | n | Accuracy (%) | F-score (%) |
|---|---|---|---|---|---|
| Mitsukura [35] (2020) | Bed leg BCG sensors (1–4) | BCG | 25 | 89 | - |
| Willemen [36] (2014) | ECG (1), RIP (1), DynaSleep system (1) | Heart rate, Breathing rate, Body movements | 85 | 69 | - |
| Zhang [37] (2018) | Wrist type sensor (1) | Heart rate, Wrist actigraphy | 39 | - | 62 |
| Nochino [38] (2019) | Camera (1) | Body movements | 23 | 41 | - |
| This study | 3-axis accelerometer (1) | BCG, Head movements | 15 | 77 | 73 |
Publisher’s Note: MDPI stays neutral with regard to jurisdictional claims in published maps and institutional affiliations. |
© 2021 by the authors. Licensee MDPI, Basel, Switzerland. This article is an open access article distributed under the terms and conditions of the Creative Commons Attribution (CC BY) license (http://creativecommons.org/licenses/by/4.0/).
Share and Cite
Yoshihi, M.; Okada, S.; Wang, T.; Kitajima, T.; Makikawa, M. Estimating Sleep Stages Using a Head Acceleration Sensor. Sensors 2021, 21, 952. https://doi.org/10.3390/s21030952
Yoshihi M, Okada S, Wang T, Kitajima T, Makikawa M. Estimating Sleep Stages Using a Head Acceleration Sensor. Sensors. 2021; 21(3):952. https://doi.org/10.3390/s21030952
Chicago/Turabian StyleYoshihi, Motoki, Shima Okada, Tianyi Wang, Toshihiro Kitajima, and Masaaki Makikawa. 2021. "Estimating Sleep Stages Using a Head Acceleration Sensor" Sensors 21, no. 3: 952. https://doi.org/10.3390/s21030952
APA StyleYoshihi, M., Okada, S., Wang, T., Kitajima, T., & Makikawa, M. (2021). Estimating Sleep Stages Using a Head Acceleration Sensor. Sensors, 21(3), 952. https://doi.org/10.3390/s21030952