
Detecting the Severity of Socio-Spatial Conflicts Involving Wild Boars in the City Using Social Media Data


Abstract
:1. Introduction
2. Materials and Methods
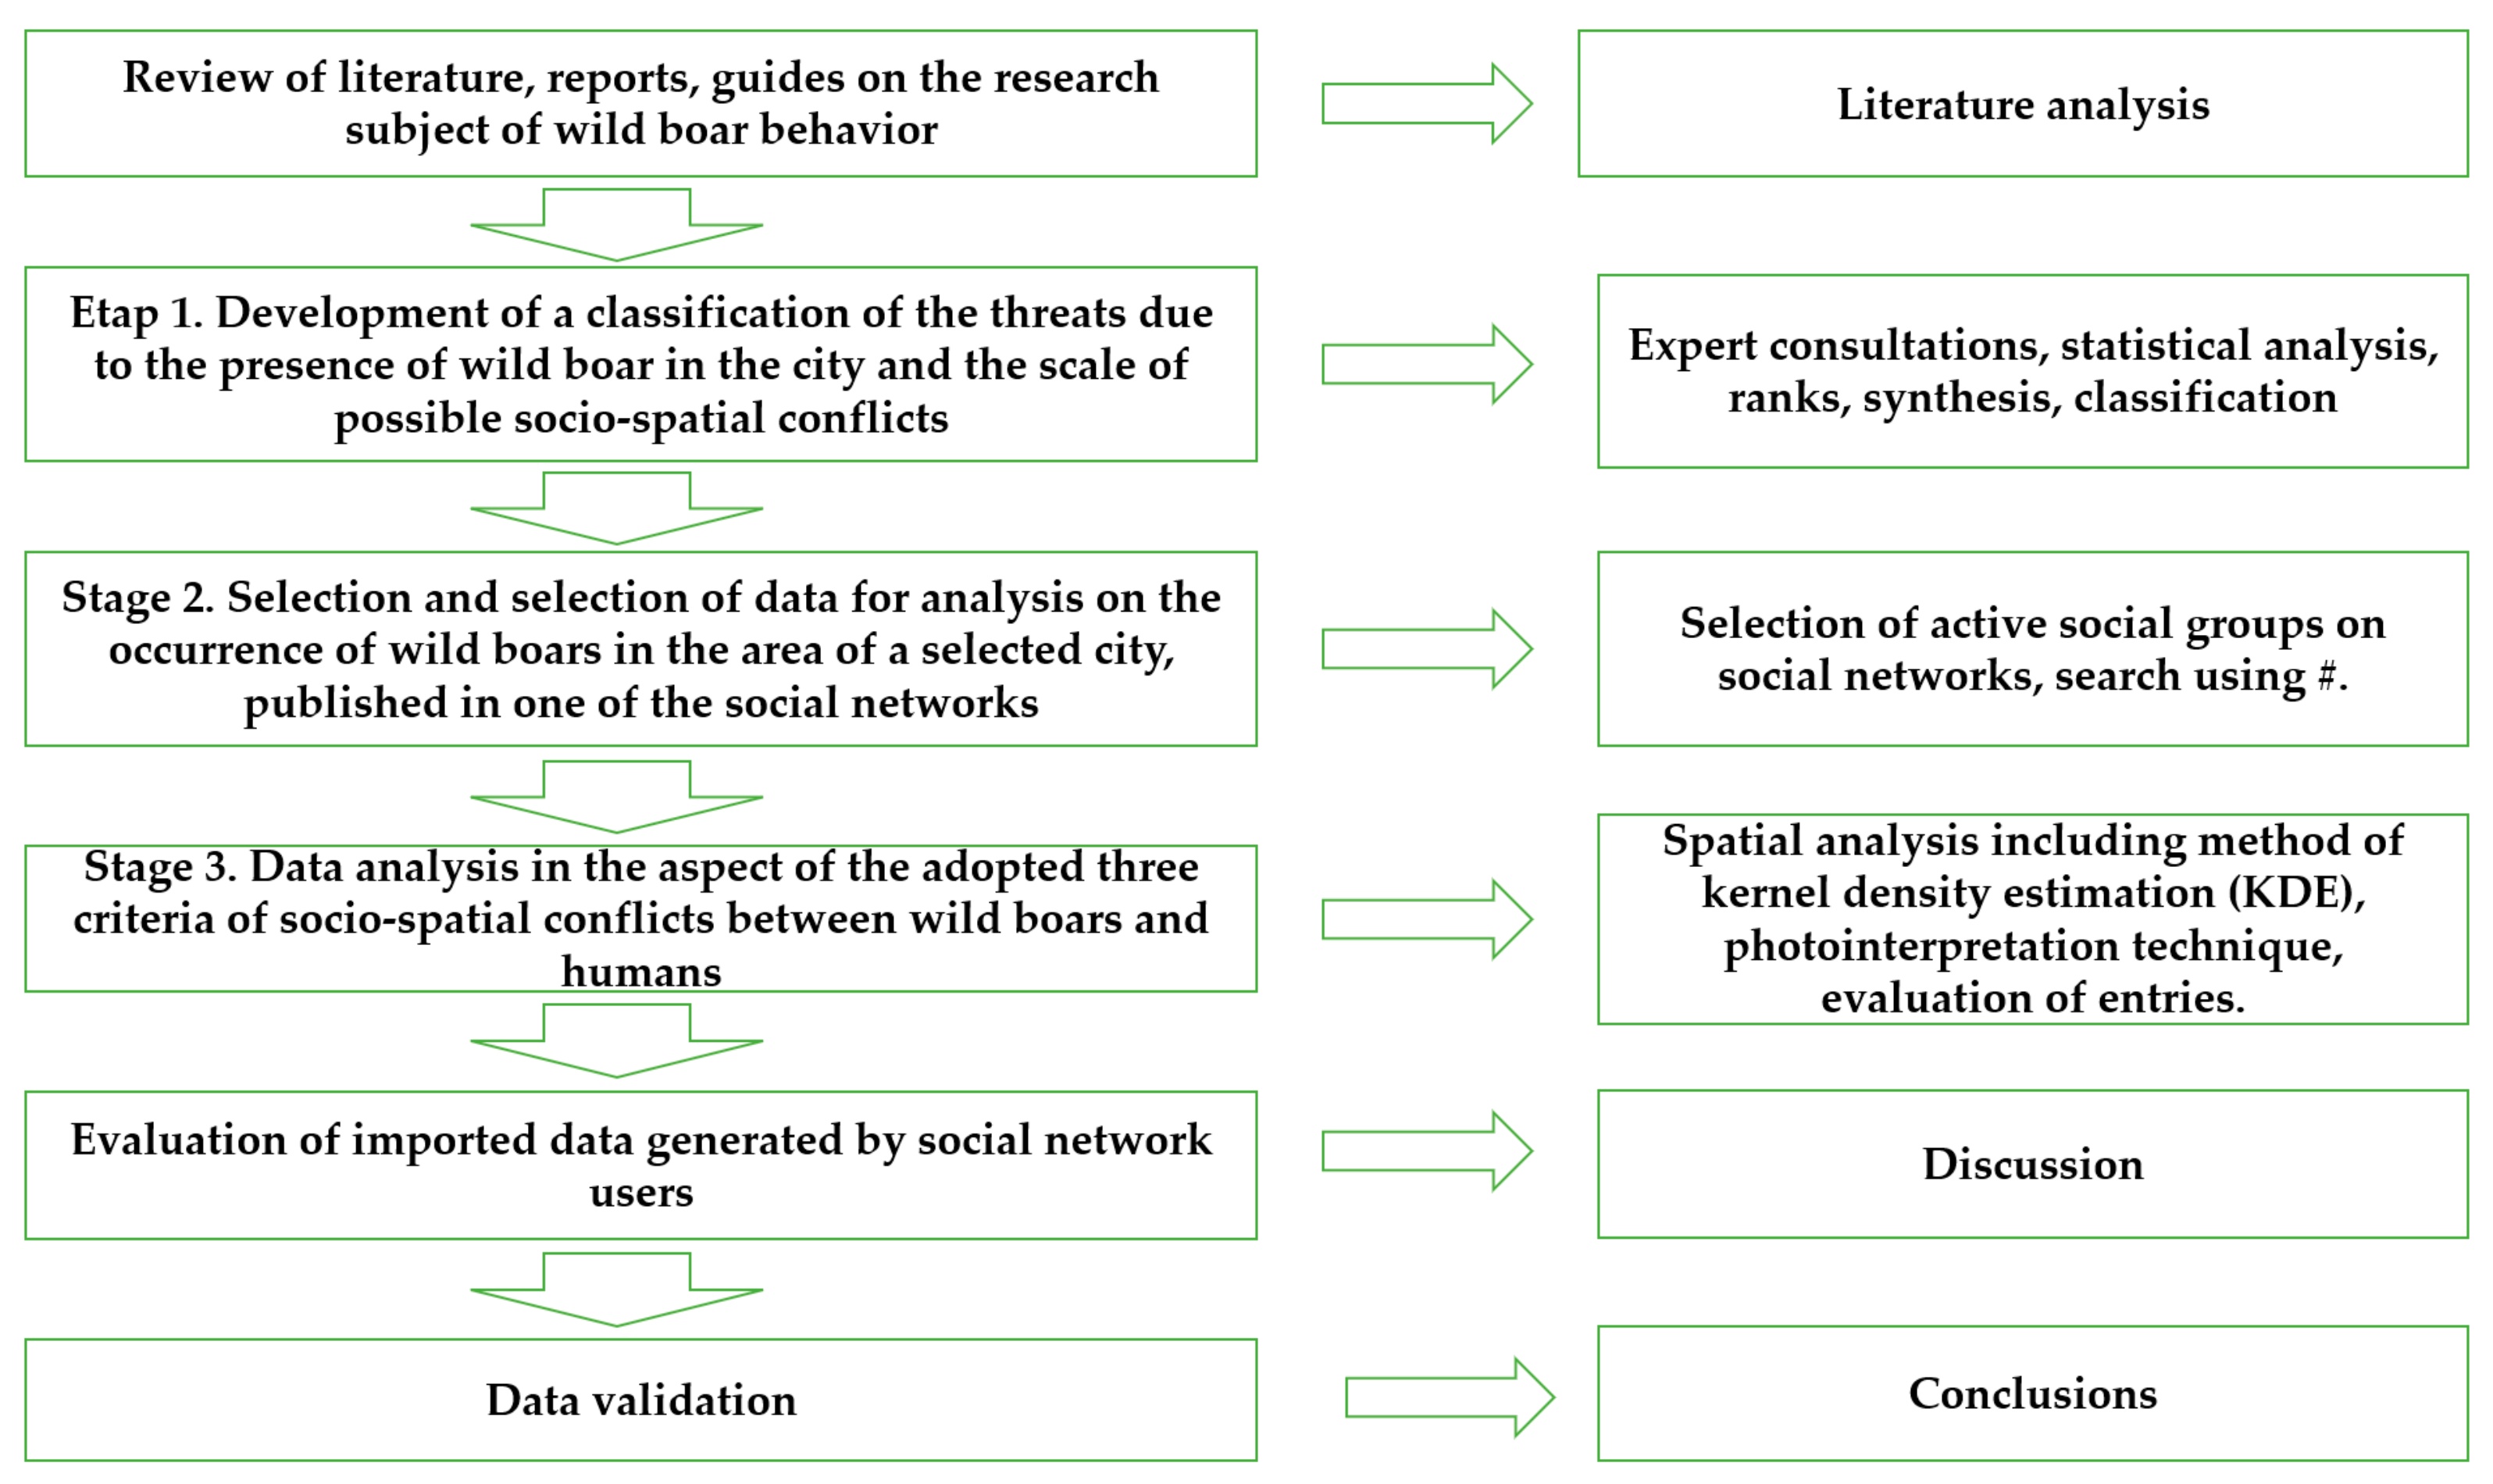
2.1. Methodology
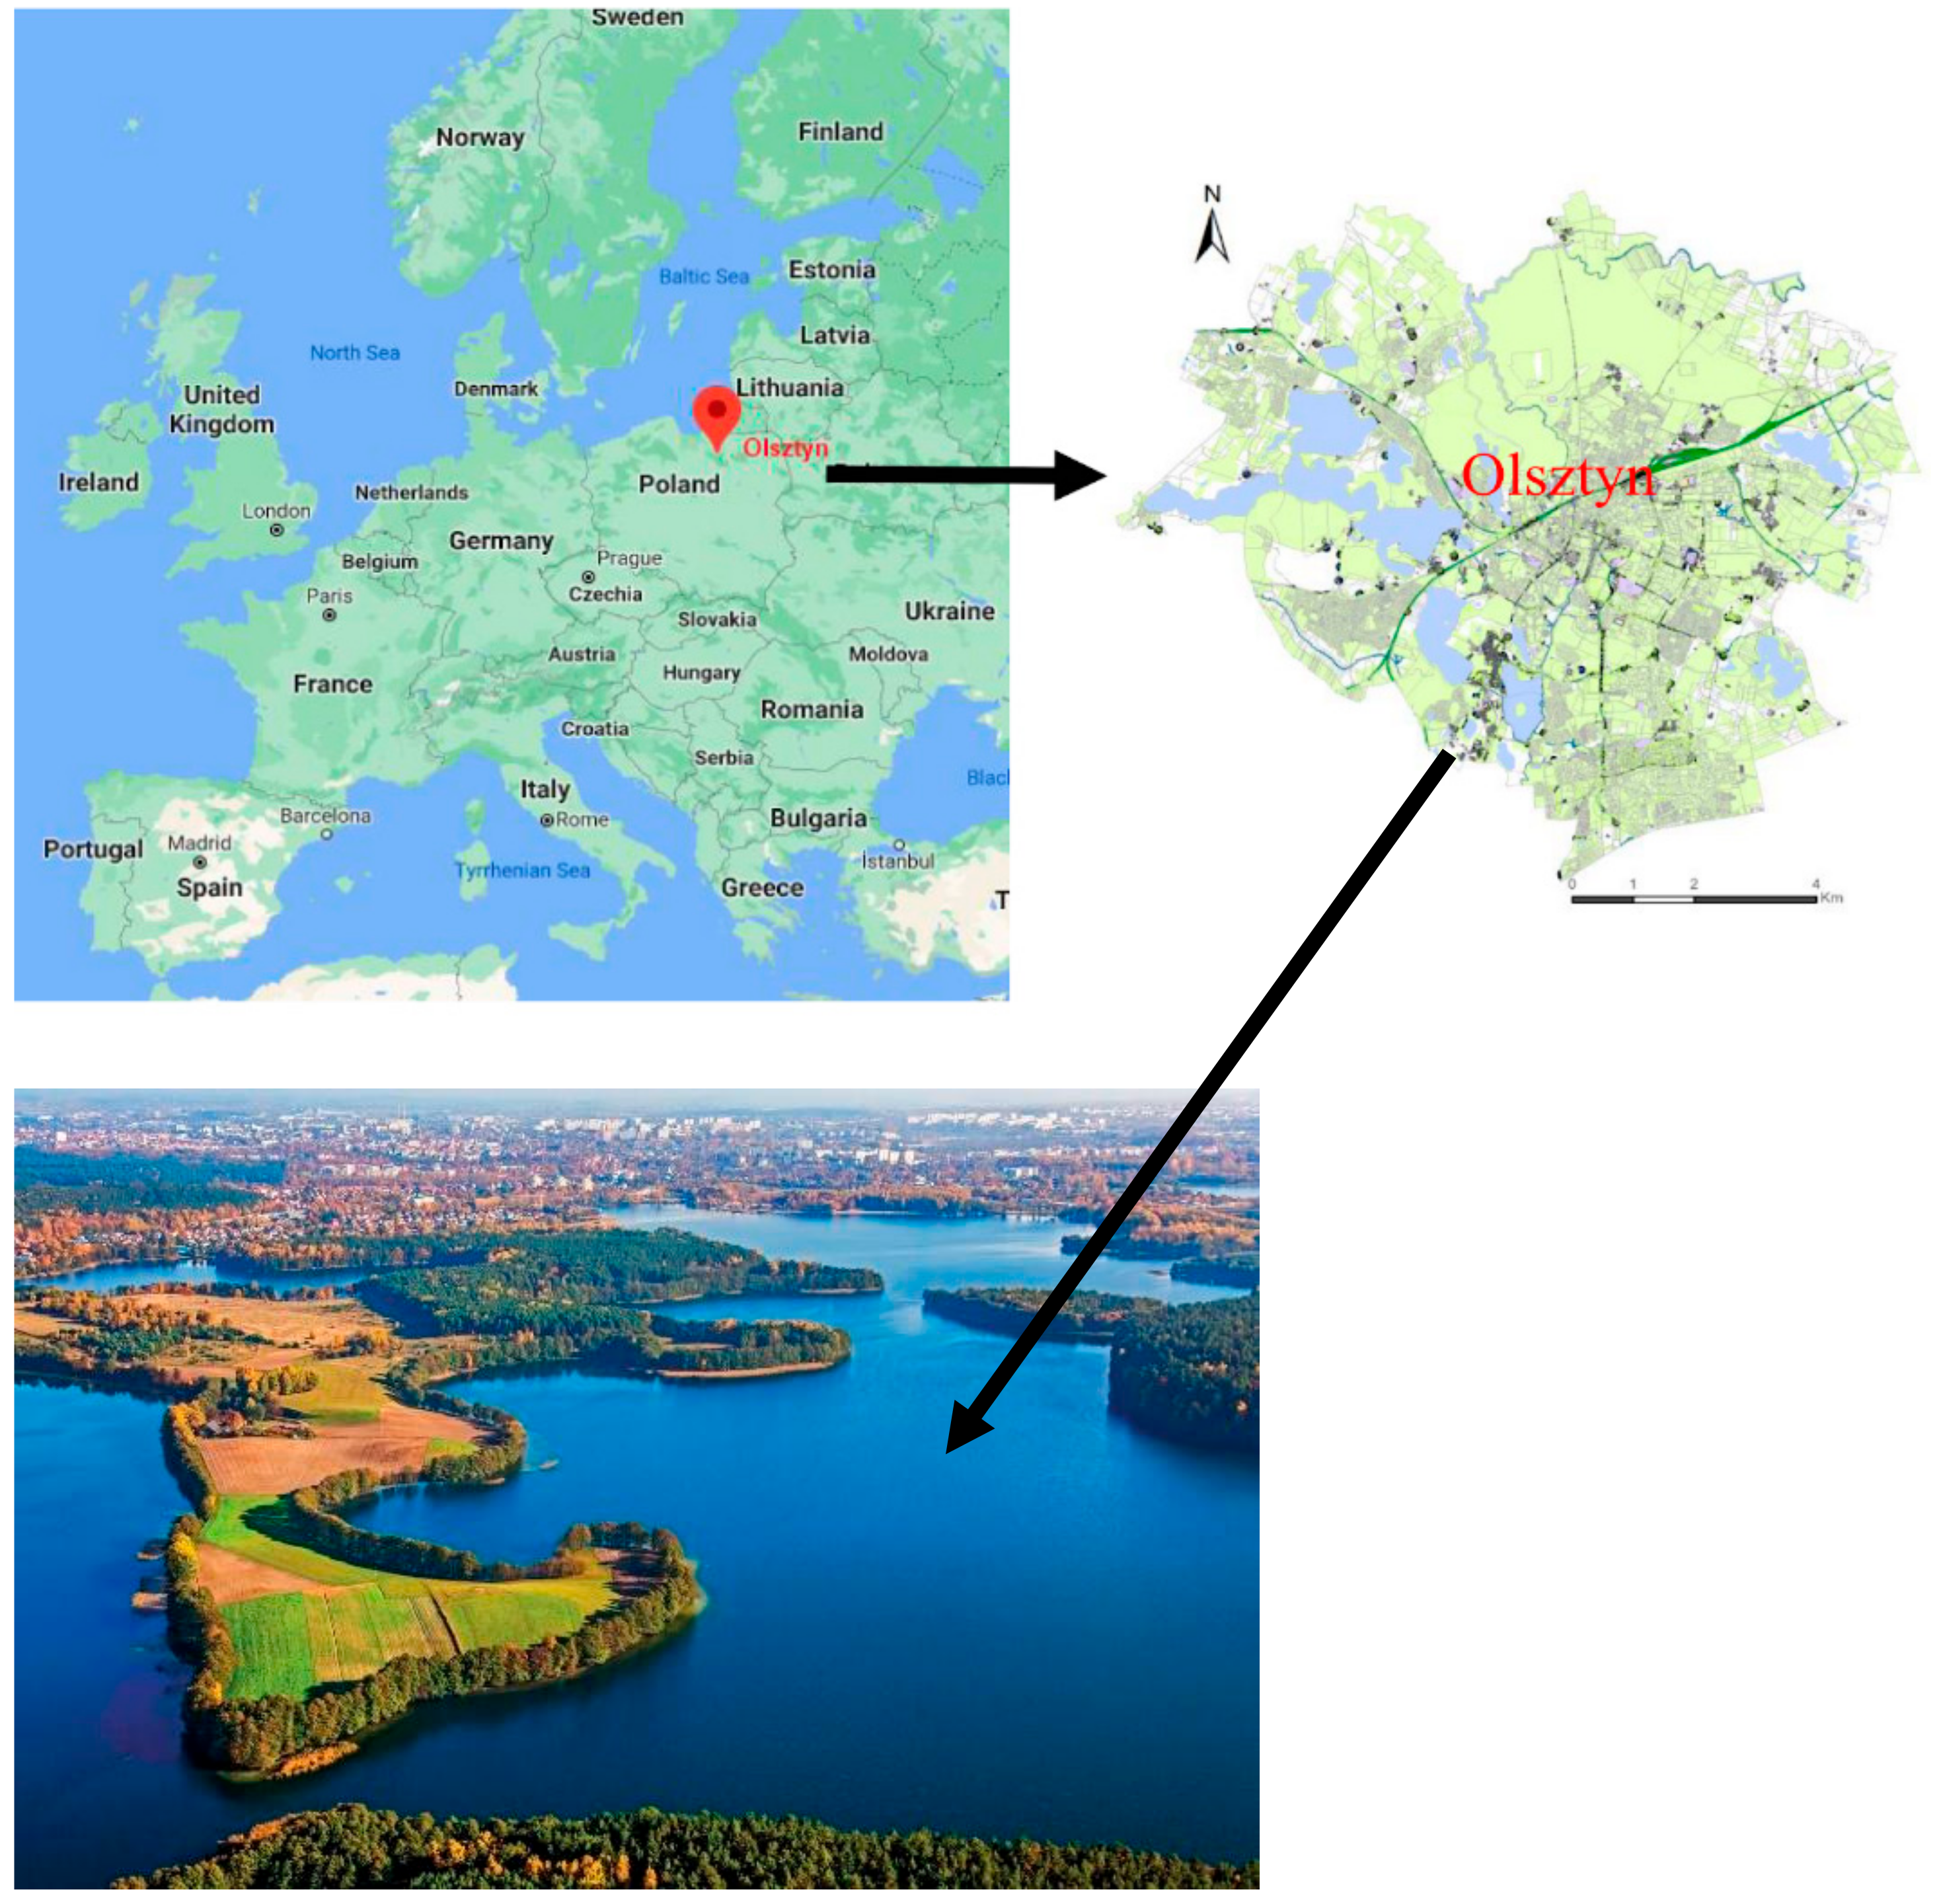
2.2. Study Area
3. Results
3.1. Definition of Socio-Spatial Conflict between Humans and Wild Boars
- (1)
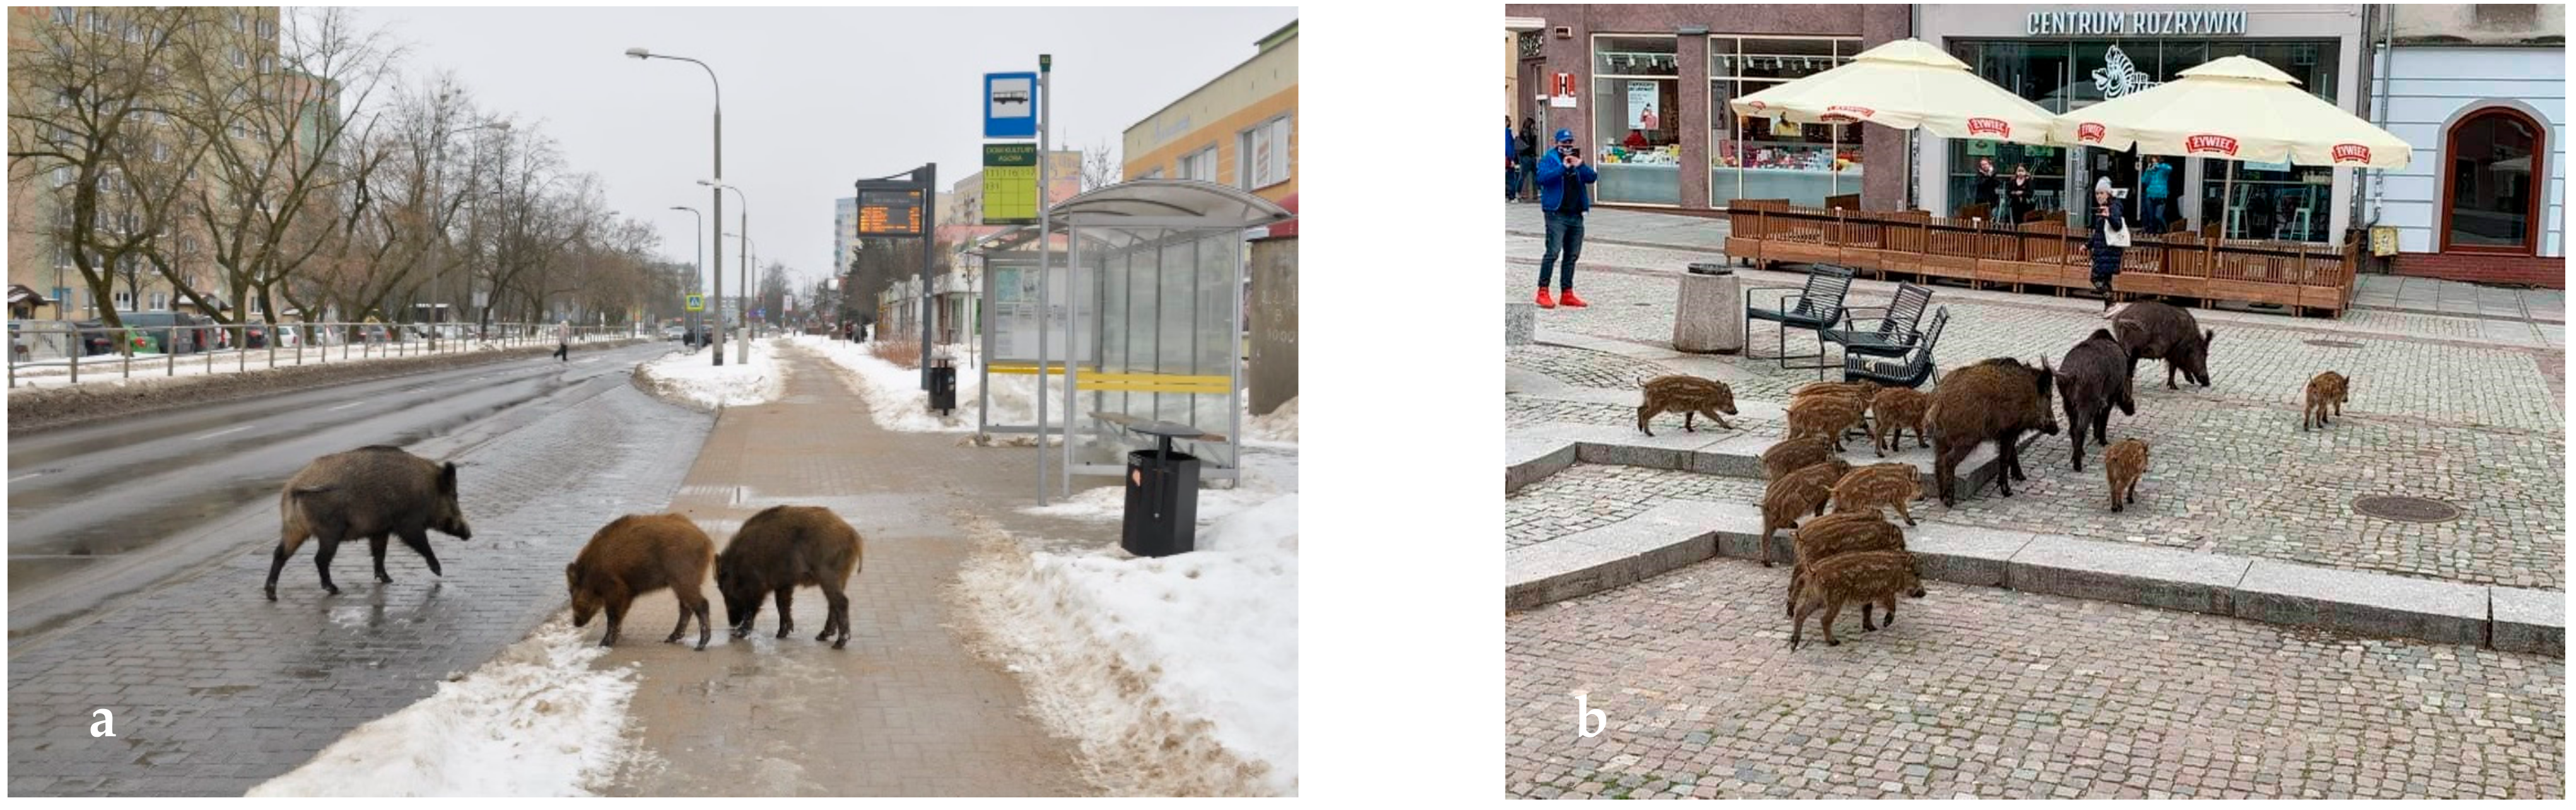
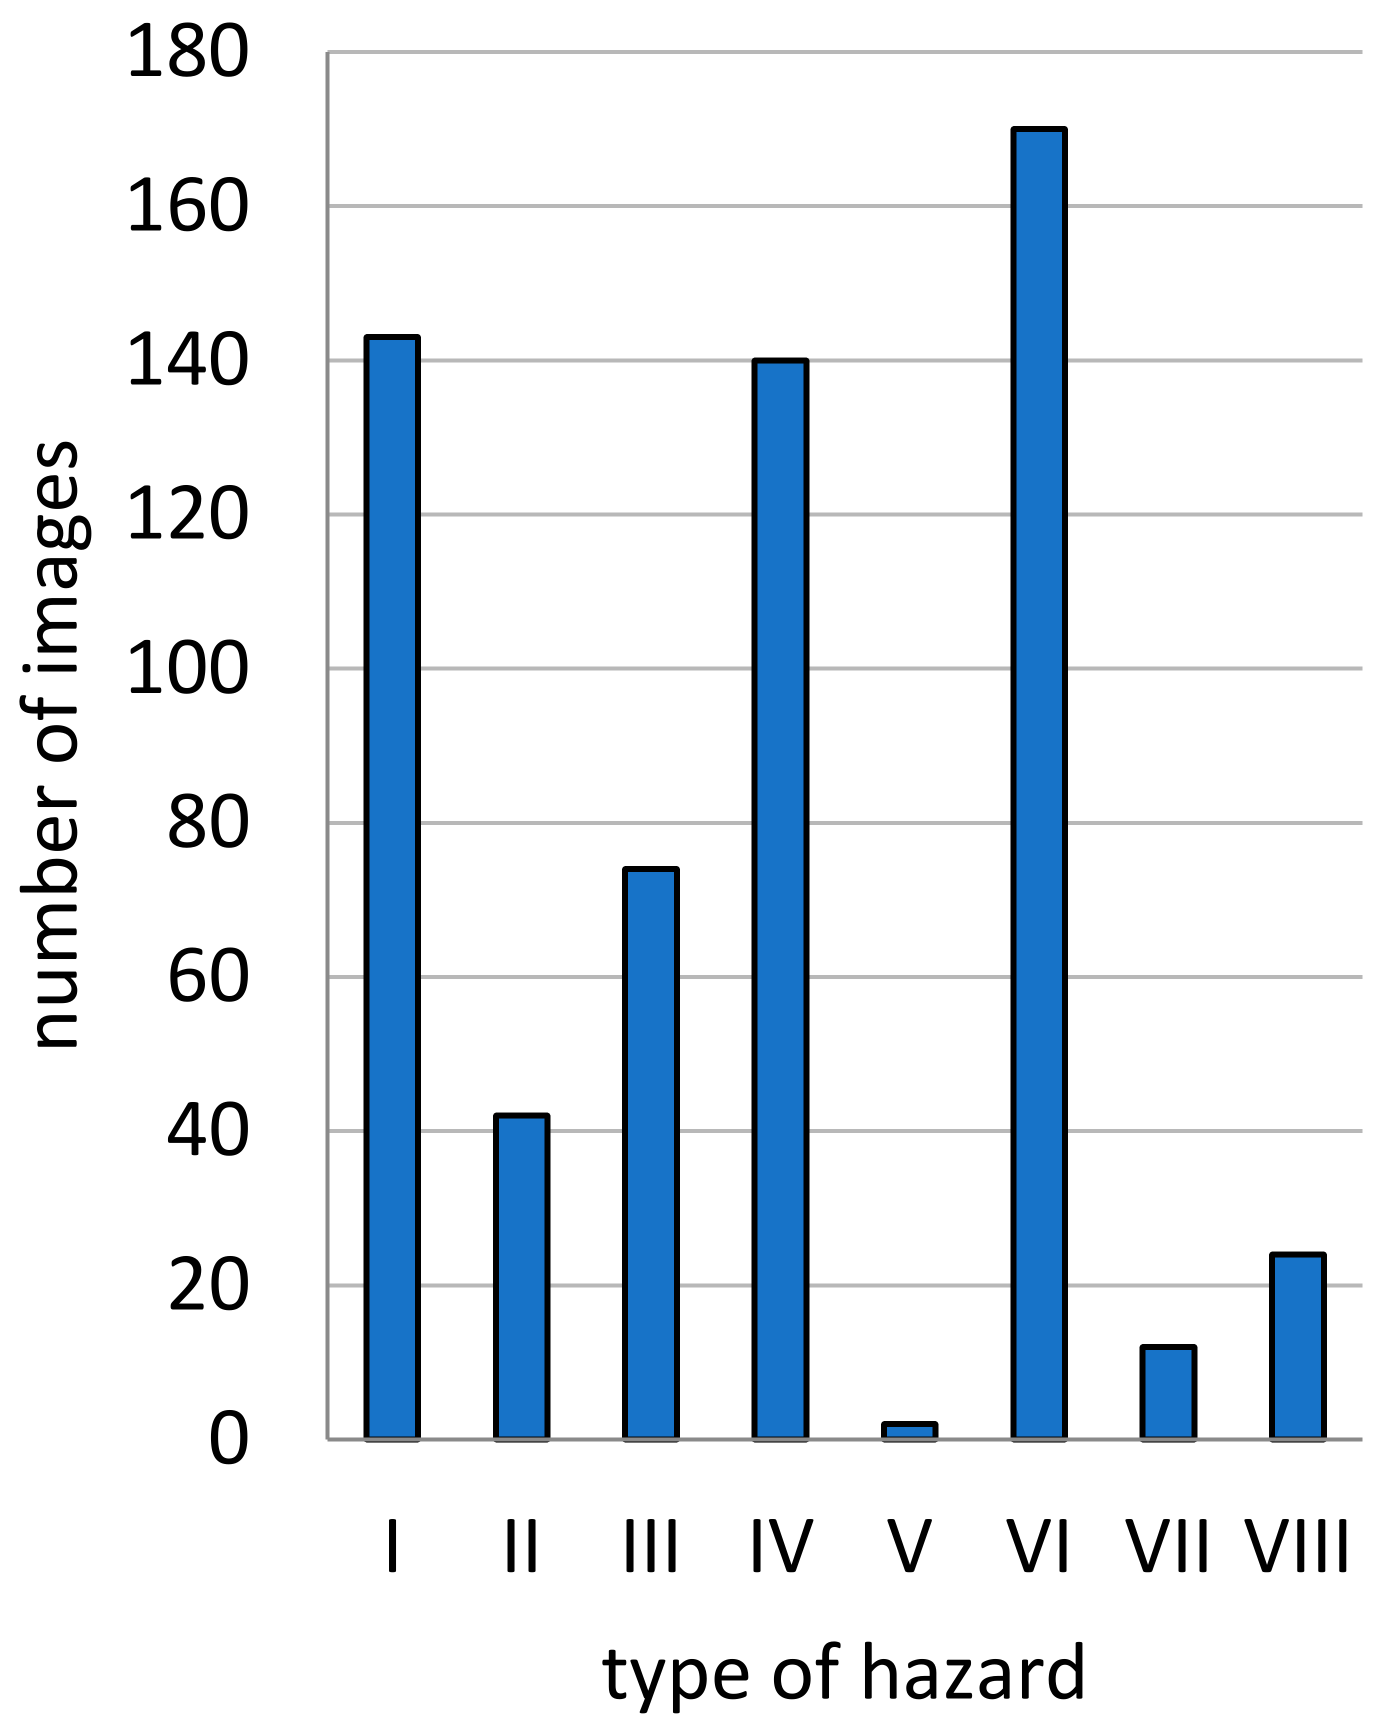
- Damage to property: (I) resulting from foraging behavior (for example, for scarab beetles) which causes damage to lawns, flower beds, gardens, and parks; (II) resulting from nesting behavior which causes damage to lawns, flower beds, and shrubs; (III) public sanitation hazard (wild boars forage for food by overturning garbage cans and leaving garbage strewn over pavements and streets);
- (2)
- Safety risk (health risk): (IV) wild boars cross public roads and forage on road lanes; (V) wild boars cause traffic accidents; (VI) wild boars attack humans;
- (3)
- Psychological risks (fear and anxiety) associated with: (VII) presence of wild boars near adults; (VIII) presence of wild boars near children and safe child zones such as playgrounds; (IX) fighting between male wild boars, copulation, sows protecting their offspring (risk of attack on humans);
- (4)
- Secondary risks: (X) transmission of parasites and disease.
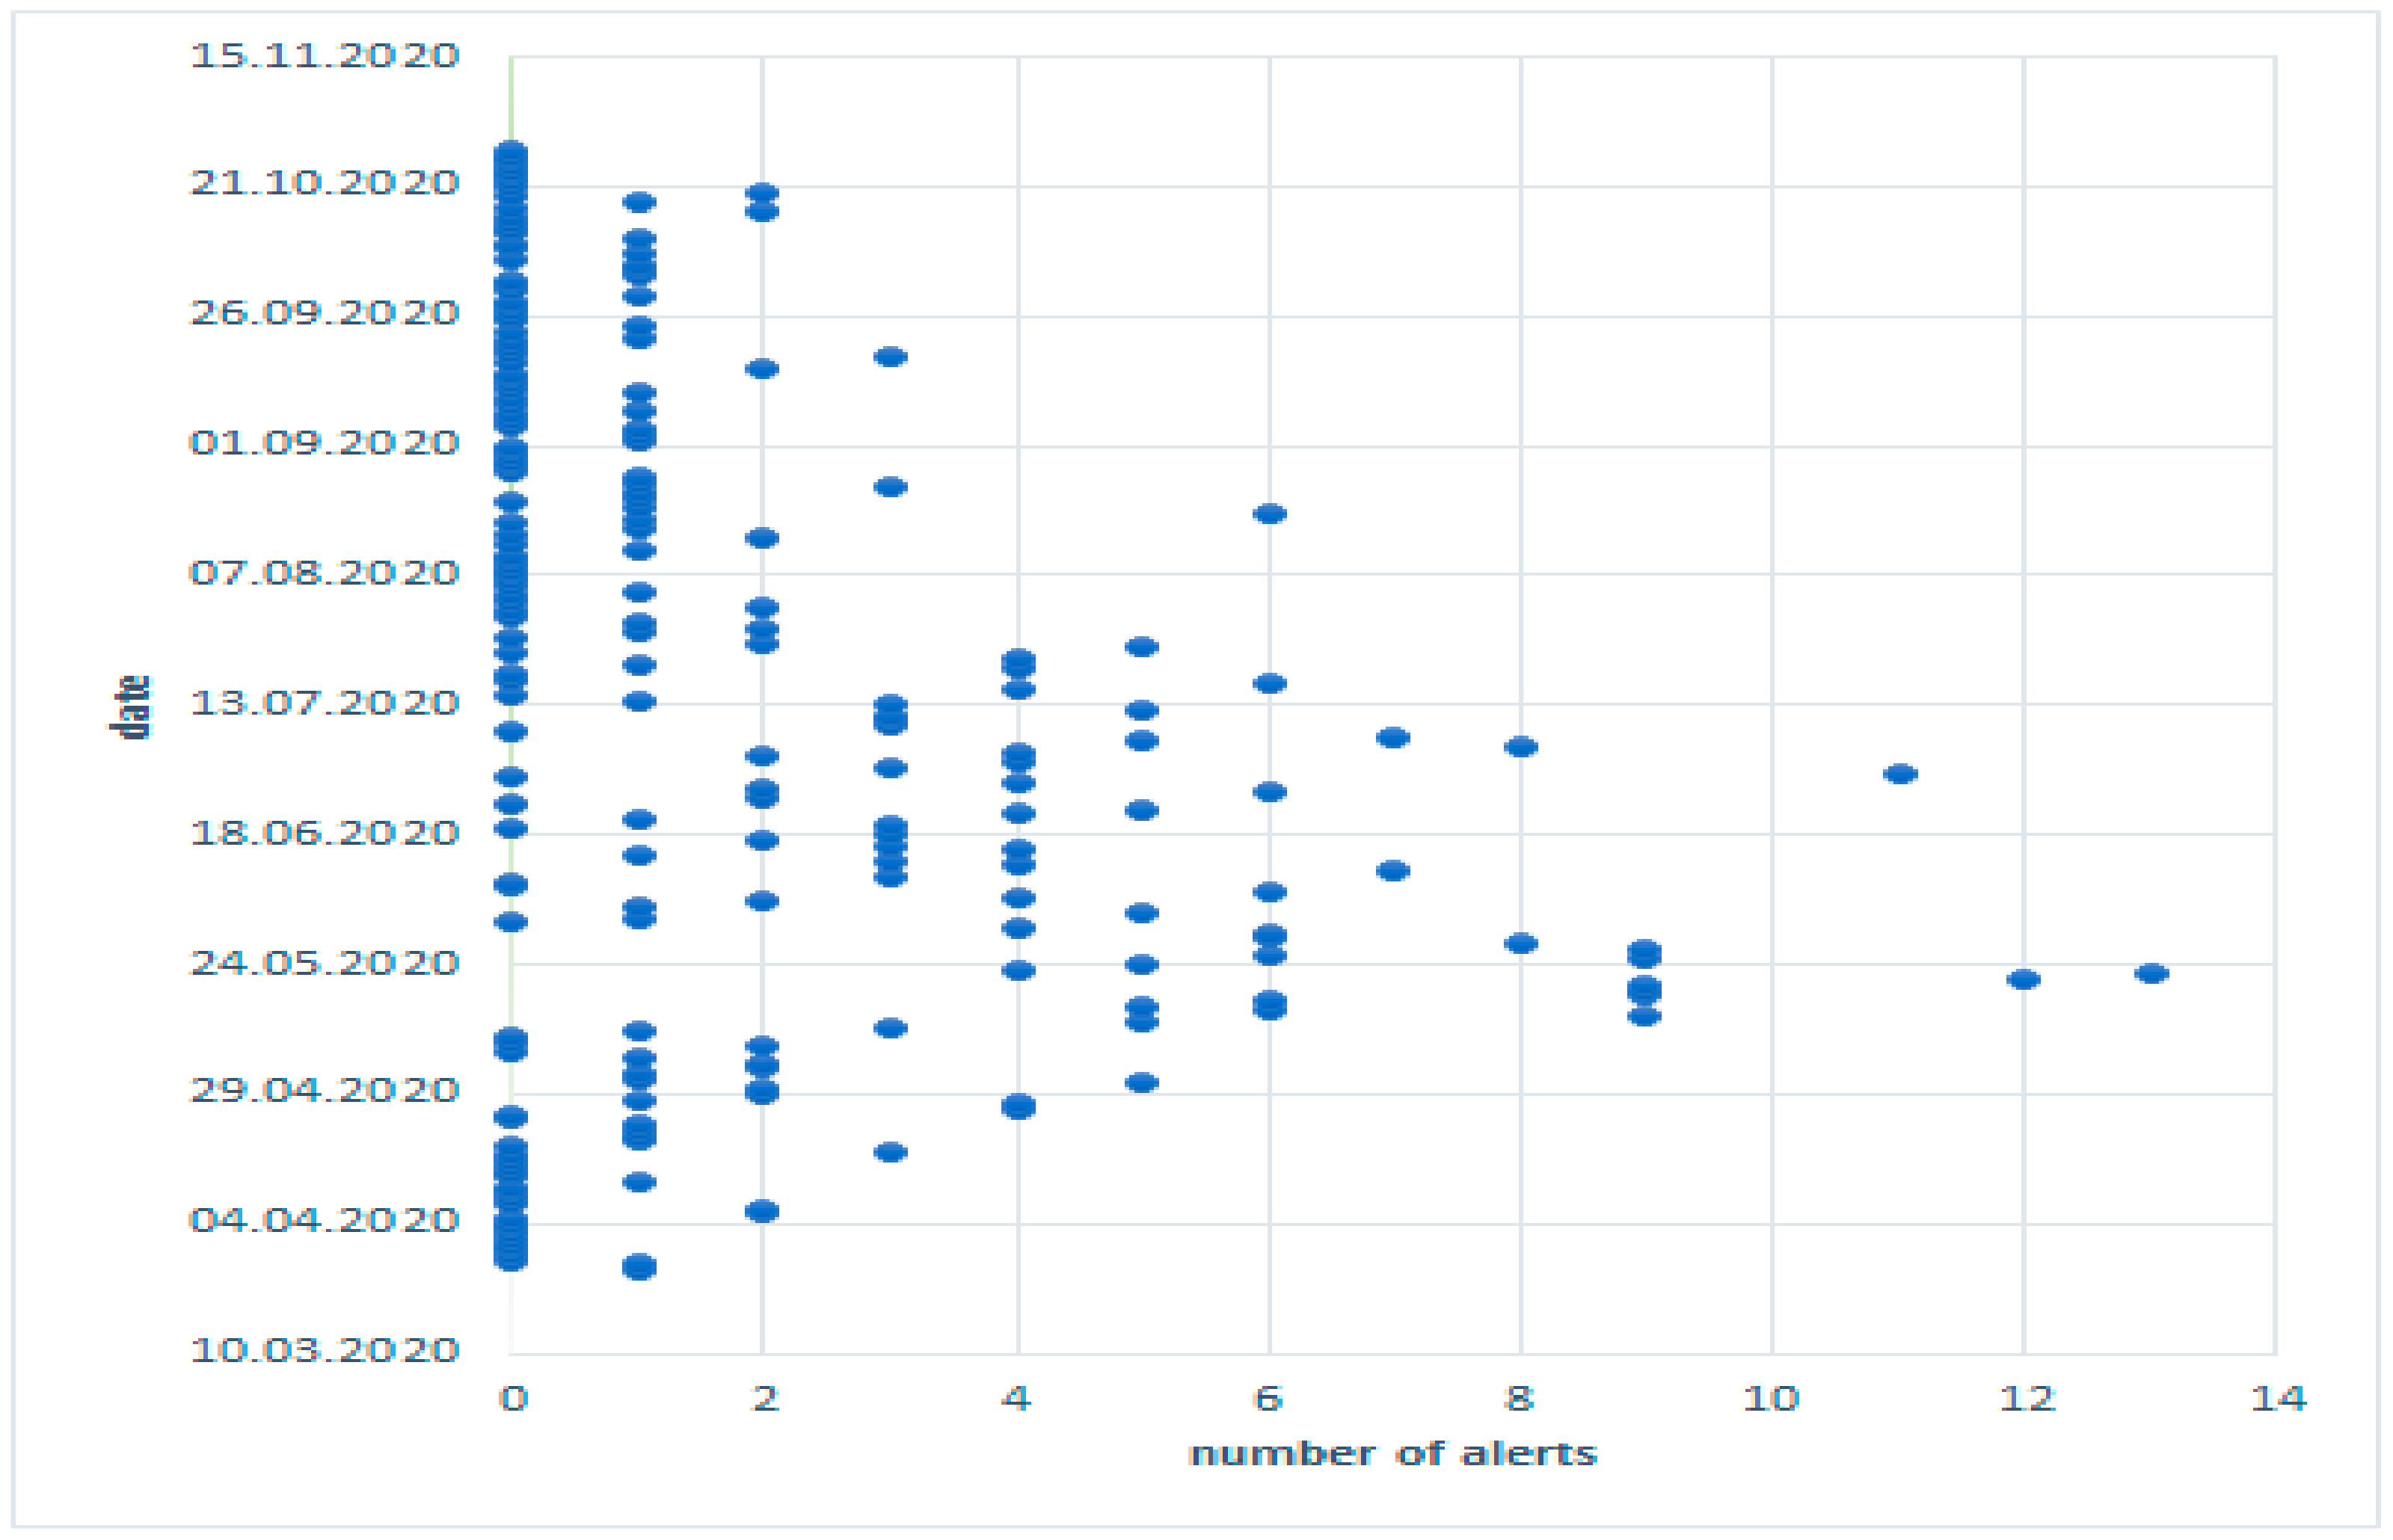
3.2. Analysis of Crowdsourced Data from Social Media
3.3. Interpretation of Crowsourcing Data
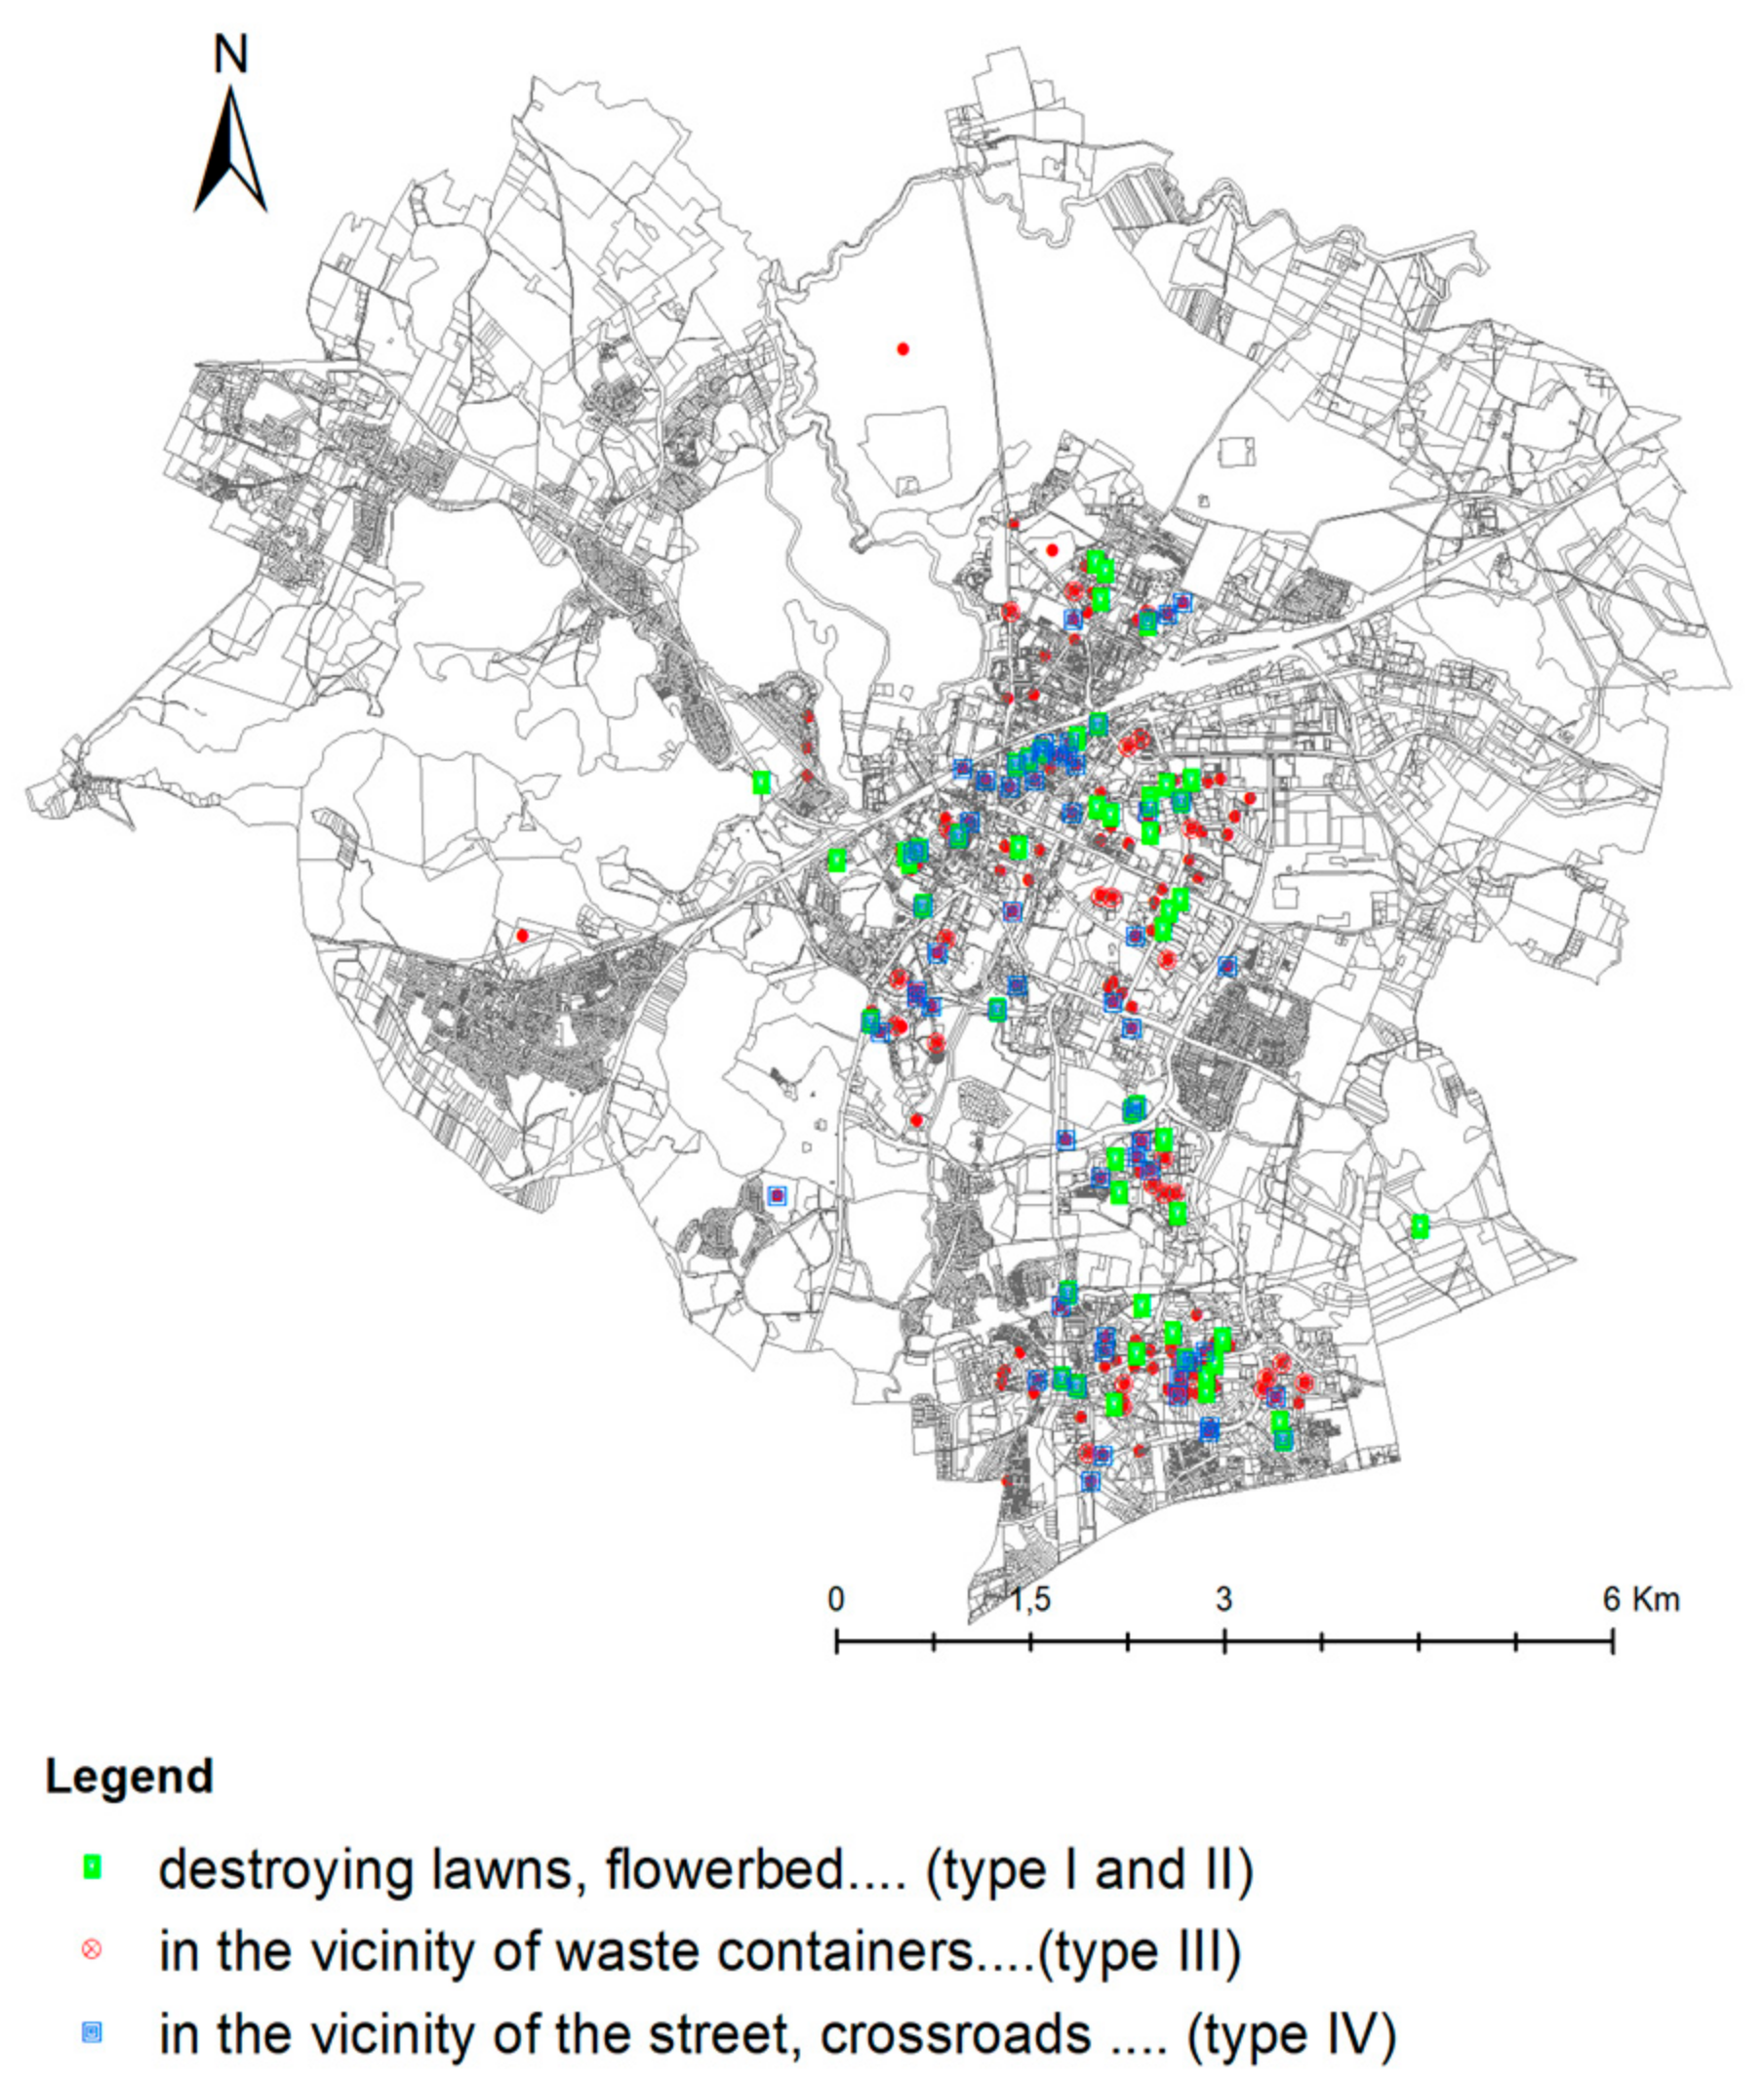
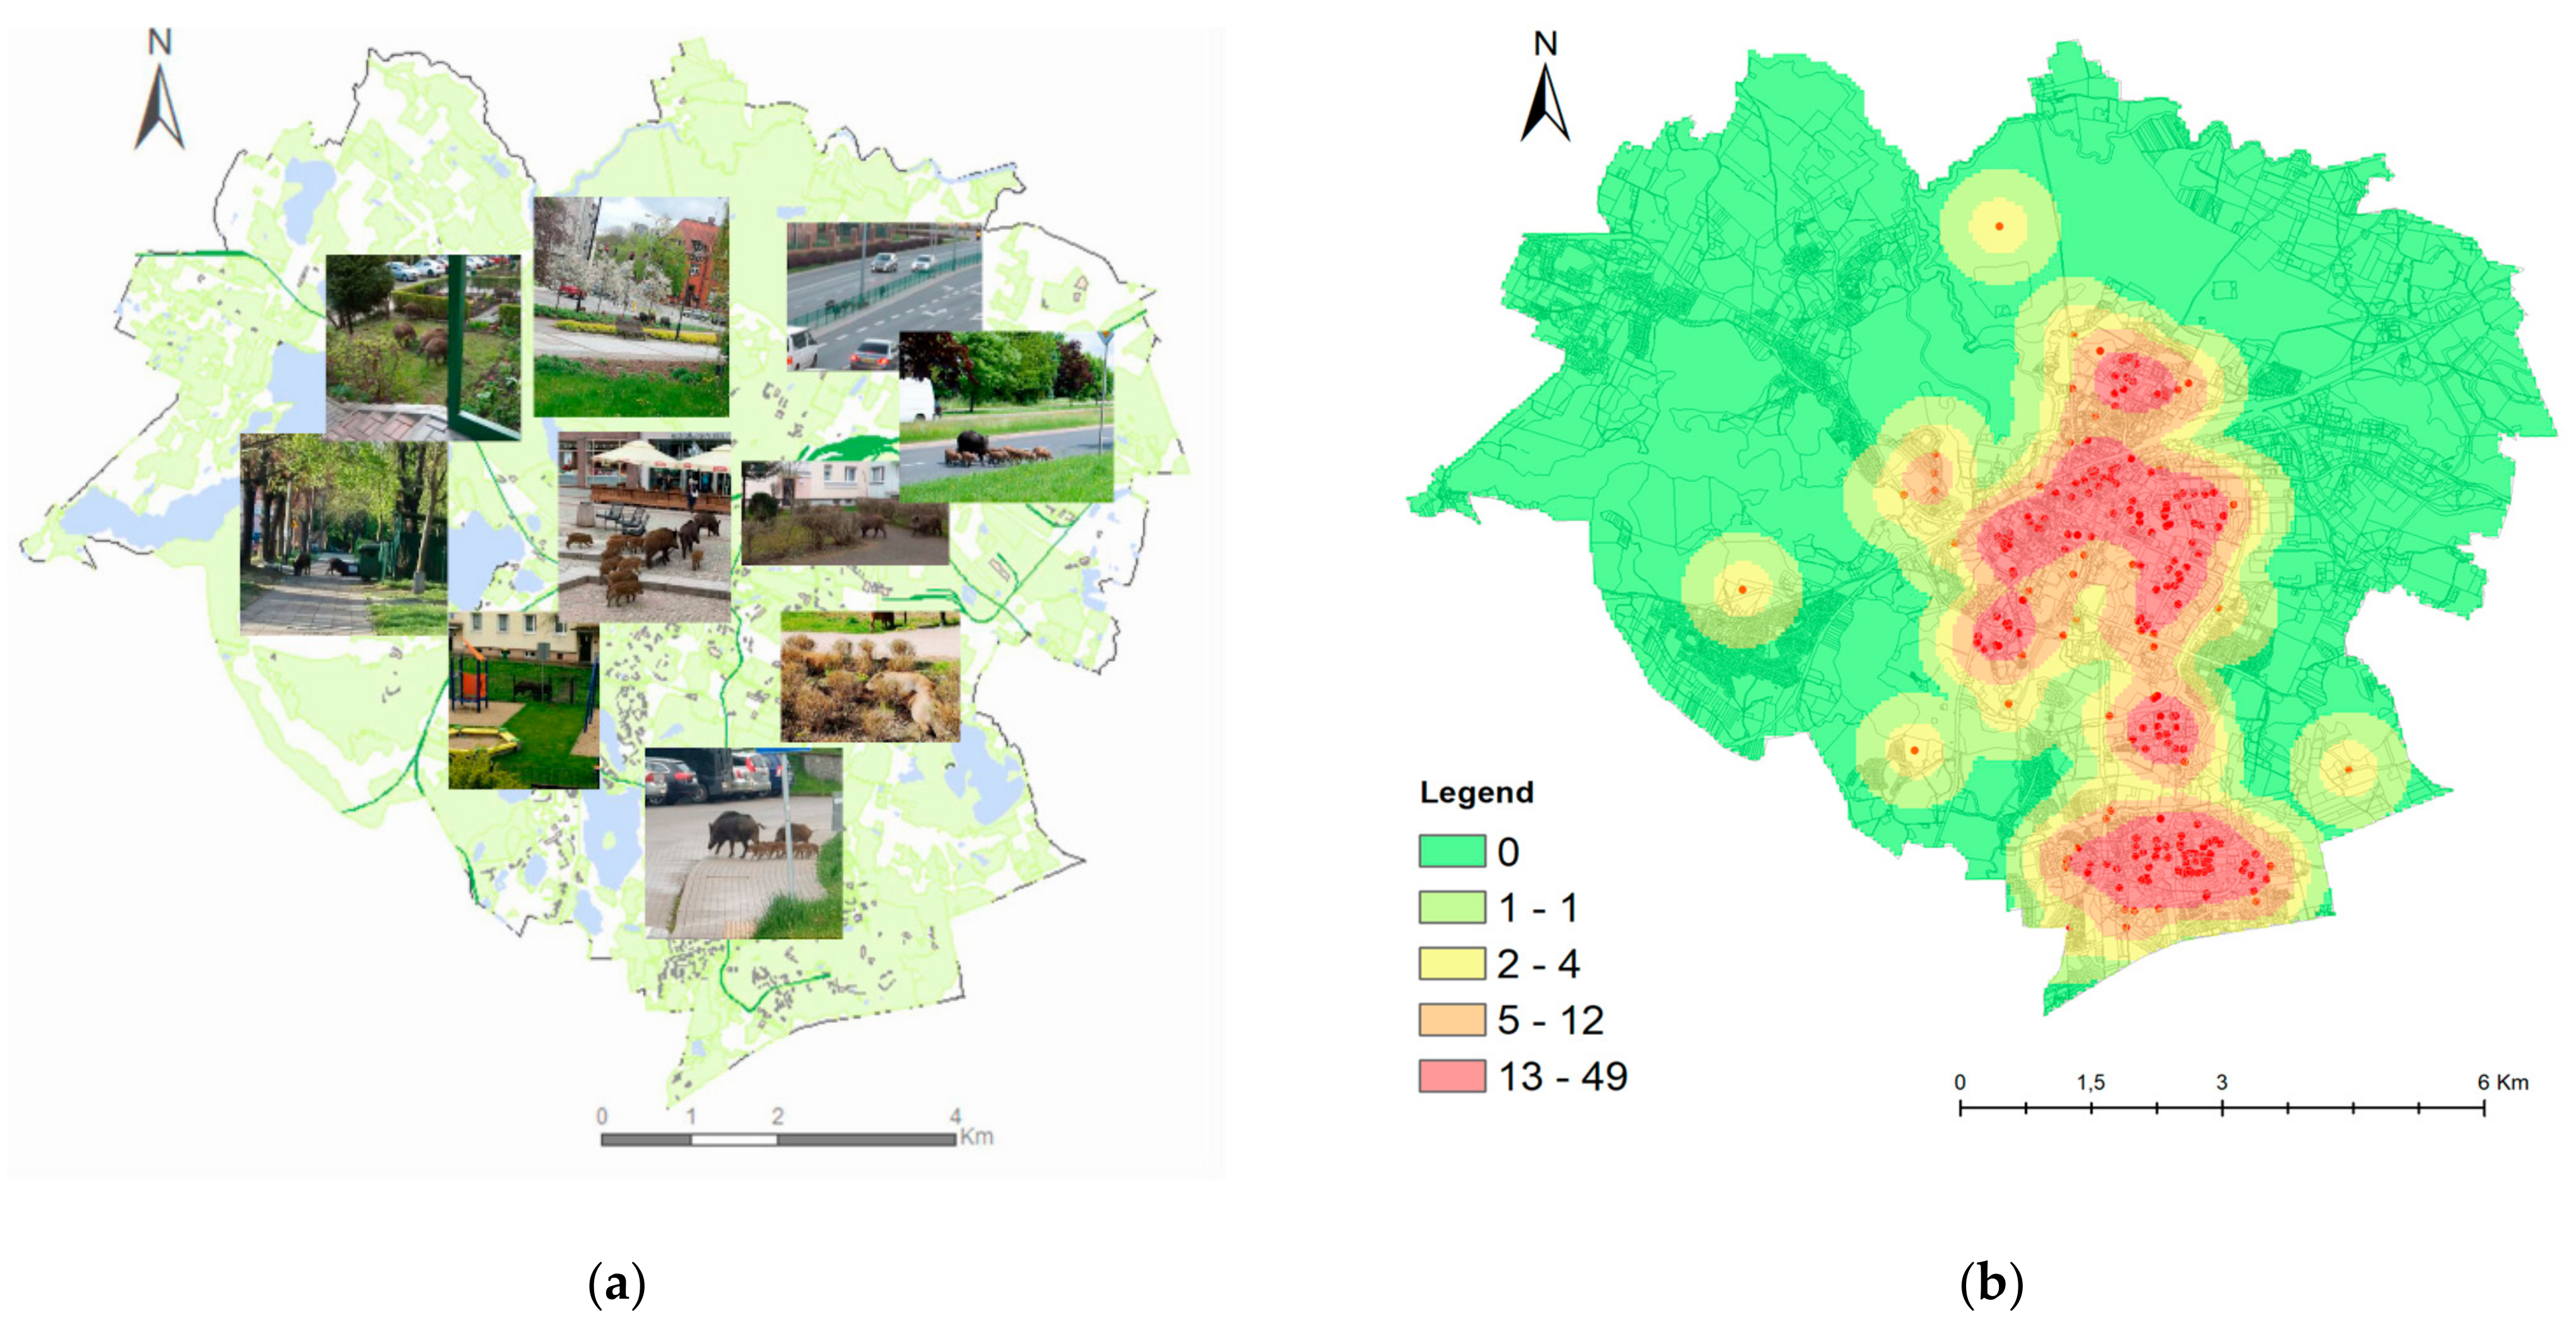
3.3.1. Localization of Wild Boar Incidents in the City of Olsztyn
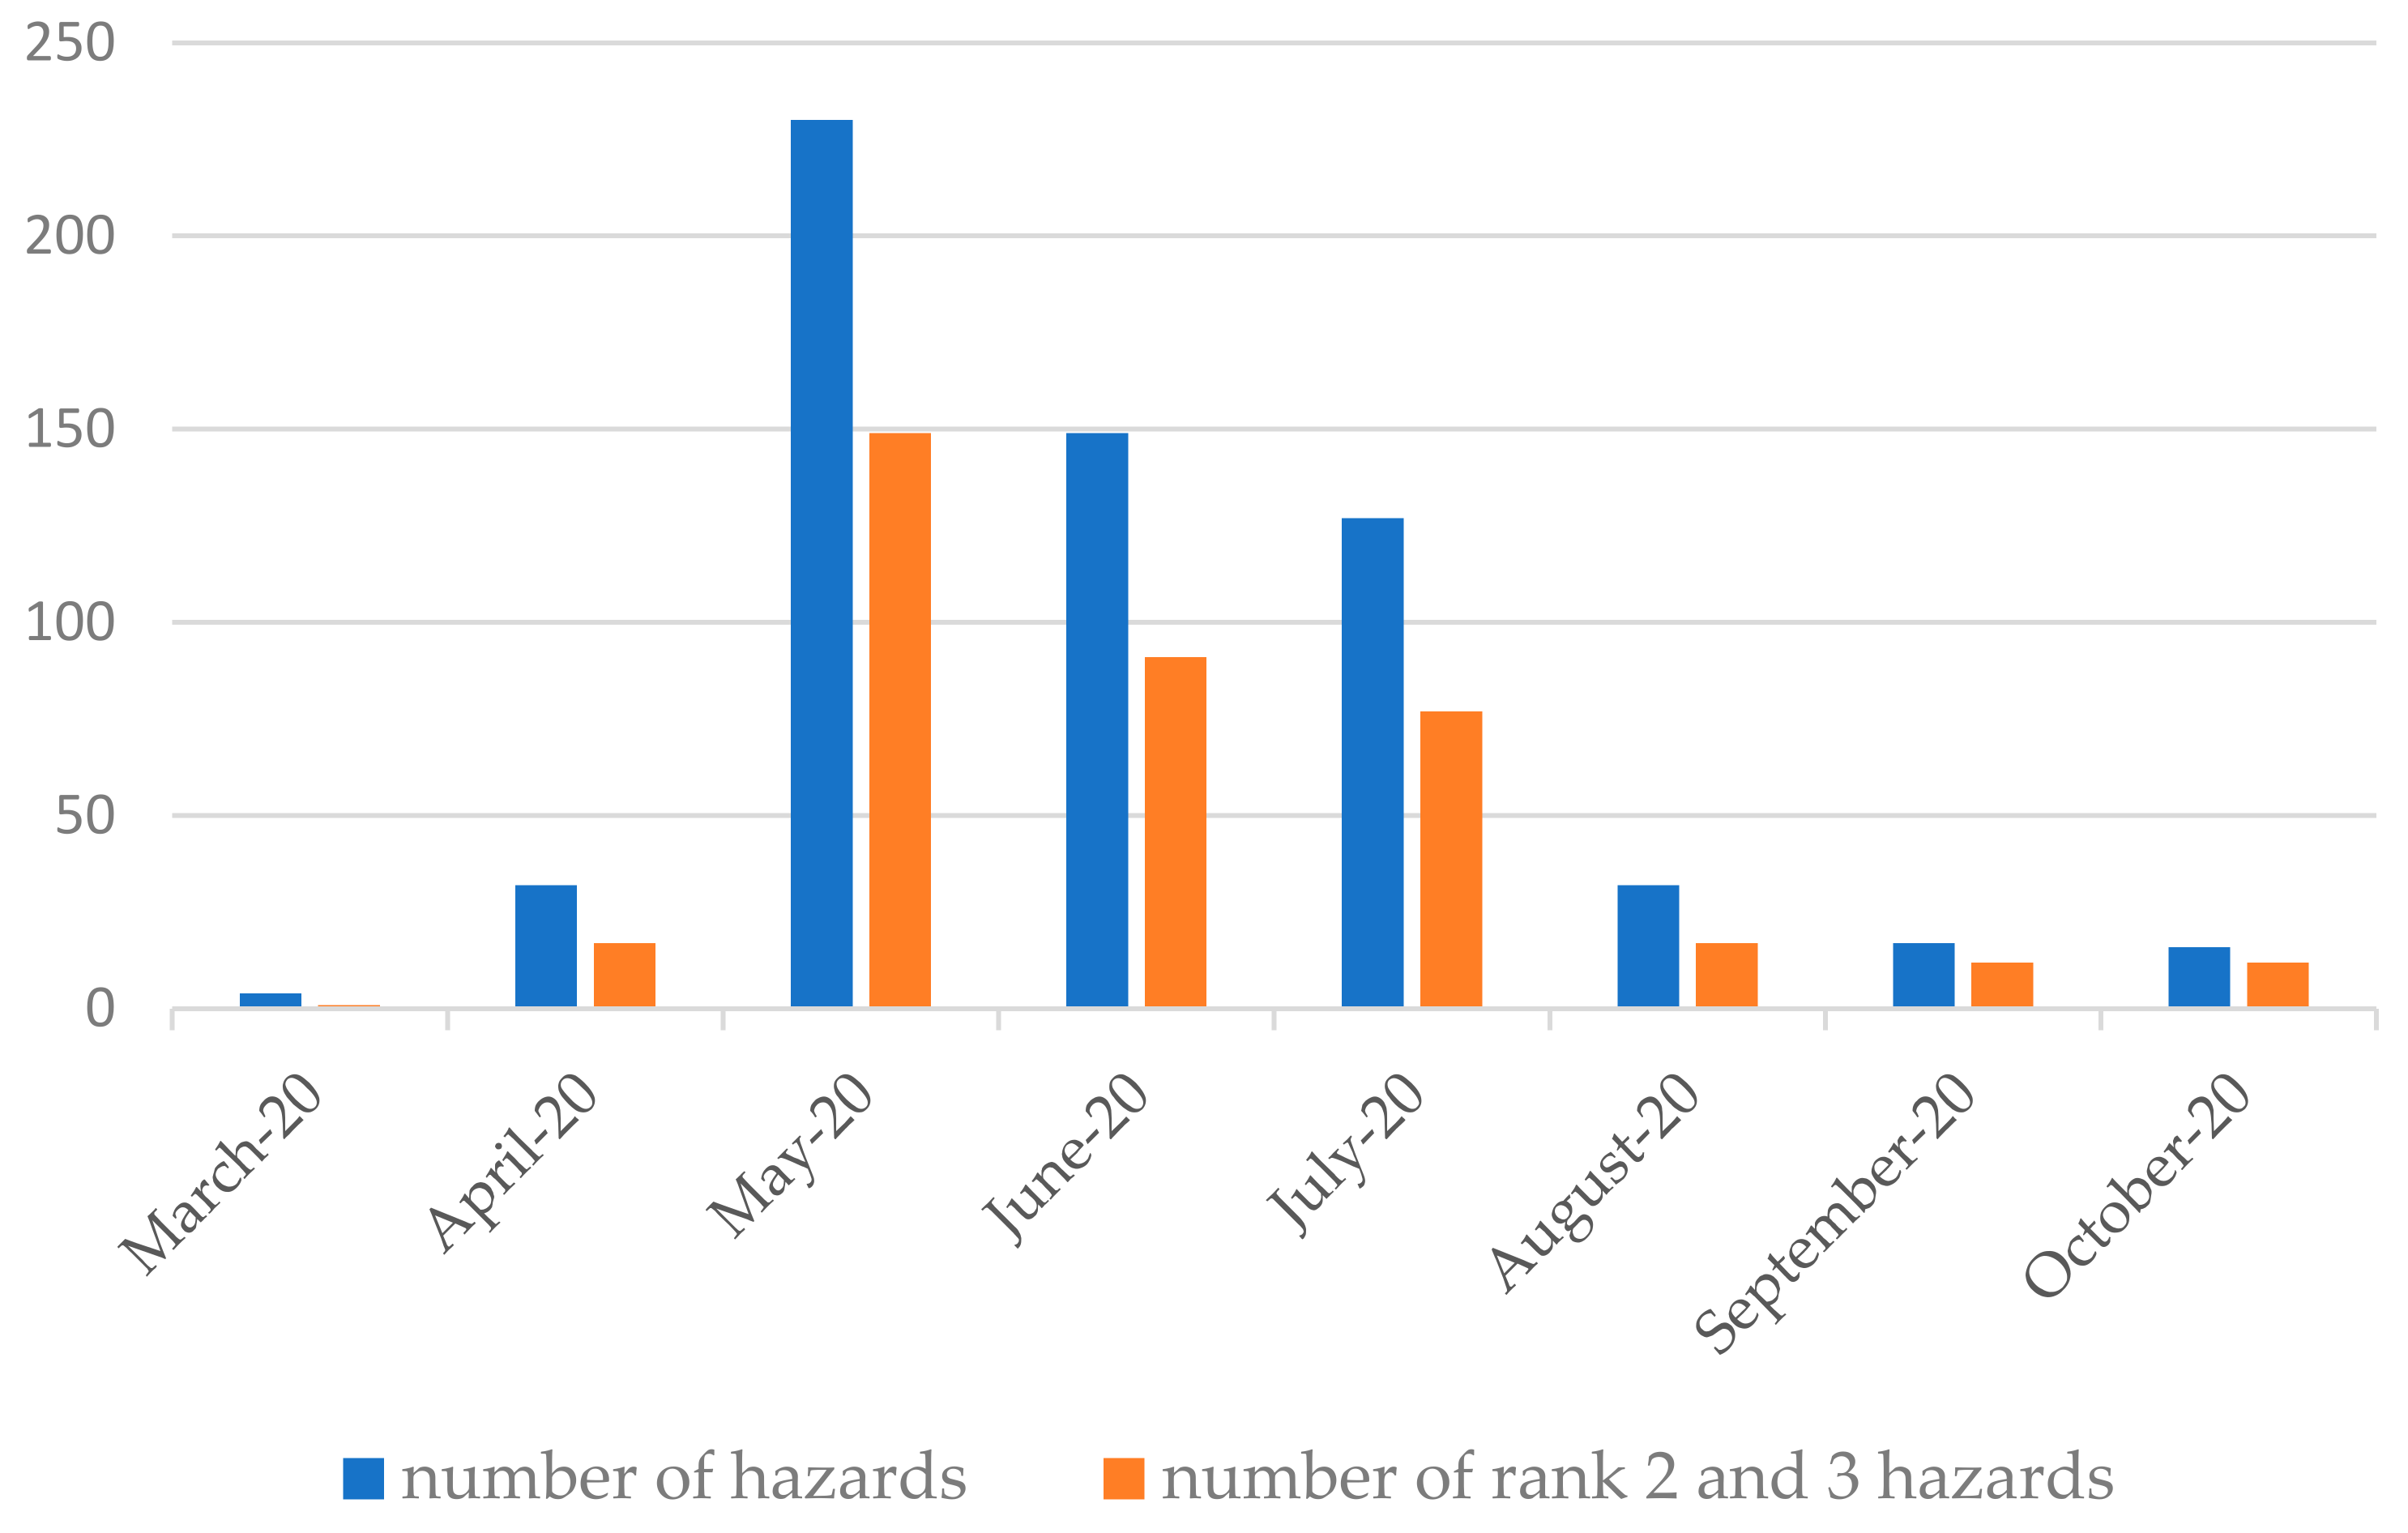
3.3.2. The Scale of Intensity of the Phenomenon of Socio-Spatial Conflict in the City of Olsztyn
3.3.3. Data Validation
4. Discussion
5. Conclusions
Author Contributions
Funding
Institutional Review Board Statement
Informed Consent Statement
Data Availability Statement
Conflicts of Interest
References
- Plumer, L.; Davison, J.; Saarma, U. Rapid Urbanization of Red Foxes in Estonia: Distribution, Behaviour, Attacks on Domestic Animals, and Health-Risks Related to Zoonotic Diseases. PLoS ONE 2014, 9, e115124. [Google Scholar] [CrossRef] [PubMed] [Green Version]
- Kauhala, K.; Talvitie, K.; Vuorisalo, T. Encounters between medium-sized carnivores and humans in the city of Turku, SW Finland, with special reference to the red fox. Mammal. Res. 2016, 61, 25–33. [Google Scholar] [CrossRef]
- Stillfried, M.; Fickel, J.; Börner, K.; Wittstatt, U.; Heddergott, M.; Ortmann, S.; Kramer-Schadt, S.; Frantz, A.C. Do cities represent sources, sinks or isolated islands for urban wild boar population structure? J. Appl. Ecol. 2017, 54, 272–281. [Google Scholar] [CrossRef]
- Keuling, O.; Stier, N.; Roth, M. How does hunting influence activity and spatial usage in wild boar Sus scrofa L.? Eur. J. Wildl. Res. 2008, 54, 729–737. [Google Scholar] [CrossRef]
- Morelle, K.; Podgorski, T.; Prevot, C.; Keuling, O.; Lehaire, F.; Lejeune, P. Towards understanding wild boar Sus scrofa movement: A synthetic movement ecology approach. Mammal. Rev. 2015, 45, 15–29. [Google Scholar] [CrossRef]
- Cahill, S.; Llimona, F.; Cabaneros, L.; Calomardo, F. Characteristics of wild boar (Sus scrofa) habituation to urban areas in the Collserola Natural Park (Barcelona) and comparison with other locations. Anim. Biodivers Conserv. 2012, 35, 221–233. [Google Scholar] [CrossRef]
- Podgorski, T.; Bas, G.; Jedrzejewska, B.; Sonnichsen, L.; Sniezko, S.; Jedrzejewski, W.; Okarma, H. Spatiotemporal behavioral plasticity of wild boar (Sus scrofa) under contrasting conditions of human pressure: Primeval forest and metropolitan area. J. Mammal. 2013, 94, 109–119. [Google Scholar] [CrossRef] [Green Version]
- Soulsbury, C.D.; White, P.C.L. Human-wildlife interactions in urban areas: A review of conflicts, benefits and opportunities. Wildl. Res. 2015, 42, 541–553. [Google Scholar] [CrossRef] [Green Version]
- Dudek, K.; Jerzak, L.; Tryjanowski, P. Zwierzęta Konfliktowe w Miastach; Regionalna Dyrekcja Ochrony Środowiska: Szczecin, Poland, 2016. [Google Scholar]
- Waldron, A.; Mooers, A.O.; Miller, D.C.; Nibbelink, N.; Redding, D.; Kuhn, T.S.; Roberts, J.T.; Gittleman, J.L. Targeting global conservation funding to limit immediate biodiversity declines. Proc. Natl. Acad. Sci. USA 2013, 110, 12144–12148. [Google Scholar] [CrossRef] [PubMed] [Green Version]
- Toivonen, T.; Heikinheimo, V.; Fink, C.; Hausmann, A.; Hiippala, T.; Jarv, O.; Tenkanen, H.; Di Minin, E. Social media data for conservation science: A methodological overview. Biol. Conserv. 2019, 233, 298–315. [Google Scholar] [CrossRef]
- Dudzińska, M.; Kocur-Bera, K. Information on the environment and its protection in real property management. Real Estate Manag. Valuat. 2014, 22, 93–103. [Google Scholar] [CrossRef] [Green Version]
- Di Minin, E.; Tenkanen, H.; Toivonen, T. Prospects and challenges for social media data in conservation science. Front. Environ. Sci. 2015, 3, 63. [Google Scholar] [CrossRef] [Green Version]
- Koen, E.L.; Newton, E.J. Outreach increases detections of an invasive species in a crowdsourced monitoring program. Biol. Invasions 2021, 23, 1–10. [Google Scholar] [CrossRef]
- See, L.; Mooney, P.; Foody, G.; Bastin, L.; Comber, A.; Estima, J.; Fritz, S.; Kerle, N.; Jiang, B.; Laakso, M. Crowdsourcing, citizen science or volunteered geographic information? The current state of crowdsourced geographic information. ISPRS Int. J. Geo-Inf. 2016, 5, 55. [Google Scholar] [CrossRef]
- Heikinheimo, V.; Di Minin, E.; Tenkanen, H.; Hausmann, A.; Erkkonen, J.; Toivonen, T. User-Generated Geographic Information for Visitor Monitoring in a National Park: A Comparison of Social Media Data and Visitor Survey. Isprs Int. J. Geo-Inf. 2017, 6, 85. [Google Scholar] [CrossRef] [Green Version]
- Piperagkas, G.; Angarita, R.; Issarny, V. Social Participation Network: Linking Things, Services and People to Support Participatory Processes. In Proceedings of the Advanced Information Systems Engineering Workshops, Tallinn, Estonia, 11–15 June 2018; Springer: Berlin/Heidelberg, Germany, 2020; p. 109. [Google Scholar]
- Richards, D.R.; Friess, D.A. A rapid indicator of cultural ecosystem service usage at a fine spatial scale: Content analysis of social media photographs. Ecol. Indic. 2015, 53, 187–195. [Google Scholar] [CrossRef]
- Hausmann, A.; Toivonen, T.; Slotow, R.; Tenkanen, H.; Moilanen, A.; Heikinheimo, V.; Di Minin, E. Social Media Data Can Be Used to Understand Tourists' Preferences for Nature-Based Experiences in Protected Areas. Conserv. Lett. 2018, 11, e12343. [Google Scholar] [CrossRef] [Green Version]
- Lunstrum, E. Feed them to the lions: Conservation violence goes online. Geoforum 2017, 79, 134–143. [Google Scholar] [CrossRef]
- Macdonald, D.W.; Jacobsen, K.S.; Burnham, D.; Johnson, P.J.; Loveridge, A.J. Cecil: A Moment or a Movement? Analysis of Media Coverage of the Death of a Lion, Panthera leo. Animals 2016, 6, 26. [Google Scholar] [CrossRef] [PubMed]
- Di Minin, E.; Fink, C.; Tenkanen, H.; Hiippala, T. Machine learning for tracking illegal wildlife trade on social media. Nat. Ecol. Evol. 2018, 2, 406–407. [Google Scholar] [CrossRef]
- Mauri, L.; Masin, R.; Tarolli, P. Wildlife impact on cultivated lands: A multi-temporal spatial analysis. Agric. Syst. 2020, 184, 102890. [Google Scholar] [CrossRef]
- Hooten, M.B.; Johnson, D.S. Basis function models for animal movement. J. Am. Stat. Assoc. 2017, 112, 578–589. [Google Scholar] [CrossRef] [Green Version]
- Torney, C.J.; Morales, J.M.; Husmeier, D. A hierarchical machine learning framework for the analysis of large scale animal movement data. Mov. Ecol. 2021, 9, 1–11. [Google Scholar] [CrossRef] [PubMed]
- Reynolds, A.M. Scale-free animal movement patterns: Lévy walks outperform fractional Brownian motions and fractional Lévy motions in random search scenarios. J. Phys. A: Math. Theor. 2009, 42, 434006. [Google Scholar] [CrossRef]
- Bearup, D.; Benefer, C.M.; Petrovskii, S.V.; Blackshaw, R.P. Revisiting Brownian motion as a description of animal movement: A comparison to experimental movement data. Methods Ecol. Evol. 2016, 7, 1525–1537. [Google Scholar] [CrossRef] [Green Version]
- Comer, C.E.; Mayer, J.J. Wild Pig Reproductive Biology. In Wild Pigs: Biology, Damage, Control Techniques, and Management; SRNL-RP-2009-00869; Mayer, J.J., Brisbin, I.L., Jr., Eds.; Savannah River National Laboratory: Aiken, SC, USA, 2009; pp. 51–75. [Google Scholar]
- Ikeda, T.; Kuninaga, N.; Suzuki, T.; Ikushima, S.; Suzuki, M. Tourist-wild boar (Sus scrofa) interactions in urban wildlife management. Glob. Ecol. Conserv. 2019, 18, e00617. [Google Scholar] [CrossRef]
- Cieslak, I. Identification of areas exposed to land use conflict with the use of multiple-criteria decision-making methods. Land Use Policy 2019, 89, 104225. [Google Scholar] [CrossRef]
- Popczyk, B. Zarządzanie Populacją Dzika Sus Scrofa w Polsce; Zarządzanie Populacjami Zwierząt: Warszawa, Poland, 2016; pp. 29–45. [Google Scholar]
- Kirilenko, A.P.; Molodtsova, T.; Stepchenkova, S.O. People as sensors: Mass media and local temperature influence climate change discussion on Twitter. Glob. Environ. Chang. -Hum. Policy Dimens. 2015, 30, 92–100. [Google Scholar] [CrossRef]
- Lopez, B.E.; Magliocca, N.R.; Crooks, A.T. Challenges and Opportunities of Social Media Data for Socio-Environmental Systems Research. Land 2019, 8, 107. [Google Scholar] [CrossRef] [Green Version]
- Walden-Schreiner, C.; Leung, Y.F.; Tateosian, L. Digital footprints: Incorporating crowdsourced geographic information for protected area management. Appl. Geogr. 2018, 90, 44–54. [Google Scholar] [CrossRef]
- Longley, P.A.; Adnan, M.; Lansley, G. The geotemporal demographics of Twitter usage. Environ. Plan. A 2015, 47, 465–484. [Google Scholar] [CrossRef]
- Ruths, D.; Pfeffer, J. Social media for large studies of behavior. Science 2014, 346, 1063–1064. [Google Scholar] [CrossRef]
- Li, L.N.; Goodchild, M.F.; Xu, B. Spatial, temporal, and socioeconomic patterns in the use of Twitter and Flickr. Cartogr. Geogr. Inf. Sci. 2013, 40, 61–77. [Google Scholar] [CrossRef]
- Crawford, K.; Finn, M. The limits of crisis data: Analytical and ethical challenges of using social and mobile data to understand disasters. Geojournal 2015, 80, 491–502. [Google Scholar] [CrossRef]
- Hao, X.; Wu, B.; Morrison, A.M.; Wang, F. Worth thousands of words? Visual content analysis and photo interpretation of an outdoor tourism spectacular performance in Yangshuo-Guilin, China. Anatolia 2016, 27, 201–213. [Google Scholar] [CrossRef]
- Nakaya, T.; Yano, K.J. Visualising Crime Clusters in a Space-time Cube: An Exploratory Data-analysis Approach Using Space-time Kernel Density Estimation and Scan Statistics. Trans. Gis 2010, 14, 223–239. [Google Scholar] [CrossRef]
- Pieniążek, A. Blaski i cienie życia w mieście. Wszechświat 2013, 114, 350–355. [Google Scholar]
- Castells, M. The information age. Media Stud. A Read. 2010, 2, 152. [Google Scholar]
- Boyd, D.; Crawford, K. Critical questions for big data provocations for a cultural, technological, and scholarly phenomenon. Inf. Commun. Soc. 2012, 15, 662–679. [Google Scholar] [CrossRef]
- Stefanidis, A.; Crooks, A.; Radzikowski, J. Harvesting ambient geospatial information from social media feeds. Geojournal 2013, 78, 319–338. [Google Scholar] [CrossRef]
- Yeo, J.H.; Neo, H. Monkey business: Human-animal conflicts in urban Singapore. Soc. Cult. Geogr. 2010, 11, 681–699. [Google Scholar] [CrossRef]
- Anand, S.; Radhakrishna, S. Investigating trends in human-wildlife conflict: Is conflict escalation real or imagined? J. Asia-Pac. Biodivers 2017, 10, 154–161. [Google Scholar] [CrossRef]
- Gamelon, M.; Gaillard, J.M.; Servanty, S.; Gimenez, O.; Toigo, C.; Baubet, E.; Klein, F.; Lebreton, J.D. Making use of harvest information to examine alternative management scenarios: A body weight-structured model for wild boar. J. Appl. Ecol. 2012, 49, 833–841. [Google Scholar] [CrossRef]
- Keuling, O.; Baubet, E.; Duscher, A.; Ebert, C.; Fischer, C.; Monaco, A.; Podgorski, T.; Prevot, C.; Ronnenberg, K.; Sodeikat, G.; et al. Mortality rates of wild boar Sus scrofa L. in central Europe. Eur. J. Wildl. Res. 2013, 59, 805–814. [Google Scholar] [CrossRef]
- Massei, G.; Kindberg, J.; Licoppe, A.; Gacic, D.; Sprem, N.; Kamler, J.; Baubet, E.; Hohmann, U.; Monaco, A.; Ozolins, J.; et al. Wild boar populations up, numbers of hunters down? A review of trends and implications for Europe. Pest Manag. Sci. 2015, 71, 492–500. [Google Scholar] [CrossRef] [PubMed]
- See, L.; Comber, A.; Salk, C.; Fritz, S.; van der Velde, M.; Perger, C.; Schill, C.; McCallum, I.; Kraxner, F.; Obersteiner, M. Comparing the Quality of Crowdsourced Data Contributed by Expert and Non-Experts. PLoS ONE 2013, 8, e69958. [Google Scholar] [CrossRef] [PubMed] [Green Version]
- Dorn, H.; Törnros, T.; Zipf, A. Quality evaluation of VGI using authoritative data—A comparison with land use data in Southern Germany. ISPRS Int. J. Geo-Inf. 2015, 4, 1657–1671. [Google Scholar] [CrossRef]


| No. | Nuisance Category | Nuisance Scale | ||
|---|---|---|---|---|
| Low | Medium | High | ||
| 1. | Location of wild boar incidents in Olsztyn | City periphery, other locations. | City periphery and other locations that have elements of housing estates. | City center, housing estates. |
| 2. | Number of wild boar threats reported monthly in Olsztyn | 1–10 | 11–20 | more than 20 |
| No. | Category of Threat | Type of Threat | Characteristics | Rank |
|---|---|---|---|---|
| 1 | Damage to property | foraging (digging, rooting) (I) | destruction of:
| 1 3 3 |
| nesting (contamination and noise) (II) | destruction of:
| 1 2 3 | ||
| spread of garbage (III) |
| 2 1 | ||
| 2 | Safety risks: | wild boars cross public roads and forage on road lanes (IV) | - | 3 |
| wild boars cause traffic accidents (V); | - | 3 | ||
| wild boars attack humans (Va) | - | 3 | ||
| 3 | Psychological risks | occurrence of wild boars (VI, VII) |
| 2 3 |
| other behaviors, including fighting between males, copulation, sows with offspring (VIII) | - | 3 | ||
| 4 | Secondary risks | transmission of parasites and disease (IX) | - | 2 |
| Nazwa Grupy | Private Group “Dziki w Olsztynie” (“Wild Boars in Olsztyn”) | Website 1 “Olsztyn Kocha Dziki” (“Olsztyn Loves Wild Boars”) | Website 2 “Gdzie są Dziki Olsztyn” (“Where are the Wild Boards Olsztyn”) | Website 3 “Dziki w Olsztynie” (“Wild Boars in Olsztyn”) |
|---|---|---|---|---|
| number of participants | 3357 | 326 | 103 | 214 |
| the date of group establishment | 26 March 2020 | 17 June 2019 | 6 July 2020 | 6 March 2020 |
| the number of entries | 382 | 35 | 10 | 3 |
| the number of active participants (entry authors) | 229 | - | 8 | 2 |
| the number of multimedia files (including photographs and videos) | 616 | 61 | 9 | 3 |
| the aim of the establishment | wild boar enthusiasts | wild boar enthusiasts | providing information | providing information and issuing warnings |
| Indicators | Quantitative Data | |||||||
|---|---|---|---|---|---|---|---|---|
| Period | March 2020 | April 2020 | May 2020 | June 2020 | July 2020 | August 2020 | September 2020 | October 2020 |
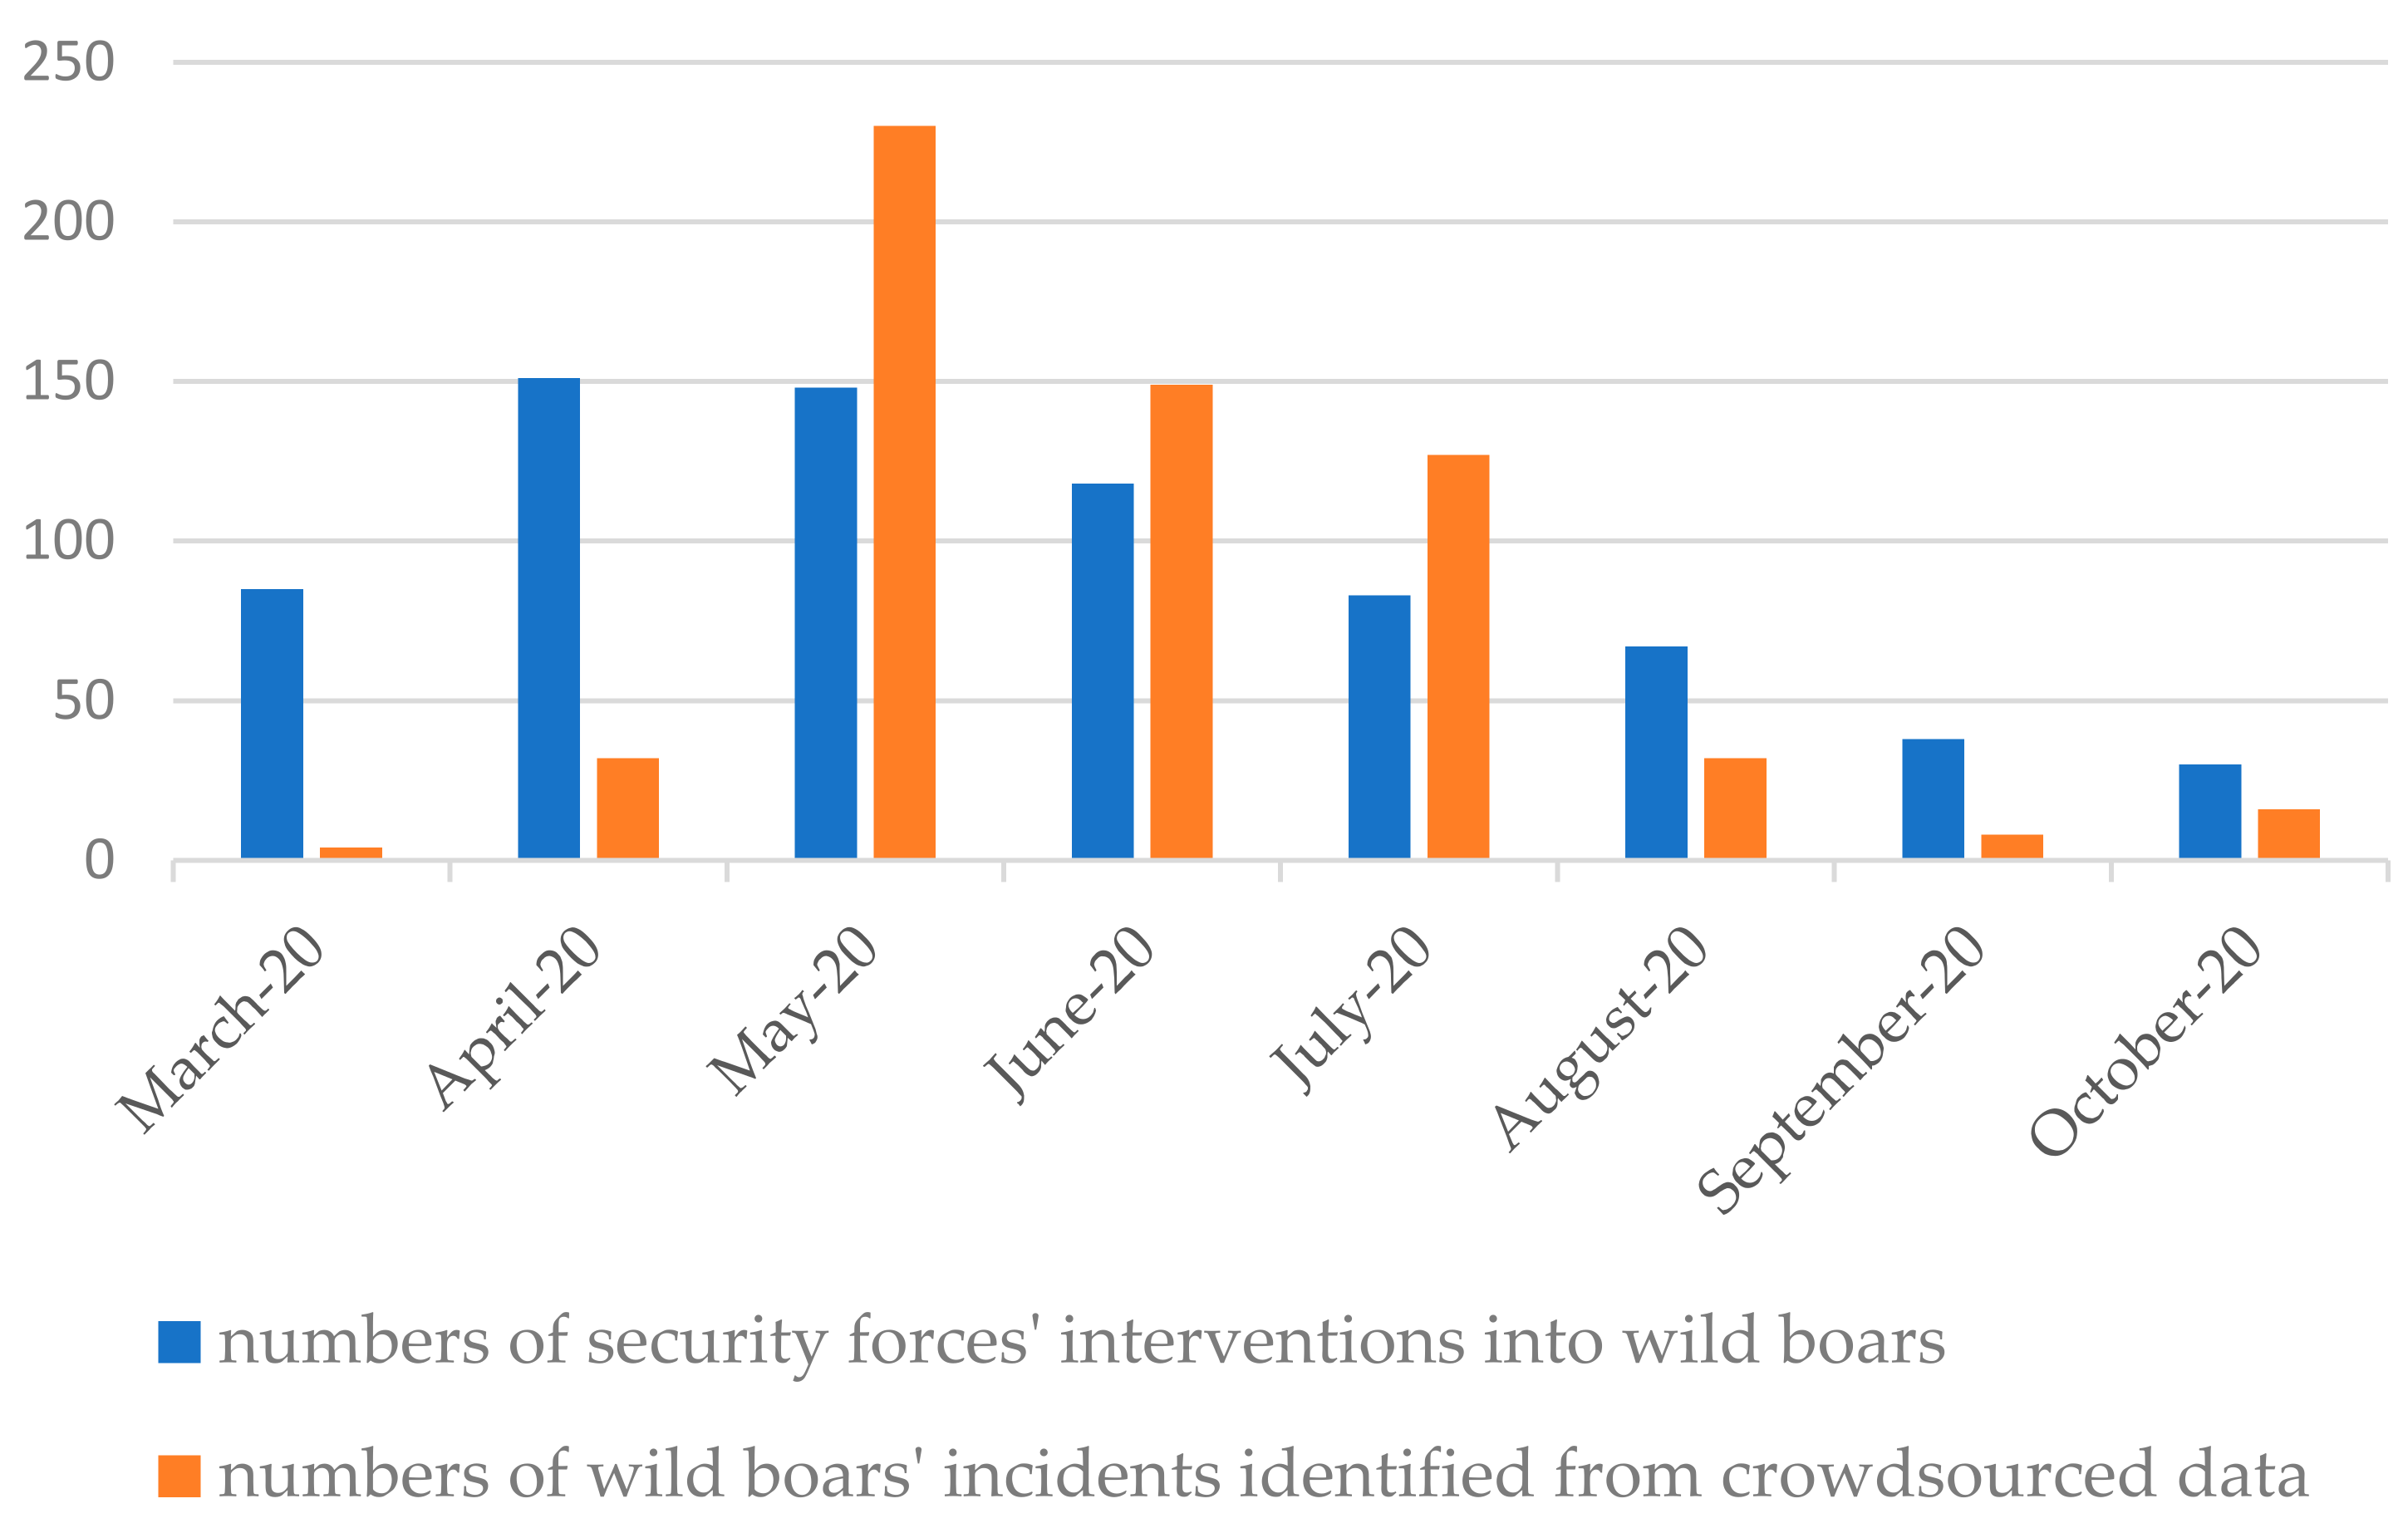
| Number of hazards | 4 | 32 | 230 | 149 | 127 | 32 | 17 | 16 |
| Number of wild boar threats in the city of Olsztyn according to the scale in Table 1 | 1 | 3 | 3 | 3 | 3 | 3 | 2 | 2 |
| Number of rank 2 and 3 hazards | 1 | 17 | 148 | 91 | 77 | 17 | 12 | 12 |
| Threat assessment: location of wild boars in the city of Olsztyn according to the scale in Table 2 | 2 | 3 | 3 | 3 | 3 | 3 | 3 | 3 |
| Severity of socio-spatial conflicts involving wild boars in the city of Olsztyn | low | high | high | high | high | high | medium | medium |
Publisher’s Note: MDPI stays neutral with regard to jurisdictional claims in published maps and institutional affiliations. |
© 2021 by the authors. Licensee MDPI, Basel, Switzerland. This article is an open access article distributed under the terms and conditions of the Creative Commons Attribution (CC BY) license (https://creativecommons.org/licenses/by/4.0/).
Share and Cite
Dudzińska, M.; Dawidowicz, A. Detecting the Severity of Socio-Spatial Conflicts Involving Wild Boars in the City Using Social Media Data. Sensors 2021, 21, 8215. https://doi.org/10.3390/s21248215
Dudzińska M, Dawidowicz A. Detecting the Severity of Socio-Spatial Conflicts Involving Wild Boars in the City Using Social Media Data. Sensors. 2021; 21(24):8215. https://doi.org/10.3390/s21248215
Chicago/Turabian StyleDudzińska, Małgorzata, and Agnieszka Dawidowicz. 2021. "Detecting the Severity of Socio-Spatial Conflicts Involving Wild Boars in the City Using Social Media Data" Sensors 21, no. 24: 8215. https://doi.org/10.3390/s21248215
APA StyleDudzińska, M., & Dawidowicz, A. (2021). Detecting the Severity of Socio-Spatial Conflicts Involving Wild Boars in the City Using Social Media Data. Sensors, 21(24), 8215. https://doi.org/10.3390/s21248215