
How Can High-Frequency Sensors Capture Collaboration? A Review of the Empirical Links between Multimodal Metrics and Collaborative Constructs


Abstract
:1. Introduction
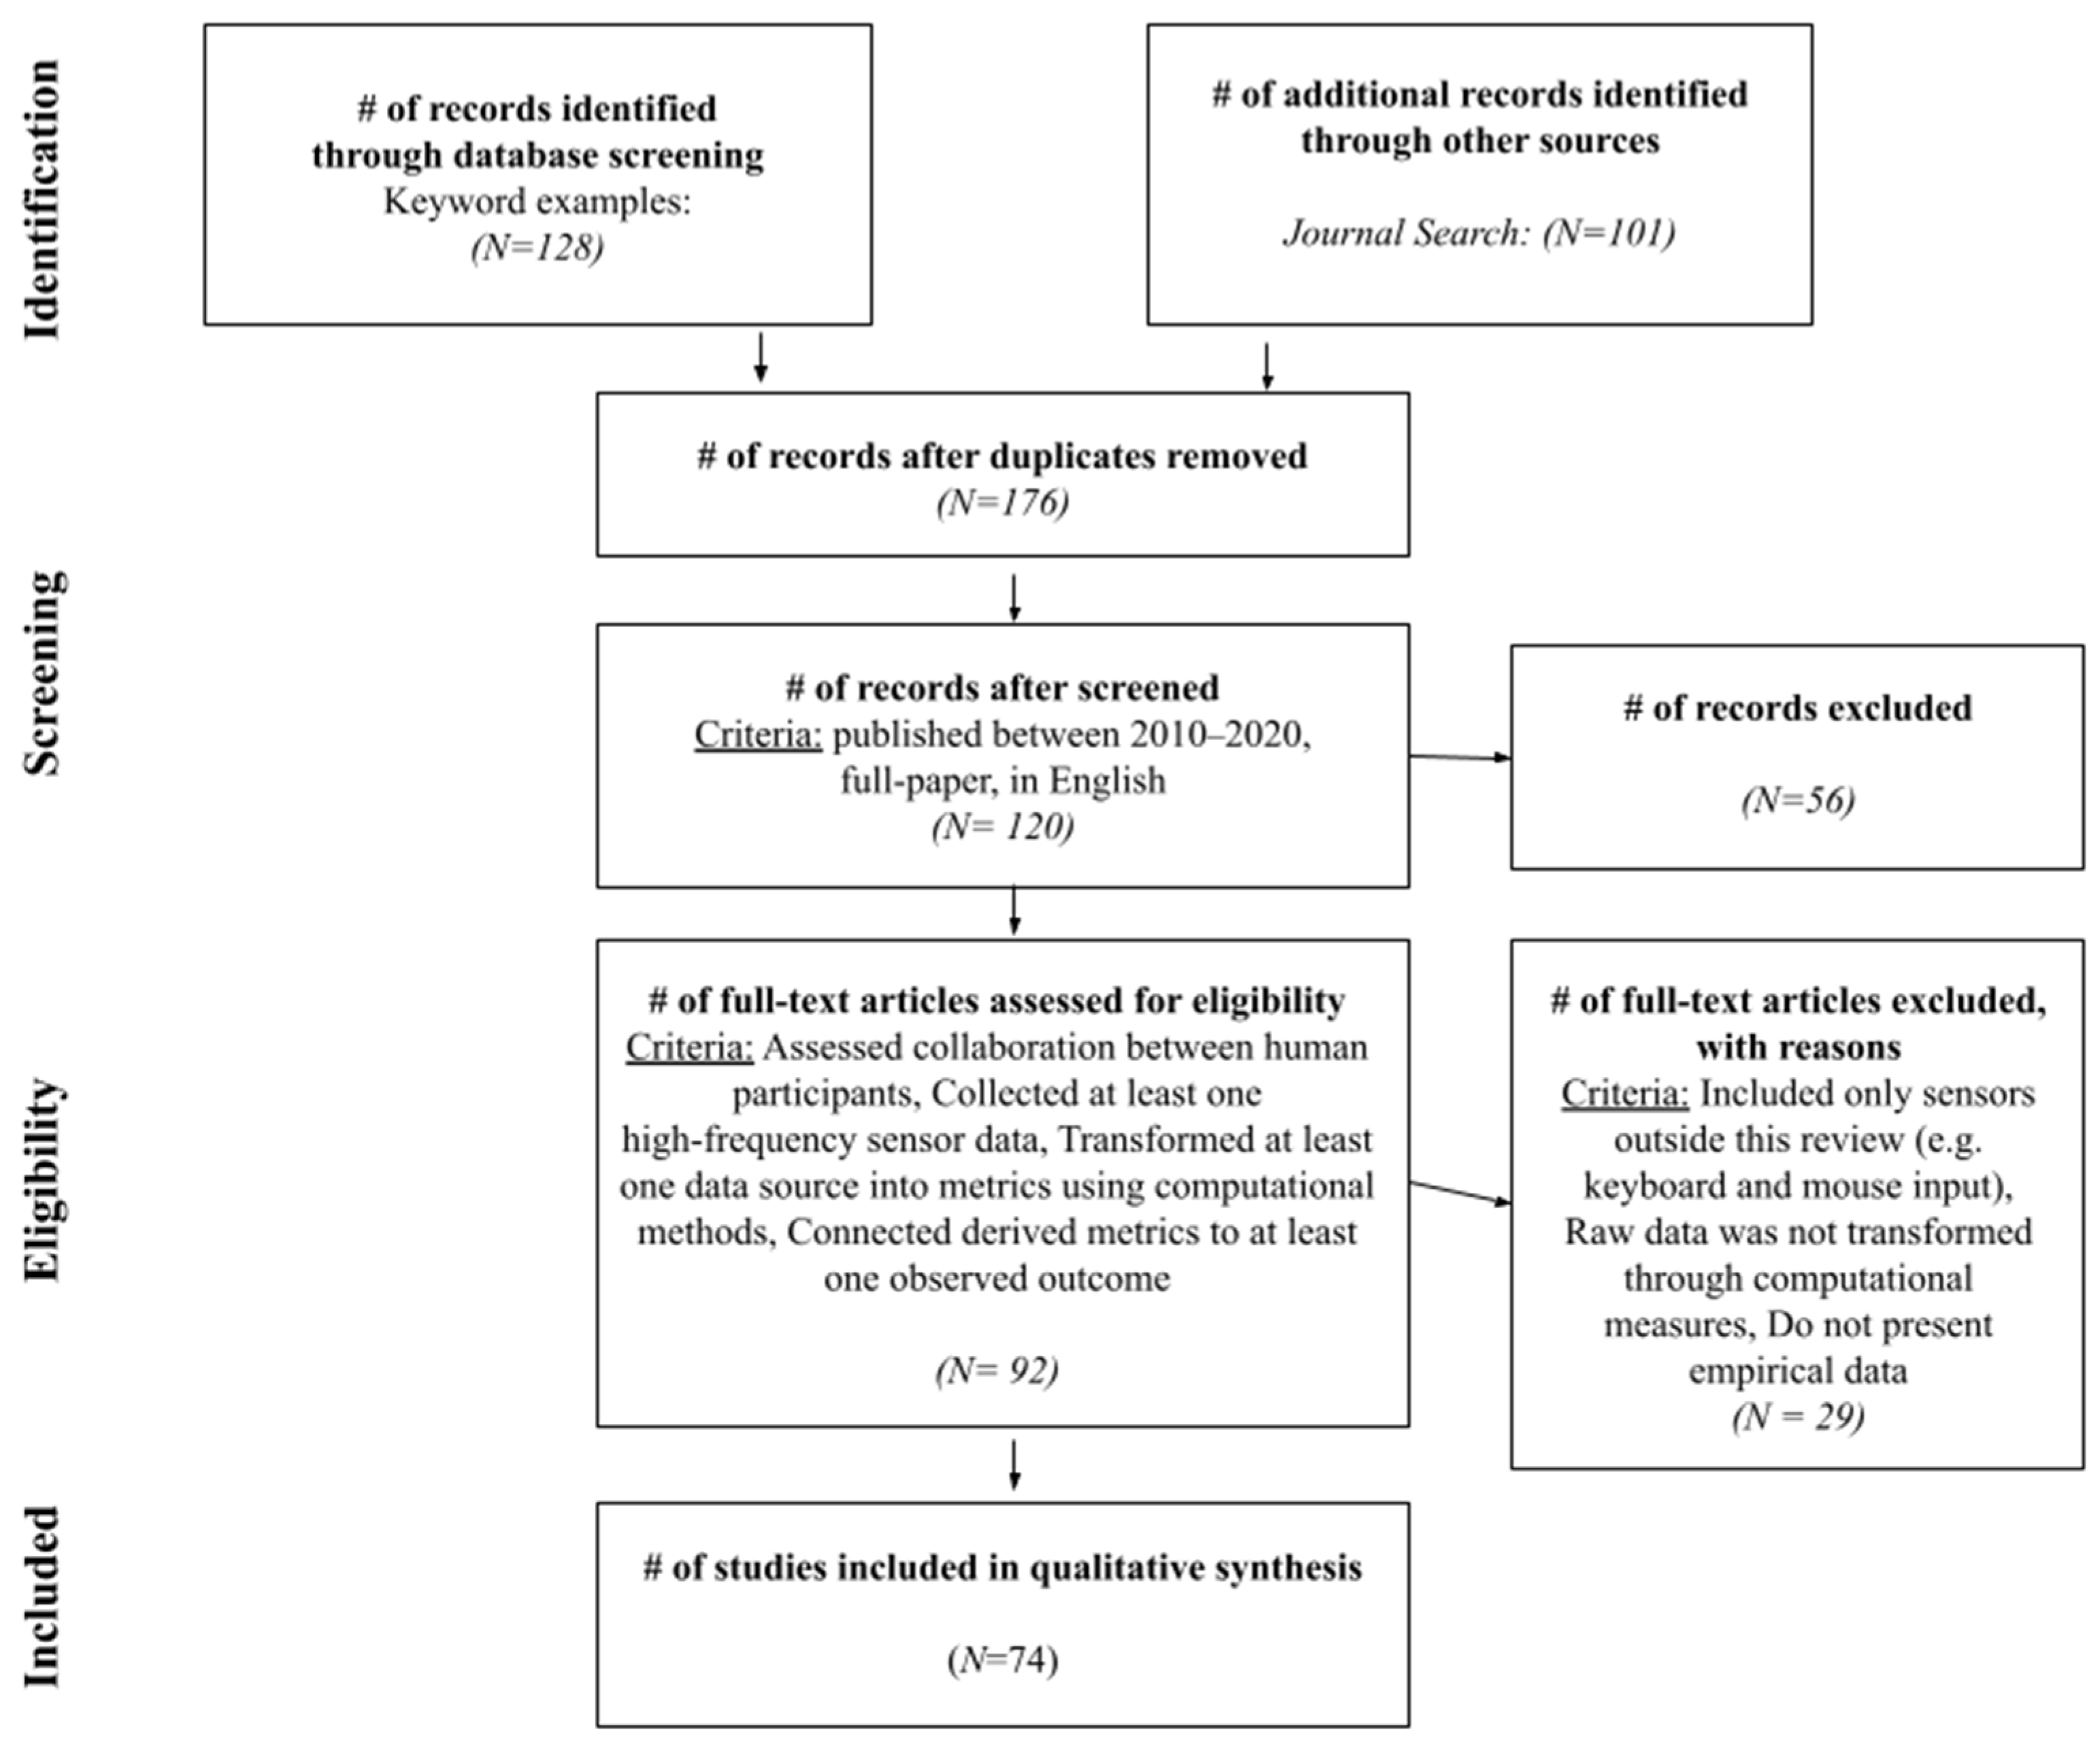
2. Methodology
2.1. Data Collection
2.2. Classification Framework and Process
2.3. Theoretical Framework for Classification
3. Research Questions for the Review
4. Results
4.1. What Sensor-Based Metrics Have Been Used to Capture Collaborative Processes (RQ1)?
4.2. What Outcome Measures Have Been Used to Validate Sensor-Based Metrics (RQ2)?

| Larger Category | Lower-Level Category | Outcome Examples (Data Directly from Papers) | Domain | Measurement Methods | Questionnaires or Coding Schemes (Ratio of Validated to Generated) | Reference |
|---|---|---|---|---|---|---|
| Product (N = 37) | Performance (N = 24) | Completion time, Success of task, Quality of task, Correctness | Pair programming, problem-solving, instruction giving, math, physics, engineering/design | Automated coding, human coding, self-report | Questionnaire (0:2): Researcher Generated | [25,27,29,32,42,51,57,58,62,64,65,69,71,74,76,77,78,80,83,86,91,92,95,97] |
| Learning (N = 19) | Normalized learning gain, dual learning gain | Neuroscience, programming, engineering/design, nutrition | Pre-post test | [15,26,34,43,44,47,56,59,61,64,70,72,73,74,77,80,83,84,90] | ||
| Process (N = 25) | Communication (N = 22) | Conversational efficiency, agreement, mutual understanding, dialogue management, verbal participation | Pair programming, neuroscience, problem-solving, math, nutrition, engineering/design, gaming, naturalistic | Automated coding, human coding, self-report | Coding Scheme (15:5): Meier, Spada, Rummel [98], Researcher Generated Questionnaire (1:0): Meier, Spada, Rummel [98] | [31,34,36,37,39,45,47,49,55,56,61,63,72,73,74,81,82,83,86,87,89,91] |
| Coordination (N = 28) | Information pooling, consensus reaching, socially shared regulation, synchrony, task division, time management, technical coordination, routine choice | Pair programming, neuroscience, problem-solving, math, physics, nutrition, engineering/design | Human coding, self-report | Coding Scheme (17:6): Meier, Spada, Rummel [98], Researcher Generated Questionnaire (1:1): Meier, Spada, Rummel [98], Researcher Generated | [31,34,36,38,39,41,45,47,51,55,56,58,61,63,66,67,69,72,73,74,78,79,81,82,83,86,91,96] | |
| Affective state (N = 6) | Stress, confidence, emotional state, empathy, frustration, perceived valence and arousal | Programming, problem-solving, physics, engineering/design, gaming | Self-report | Questionnaire (3:3): Social presence in Gaming [102], NASA Task Load Index [100], Ainley, Corrigan and Richardson [103], Hadwin & Webster [104], Researcher Generated | [40,48,56,62,92] | |
| Interpersonal relationship/perception (N = 14) | Self-report quality, self-esteem in work teams, collaborative will, perception of peer (helpfulness, understanding, clarity), colaughter, social presence, rapport level, team cohesion | Pair programming, neuroscience, problem-solving, instruction giving, math, physics, nutrition, engineering/design, naturalistic | Human coding, self-report | Coding Scheme (0:3): Researcher Generated Questionnaire (6:6): Sanchez-Cortes, Aran, Mast and Gatica-Perez [30], MSLQ [105], Manson et al. [106], Researcher Generated | [24,25,30,48,50,51,52,53,64,66,68,92,94,95] | |
| Individual Cognitive Processes (N = 11) | Mental effort, cognitive load, workload, engagement, task difficulty | Programming, problem-solving, physics, engineering/design, gaming, naturalistic | Human coding, self-report | Coding Scheme (0:2): Researcher Generated Questionnaire (7:3): Social Presence in Gaming [102], User Engagement Survey [107], NASA Task Load Index [100], Paas [108], Tapola, Veermans and Niemivirta [109], Efklides, Papadaki, Papantoniou, and Kiosseoglou [110], Researcher Generated | [43,59,60,62,65,67,68,79,86,89,96] | |
| Condition (N = 15) | Group composition (N = 15) | Expertise, personality, assigned leadership, emergent leadership | Problem-solving, math, gaming | Automated coding, Assigned role, self-report | Coding Scheme (0:4): Researcher Generated Questionnaire (8:0): NEO_FFI [101], SYMLOG [111], GLIS [112], Manson et al. [106] | [22,24,25,26,30,32,37,43,50,51,72,82,85,87,91] |
4.3. Which Connections between Sensor-Based Metrics and Collaborative Outcomes Have Been Successful (RQ3)?
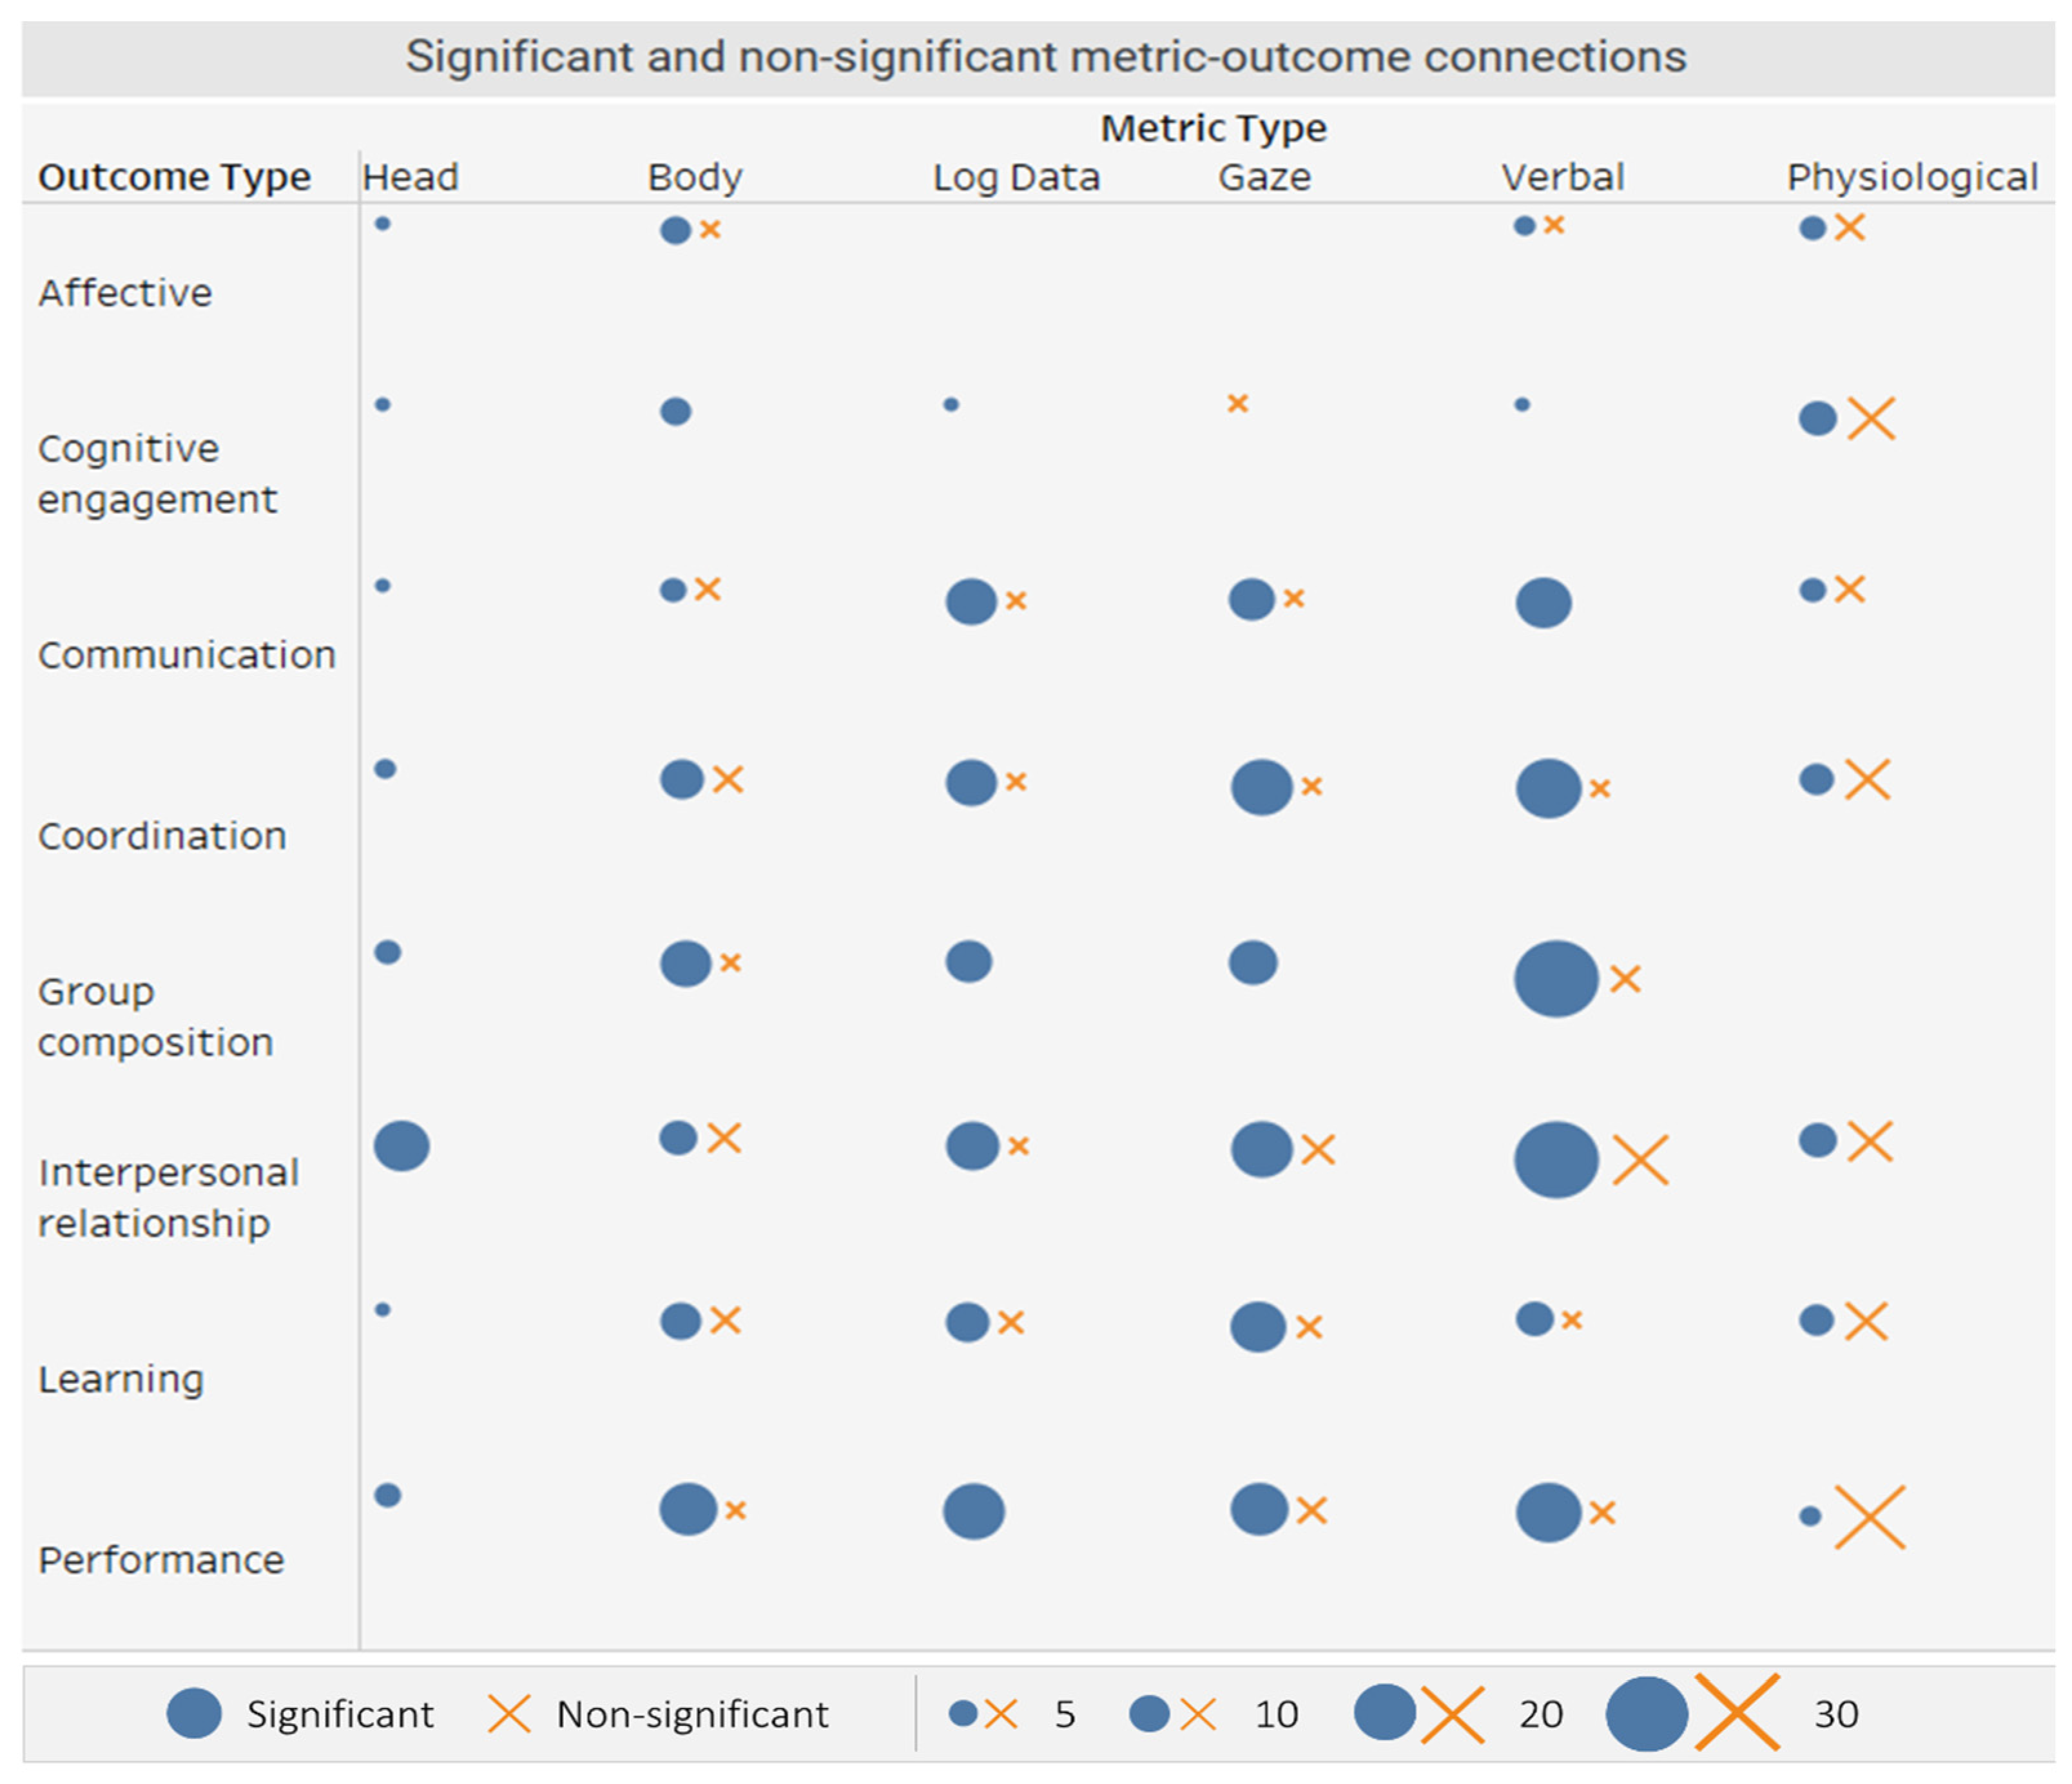
4.3.1. Types of Metric–Outcome Connections
4.3.2. Quantitative Trends in the Metric–Outcome Connections
4.3.3. Qualitative Findings for Metric-Outcome Connections
Product: Performance
Product: Learning Outcomes
Process: Communication
Process: Coordination
Process: Affective State
Process: Interpersonal Relationship/Perception
Process: Individual Cognitive Processes
Condition: Stable Personal Attributes
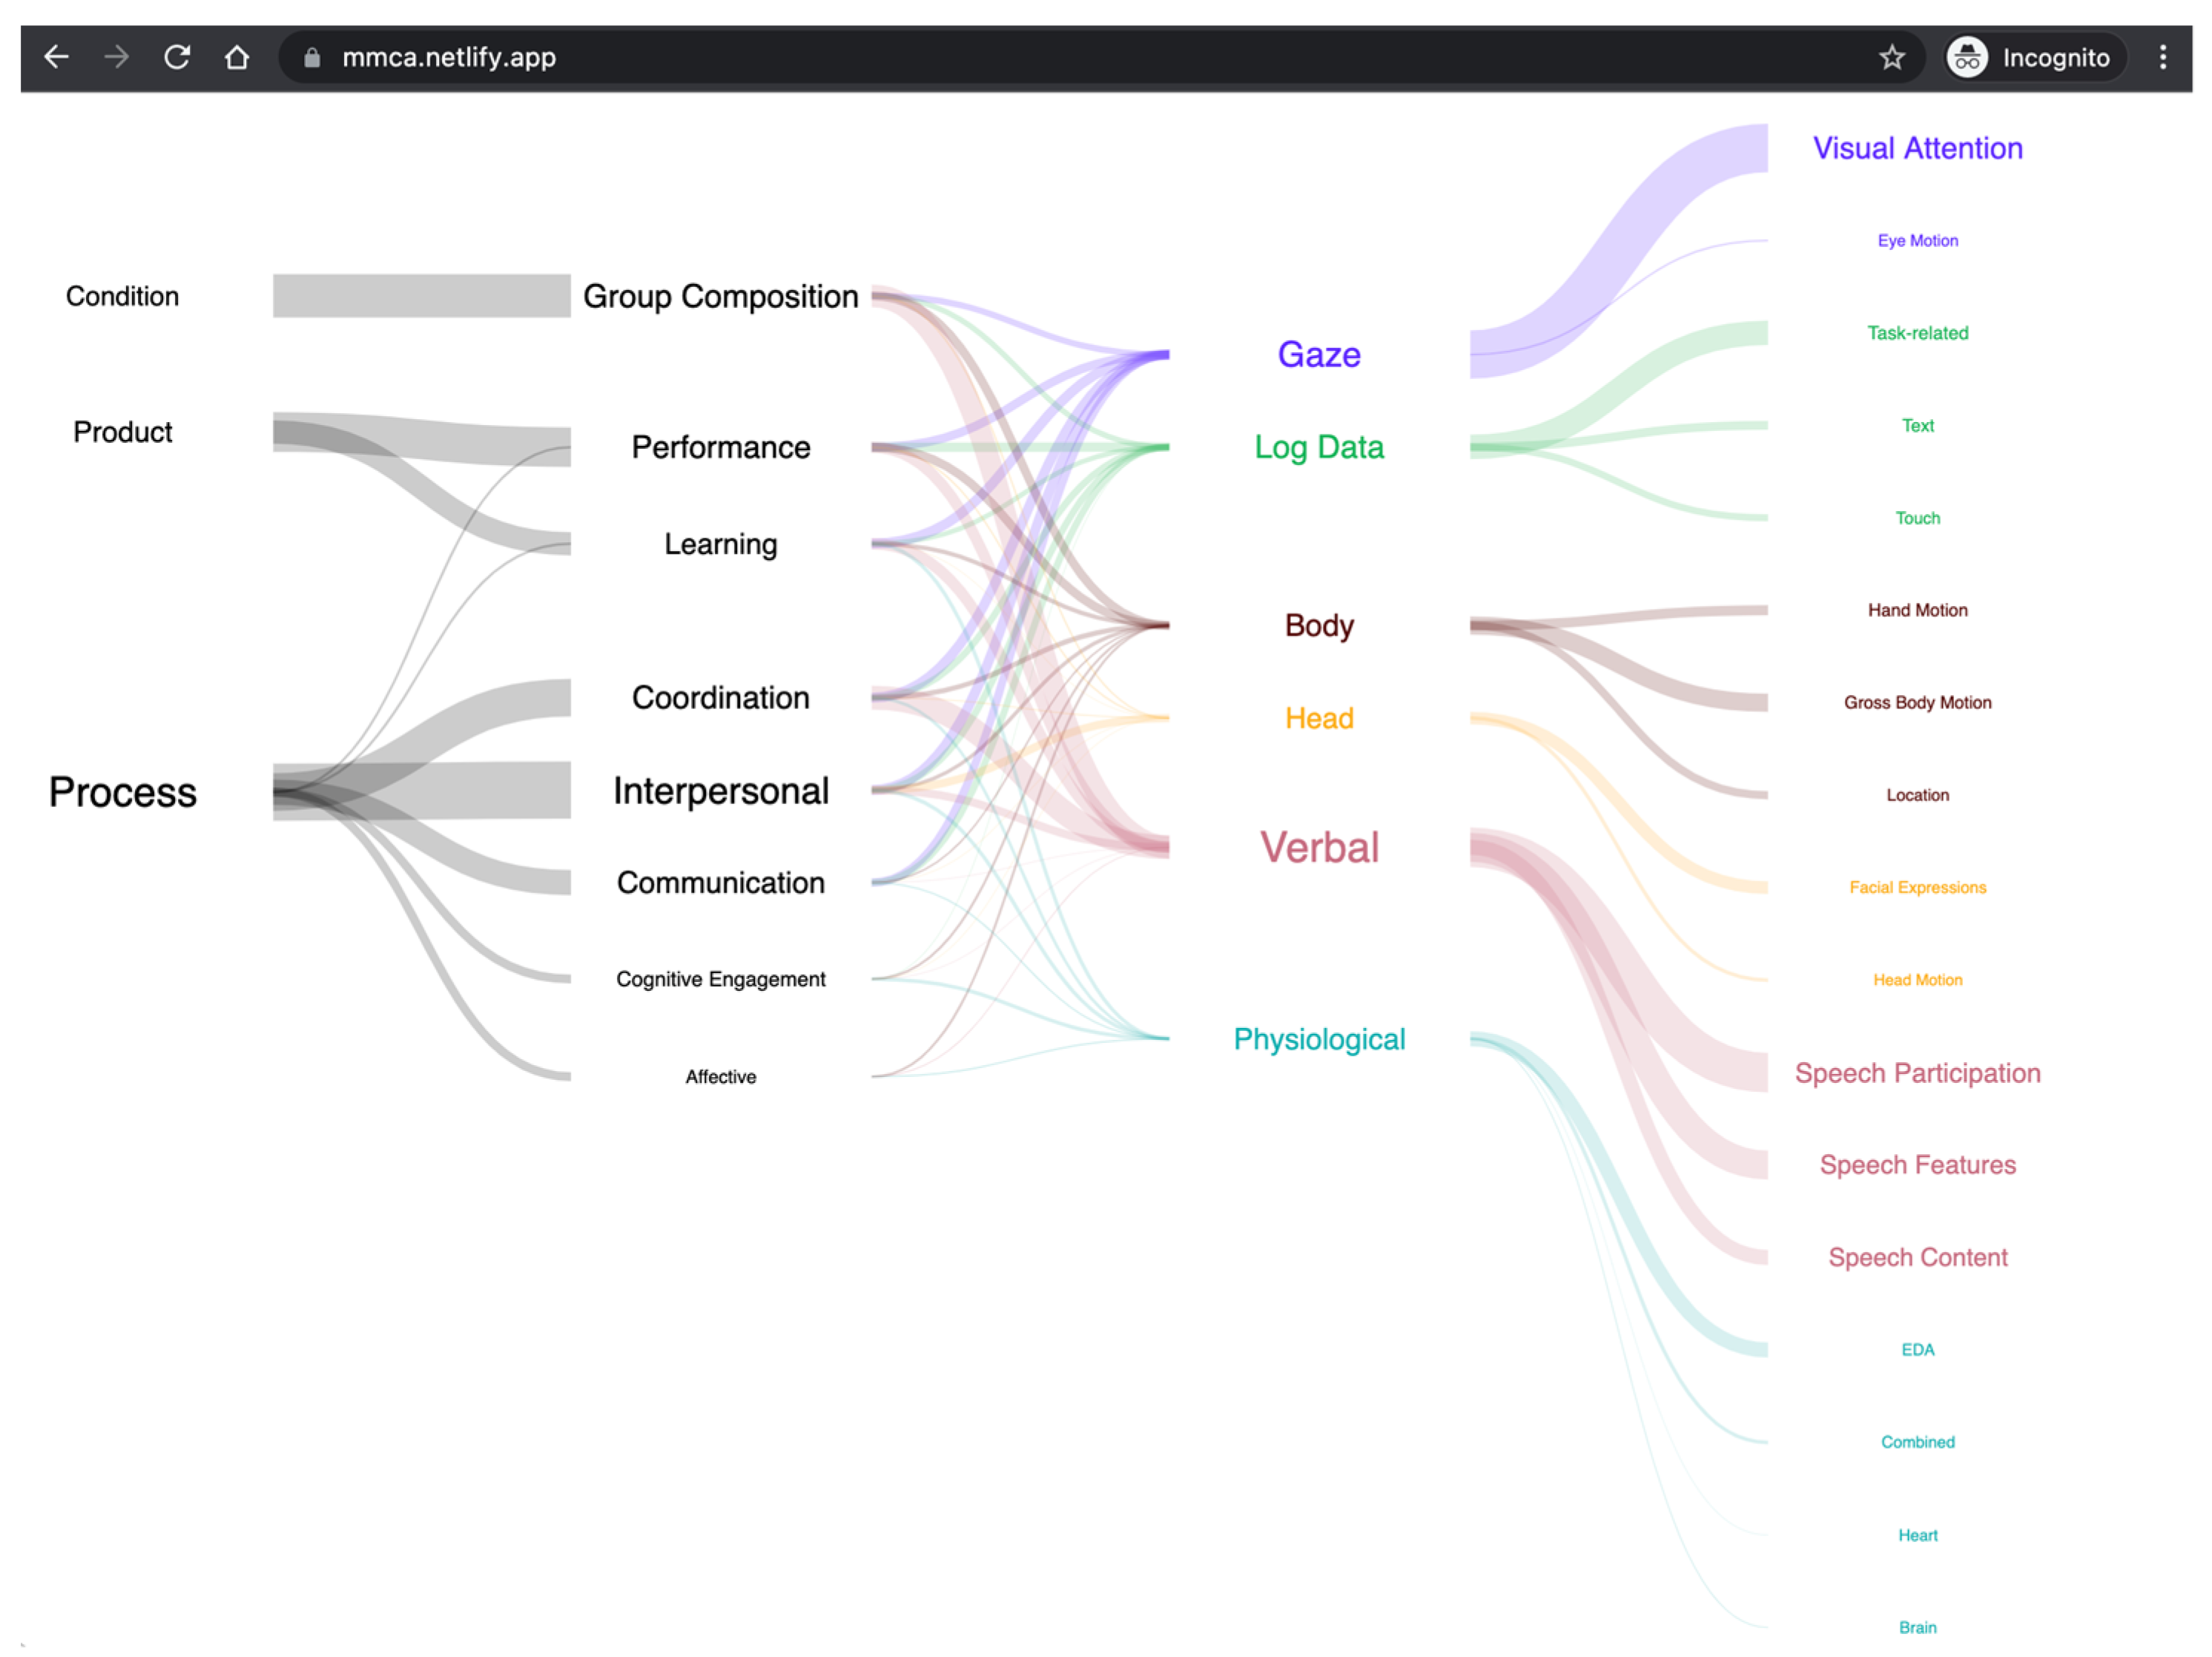
4.3.4. Interactive Visualizations of the State of the Field
4.4. How Was Theory Used to Inform the Connections between Metrics and Outcomes (RQ4)?
4.4.1. How Is Theory Used in MMCA?
4.4.2. What Are the Core Theories for MMCA Research?
5. Discussion
5.1. Opportunities for Improving Sensor-Based Metrics
5.2. Opportunities for Improving the Use of Collaborative Outcomes
5.3. Opportunities for Improving the Connections between Metrics and Outcomes
5.4. Opportunities for Integrating Theory
5.5. Limitations and Future Steps
6. Conclusions—Why This Work Matters
Funding
Conflicts of Interest
References
- Levy, F.; Murnane, R.J. Education and the changing job market. Educ. Leadersh. 2004, 62, 80. [Google Scholar]
- General Education Maps and Markers: Designing Meaningful Pathways to Student Achievement. Available online: https://www.aacu.org/publications/gems/maps-and-markers (accessed on 17 August 2021).
- Greiff, S.; Holt, D.V.; Funke, J. Perspectives on Problem Solving in Educational Assessment: Analytical, Interactive, and Collaborative Problem Solving. J. Probl. Solving 2013, 5, 5. Available online: http://cogprints.org/9041/ (accessed on 17 August 2021). [CrossRef] [Green Version]
- Blikstein, P.; Worsley, M. Multimodal Learning Analytics and Education Data Mining: Using computational technologies to measure complex learning tasks. J. Learn. Anal. 2016, 3, 220–238. [Google Scholar] [CrossRef] [Green Version]
- Schneider, B.; Dowell, N.; Thompson, K. Collaboration Analytics—Current State and Potential Futures. J. Learn. Anal. 2021, 8, 1–12. [Google Scholar] [CrossRef]
- Jones, S.; Bailey, R.; Brush, K.; Nelson, B. Introduction to the taxonomy project: Tools for selecting & aligning SEL frameworks. Collab. Acad. Soc. Emot. Learn. 2019, 3, 1–13. [Google Scholar]
- Collins, F.S.; Morgan, M.; Patrinos, A. The Human Genome Project: Lessons from Large-Scale Biology. Science 2003, 300, 286–290. [Google Scholar] [CrossRef] [Green Version]
- Van Essen, D.C.; Smith, S.M.; Barch, D.M.; Behrens, T.E.J.; Yacoub, E.; Ugurbil, K. The WU-Minn Human Connectome Project: An overview. NeuroImage 2013, 80, 62–79. [Google Scholar] [CrossRef] [Green Version]
- Martinez-Maldonado, R.; Gašević, D.; Echeverria, V.; Nieto, G.F.; Swiecki, Z.; Shum, S.B. What Do You Mean by Collaboration Analytics? A Conceptual Model. J. Learn. Anal. 2021, 8, 126–153. [Google Scholar] [CrossRef]
- Sharma, K.; Giannakos, M. Multimodal data capabilities for learning: What can multimodal data tell us about learning? Br. J. Educ. Technol. 2020, 51, 1450–1484. [Google Scholar] [CrossRef]
- Gatica-Perez, D. Automatic nonverbal analysis of social interaction in small groups: A review. Image Vis. Comput. 2009, 27, 1775–1787. [Google Scholar] [CrossRef]
- Rasipuram, S.; Jayagopi, D.B. A comprehensive evaluation of audio-visual behavior in various modes of interviews in the wild. In PETRA’19, Proceedings of the 12th ACM International Conference on PErvasive Technologies Related to Assistive Environments, Rhodes, Greece, 5–7 June 2019; Association for Computing Machinery: New York, NY, USA, 2019; pp. 94–100. [Google Scholar]
- Mitri, D.D.; Schneider, J.; Specht, M.; Drachsler, H. From signals to knowledge: A conceptual model for multimodal learning analytics. J. Comput. Assist. Learn. 2018, 34, 338–349. [Google Scholar] [CrossRef] [Green Version]
- Shankar, S.K.; Prieto, L.P.; Rodríguez-Triana, M.J.; Ruiz-Calleja, A. A Review of Multimodal Learning Analytics Architectures. In Proceedings of the 2018 IEEE, Proceedings of the 18th International Conference on Advanced Learning Technologies (ICALT), Mumbai, India, 9–13 July 2018; IEEE: Piscataway, NJ, USA, 2018; pp. 365–369. [Google Scholar]
- Worsley, M. (Dis)engagement matters: Identifying efficacious learning practices with multimodal learning analytics. In Proceedings of the 8th International Conference on Learning Analytics and Knowledge (LAK’18), Sydney, NSW, Australia, 7–9 March 2018; Association for Computing Machinery: New York, NY, USA, 2018; pp. 365–369. [Google Scholar]
- Mu, S.; Cui, M.; Huang, X. Multimodal Data Fusion in Learning Analytics: A Systematic Review. Sensors 2020, 20, 6856. [Google Scholar] [CrossRef] [PubMed]
- Wise, A.F.; Shaffer, D.W. Why Theory Matters More than Ever in the Age of Big Data. J. Learn. Anal. 2015, 2, 5–13. [Google Scholar] [CrossRef]
- Shaffer, D.W. Quantitative Ethnography; Cathcart Press: Madison, WI, USA, 2017; ISBN 978-0-578-19168-3. [Google Scholar]
- Liberati, A.; Altman, D.G.; Tetzlaff, J.; Mulrow, C.; Gøtzsche, P.C.; Ioannidis, J.P.A.; Clarke, M.; Devereaux, P.J.; Kleijnen, J.; Moher, D. The PRISMA statement for reporting systematic reviews and meta-analyses of studies that evaluate health care interventions: Explanation and elaboration. J. Clin. Epidemiol. 2009, 62, e1–e34. [Google Scholar] [CrossRef] [PubMed] [Green Version]
- Dillenbourg, P. What Do You Mean by Collaborative Learning? Elsevier: Amsterdam, The Netherlands, 1999; pp. 1–19. [Google Scholar]
- McGrath, J.E. Groups: Interaction and Performance; Prentice-Hall: Hoboken, NJ, USA, 1984; Volume 14. [Google Scholar]
- Thomson, A.; Perry, J. Collabration processes: Inside the black box. Public Adm. Rev. 2006, 66, 20–32. [Google Scholar] [CrossRef]
- Multimodal Collaboration Analytics—A Review of the Literature. Available online: Mmca.gse.harvard.edu (accessed on 24 September 2021).
- Bhattacharya, I.; Foley, M.; Zhang, N.; Zhang, T.; Ku, C.; Mine, C.; Ji, H.; Riedl, C.; Welles, B.F.; Radke, R.J. A multimodal-sensor-enabled room for unobtrusive group meeting analysis. In Proceedings of the 20th ACM International Conference on Multimodal Interaction (ICMI’18), Boulder, CO, USA, 16–20 October 2018; Association for Computing Machinery: New York, NY, USA, 2018; pp. 347–355. [Google Scholar]
- Jayagopi, D.; Sanchez-Cortes, D.; Otsuka, K.; Yamato, J.; Gatica-Perez, D. Linking speaking and looking behavior patterns with group composition, perception, and performance. In Proceedings of the 14th ACM International Conference on Multimodal Interaction (ICMI’12), Santa Monica, CA, USA, 22–26 October 2012; Association for Computing Machinery: New York, NY, USA, 2012; pp. 433–440. [Google Scholar]
- Schneider, B.; Sharma, K.; Cuendet, S.; Zufferey, G.; Dillenbourg, P.; Pea, R. Detecting Collaborative Dynamics Using Mobile Eye-Trackers; International Society of the Learning Sciences: Singapore, 2016. [Google Scholar]
- Ochoa, X.; Chiluiza, K.; Méndez, G.; Luzardo, G.; Guamán, B.; Castells, J. Expertise estimation based on simple multimodal features. In Proceedings of the 15th ACM on International Conference on Multimodal Interaction (ICMI’13), Sydney, Australia, 9–13 December 2013; Association for Computing Machinery: New York, NY, USA, 2013; pp. 583–590. [Google Scholar]
- Okada, S.; Aran, O.; Gatica-Perez, D. Personality Trait Classification via Co-Occurrent Multiparty Multimodal Event Discovery. In Proceedings of the 2015 ACM on International Conference on Multimodal Interaction (ICMI’15), Seattle, DC, USA, 9–13 November 2015; Association for Computing Machinery: New York, NY, USA, 2015; pp. 15–22. [Google Scholar]
- Luz, S. Automatic identification of experts and performance prediction in the multimodal math data corpus through analysis of speech interaction. In Proceedings of the 15th ACM on International Conference on Multimodal Interaction (ICMI’13), Sydney, Australia, 9–13 December 2013; Association for Computing Machinery: New York, NY, USA, 2013; pp. 575–582. [Google Scholar]
- Sanchez-Cortes, D.; Aran, O.; Jayagopi, D.B.; Mast, M.S.; Gatica-Perez, D. Emergent leaders through looking and speaking: From audio-visual data to multimodal recognition. J. Multimodal User Interfaces 2013, 1, 39–53. [Google Scholar] [CrossRef] [Green Version]
- Starr, E.L.; Reilly, J.M.; Schneider, B. Toward Using Multi-Modal Learning Analytics to Support and Measure Collaboration in Co-Located Dyads; International Society of the Learning Sciences, Inc. [ISLS]: New York, NY, USA, 2018. [Google Scholar]
- Miura, G.; Okada, S. Task-independent Multimodal Prediction of Group Performance Based on Product Dimensions. In Proceedings of the 2019 International Conference on Multimodal Interaction (ICMI’19), Suzhou, China, 14–18 October 2019; Association for Computing Machinery: New York, NY, USA, 2019; pp. 264–273. [Google Scholar]
- Scherer, S.; Weibel, N.; Morency, L.-P.; Oviatt, S. Multimodal prediction of expertise and leadership in learning groups. In Proceedings of the 1st International Workshop on Multimodal Learning Analytics (MLA’12), Santa Monica, CA, USA, 26 October 2012; Association for Computing Machinery: New York, NY, USA, 2012; pp. 1–8. [Google Scholar]
- Dich, Y.; Reilly, J.; Schneider, B. Using Physiological Synchrony as an Indicator of Collaboration Quality, Task Performance and Learning. In Artificial Intelligence in Education; Penstein Rosé, C., Martínez-Maldonado, R., Hoppe, H.U., Luckin, R., Mavrikis, M., Porayska-Pomsta, K., McLaren, B., du Boulay, B., Eds.; Springer: Berlin, Germany, 2018; pp. 98–110. [Google Scholar]
- Beyan, C.; Katsageorgiou, V.-M.; Murino, V. Moving as a Leader: Detecting Emergent Leadership in Small Groups using Body Pose. In Proceedings of the 25th ACM International Conference on Multimedia, Mountain View, CA, USA, 23–27 October 2017; Association for Computing Machinery: New York, NY, USA, 2017; pp. 1425–1433. [Google Scholar]
- Martinez-Maldonado, R.; Kay, J.; Yacef, K. An Automatic Approach for Mining Patterns of Collaboration around an Interactive Tabletop. In Lecture Notes in Computer Science, Proceedings of the 16th International Conference on Artificial Intelligence in Education, Memphis, TN, USA, 9–13 July 2013; Lane, H.C., Yacef, K., Mostow, J., Pavlik, P., Eds.; Springer: Berlin, Germany, 2013; pp. 101–110. ISBN 978-3-642-39111-8. [Google Scholar]
- Martinez, R.; Wallace, J.R.; Kay, J.; Yacef, K. Modelling and Identifying Collaborative Situations in a Collocated Multi-display Groupware Setting. In Lecture Notes in Computer Science, Proceedings of the 15th International Conference on Artificial Intelligence in Education, Auckland, NZ, USA, 28 June–2 July 2011; Biswas, G., Bull, S., Kay, J., Mitrovic, A., Eds.; Springer: Berlin, Germany, 2011; pp. 196–204. ISBN 978-3-642-21868-2. [Google Scholar]
- Ponce-López, V.; Escalera, S.; Baró, X. Multi-modal social signal analysis for predicting agreement in conversation settings. In Proceedings of the 15th ACM on International Conference on Multimodal Interaction (ICMI’13), Sydney, NSW, Australia, 9–12 December 2013; Association for Computing Machinery: New York, NY, USA, 2013; pp. 495–502. [Google Scholar]
- Viswanathan, S.A.; VanLehn, K. Using the tablet gestures and speech of pairs of students to classify their collaboration. IEEE Trans. Learn. Technol. 2017, 11, 230–242. [Google Scholar] [CrossRef] [Green Version]
- Lepri, B.; Subramanian, R.; Kalimeri, K.; Staiano, J.; Pianesi, F.; Sebe, N. Employing social gaze and speaking activity for automatic determination of the extraversion trait. In Proceedings of the International Conference on Multimodal Interfaces and the Workshop on Machine Learning for Multimodal Interaction (ICMI-MLMI’10), Beijing, China, 8–10 November 2010; Association for Computing Machinery: New York, NY, USA, 2010; pp. 1–8. [Google Scholar]
- Bassiou, N.; Tsiartas, A.; Smith, J.; Bratt, H.; Richey, C.; Shriberg, E.; D’Angelo, C.; Alozie, N. Privacy-Preserving Speech Analytics for Automatic Assessment of Student Collaboration. In Proceedings of the Interspeech 2016, San Francisco, CA, USA, 8–12 September 2016; pp. 888–892. [Google Scholar]
- Murray, G.; Oertel, C. Predicting Group Performance in Task-Based Interaction. In Proceedings of the 20th ACM International Conference on Multimodal Interaction (ICMI’18), Boulder, CO, USA, 16–20 October 2018; Association for Computing Machinery: New York, NY, USA, 2018; pp. 14–20. [Google Scholar]
- Grafsgaard, J.F.; Wiggins, J.B.; Vail, A.K.; Boyer, K.E.; Wiebe, E.N.; Lester, J.C. The additive value of multimodal features for predicting engagement, frustration, and learning during tutoring. In Proceedings of the 16th International Conference on Multimodal Interaction (ICMI’14), Istanbul, Turkey, 12–16 November 2014; Association for Computing Machinery: New York, NY, USA, 2014; pp. 42–49. [Google Scholar]
- Sharma, K.; Leftheriotis, I.; Noor, J.; Giannakos, M. Dual Gaze as a Proxy for Collaboration in Informal Learning; International Society of the Learning Sciences: Philadelphia, PA, USA, 2017. [Google Scholar]
- Martinez-Maldonado, R.; Dimitriadis, Y.; Martinez-Monés, A.; Kay, J.; Yacef, K. Capturing and analyzing verbal and physical collaborative learning interactions at an enriched interactive tabletop. Intern. J. Comput.-Support. Collab. Learn. 2013, 8, 455–485. [Google Scholar] [CrossRef]
- Lin, Y.-S.; Lee, C.-C. Using Interlocutor-Modulated Attention BLSTM to Predict Personality Traits in Small Group Interaction. In Proceedings of the 2018 on International Conference on Multimodal Interaction (ICMI’18), Boulder, CO, USA, 16–20 October 2018; Association for Computing Machinery: New York, NY, USA, 2018; pp. 163–169. [Google Scholar]
- Schneider, B.; Pea, R. Does seeing one another’s gaze affect group dialogue? A computational approach. J. Learn. Anal. 2015, 2, 107–133. [Google Scholar] [CrossRef] [Green Version]
- McDuff, D.; Thomas, P.; Czerwinski, M.; Craswell, N. Multimodal analysis of vocal collaborative search: A public corpus and results. In Proceedings of the 19th ACM International Conference on Multimodal Interaction (ICMI’17), Glasgow, UK, 13–17 November 2017; Association for Computing Machinery: New York, NY, USA, 2017; pp. 456–463. [Google Scholar]
- Schneider, B.; Pea, R. The Effect of Mutual Gaze Perception on Students’ Verbal Coordination. In Proceedings of the 7th International Conference on Educational Data Mining, London, UK, 4–7 July 2014; pp. 138–144. [Google Scholar]
- Bachour, K.; Kaplan, F.; Dillenbourg, P. An Interactive Table for Supporting Participation Balance in Face-to-Face Collaborative Learning. IEEE Trans. Learn. Technol. 2010, 3, 203–213. [Google Scholar] [CrossRef]
- Kantharaju, R.B.; Ringeval, F.; Besacier, L. Automatic Recognition of Affective Laughter in Spontaneous Dyadic Interactions from Audiovisual Signals. In Proceedings of the 2018 on International Conference on Multimodal Interaction (ICMI’18), Boulder, CO, USA, 16–20 October 2018; Association for Computing Machinery: New York, NY, USA, 2018; pp. 220–228. [Google Scholar]
- Eloy, L.; Stewart, A.E.B.; Amon, M.J.; Reinhardt, C.; Michaels, A.; Chen, S.; Shute, V.; Duran, N.D.; D’Mello, S.K. Modeling Team-level Multimodal Dynamics during Multiparty Collaboration. In Proceedings of the 2019 International Conference on Multimodal Interaction (ICMI’19), Suzhou, China, 14–18 October 2018; Association for Computing Machinery: New York, NY, USA, 2019; pp. 244–258. [Google Scholar]
- Lubold, N.; Pon-Barry, H. Acoustic-Prosodic Entrainment and Rapport in Collaborative Learning Dialogues. In Proceedings of the 2014 ACM Workshop on Multimodal Learning Analytics Workshop and Grand Challenge (MLA’14), Istanbul, Turkey, 12 November 2014; Association for Computing Machinery: New York, NY, USA, 2014; pp. 5–12. [Google Scholar]
- Fang, S.; Achard, C.; Dubuisson, S. Personality classification and behaviour interpretation: An approach based on feature categories. In Proceedings of the 18th ACM International Conference on Multimodal Interaction (ICMI’16), Tokyo, Japan, 12–16 November 2016; Association for Computing Machinery: New York, NY, USA, 2016; pp. 225–232. [Google Scholar]
- Hung, H.; Jayagopi, D.B.; Ba, S.; Odobez, J.-M.; Gatica-Perez, D. Investigating automatic dominance estimation in groups from visual attention and speaking activity. In Proceedings of the 10th International Conference on Multimodal Interfaces (ICMI’08), Chania, Crete, Greece, 20–22 October 2008; Association for Computing Machinery: New York, NY, USA, 2008; pp. 233–236. [Google Scholar]
- Viswanathan, S.A.; Vanlehn, K. High Accuracy Detection of Collaboration from Log Data and Superficial Speech Features; International Society of the Learning Sciences: Philadelphia, PA, USA, 2017. [Google Scholar]
- Reilly, J.M.; Schneider, B. Predicting the Quality of Collaborative Problem Solving Through Linguistic Analysis of Discourse. In Proceedings of the 12th International Conference on Educational Data Mining, Montreal, QC, Canada, 2–5 July 2019. [Google Scholar]
- Spikol, D.; Ruffaldi, E.; Dabisias, G.; Cukurova, M. Supervised machine learning in multimodal learning analytics for estimating success in project-based learning. J. Comput. Assist. Learn. 2018, 366–377. [Google Scholar] [CrossRef]
- Spikol, D.; Ruffaldi, E.; Landolfi, L.; Cukurova, M. Estimation of success in collaborative learning based on multimodal learning analytics features. In Proceedings of the 2017 IEEE 17th International Conference on Advanced Learning Technologies (ICALT), Timisoara, Romania, 3–7 July 2017; pp. 269–273. [Google Scholar]
- Järvelä, S.; Kivikangas, J.M.; Kätsyri, J.; Ravaja, N. Physiological linkage of dyadic gaming experience. Simul. Gaming 2014, 45, 24–40. [Google Scholar] [CrossRef]
- Malmberg, J.; Haataja, E.; Seppänen, T.; Järvelä, S. Are we together or not? The temporal interplay of monitoring, physiological arousal and physiological synchrony during a collaborative exam. Int. J. Comput. Collab. Learn. 2019, 14, 467–490. [Google Scholar] [CrossRef] [Green Version]
- Schneider, B.; Dich, Y.; Radu, I. Unpacking the Relationship between Existing and New Measures of Physiological Synchrony and Collaborative Learning: A Mixed Methods Study. Int. J. Comput. Collab. Learn. 2020, 15, 89–113. [Google Scholar] [CrossRef]
- Montague, E.; Xu, J.; Chiou, E. Shared experiences of technology and trust: An experimental study of physiological compliance between active and passive users in technology-mediated collaborative encounters. IEEE Trans. Hum.-Mach. Syst. 2014, 44, 614–624. [Google Scholar] [CrossRef]
- Malmberg, J.; Järvelä, S.; Holappa, J.; Haataja, E.; Huang, X.; Siipo, A. Going beyond what is visible: What multichannel data can reveal about interaction in the context of collaborative learning? Comput. Hum. Behav. 2019, 96, 235–245. [Google Scholar] [CrossRef]
- Pijeira-Díaz, H.J.; Drachsler, H.; Järvelä, S.; Kirschner, P.A. Investigating collaborative learning success with physiological coupling indices based on electrodermal activity. In Proceedings of the Sixth International Conference on Learning Analytics & Knowledge (LAK’16), Edinburgh, UK, 25–29 April 2016; Association for Computing Machinery: New York, NY, USA, 2016; pp. 64–73. [Google Scholar]
- Dindar, M.; Järvelä, S.; Haataja, E. What does physiological synchrony reveal about metacognitive experiences and group performance? Br. J. Educ. Technol. 2020, 51, 1577–1596. [Google Scholar] [CrossRef]
- Mønster, D.; Håkonsson, D.D.; Eskildsen, J.K.; Wallot, S. Physiological evidence of interpersonal dynamics in a cooperative production task. Physiol. Behav. 2016, 156, 24–34. [Google Scholar] [CrossRef] [PubMed]
- Liu, Y.; Wang, T.; Wang, K.; Zhang, Y. Predicting Collaborative Learning Quality through Physiological Synchrony Recorded by Wearable Biosensors. bioRxiv 2020. [Google Scholar] [CrossRef]
- Dikker, S.; Wan, L.; Davidesco, I.; Kaggen, L.; Oostrik, M.; McClintock, J.; Rowland, J.; Michalareas, G.; Van Bavel, J.J.; Ding, M.; et al. Brain-to-Brain Synchrony Tracks Real-World Dynamic Group Interactions in the Classroom. Curr. Biol. 2017, 27, 1375–1380. [Google Scholar] [CrossRef] [PubMed]
- Sharma, K.; Nüssli, M.-A.; Jermann, P.; Dillenbourg, P. Understanding Collaborative Program Comprehension: Interlacing Gaze and Dialogues; International Society of the Learning Sciences, Inc. [ISLS]: New York, NY, USA, 2013. [Google Scholar]
- Sharma, K.; Caballero, D.; Verma, H.; Jermann, P.; Dillenbourg, P. Looking AT Versus Looking through: A Dual Eye-Tracking Study in MOOC Context; International Society of the Learning Sciences, Inc. [ISLS]: New York, NY, USA, 2015. [Google Scholar]
- Andrist, S.; Ruis, A.R.; Shaffer, D.W. A network analytic approach to gaze coordination during a collaborative task. Comput. Hum. Behav. 2018, 89, 339–348. [Google Scholar] [CrossRef]
- Schneider, B.; Pea, R. Using Eye-Tracking Technology to Support Visual Coordination in Collaborative Problem-Solving Groups; International Society of the Learning Sciences, Inc. [ISLS]: Madison, WI, USA, 2013. [Google Scholar]
- Schneider, B.; Sharma, K.; Cuendet, S.; Zufferey, G.; Dillenbourg, P.; Pea, R. Leveraging mobile eye-trackers to capture joint visual attention in co-located collaborative learning groups. Int. J. Comput. Collab. Learn. 2018, 13, 241–261. [Google Scholar] [CrossRef]
- Li, W.; Nüssli, M.-A.; Jermann, P. Gaze quality assisted automatic recognition of social contexts in collaborative Tetris. In Proceedings of the ICMI-International Conference on Multimodal Interfaces and the Workshop on Machine Learning for Multimodal Interaction (MLMI’10), Beijing, China, 8–10 November 2010; Association for Computing Machinery: New York, NY, USA, 2010; pp. 1–8. [Google Scholar]
- Higuch, K.; Yonetani, R.; Sato, Y. Can Eye Help You?: Effects of Visualizing Eye Fixations on Remote Collaboration Scenarios for Physical Tasks. In Proceedings of the 2016 CHI Conference on Human Factors in Computing Systems (CHI’16), San Jose, CA, USA, 7–12 May 2016; Association for Computing Machinery: New York, NY, USA, 2016; pp. 5180–5190. [Google Scholar]
- Schneider, B.; Sharma, K.; Cuendet, S.; Zufferey, G.; Dillenbourg, P.; Pea, R. Using mobile eye-trackers to unpack the perceptual benefits of a tangible user interface for collaborative learning. ACM Trans. Comput.-Hum. Interact. 2016, 23, 1–23. [Google Scholar] [CrossRef]
- Vrzakova, H.; Amon, M.J.; Stewart, A.E.; D’Mello, S.K. Dynamics of visual attention in multiparty collaborative problem solving using multidimensional recurrence quantification analysis. In Proceedings of the 2019 CHI Conference on Human Factors in Computing Systems (CHI’19), Glasgow Scotland, UK, 4–9 May 2019; Association for Computing Machinery: New York, NY, USA, 2019; pp. 1–14. [Google Scholar]
- Spikol, D.; Ruffaldi, E.; Cukurova, M. Using Multimodal Learning Analytics to Identify Aspects of Collaboration in Project-Based Learning; International Society of the Learning Sciences: Philadelphia, PA, USA, 2017; p. 8. [Google Scholar]
- Sharma, K.; Olsen, J. An Alternate Statistical Lens to Look at Collaboration Data: Extreme Value Theory; International Society of the Learning Sciences, Inc. [ISLS]: New York, NY, USA, 2019; pp. 400–407. [Google Scholar]
- Schneider, B.; Pea, R. Toward collaboration sensing. Int. J. Comput. Collab. Learn. 2014, 9, 371–395. [Google Scholar] [CrossRef]
- Schneider, B. Unpacking Collaborative Learning Processes during Hands-On Activities Using Mobile Eye-Trackers; International Society of the Learning Sciences, Inc. [ISLS]: New York, NY, USA, 2019. [Google Scholar]
- Schneider, B.; Sharma, K.; Cuendet, S.; Zufferey, G.; Dillenbourg, P.; Pea, R.D. 3D Tangibles Facilitate Joint Visual Attention in Dyads; International Society of the Learning Sciences, Inc. [ISLS]: New York, NY, USA, 2015; Volume 1, pp. 156–165. [Google Scholar]
- Schneider, B.; Pea, R. Real-time mutual gaze perception enhances collaborative learning and collaboration quality. Int. J. Comput. Collab. Learn. 2013, 8, 375–397. [Google Scholar] [CrossRef]
- Beyan, C.; Carissimi, N.; Capozzi, F.; Vascon, S.; Bustreo, M.; Pierro, A.; Becchio, C.; Murino, V. Detecting emergent leader in a meeting environment using nonverbal visual features only. In Proceedings of the 18th ACM International Conference on Multimodal Interaction (ICMI’16), Tokyo, Japan, 12–16 November 2016; Association for Computing Machinery: New York, NY, USA, 2016; pp. 317–324. [Google Scholar]
- Kütt, G.H.; Tanprasert, T.; Rodolitz, J.; Moyza, B.; So, S.; Kenderova, G.; Papoutsaki, A. Effects of Shared Gaze on Audio-Versus Text-Based Remote Collaborations. Proc. ACM Hum.-Comput. Interact. 2020, 4, 1–25. [Google Scholar] [CrossRef]
- Gergle, D.; Alan, C. See What I’m Saying? Using Dyadic Mobile Eye Tracking to Study Collaborative Reference. In Proceedings of the ACM 2011 Conference on Computer Supported Cooperative Work (CSCW’11), Hangzhou, China, 19–23 March 2011; pp. 435–444. [Google Scholar]
- Sriramulu, A.; Lin, J.; Oviatt, S. Dynamic Adaptive Gesturing Predicts Domain Expertise in Mathematics. In Proceedings of the 2019 International Conference on Multimodal Interaction (ICMI’19), Suzhou, China, 14–18 October 2019; Association for Computing Machinery: New York, NY, USA, 2019; pp. 105–113. [Google Scholar]
- Yamashita, N.; Kaji, K.; Kuzuoka, H.; Hirata, K. Improving visibility of remote gestures in distributed tabletop collaboration. In Proceedings of the ACM 2011 Conference on Computer Supported Cooperative Work (CSCW’11), Hangzhou, China, 19–23 March 2011; Association for Computing Machinery: New York, NY, USA, 2011; pp. 95–104. [Google Scholar]
- Schneider, B.; Blikstein, P. Unraveling students’ interaction around a tangible interface using multimodal learning analytics. J. Educ. Data Min. 2015, 7, 89–116. [Google Scholar]
- Reilly, J.M.; Ravenell, M.; Schneider, B. Exploring Collaboration Using Motion Sensors and Multi-Modal Learning Analytics. In Proceedings of the International Educational Data Mining Society, Raleigh, NC, USA, 16–20 July 2018. [Google Scholar]
- Vrzakova, H.; Amon, M.J.; Stewart, A.; Duran, N.D.; D’Mello, S.K. Focused or stuck together: Multimodal patterns reveal triads’ performance in collaborative problem solving. In Proceedings of the Tenth International Conference on Learning Analytics & Knowledge (LAK’20), Frankfurt, Germany, 23–27 March 2020; Association for Computing Machinery: New York, NY, USA, 2020; pp. 295–304. [Google Scholar]
- Behoora, I.; Tucker, C.S. Machine learning classification of design team members’ body language patterns for real time emotional state detection. Des. Stud. 2015, 39, 100–127. [Google Scholar] [CrossRef]
- Dale, R.; Bryant, G.A.; Manson, J.H.; Gervais, M.M. Body synchrony in triadic interaction. R. Soc. Open Sci. 2020, 7, 200095. [Google Scholar] [CrossRef]
- Chng, E.; Seyam, M.R.; Yao, W.; Schneider, B. Using Motion Sensors to Understand Collaborative Interactions in Digital Fabrication Labs. In Lecture Notes in Computer Science-Artificial Intelligence in Education; Bittencourt, I.I., Cukurova, M., Muldner, K., Luckin, R., Millán, E., Eds.; Springer: Berlin, Germany, 2020; pp. 118–128. ISBN 978-3-030-52236-0. [Google Scholar]
- Evans, A.C.; Wobbrock, J.O.; Davis, K. Modeling Collaboration Patterns on an Interactive Tabletop in a Classroom Setting. In Proceedings of the 19th ACM Conference on Computer-Supported Cooperative Work & Social Computing (CSCW’16), San Francisco, CA, USA, 27 February–2 March 2016; Association for Computing Machinery: New York, NY, USA, 2016; pp. 858–869. [Google Scholar]
- Martinez, R.; Yacef, K.; Kay, J. Analysing frequent sequential patterns of collaborative learning activity around an interactive tabletop. In Educational Data Mining 2011; CEUR-WS: Aachen, Germany, 2011; pp. 111–120. [Google Scholar]
- Meier, A.; Spada, H.; Rummel, N. A rating scheme for assessing the quality of computer-supported collaboration processes. Int. J. Comput. Collab. Learn. 2007, 2, 63–86. [Google Scholar] [CrossRef] [Green Version]
- D’Mello, S. Emotional learning analytics. In Handbook of Learning Analytics; SOLAR: New York, NY, USA, 2017; Volume 115. [Google Scholar]
- Hart, S.; Staveland, L. Development of NASA-TLX (Task Load Index): Results of Empirical and Theoretical Research. In Advances in Psychology; Elsevier: Amsterdam, The Netherlands, 1988; Volume 52, pp. 139–183. ISBN 978-0-444-70388-0. [Google Scholar]
- Scandell, D.J.; Wlazelek, B. The relationship between self-perceived personality and impression management on the neo-ffi. Personal. Individ. Differ. 1999, 27, 147–154. [Google Scholar] [CrossRef]
- Yvonne, A.W.; de Kort, I.; Jsselsteijn, W.A.; Poels, K. Digital games as social presence technology: Development of the Social Presence in Gaming Questionnaire (SPGQ). In Proceedings of the 10th Annual International Workshop on Presence, Barcelona, Spain, 25–27 October 2007; pp. 1–9. [Google Scholar]
- Ainley, M.; Corrigan, M.; Richardson, N. Students, tasks and emotions: Identifying the contribution of emotions to students’ reading of popular culture and popular science texts. Learn. Instr. 2005, 15, 433–447. [Google Scholar] [CrossRef]
- Hadwin, A.F.; Webster, E.A. Calibration in goal setting: Examining the nature of judgments of confidence. Learn. Instr. 2013, 24, 37–47. [Google Scholar] [CrossRef]
- Pintrich, P. A Manual for the Use of the Motivated Strategies for Learning Questionnaire (MSLQ); ERIC: Washington, DC, USA, 1991. [Google Scholar]
- Manson, J.H.; Gregory, B.A.; Gervais, M.M.; Kline, M.A. Convergence of speech rate in conversation predicts cooperation. Evol. Hum. Behav. 2013, 34, 419–426. [Google Scholar] [CrossRef] [Green Version]
- O’Brien, H.L.; Toms, E.G.; Kelloway, E.K.; Kelley, E. Developing and evaluating a reliable measure of user engagement. Proc. Am. Soc. Inf. Sci. Technol. 2008, 45, 1–10. [Google Scholar] [CrossRef]
- Paas, F.G. Training strategies for attaining transfer of problem-solving skill in statistics: A cognitive-load approach. J. Educ. Psychol. 1992, 84, 429. [Google Scholar] [CrossRef]
- Tapola, A.; Veermans, M.; Niemivirta, M. Predictors and outcomes of situational interest during a science learning tasks. Instr. Sci. 2013, 41, 1047–1064. [Google Scholar] [CrossRef]
- Salonen, P.; Vauras, M.; Efklides, A. Social Interaction—What Can It Tell Us about Metacognition and Coregulation in Learning? Eur. Psychol. 2005, 10, 199–208. [Google Scholar] [CrossRef]
- Joann, K.; Wall, V.D. SYMLOG: Theory and method for measuring group and organizational communication. Manag. Commun. Q. 1989, 2.4, 544–567. [Google Scholar]
- Lord, R.; Foti, R.; Vader, C.D. A test of leadership categorization theory: Internal structure, information processing, and leadership perceptions. Organ. Behav. Hum. Perform. 1984, 34, 343–378. [Google Scholar] [CrossRef]
- van Blankenstein, F.M.; Dolmans, D.H.J.M.; van der Vleuten, C.P.M.; Schmidt, H.G. Which cognitive processes support learning during small-group discussion? The role of providing explanations and listening to others. Instr. Sci. 2011, 39, 189–204. [Google Scholar] [CrossRef] [Green Version]
- Kelly, J.R.; Barsade, S. Mood and emotions in small groups and work teams. Organ. Behav. Hum. Decis. Process. 2001, 86, 99–130. [Google Scholar] [CrossRef] [Green Version]
- Le Dantec, C.A.; Do, E.Y.-L. The mechanisms of value transfer in design meetings. Des. Stud. 2009, 30, 119–137. [Google Scholar] [CrossRef]
- Ogan, A.; Finkelstein, S.; Walker, E.; Carlson, R.; Cassell, J. Rudeness and rapport: Insults and learning gains in peer tutoring. In Intelligent Tutoring Systems; Springer: Berlin/Heidelberg, Germany, 2012; pp. 11–21. [Google Scholar]
- Barry, B.; Stewart, G.L. Composition, process and performance in self-managed groups: The role of personality. J. Appl. Psychol. 1997, 82, 62–78. [Google Scholar] [CrossRef] [PubMed]
- Dindar, M.; Sanna, J.; Hanna, J. Interplay of metacognitive experiences and performance in collaborative problem solving. Comput. Educ. 2020, 154, 103922. [Google Scholar] [CrossRef]
- Groysberg, B.; Polzer, J.T.; Elfenbein, H.A. Too Many Cooks Spoil the Broth: How High-Status Individuals Decrease Group Effectiveness. Organ. Sci. 2011, 22, 722–737. [Google Scholar] [CrossRef]
- Ying, X.; Li, H.; Jiang, S.; Peng, F.; Lin, Z. Group Laziness: The Effect of Social Loafing on Group Performance. Soc. Behav. Personal. Int. J. 2014, 42, 465–471. [Google Scholar] [CrossRef]
- Stroebe, W.; Strack, F. The alleged crisis and the illusion of exact replication. Perspect. Psychol. Sci. 2014, 9, 59–71. [Google Scholar] [CrossRef] [Green Version]
- Damon, W.; Phelps, E. Critical distinctions among three approaches to peer education. Int. J. Educ. Res. 1989, 13, 9–19. [Google Scholar] [CrossRef]
- Roth, W.-M. Gestures: Their Role in Teaching and Learning. Rev. Educ. Res. 2001, 71, 365–392. [Google Scholar] [CrossRef] [Green Version]
- Tomasello, M. Joint attention as social cognition. In Joint Attention: Its Origins and Role in Development; Moore, C., Dunham, P.J., Eds.; Lawrence Erlbaum Associates, Inc.: Hillsdale, NJ, USA, 1995; pp. 103–130. ISBN 0-8058-1437-X. [Google Scholar]
- Clark, H.H.; Brennan, S.E. Grounding in communication. In Perspectives on Socially Shared Cognition; Resnick, L.B., Levine, J.M., Teasley, S.D., Eds.; American Psychological Association: Washington, DC, USA, 1991; pp. 127–149. ISBN 1-55798-121-3. [Google Scholar]
- Sharma, K.; Olsen, J.; Himanshu, V.; Caballero, D.; Jermann, P. Challenging Joint Visual Attention as a Proxy for Collaborative Performance. In Proceedings of the International Conference on Computer Supported Collaborative Learning; International Society of the Learning Sciences, Inc. [ISLS]: Philadelphia, PA, USA, 2021; Volume 1, pp. 91–98. [Google Scholar]
- Richardson, D.C.; Dale, R. Looking To Understand: The Coupling Between Speakers’ and Listeners’ Eye Movements and Its Relationship to Discourse Comprehension. Cogn. Sci. 2005, 29, 1045–1060. [Google Scholar] [CrossRef] [PubMed] [Green Version]
- Jermann, P.; Nüssli, M.-A. Effects of sharing text selections on gaze cross-recurrence and interaction quality in a pair programming task. In Proceedings of the ACM 2012 Conference on Computer Supported Cooperative Work (CSCW’12), Seattle, DC, USA, 11–15 February 2012; ACM: New York, NY, USA, 2012; pp. 1125–1134. [Google Scholar]
- Cherubini, M.; Nüssli, M.-A.; Dillenbourg, P. Deixis and gaze in collaborative work at a distance (over a shared map): A computational model to detect misunderstandings. In Proceedings of the 2008 Symposium on Eye Tracking Research & Applications (ETRA’08), Savannah, GA, USA, 26–28 March 2008; ACM: New York, NY, USA, 2008; pp. 173–180. [Google Scholar]
- Sanchez-Cortes, D.; Aran, O.; Gatica-Perez, D. An audio visual corpus for emergent leader analysis. In Proceedings of the ICMI-MLMI’11, Multimodal Corpora for Machine Learning: Taking Stock and Road mapping the Future, Alicante, Spain, 14–18 November 2011; pp. 1–6. [Google Scholar]
- Roschelle, J. Learning by collaborating: Convergent conceptual change. J. Learn. Sci. 1992, 2, 235–276. [Google Scholar] [CrossRef]
- Fiedler, F.E.; House, R.J. Leadership theory and research: A report of progress. In International Review of Industrial and Organizational Psychology; John Wiley & Sons: Oxford, UK, 1988; pp. 73–92. ISBN 978-0-471-91844-8. [Google Scholar]
- Pickering, M.J.; Garrod, S. Toward a mechanistic psychology of dialogue. Behav. Brain Sci. 2004, 27, 169–190. [Google Scholar] [CrossRef]
- McCrae, R.R.; Costa, P.T., Jr. The five-factor theory of personality. In Handbook of Personality: Theory and Research, 3rd ed.; The Guilford Press: New York, NY, USA, 2008; pp. 159–181. ISBN 978-1-59385-836-0. [Google Scholar]
- Baker, M.; Hansen, T.; Joiner, R.; Traum, D. The role of grounding in collaborative learning tasks. In Collaborative Learning: Cognitive and Computational Approaches; Pergamon: Oxford, UK, 1999; Volume 31, p. 63. [Google Scholar]
- Barsade, S.G. The Ripple Effect: Emotional Contagion and its Influence on Group Behavior. Adm. Sci. Q. 2002, 47, 644–675. [Google Scholar] [CrossRef] [Green Version]
- Hareli, S.; Rafaeli, A. Emotion cycles: On the social influence of emotion in organizations. Res. Organ. Behav. 2008, 28, 35–59. [Google Scholar] [CrossRef]
- Bion, W.R. Experiences in Groups, and Other Papers; Routledge: London, UK, 1961. [Google Scholar]
- Tickle-Degnen, L.; Rosenthal, R. The Nature of Rapport and Its Nonverbal Correlates. Psychol. Inq. 1990, 1, 285–293. [Google Scholar] [CrossRef]
- Dennis, A.R.; Fuller, R.M.; Valacich, J.S. Media, Tasks, and Communication Processes: A Theory of Media Synchronicity. MIS Q. 2008, 32, 575–600. [Google Scholar] [CrossRef]
- Metamemory: A Theoretical Framework and New Findings. Available online: https://scholar.google.com/citations?view_op=view_citation&hl=en&user=gz0dRLgAAAAJ&citation_for_view=gz0dRLgAAAAJ:2osOgNQ5qMEC (accessed on 20 November 2021).
- Järvelä, S.; Hadwin, A.F. New frontiers: Regulating learning in CSCL. Educ. Psychol. 2013, 48, 25–39. [Google Scholar] [CrossRef]
- Sweller, J. Cognitive load theory: Recent theoretical advances. In Cognitive Load Theory; Cambridge University Press: Cambridge, UK, 2010; pp. 29–47. ISBN 978-0-521-67758-5. [Google Scholar]
- Stamper, J.C.; Koedinger, K.R. Human-Machine Student Model Discovery and Improvement Using DataShop. In Proceedings of the Artificial Intelligence in Education; Biswas, G., Bull, S., Kay, J., Mitrovic, A., Eds.; Springer: Berlin, Germany, 2011; pp. 353–360. [Google Scholar]
- Shute, V.J.; Kim, Y.J. Formative and Stealth Assessment. In Handbook of Research on Educational Communications and Technology; Spector, J.M., Merrill, M.D., Elen, J., Bishop, M.J., Eds.; Springer: New York, NY, USA, 2014; pp. 311–321. ISBN 978-1-4614-3185-5. [Google Scholar]
- Engelbart, D.C. Augmenting Human Intellect: A Conceptual Framework; SRI International: Menlo Park, CA, USA, 1962. [Google Scholar]

| Larger Category | Lower-Level Category | Metric Examples | Sensors Used | Computation Methods | References |
|---|---|---|---|---|---|
| Verbal (N = 35) | Speech Participation (N = 18) | Speech time, Silence duration, Verbal dominance, Speaking turns, Interruptions, Speech frequency, Verbal participation symmetry among group | Microphone, Microcone, Video camera | Arithmetic calculation | [24,25,26,27,28,29,30,31,32,33,34,35,36,37,38,39,40,41] |
| Verbal Content (N = 10) | Dialogue acts, Sequences of verbal utterances, Linguistic features | Arithmetic calculation, Qualitative coding, Supervised machine learning | [27,32,42,43,44,45,46,47,48,49] | ||
| Audio Features (N = 17) | Pitch, Energy, Speaking rate, Acoustic features, Mean audio level, Prosodic and tone features | Arithmetic calculation, Supervised machine learning, OpenSMILE | [28,32,33,39,41,42,48,50,51,52,53,54,55,56,57,58,59] | ||
| Physiological (N = 13) | Electrodermal Activity (EDA) (N = 11) | EDA peak detection, Galvanic skin response, Physiological synchrony | Varioport 16-bit digital skin conductance amplifier, Smart wristband, Electroencephalogram, Wearable sensor | Arithmetic calculation, Correlation, Cross-recurrence quantification analysis | [52,57,60,61,62,63,64,65,66,67,68] |
| Heart Rate (N = 2) | Heart rate | Arithmetic calculation | [63,68] | ||
| Neural Activity (N = 1) | Brain synchrony | Arithmetic calculation | [69] | ||
| Mixed (e.g., EDA + Heart Rate) (N = 2) | Physiological linkage, Physiological simultaneous arousal, Physiological concordance index | Arithmetic calculation | [34,61] | ||
| Gaze (N = 28) | Gaze/Eye Direction (N = 28) | Gaze fixations, Gaze area of interest, Attention center, Count of faces looking at screen, Fraction of convergent gaze, Gaze similarity, Joint visual attention | Eye tracker, Video camera, Microsoft Kinect, Optical see-through head-mounted display | Arithmetic calculation, regression, Matrix Calculation, BeGaze, Maximum a posteriori estimation, Supervised and unsupervised machine learning | [24,25,26,28,30,40,44,49,55,57,70,71,72,73,74,75,76,77,78,79,80,81,82,83,84,85,86,87] |
| Eye Motion (N = 3) | Gaze transitions, Gaze saccades | Arithmetic calculation, Eye-tracking softwares (e.g., BeGaze) | [70,72,75] | ||
| Eye Physiology (N = 1) | Pupil size | Arithmetic calculation | [84] | ||
| Head (N = 11) | Facial Expression (N = 6) | Facial action units, Facial expression features, Smiling synchrony | Video camera, Microsoft Kinect | OpenFace | [43,48,51,54,64,67] |
| Head Motion (N = 5) | Head movement | Arithmetic calculation | [28,32,38,58,59] | ||
| Body (N = 21) | Hand Motion (N = 8) | Gesture, Wrist movement, Total manual gestures per second, Iconic gestures per second, Deictic gestures per second, Distance between hands, Hand motion speed, Touch patterns | Video camera, Webcam, Microsoft Kinect | Arithmetic calculation, Qualitative coding, Unsupervised machine learning | [15,26,38,43,58,79,88,89] |
| Gross Body Motion (N = 12) | Total Movement, Type of movement, Body synchronization, Physical synchrony, Joint movement, Joint angle | Arithmetic calculation, OpenPose, Supervised and unsupervised machine learning | [27,28,31,35,38,52,57,90,91,92,93,94] | ||
| Location (N = 6) | Distance from the center of the table, Body distance, Dyad proximity | Arithmetic calculation, OpenTLD | [27,28,59,90,91,95] | ||
| Activity Log (N = 12) | Writing Action (N = 1) | Total number of pen strokes, Average stroke time, Average stroke path length, Average stroke displacement, Average stroke pressure | Digital pen, Touch screen, Interactive tabletop, Arduino IDE, Video camera, Log files | Arithmetic calculation | [27] |
| Touch (N = 3) | Total number of touch actions, Symmetry of touch actions among group | Arithmetic calculation, Qualitative coding | [36,45,96] | ||
| Task-Related (N = 9) | Object manipulation, Calculator use, Times mathematical terms were mentioned, Times commands were pronounced, Amount of exploration, Arduino measure of complexity, Arduino active hardware blocks, Arduino active software blocks | Arithmetic calculation, Qualitative coding, OpenCV, Micro-controller logs | [27,37,39,56,58,75,90,92,97] |
| Product: Group performance |
|
| Product: Learning outcomes |
|
| Process: Affective state |
|
| Process: Interpersonal relationship |
|
| Process: Communication |
|
| Process: Coordination |
|
| Process: Individual Cognitive Processes |
|
| Condition: Stable personal attributes |
|
| Dimension | Current Strengths | Potential Challenges | Future Opportunities |
|---|---|---|---|
| Metrics |
|
|
|
| Outcomes |
|
|
|
| Metric-outcome connections |
|
|
|
| Theory |
|
|
|
| Overall |
|
|
|
Publisher’s Note: MDPI stays neutral with regard to jurisdictional claims in published maps and institutional affiliations. |
© 2021 by the authors. Licensee MDPI, Basel, Switzerland. This article is an open access article distributed under the terms and conditions of the Creative Commons Attribution (CC BY) license (https://creativecommons.org/licenses/by/4.0/).
Share and Cite
Schneider, B.; Sung, G.; Chng, E.; Yang, S. How Can High-Frequency Sensors Capture Collaboration? A Review of the Empirical Links between Multimodal Metrics and Collaborative Constructs. Sensors 2021, 21, 8185. https://doi.org/10.3390/s21248185
Schneider B, Sung G, Chng E, Yang S. How Can High-Frequency Sensors Capture Collaboration? A Review of the Empirical Links between Multimodal Metrics and Collaborative Constructs. Sensors. 2021; 21(24):8185. https://doi.org/10.3390/s21248185
Chicago/Turabian StyleSchneider, Bertrand, Gahyun Sung, Edwin Chng, and Stephanie Yang. 2021. "How Can High-Frequency Sensors Capture Collaboration? A Review of the Empirical Links between Multimodal Metrics and Collaborative Constructs" Sensors 21, no. 24: 8185. https://doi.org/10.3390/s21248185
APA StyleSchneider, B., Sung, G., Chng, E., & Yang, S. (2021). How Can High-Frequency Sensors Capture Collaboration? A Review of the Empirical Links between Multimodal Metrics and Collaborative Constructs. Sensors, 21(24), 8185. https://doi.org/10.3390/s21248185