
Study on Electromagnetic Radiation Interference Caused by Rocket Fuel


Abstract
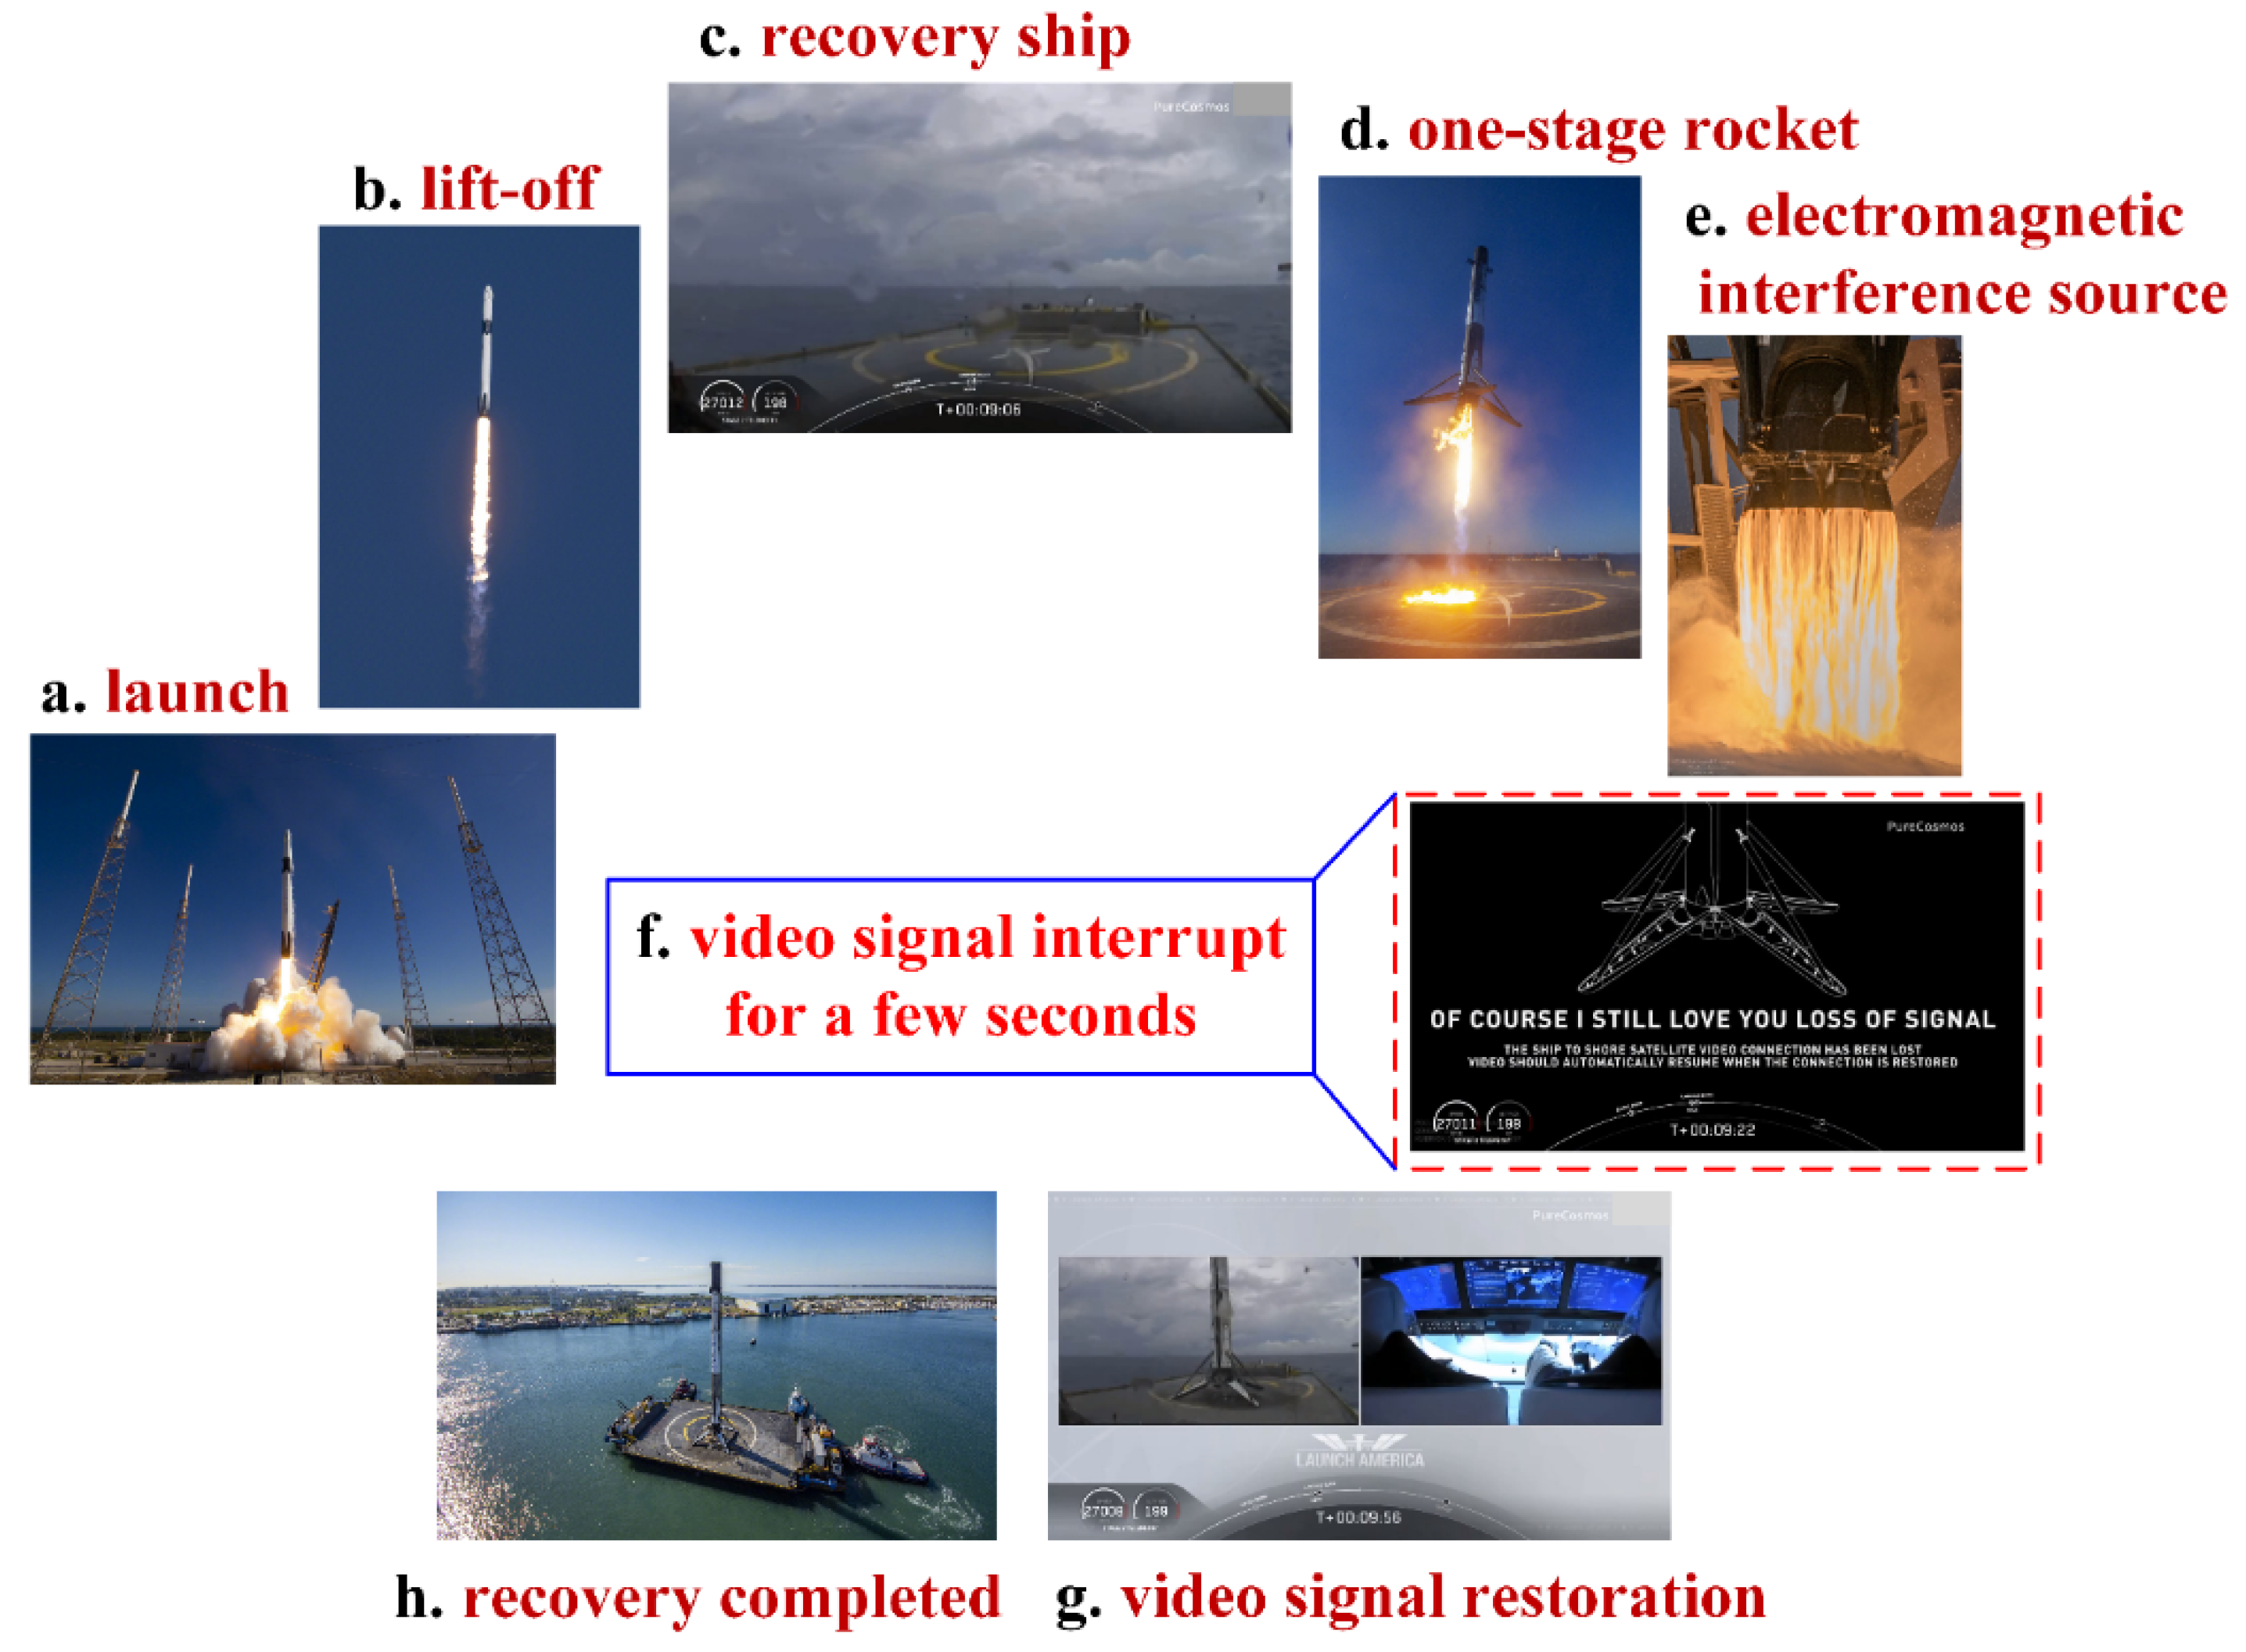
1. Introduction
2. Methods
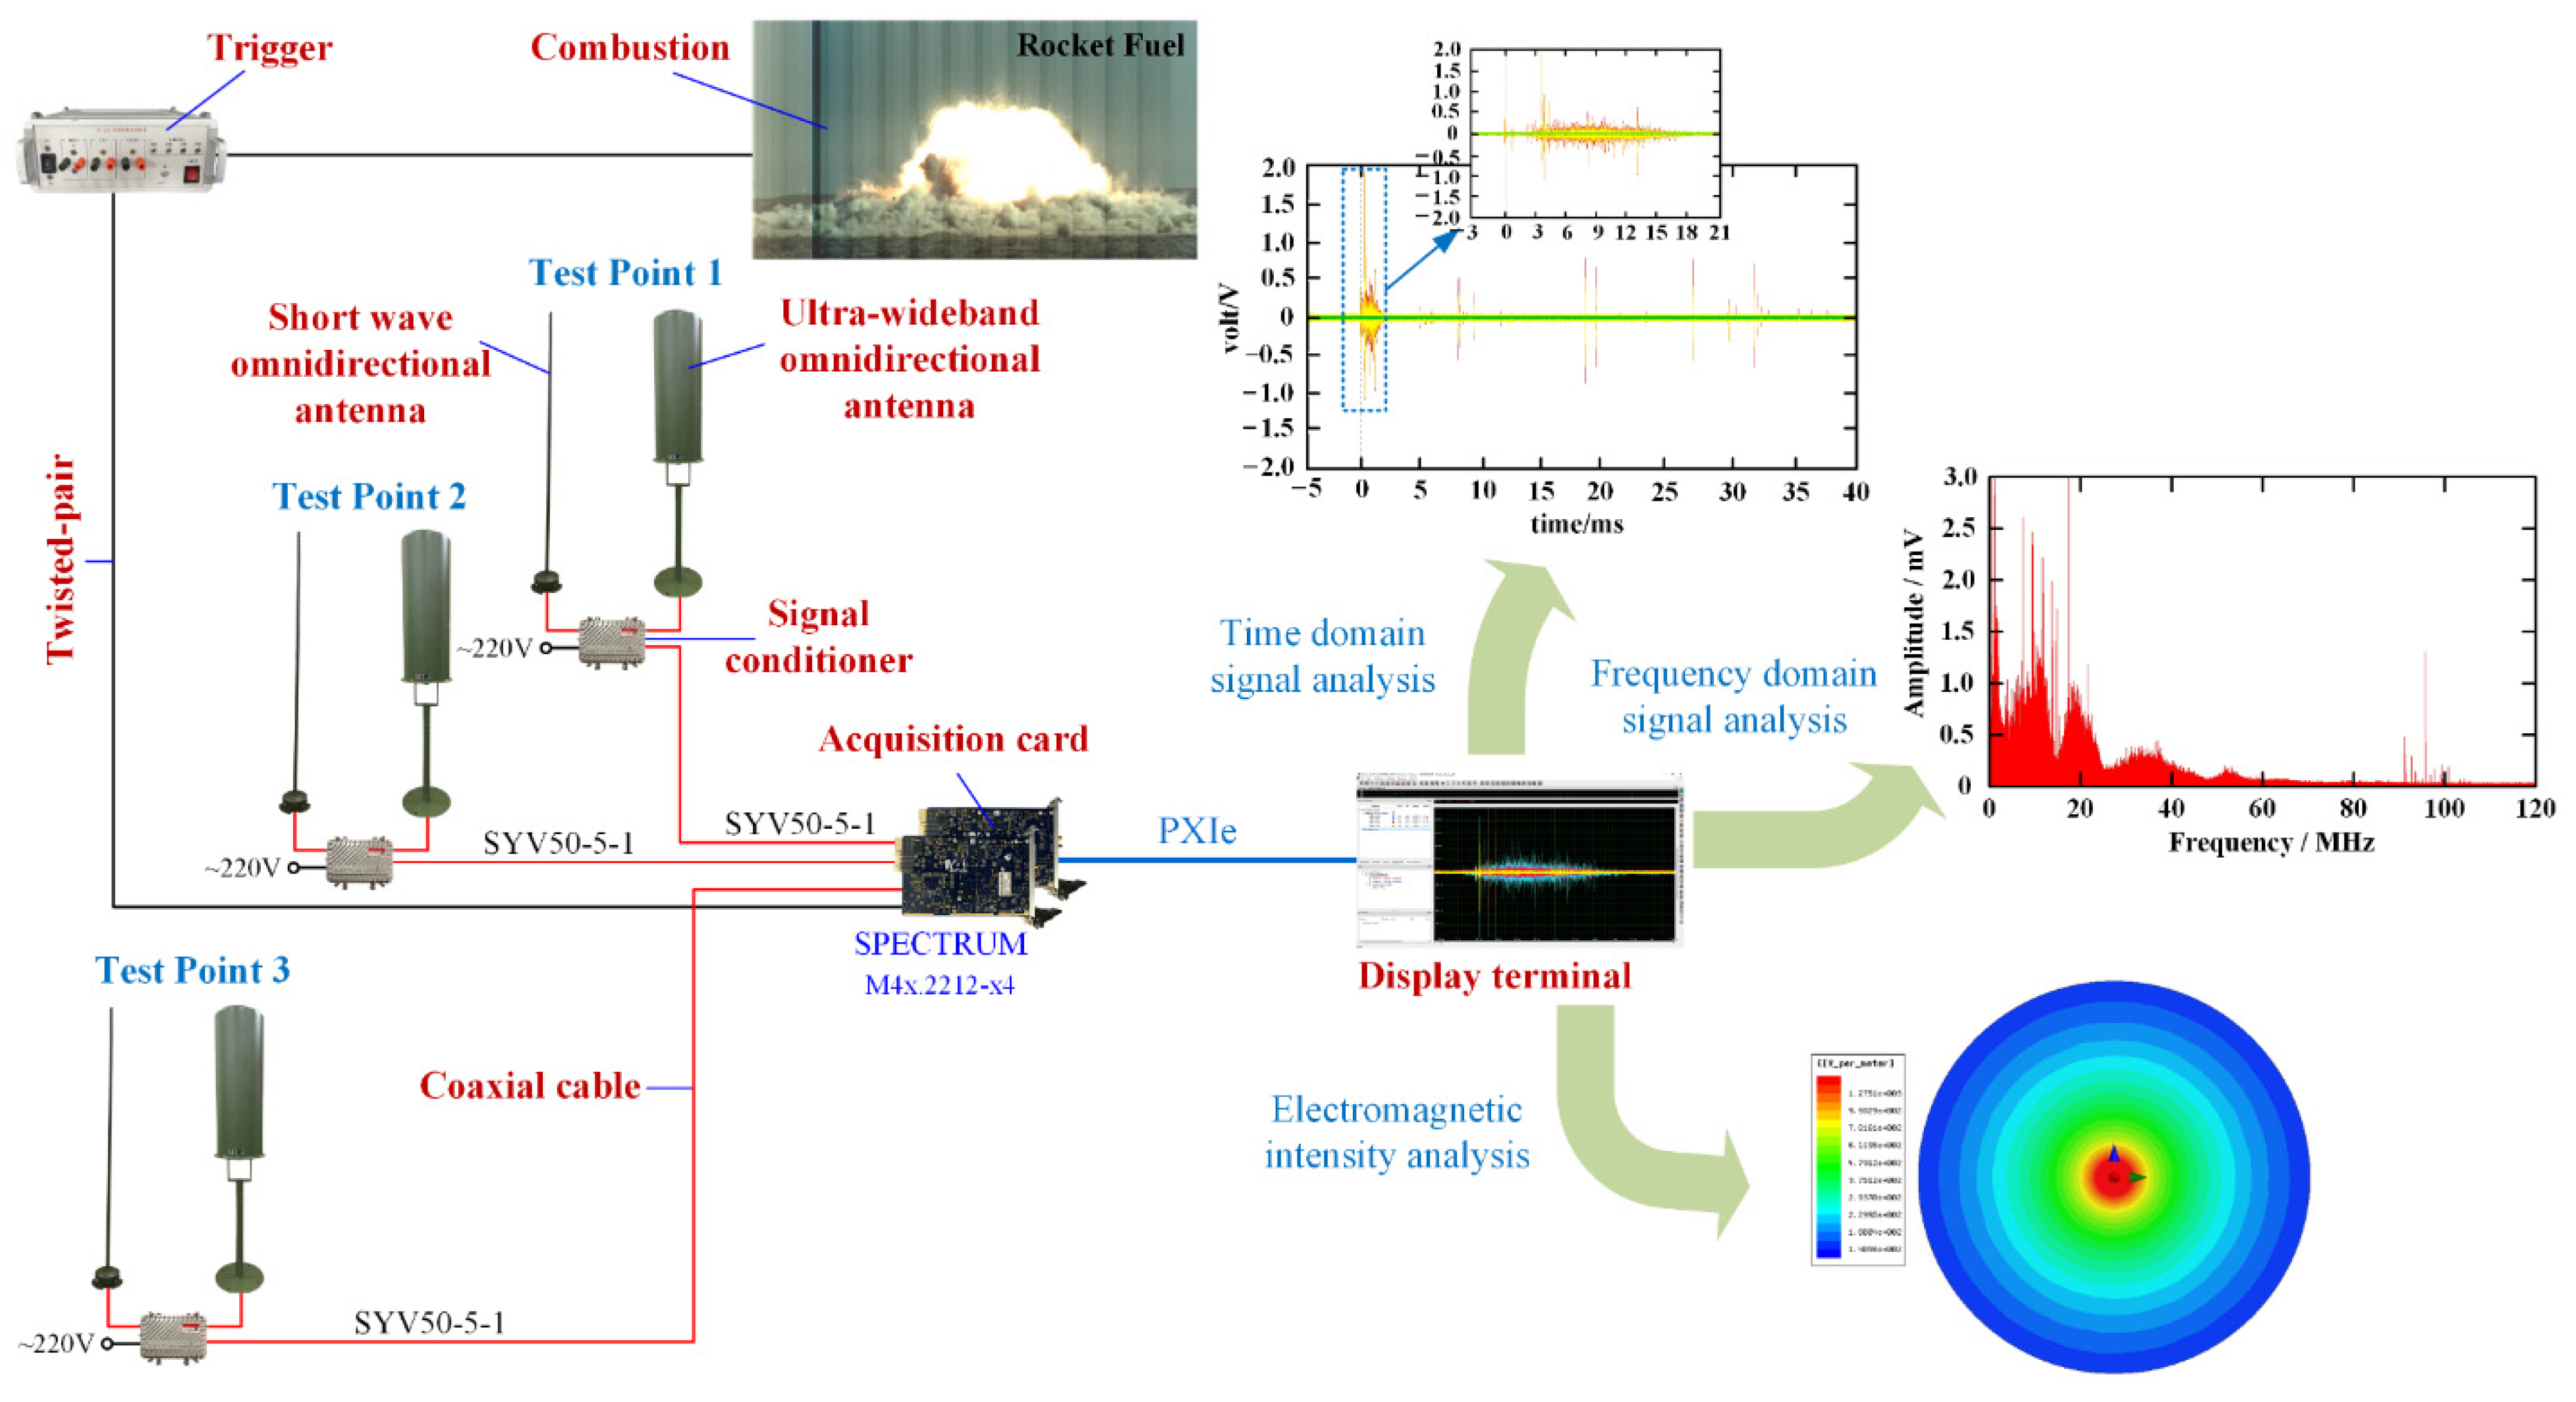
2.1. Experimental Setup
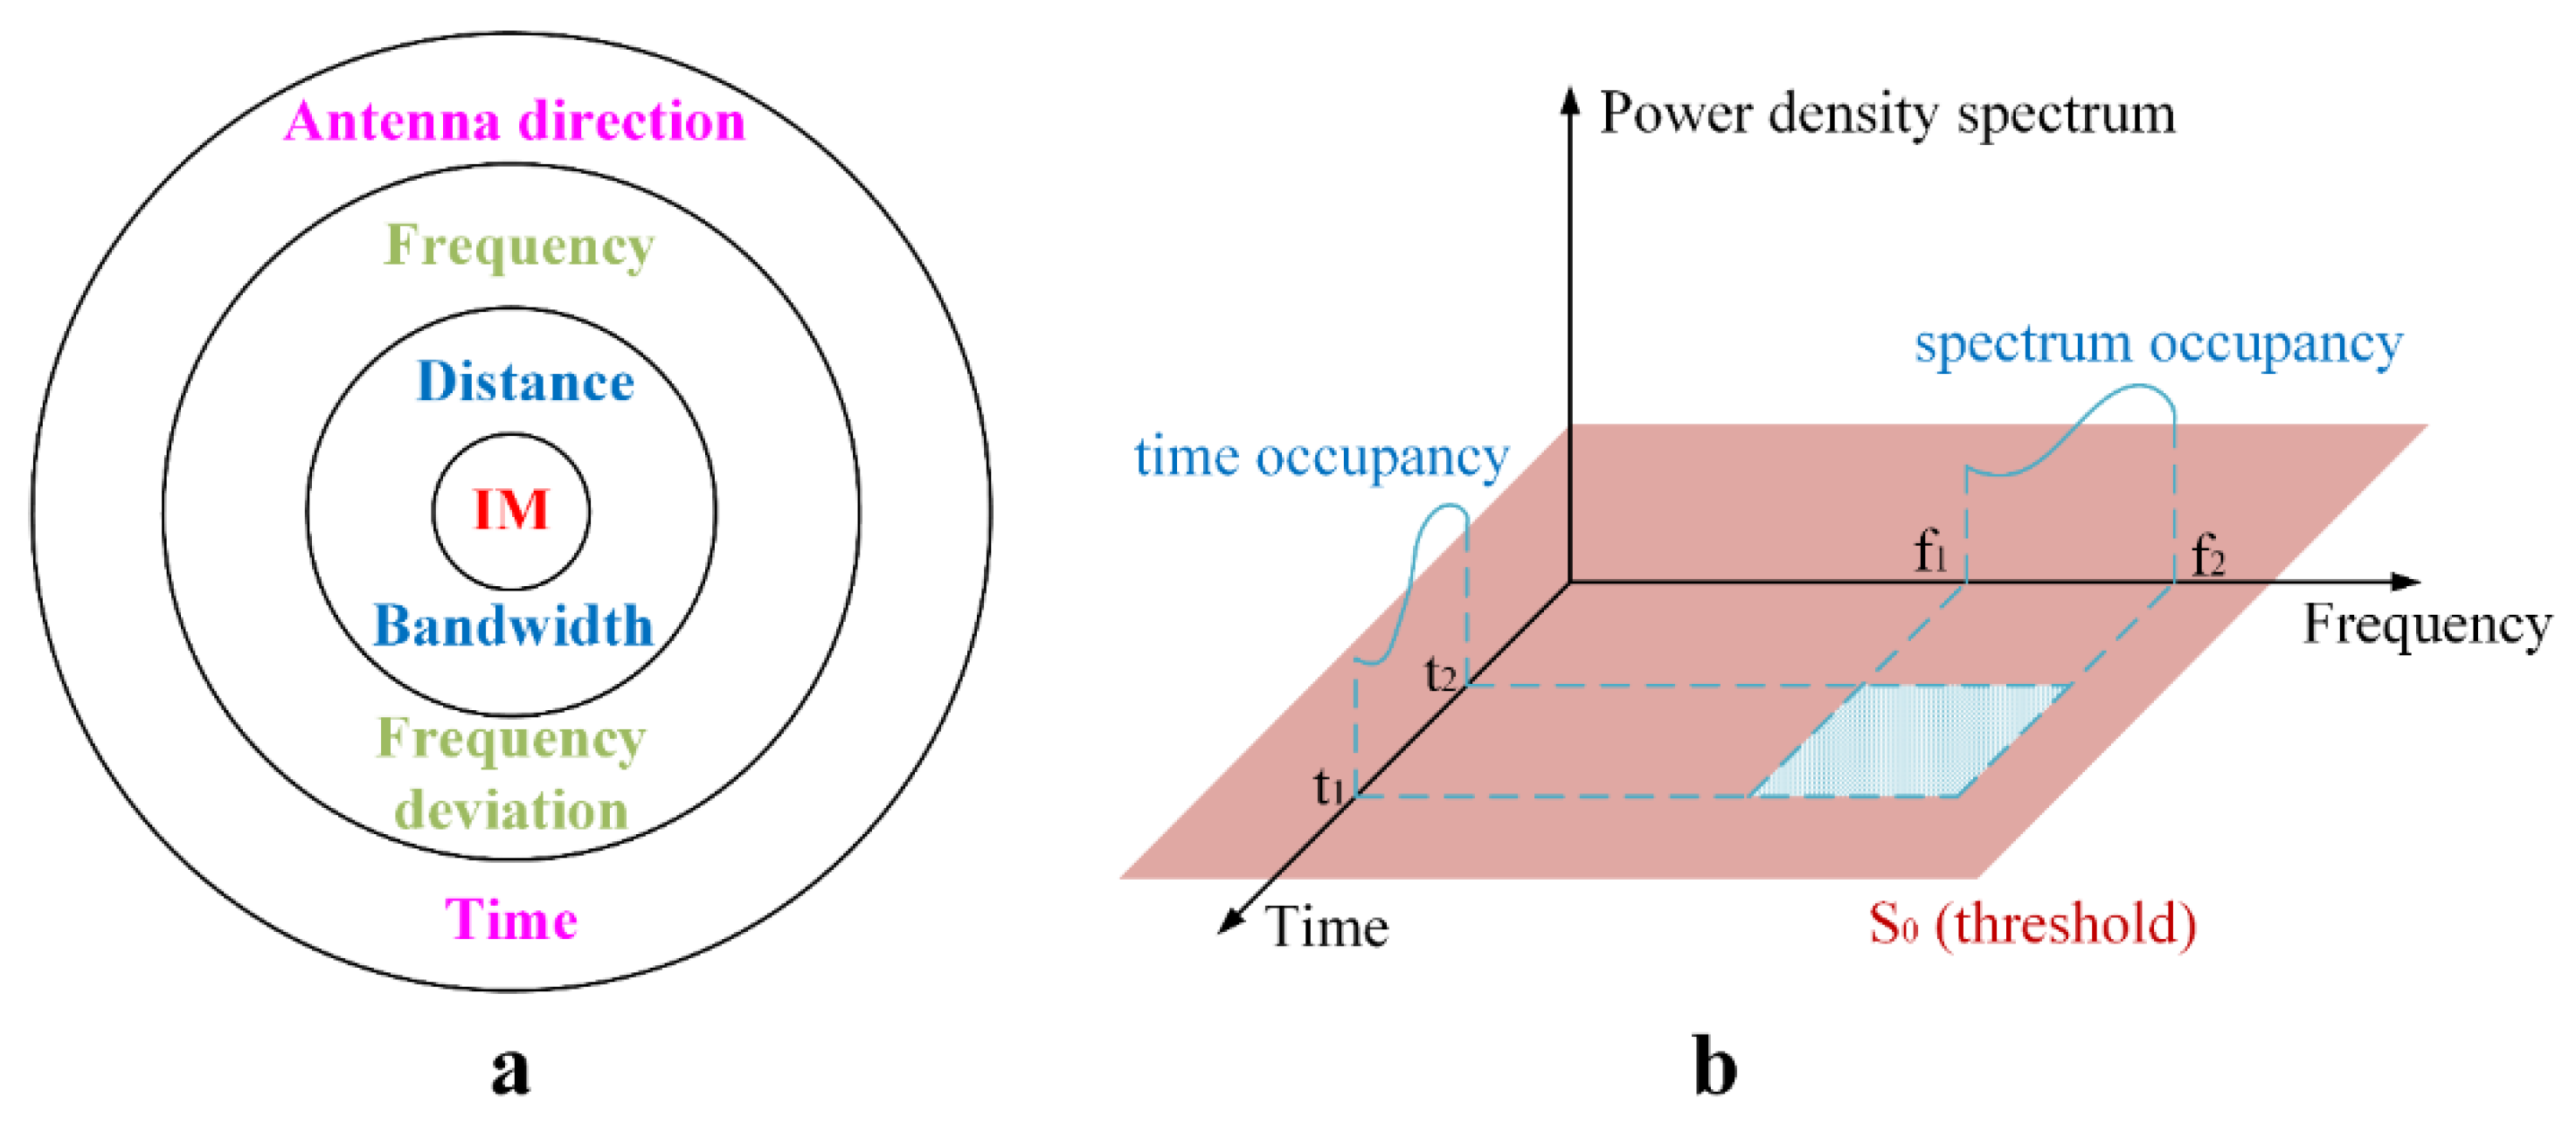
2.2. Data Processing Method
3. Electromagnetic Radiation Analysis and Modelling
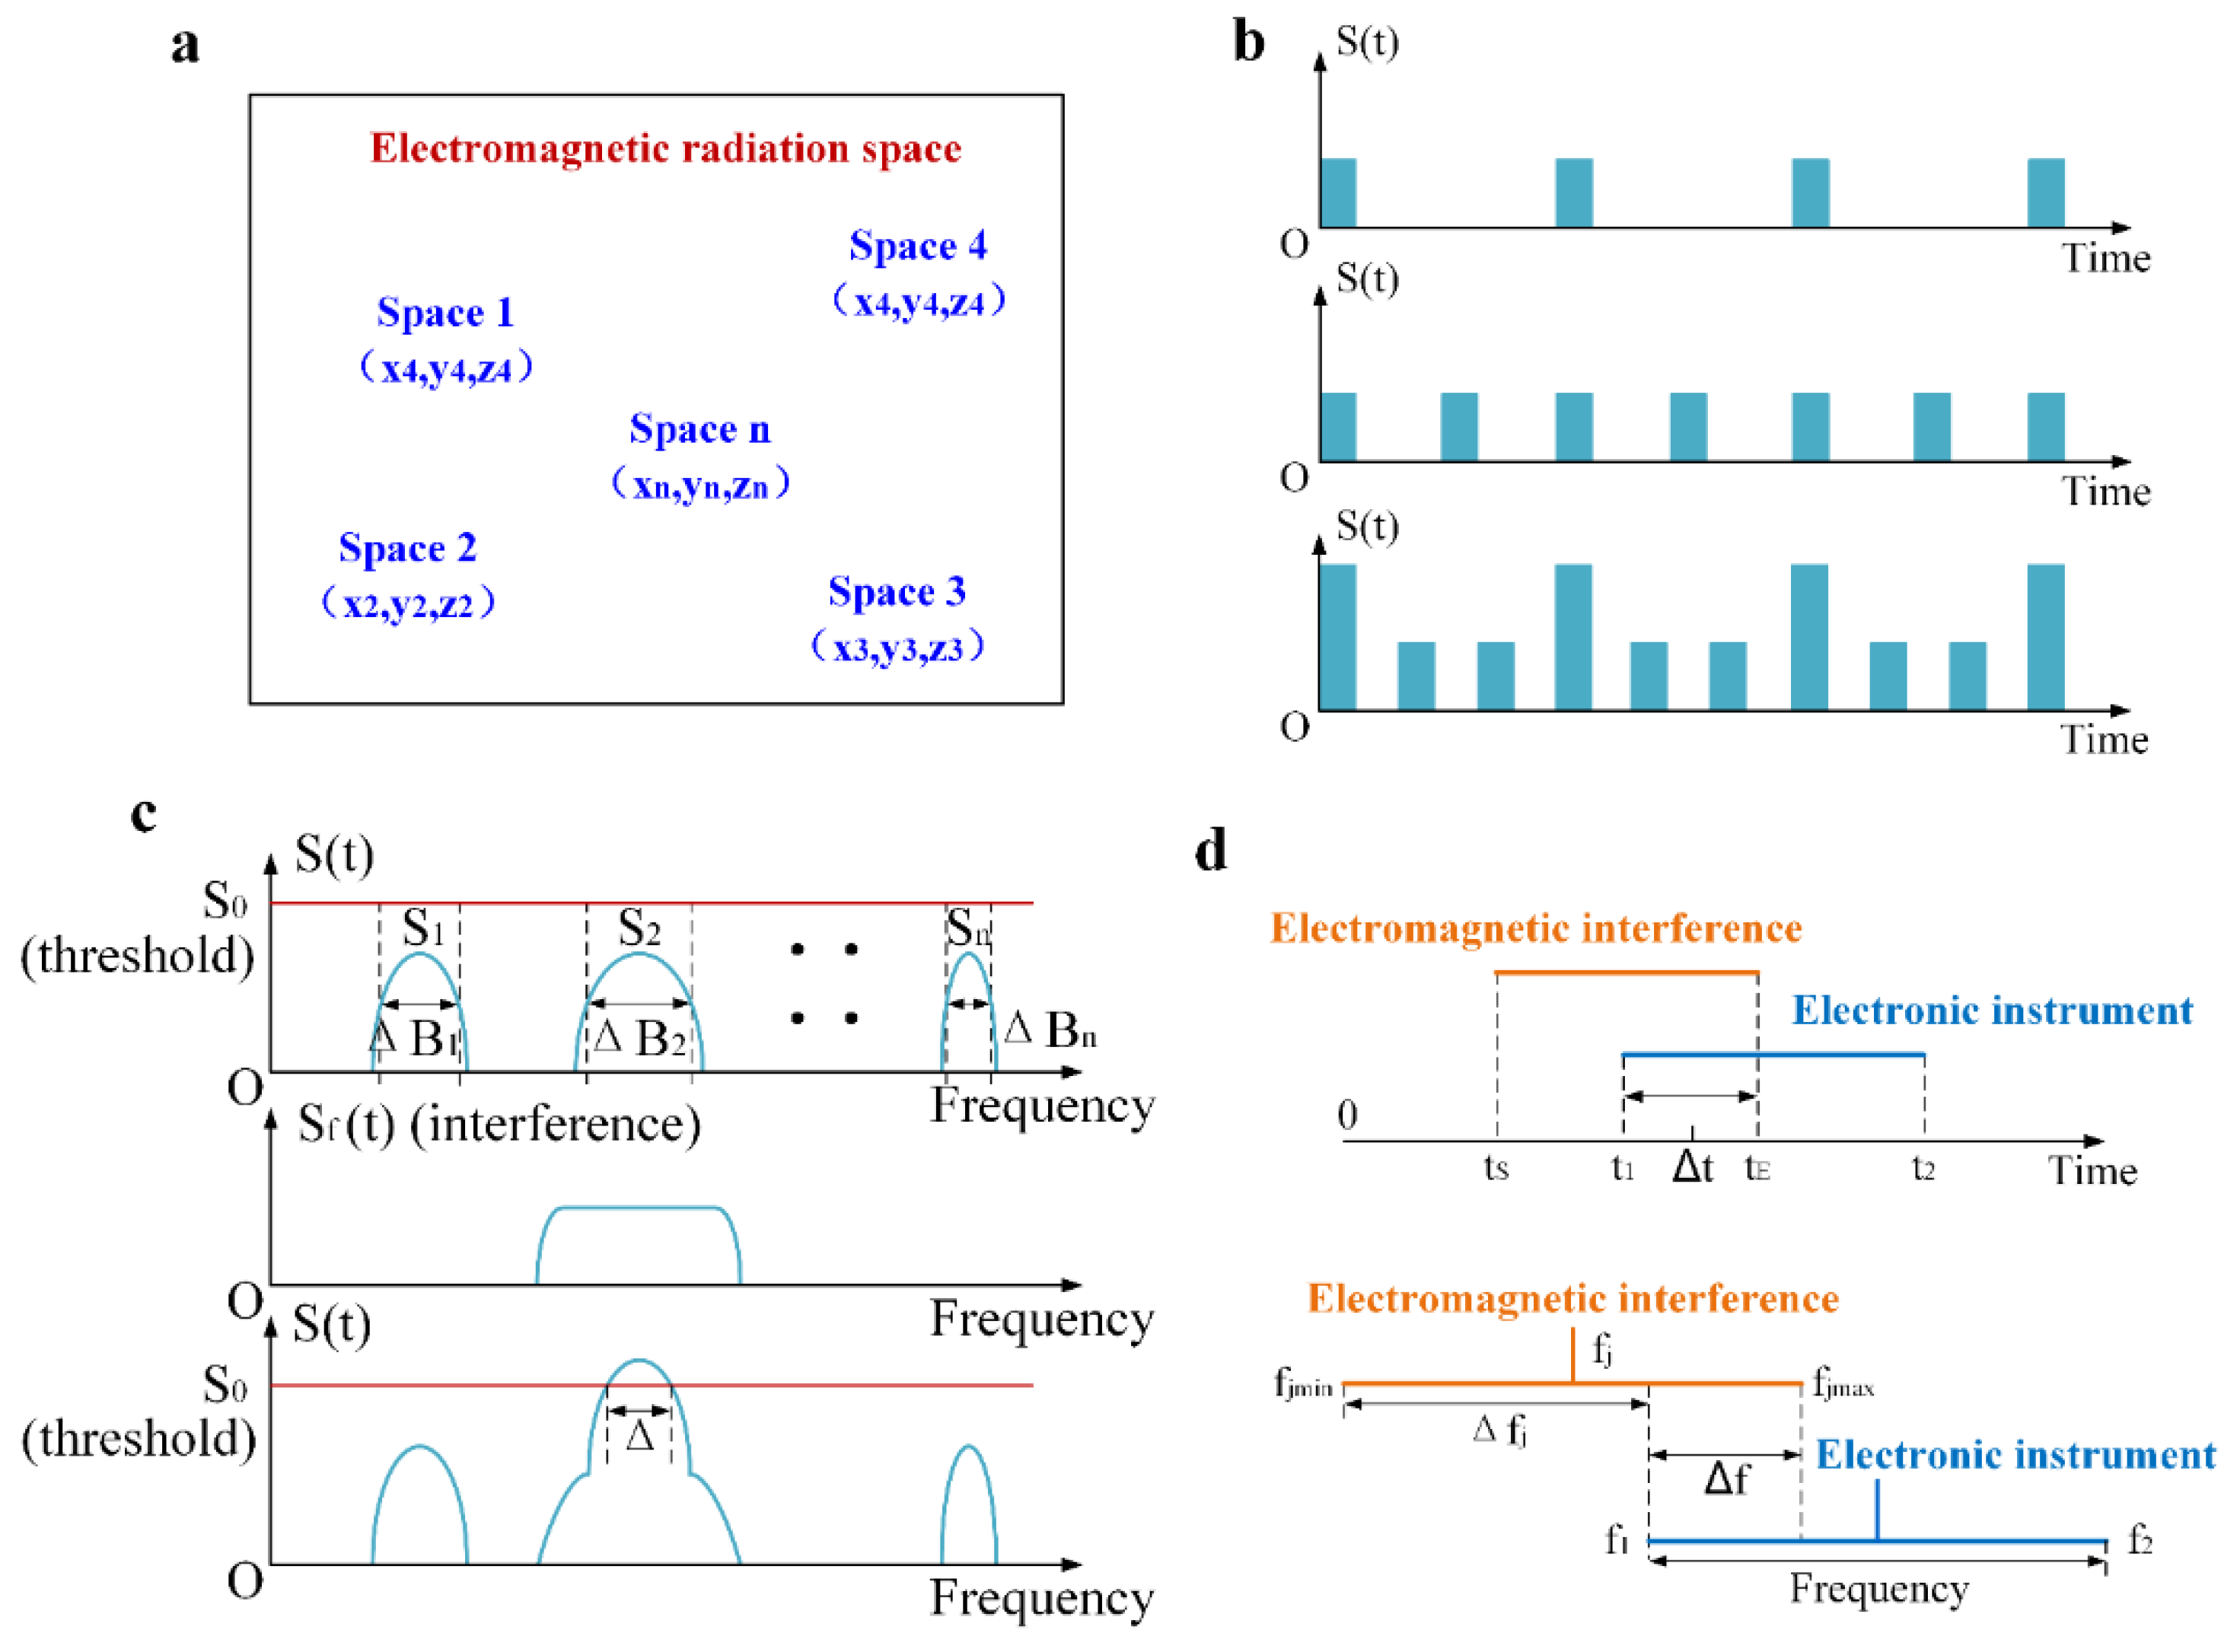
3.1. Analysis and Modelling of the Spatial Characteristics of Electromagnetic Radiation
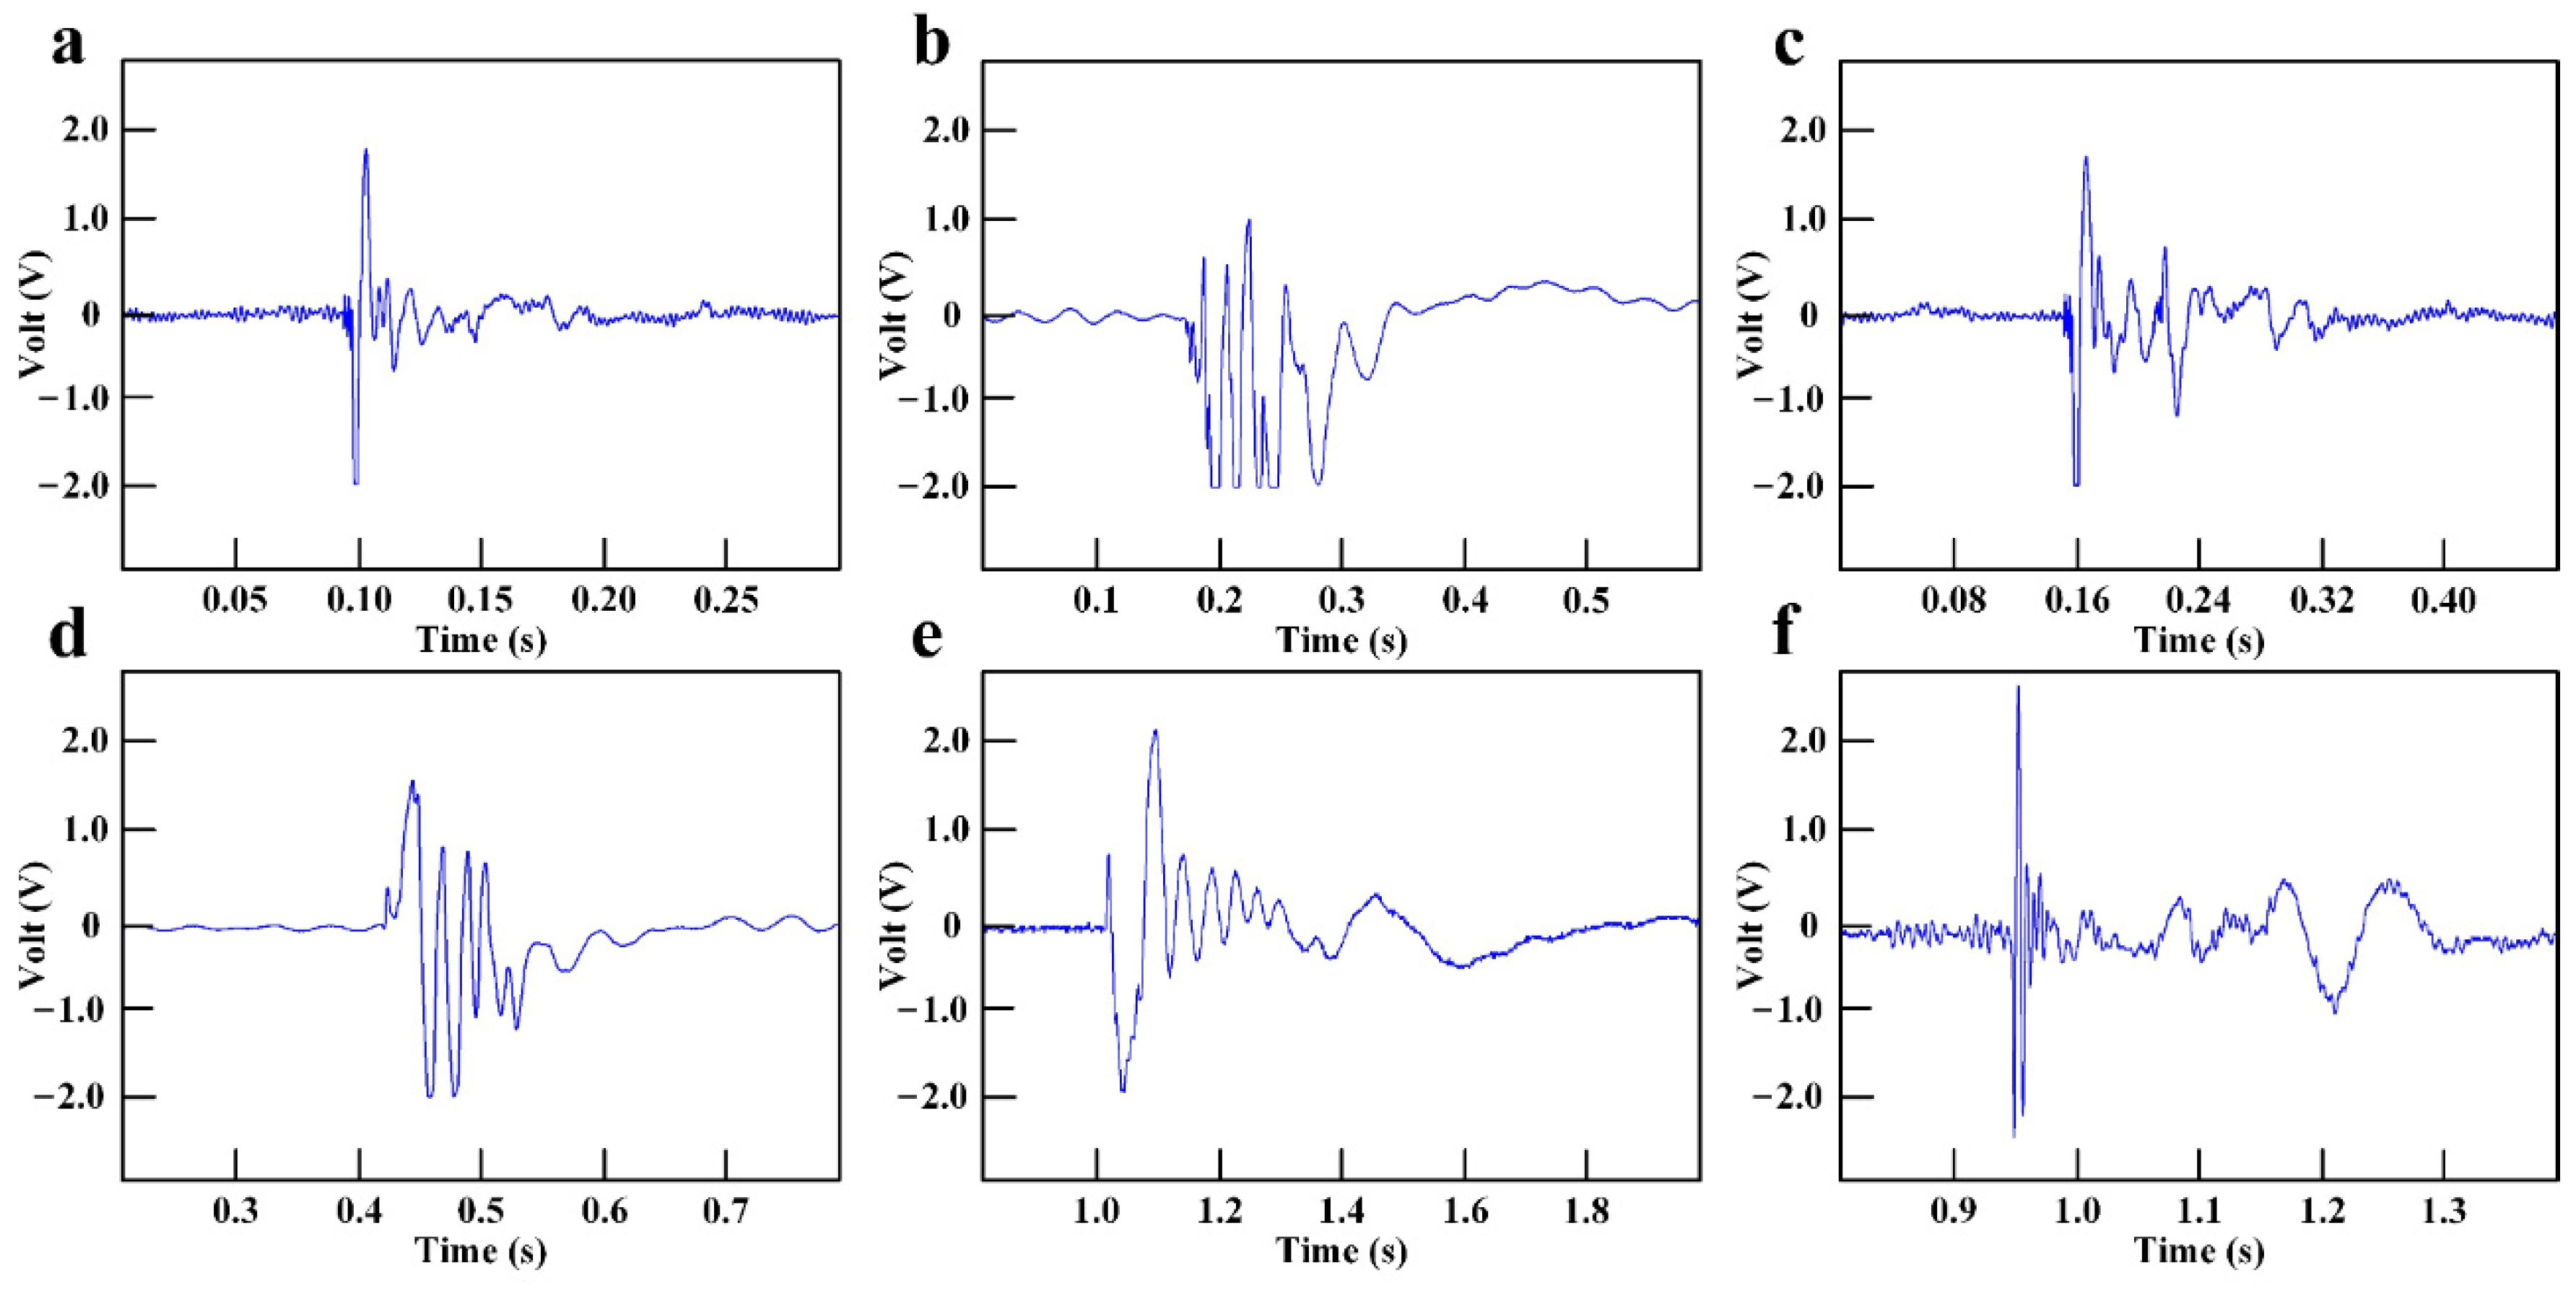
3.2. Analysis and Modelling of the Time-Domain Characteristics of Electromagnetic Radiation
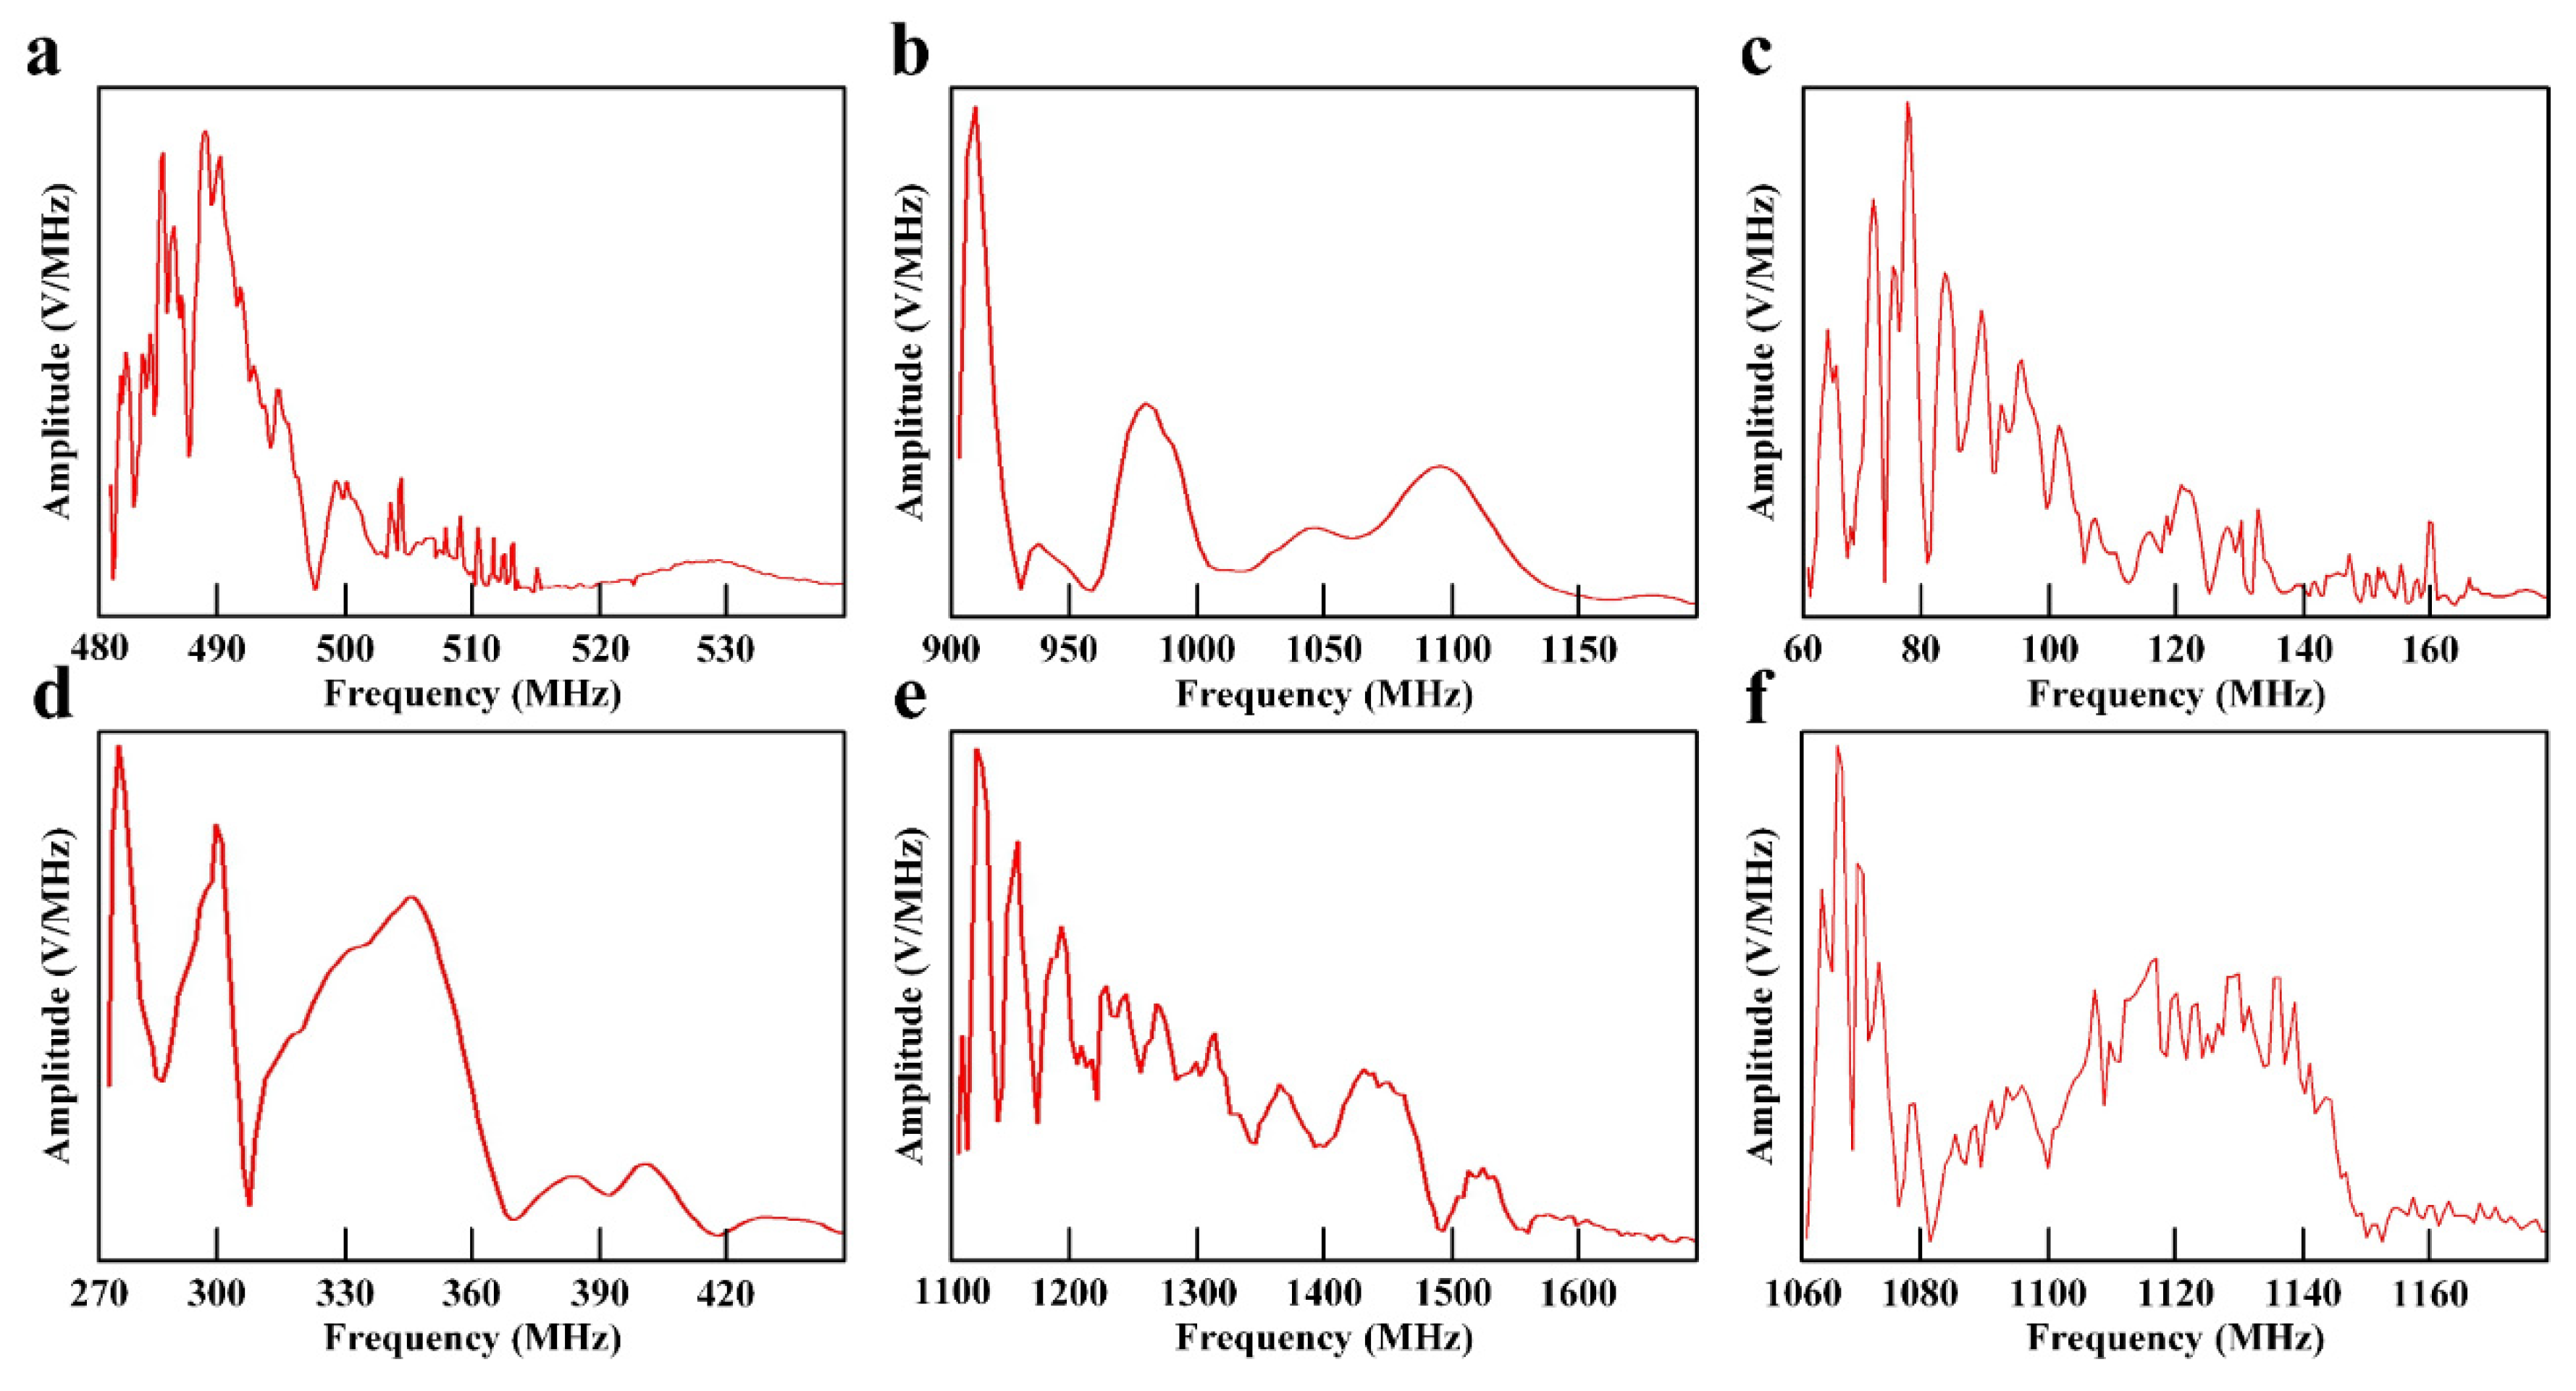
3.3. Analysis and Modelling of the Frequency-Domain Characteristics of Electromagnetic Radiation
3.4. Analysis and Modelling of the Energy-Domain Characteristics of the Electromagnetic Radiation
4. Experimental Results
5. Conclusions
Author Contributions
Funding
Institutional Review Board Statement
Informed Consent Statement
Data Availability Statement
Conflicts of Interest
References
- Li, W.; Zhao, D.; Chen, X.; Zhu, L.; Ni, S. Numerical investigation of inlet thermodynamic conditions on solid fuel ramjet performances. Int. J. Aerosp. Eng. 2021, 2021, 8868288. [Google Scholar] [CrossRef]
- Li, W.; Chen, X.; Qiu, S. Numerical investigation of effect of combustor length on combustion characteristics of solid fuel ramjet. J. Phys. Conf. Ser. 2020, 1510, 012001. [Google Scholar] [CrossRef]
- Gao, S.; Tian, G.; Dai, X.; Zhang, Q.; Wang, Z.; Yang, X.; Wang, Q.; Jia, N. A lightweight wireless qverpressure node based efficient monitoring for shock waves. IEEE/ASME Trans. Mechatron. 2021, 26, 448–457. [Google Scholar]
- Kuhl, A.L.; Bell, J.B.; Beckner, V.E. Heterogeneous continuum model of aluminum particle combustion in explosions. Combust. Explos. Shock Waves 2010, 46, 433–448. [Google Scholar] [CrossRef]
- Kolsky, H. Electromagnetic waves emitted on detonation of Explosives. Nature 1954, 173, 77. [Google Scholar] [CrossRef]
- Giri, D.V.; Tesche, F.M. Classification of intentional electromagnetic environments. IEEE Trans. Electromagn. Compat. 2004, 46, 322–328. [Google Scholar] [CrossRef]
- Adushkin, V.V.; Soloviev, S.P. Generation of electric and magnetic fields by air, surface, and underground explosions. Combust. Explos. Shock Waves 2004, 40, 649–657. [Google Scholar] [CrossRef]
- Boronin, A.P.; Vel’Min, V.A.; Medvedev, Y.A.; Stepanov, B.M. Experimental study of the electromagnetic field in the near zone of explosions produced by solid explosives. J. Appl. Mech. Tech. Phys. 1968, 9, 712–717. [Google Scholar] [CrossRef]
- Boronin, A.P.; Kapinos, V.N.; Krenev, S.A.; Mineev, V.N. Physical mechanism of electromagnetic field generation during the explosion of condensed explosive charges. Combust. Explos. Shock Waves 1990, 26, 597–602. [Google Scholar] [CrossRef]
- Nevels, R.; Jeong, J. The time domain Green’s function and propagator for Maxwell’s equations. Antennas Propag. IEEE Trans. 2004, 52, 3012–3018. [Google Scholar] [CrossRef]
- Soloviev, S.P. Generation of electric and magnetic field during detonation of high explosive charges in boreholes. J. Geophys. Res. Solid Earth 2005, 110, 1–14. [Google Scholar] [CrossRef]
- Kuhl, A.; Bell, J.; Beckner, V.; Reichenbach, H. Gasdynamic model of turbulent combustion in TNT explosions. Proc. Combust. Inst. 2011, 33, 2177–2185. [Google Scholar] [CrossRef]
- Kuhl, A.L.; White, D.A.; Kirkendall, B.A. Electromagnetic waves from TNT explosions. J. Electromagn. Anal. Appl. 2014, 6, 280–295. [Google Scholar] [CrossRef][Green Version]
- Cui, Y.B.; Kong, D.R. Analysis of electromagnetic radiation spectrum during the explosion of energetic materials. IOP Conf. Ser. Earth Environ. Sci. 2020, 585, 012026. [Google Scholar]
- Zhu, D.W.; Chen, H.L.; Chen, B.; Duan, Y.T.; Xu, B.A.; Luo, K. Improved ADI iterative algorithm with two-step gauss–seidel procedure for efficient laguerre-based BOR–FDTD method. IET Microw. Antennas Propag. 2019, 13, 942–949. [Google Scholar] [CrossRef]
- Ren, H.; Chu, Z.; Li, J. Study on electromagnetic radiation generated during detonation. Propellants Explos. Pyrotech. 2019, 44, 1541–1553. [Google Scholar] [CrossRef]
- Chen, H.; Pan, X.; He, Y.; Jiao, J.; Shen, J.; Ben, C. Measurement of time-varying electron density of the plasma generated from a small-size cylindrical RDX explosion by Rayleigh microwave scattering. Plasma Sci. Technol. 2021, 23, 045401. [Google Scholar] [CrossRef]
- Jaekel, B.W. Electromagnetic environments-phenomena, classification, compatibility and immunity levels. In Proceedings of the IEEE EUROCON 2009, St. Petersburg, Russia, 18–23 May 2009; pp. 1498–1502. [Google Scholar] [CrossRef]
- Gao, S.; Tian, G.Y.; Dai, X.; Fan, M.; Shi, X.; Zhu, J.; Li, K. A novel distributed linear-spatial-array sensing system based on multichannel LPWAN for large-scale blast wave monitoring. IEEE Internet Things J. 2019, 6, 9679–9688. [Google Scholar] [CrossRef]
- Kuhl, A.L.; Bell, J.B.; Beckner, V.E.; Balakrishnan, K.; Aspden, A.J. Spherical combustion clouds in explosions. Shock Waves 2013, 23, 233–249. [Google Scholar] [CrossRef]
- Wang, F.; Chen, M.; Wang, L. The discussion on the evaluation method of battlefield electromagnetic environment complexity. In Proceedings of the 6th International Conference on Big Data and Information Analytics (BigDIA), Shenzhen, China, 4–6 December 2020; pp. 440–442. [Google Scholar]
- Zhu, D.W.; Chen, H.L.; Yang, J.; Yi, Y.; Chen, B. A novel efficient WLP-based BOR FDTD Method with explicit treating ideology. IEEE Access 2019, 7, 16858–16869. [Google Scholar] [CrossRef]
- Xiong, J.L.; Wu, Z.C.; Sun, Y.; Liu, X.Y. Analysis and feature modeling of battlefield electromagnetic environment of radio fuze. In Proceedings of the Cross Strait Quad-Regional Radio Science and Wireless Technology Conference, Chengdu, China, 21–25 July 2013; pp. 316–320. [Google Scholar]
- Zhu, D.W.; Wang, Y.G.; Chen, H.L.; Chen, B. A one-step leapfrog HIE-FDTD method for rotationally symmetric structures. Int. J. RF Microw. Comput.-Aided Eng. 2017, 27, 1–7. [Google Scholar] [CrossRef]
- Zhu, S.K.; Yang, R.J.; Zuo, J.J.; Li, D.J. Optimization method of OFDM shared signal frequency resource based on complexity of electromagnetic environment. In Proceedings of the International Conference on Information Technology and Computer Application (ITCA), Guangzhou, China, 20–22 December 2019; pp. 79–82. [Google Scholar]
- Tang, X.B.; Gao, B.; Zhang, Y. Design Technology of System-Level EMC Engineering; De Gruyter: Berlin, Germany; Boston, MA, USA, 2020. [Google Scholar]
- Peng, H.L.; Yin, W.Y.; Mao, J.F.; Huo, D.; Hang, X.; Zhou, L. A compact dual-polarized broadband antenna with hybrid beam-forming capabilities. Prog. Electromagn. Res. 2011, 118, 253–271. [Google Scholar] [CrossRef][Green Version]


| Parameter | Explanation | Unit |
|---|---|---|
| Start angle of the scanning azimuth of Device A | ° | |
| End angle of the scanning azimuth of Device A | ° | |
| Start angle of the pitch scanning azimuth of Device A | ° | |
| End angle of the pitch scanning azimuth of Device A | ° | |
| U | Unit step function | - |
| Start frequency of Device A | MHz | |
| Stop frequency of Device A | MHz | |
| Start time of Device A | s | |
| End time of Device A | s | |
| Average power density spectrum of the electromagnetic environment around Device A | W/(m2·Hz) | |
| Azimuth angle of Device X relative to Device A at time t | ° | |
| Pitch angle of Device X relative to Device A at time t | ° | |
| Electromagnetic environment threshold for normal operation of Device A | W/(m2·Hz) | |
| tE | Upper limit of the time of the radiation source | s |
| tS | Lower limit of the time of the radiation source | s |
| Upper limit of the signal bandwidth of the radiation source | MHz | |
| Lower limit of the signal bandwidth of the radiation source | MHz |
| Cases | Combination | Mixture Ratio | Mass/kg |
|---|---|---|---|
| 1 | Lox-Hydrogen | 6 | 1000 |
| 2 | H2O4-Hydrazine | 1.08 | 1000 |
| 3 | AP-HTPB-Al | 5.17 | 1000 |
| 4 | Lox-Methane | 2.77 | 1000 |
| 5 | Lox-Propane | 1.7 | 1000 |
| 6 | Lox-Kerosene | 2.33 | 1000 |
| Classification | Complexity Index | Classification | Threat Level |
|---|---|---|---|
| Level A | Level I | ||
| Level B | Level II | ||
| Level C | Level III | ||
| Level D | Level IV | ||
| Level E | Level V |
| Case | tS/s | tE/s | fjmin/MHz | fjmax/MHz | ∆t/s | ∆f/MHz | Complexity Index | Threat Level |
|---|---|---|---|---|---|---|---|---|
| 1 | 0.09 | 0.13 | 480 | 515 | 0.04 | 35 | A | I |
| 2 | 0.18 | 0.34 | 900 | 1150 | 0.16 | 250 | B | IV |
| 3 | 0.16 | 0.32 | 60 | 160 | 0.16 | 100 | B | II |
| 4 | 0.42 | 0.60 | 270 | 420 | 0.18 | 150 | B | III |
| 5 | 1.00 | 1.60 | 1100 | 1550 | 0.60 | 450 | E | V |
| 6 | 0.95 | 1.30 | 1060 | 1150 | 0.35 | 90 | C | I |
Publisher’s Note: MDPI stays neutral with regard to jurisdictional claims in published maps and institutional affiliations. |
© 2021 by the authors. Licensee MDPI, Basel, Switzerland. This article is an open access article distributed under the terms and conditions of the Creative Commons Attribution (CC BY) license (https://creativecommons.org/licenses/by/4.0/).
Share and Cite
Cui, Y.; Jiang, J.; Kong, D.; Gao, S.; Wang, S. Study on Electromagnetic Radiation Interference Caused by Rocket Fuel. Sensors 2021, 21, 8123. https://doi.org/10.3390/s21238123
Cui Y, Jiang J, Kong D, Gao S, Wang S. Study on Electromagnetic Radiation Interference Caused by Rocket Fuel. Sensors. 2021; 21(23):8123. https://doi.org/10.3390/s21238123
Chicago/Turabian StyleCui, Yuanbo, Jian Jiang, Deren Kong, Shang Gao, and Shuai Wang. 2021. "Study on Electromagnetic Radiation Interference Caused by Rocket Fuel" Sensors 21, no. 23: 8123. https://doi.org/10.3390/s21238123
APA StyleCui, Y., Jiang, J., Kong, D., Gao, S., & Wang, S. (2021). Study on Electromagnetic Radiation Interference Caused by Rocket Fuel. Sensors, 21(23), 8123. https://doi.org/10.3390/s21238123