Abstract
Organophosphates (OPs) are neurotoxic agents also used as pesticides that can permanently block the active site of the acetylcholinesterase (AChE). A robust and sensitive detection system of OPs utilising the enzyme mimic potential of the cysteamine capped gold nanoparticles (C-AuNPs) was developed. The detection assay was performed by stepwise addition of AChE, parathion ethyl (PE)-a candidate OP, acetylcholine chloride (ACh), C-AuNPs, and 3, 3′, 5, 5′-tetramethylbenzidine (TMB) in the buffer solution. The whole sensing protocol completes in 30–40 min, including both incubations. The Transmission Electron Microscopy (TEM) results indicated that the NPs are spherical and have an average size of 13.24 nm. The monomers of C-AuNPs exhibited intense catalytic activity (nanozyme) for the oxidization of TMB, revealed by the production of instant blue colour and confirmed by a sharp peak at 652 nm. The proposed biosensor’s detection limit and linear ranges were 5.8 ng·mL−1 and 11.6–92.8 ng·mL−1, respectively, for PE. The results strongly advocate that the suggested facile colorimetric biosensor may provide an excellent platform for on-site monitoring of OPs.
1. Introduction
Organophosphates (OPs) are commonly used as chemical warfare agents and pesticides in developing countries due to their low cost, wide availability, and high potency [1,2]. Due to their inclusive efficacy as insecticides (methyl parathion, chlorpyrifos), herbicides (glyphosate, diuron), nematicide (carbofuran, carbaryl), and fungicides (imazalil, thiabendazole); the OP pesticides have extensively been applied in agricultural pest control. The residues of the OPs, which have a long persistence in the natural environment, pose a severe threat to terrestrial and aquatic animals [3]. Even low-dose exposures of OPs for a long time can induce adversative health effects on fauna [4]. According to the U.S. Environmental Protection Agency, OPs are highly toxic and categorized as the most toxic “Class 1” compound [5,6]. The presence of OPs leads to the malfunctioning of the central and peripheral nervous system by blocking the active site of AChE (EC 3.1.1.7), a prime functioning enzyme of the nervous system and the neurotransmitters. The enzyme controls the level of acetylcholine (ACh) by catalysing it into choline and acetate at the synapse, which leads to the culmination of neurotransmission. Accumulation of ACh interferes with muscular functions, respiration, fluctuation in blood pressure, myocardial abnormalities, seizures, and ultimately death [7,8].
A number of approaches have been adopted to detect the OPs as mentioned in the Table 1. Detection of OP compounds has been traditionally performed with analytical methods such as gas chromatography (GC) [9], high-performance liquid chromatography (HPLC) [10], capillary electrophoresis [11], surface plasmon resonance [12], fluorimetry [13], and spectroscopic methods [14,15]. Although these techniques have been standardized, none of these methods is suitable for on-site monitoring and rapid detection of OPs [16]. Biosensor-based detection of neurotoxins has the potential to be easy, rapid, cost-effective, portable, specific, and highly sensitive without the need for lengthy procedures [7]. Electrochemical biosensors for OPs detection have proven successful biosensing methods because of simple instruments, high reliability, and compatibility with complex samples [17,18].

Table 1.
Summarizes different methods that are devised for the detection of OP compounds.
Among biosensing detection methods, enzyme-based biosensors can be an excellent alternative for detecting insecticides and pesticides, including OPs, because these toxins are enriched with compounds that can block the diverse enzymes of insects and pests [19], including AChE. Oxidase mimicking materials such as MnO2 nanosheets and surface-modified cerium oxide nanoparticles have been used to generate signals for detection of OPs by colorimetry via TMB oxidation [20,21]. TMB, nanozymes, and hydrogen peroxide (H2O2) based colorimetric detection systems have been employed in prior works [22,23,24].
The term “nanozyme” was coined first time to describe gold nanoparticles (AuNPs) possessing the capability of transphosphorylation [25]. Nanozymes are those nanomaterials capable of mimicking the functions of enzymes [26] as these easy-to-synthesise materials exhibited higher stability than proteins under harsh conditions [27,28]. Consequently, their applications in environmental monitoring [29,30] are highly desirable. Enzyme mimicking materials can be categorized into two classes, oxidoreductases and hydrolases [31]. Colorimetric nanozyme based biosensing of OPs is a simple approach due to the on-site monitoring of these compounds with naked eyes, and without the requirements of readout instrument.
In the current study, the peroxidase-like activity of C-AuNPs was exploited to detect PE by a convenient colorimetric assay. C-AuNPs were able to produce some definite colorimetric response with a chromogenic agent (TMB). Additionally, the C-AuNPs provided indirect indication about functional and non-functional states of AChE. The distinctive feature of the developed method is that naked-eye detection of PE is plausible by monitoring the colour of the reaction.
2. Materials and Methods
AChE (from Electrophorus electricus), ACh, gold salt (HAuCl4·3H2O), and PE were purchased from Sigma Aldrich, St. Louis, MO, USA. TMB was obtained from MOSS Inc., Chicago, IL, USA. All chemicals were of analytical grade and used as received.
2.1. Synthesis of C-AuNPs
Standard and working solutions of HAuCl4·3H2O, cysteamine, and sodium borohydride (NaBH4) were prepared using Milli Q water (18.25 MΩ·cm) in volumetric flasks. C-AuNPs were synthesized by adopting the method, with necessary modifications elaborated by Ren et al. [42]. Briefly, 1.42 mM solution (40 mL) of HAuCl4·3H2O was sonicated for 5.0 min and mixed with 400 µL of cysteamine solution at a concentration of 213 mM, followed by continuous stirring at 500 rpm for 20 min in an amber flask. A capping solution consisting of 10 mM (10 µL) NaBH4 was added and kept at constant stirring for an additional 30 min at room temperature. To remove the unreacted species and unbound cysteamine ligands from colloidal C-AuNPs, the solution was centrifuged at 12,000 rpm at room temperature for 20 min. The supernatant was removed, and the pellet was resuspended in Milli Q water (18.25 MΩ·cm). After confirmation of successful synthesis of C-AuNPs via UV-Vis, the colloidal solution was stored at 4 °C to avoid further aggregation.
2.2. Characterization of the C-AuNPs
The colloidal solution of 100 pM was used for the UV-Vis and Zeta potential analysis of C-AuNPs. Absorption measurements were performed with Nanodrop UV-Vis Spectrophotometer (Thermo Scientific, Loughborough, UK). A wavelength range of 300–800 nm with an increment of 0.5 nm was applied to absorb UV-Vis at room temperature. Surface charge density (Zeta potential) was measured with a zeta sizer (Malvern Zetasizer, Nano ZS-90, Malvern, UK) by using disposable cells DTS 1070. Average surface charge density was calculated by taking a mean of three measurements. TEM at 197 kV was performed on a JEOL TEM 2100 LaB6 thermionic gun, USA. The samples for TEM analysis were prepared by adopting the drop-casting method. ImageJ software was employed to obtain the average size by generating a histogram of C-AuNPs.
2.3. Optimization of Reagents and Reactions
The factors involved in the enzymatic hydrolysis of ACh and the chromogenic reaction (oxidation) of TMB by C-AuNPs were optimized. These include the pH for enzymatic and chromogenic reactions, incubation time for enzymatic hydrolysis, and the respective concentrations of ACh, TMB, and C-AuNPs. Relative absorbance ∆A (∆A = A0 − A) was used for the optimization, where A0 and A are the absorbances at 652 nm in the absence and presence of AChE respectively. Details of the optimization procedure are reported in the Supplementary Materials (Sections S1 and S2).
2.4. Protocol for AChE Assay via TMB Oxidation
To determine the hydrolysis of ACh by AChE, stock solution (0.5 U·mL−1) and working solution (2.0 m U·mL−1) of AChE were prepared using 20 mM Tris–HCl buffer (pH 7.5). Similarly, working solutions of ACh (4.0 mmol·L−1) and TMB (0.4 mmol·L−1) were made using Milli Q water and 100 mM sodium acetate buffer (pH 4.0), respectively. The assay was established by pipetting 50 µL of Tris-HCl buffer (100 mM, pH 7.6), 25 µL of AChE (2 mU·mL−1), and different concentrations of 20 µL ACh in a micro-centrifuge tube and incubated for 20 min at 37 °C. Then 50 µL of sodium acetate buffer (100 mM, pH 4.0), 25 µL of 0.4 mmol·L−1 TMB, 20 µL of C-AuNPs colloidal solution (100 pM), and 20 µL of the above solution were mixed thoroughly. The UV-Vis spectrums of the resultant solutions were measured, and the decrease in absorption at 652 nm depicting the aggregation effect of choline as an enzymatic product of AChE activity was measured.
2.5. Protocol for Sensing of Parathion Ethyl by C-AuNPs Probe
The insecticide (PE) was utilized as a candidate OP that potentially inhibits the functionality of AChE. Since OPs are neurotoxins, all the experiments were performed under the standard biosafety and chemical safety procedures with appropriate personal protective equipment (PPE). Different dilutions of PE (20, 40, 60, 80, 100, 200, 300, and 400 nM) were prepared by ethyl alcohol (95%). The 50 µL of Tris-HCl buffer (100 mM, pH 7.6), 25 µL of AChE (2 mU·mL−1), and different dilutions of PE (25 µL) were mixed and incubated for 10 min at 37 °C. Then 20 µL of ACh (4 mmol·L−1) was added to each sample, and the reagents were incubated for an additional 20 min. Then, 20 µL of sodium acetate buffer (100 mM, pH 4.0), 25 µL of 0.4 mmol·L−1 TMB, 25 µL of C-AuNPs (100 pM), and 20 µL of the above solution were dispensed using a micropipette. The UV-Vis spectra of the resultant solutions were recorded by an increase in the absorption at 652 nm, which was directly proportional to the concentration of PE. The inhibition efficiency (IE%) was calculated using the formula noted in the Supplementary Materials (Section S3). To work out the cross-reactivity of the designed probe, environmental contaminants such as PFOS, PFOA, GenX, cancer-causing agent imidazole, and other toxins were introduced at the concentration of 100 nM.
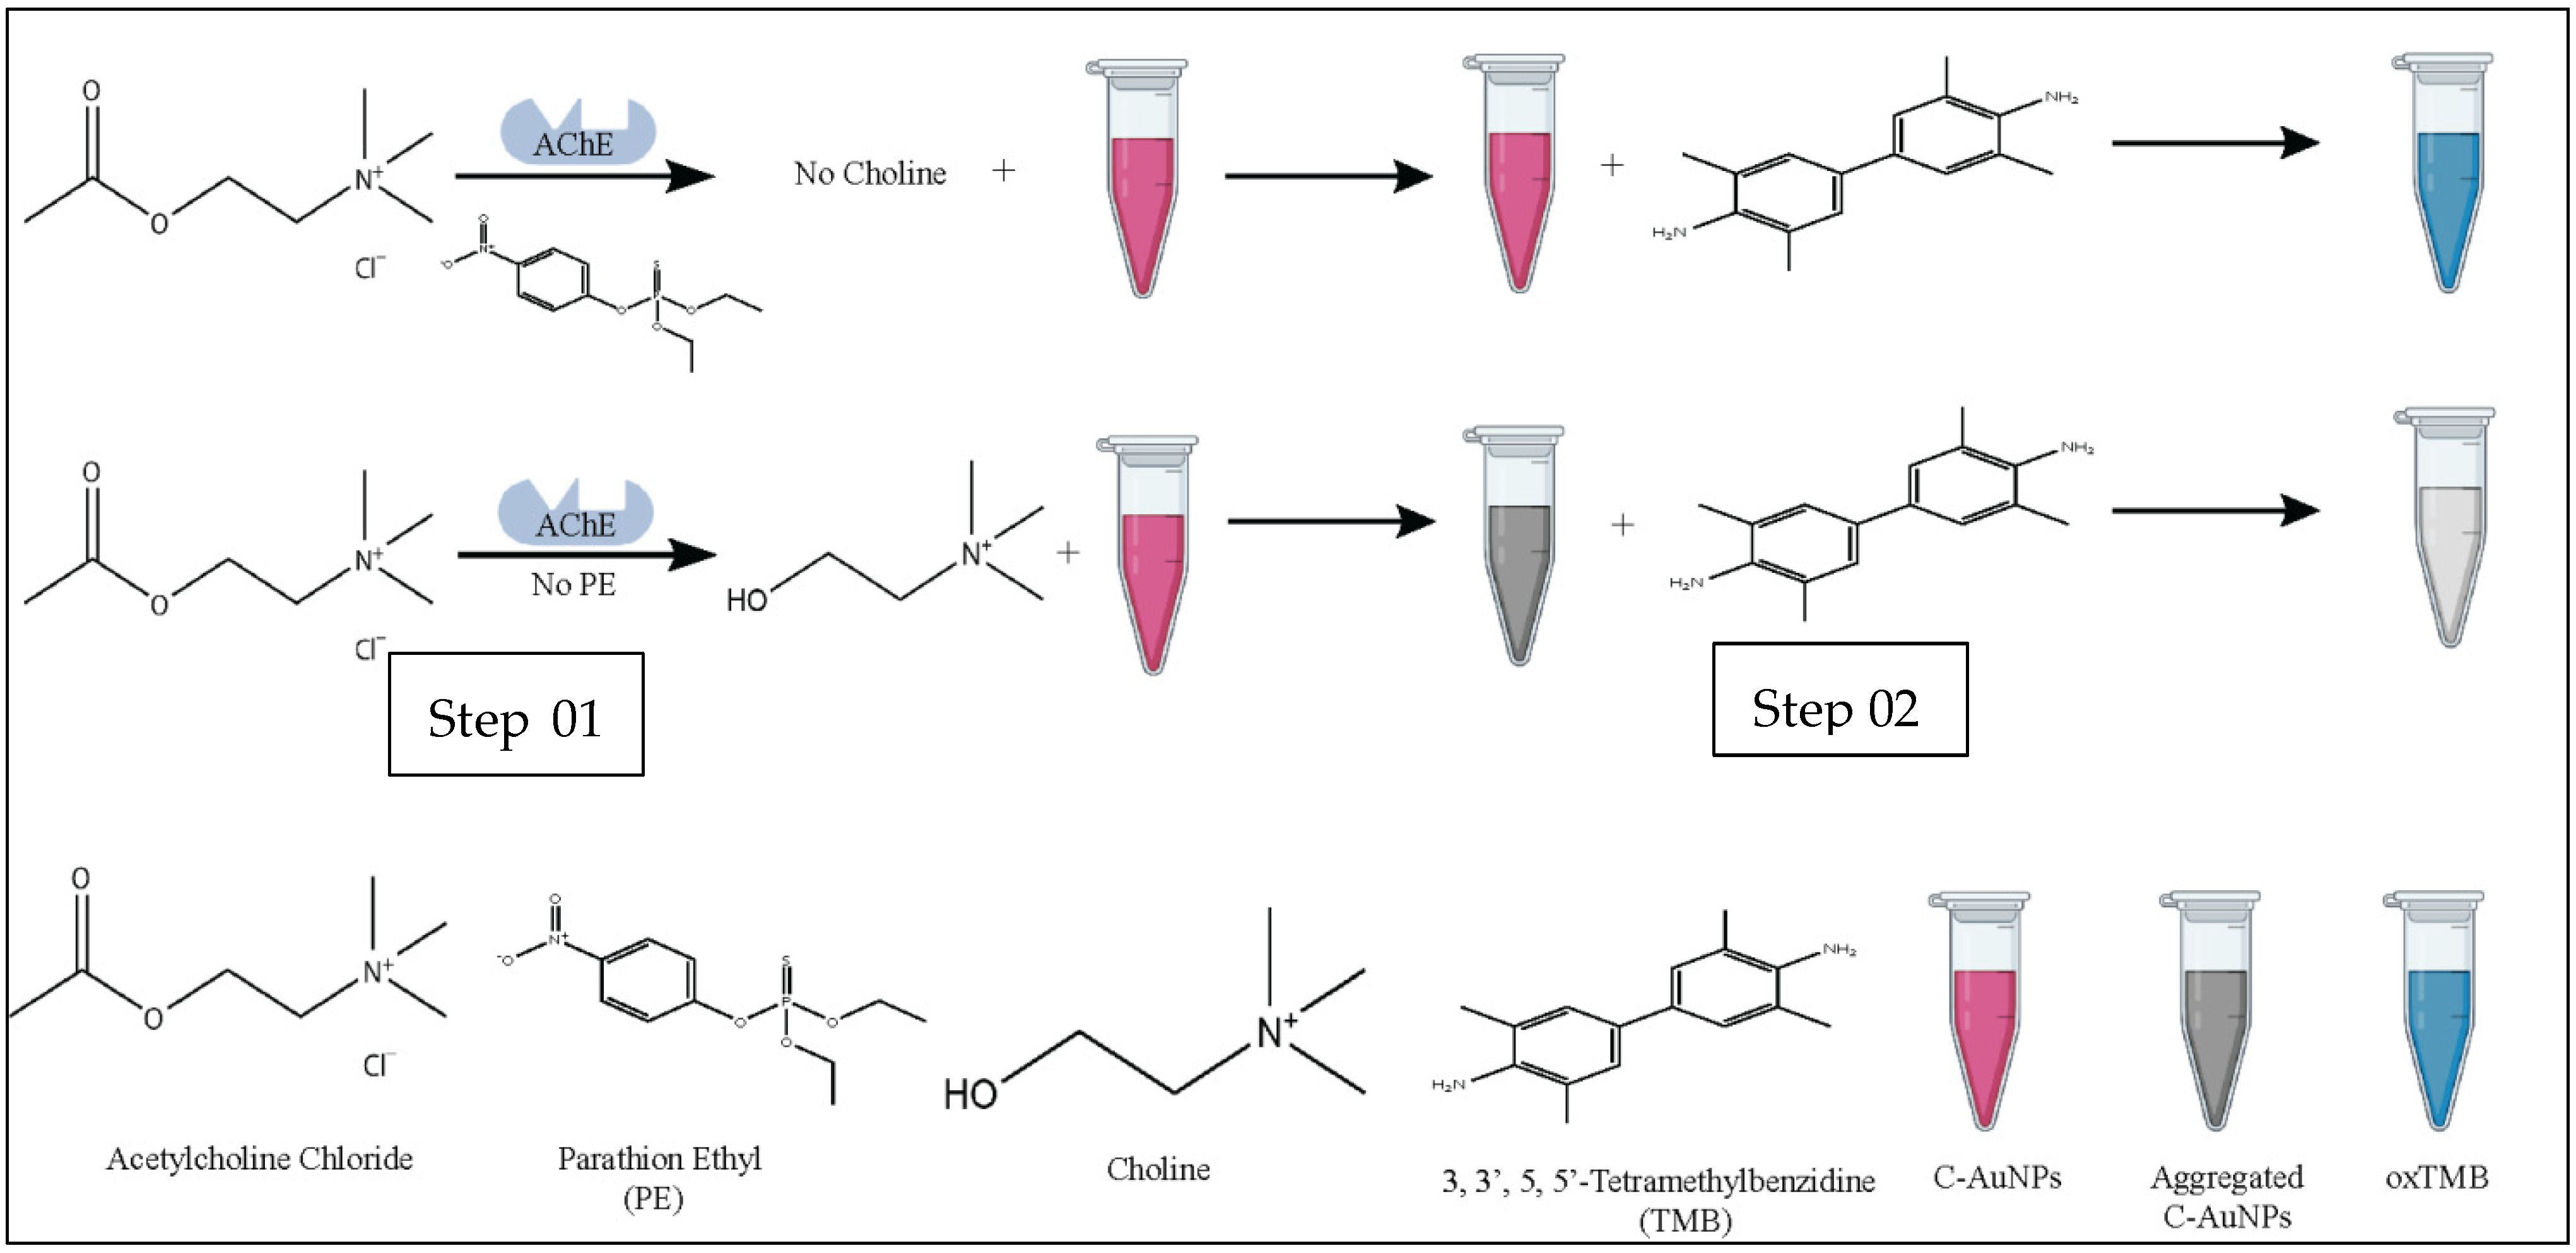
The overall methodology of the current study is summarized in Figure 1.

Figure 1.
Schematic representation of colorimetric detection of PE via C-AuNPs. Step 01 represents the effect of PE on the formation of choline. Step 02 represents the oxidation potential of dispersed and aggregated C-AuNPs.
3. Results and Discussion
3.1. Characterization of Cysteamine Capped AuNPs
The UV-Vis absorbance spectra showed a characteristic sharp peak at 530 nm for the C-AuNPs due to the strong surface plasmon resonance (SPR) of these plasmonic NPs (Figure 2). The narrow SPR band of NPs is associated with the spherical mono-disperse materials [43]. Ganapuram et al. and Sobczak-Kupiec et al. observed similar maxima of SPR peaks for AuNPs [44,45]. The mono-dispersed nature of the C-AuNPs was further established by a high positive surface charge (+39.4 ± 2.05 mV), which contributes to the stability of these NPs because of the electrostatic repulsion of the highly positive surfaces minimizing aggregation. Similarly, the positive charge also signifies the presence of amine groups (NH3+ group) on the surface of these NPs as a capping agent [42,46].
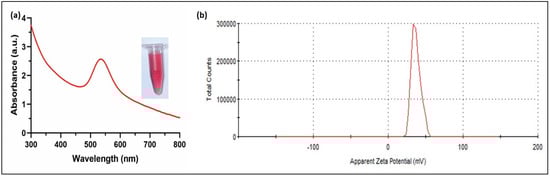
Figure 2.
Characterization of C-AuNPs (a) UV-visible spectrum with maximum absorbance at 530 nm, Inset micro-centrifuge tube represents the wine red colloidal solution of freshly synthesized C-AuNPs (b) Zeta Potential denotes the surface charge of +39.4 ± 2.05 mV (average of three readings).
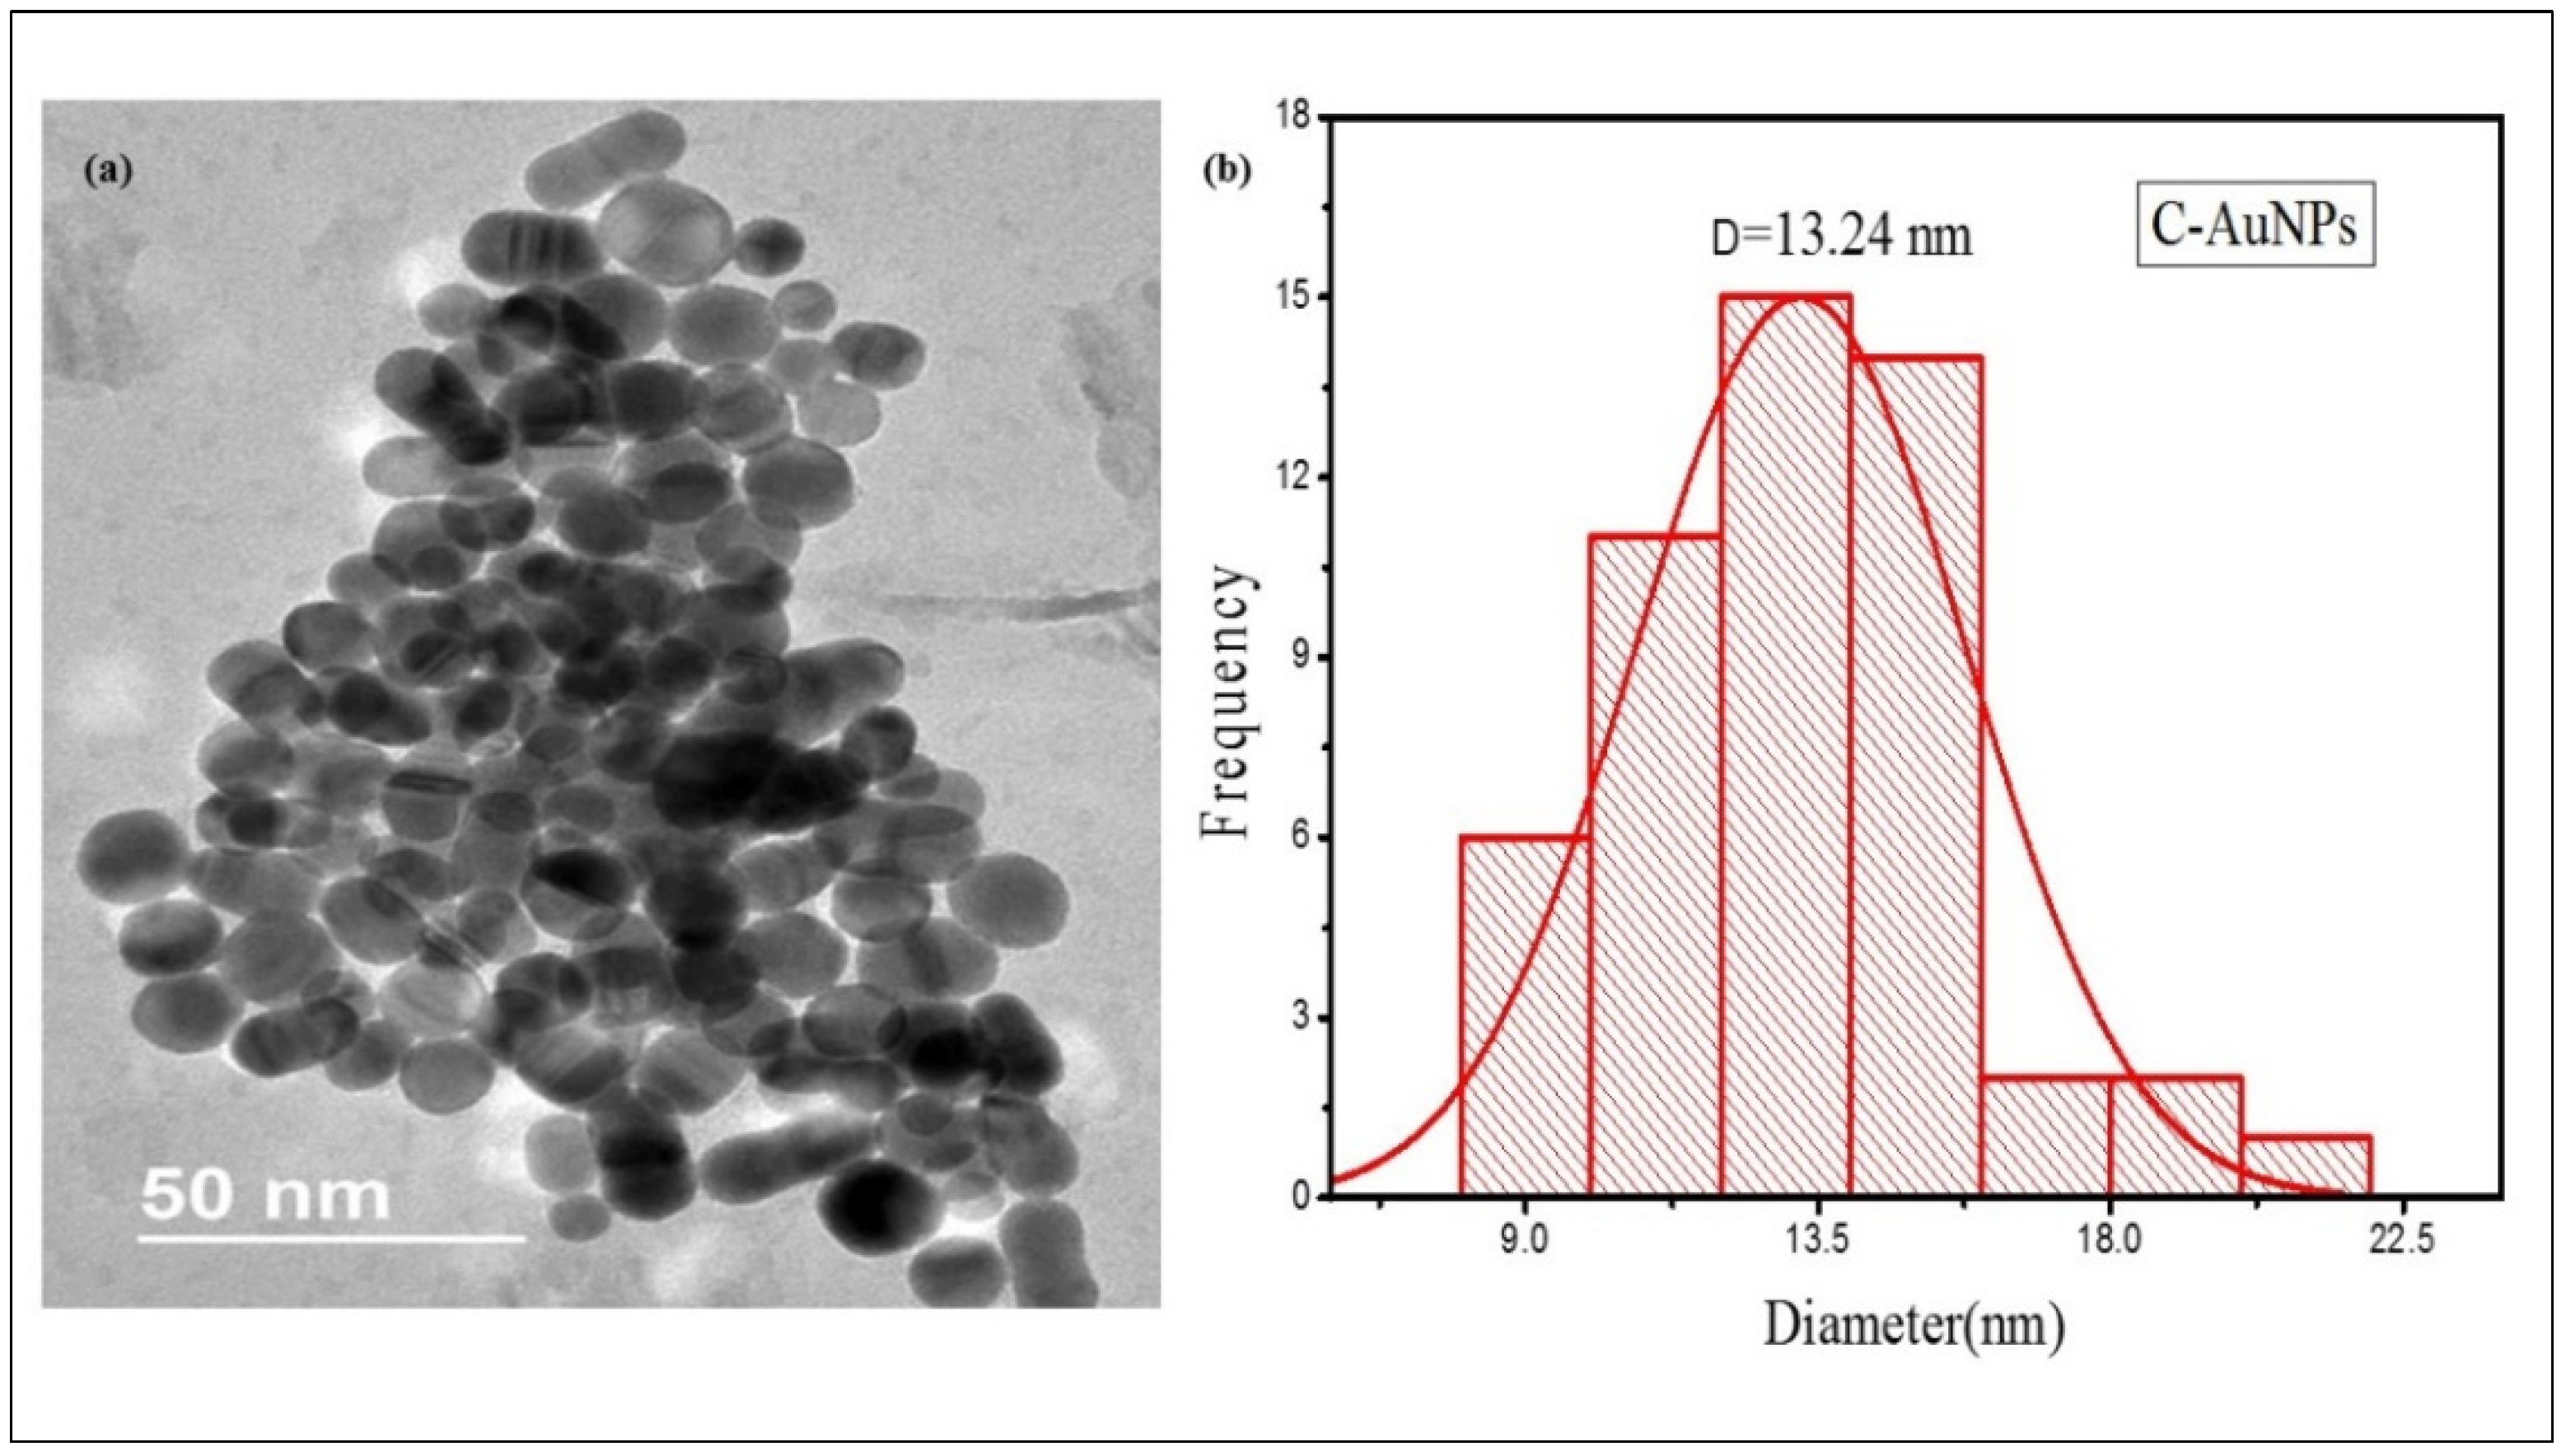
TEM micrograph of Figure 3a illustrates that nearly every particle is spherical with smooth surfaces. The C-AuNPs overlap with each other rendering the assembly of the ploy-dispersed NPs, representing an extensive network of small particles which is in agreement with the mono-dispersed NPs shown in TEM scans presented by Shah et al. [47]. As sample preparation for TEM analysis was done by the drop-casting method, so mono-dispersed NPs are getting interconnected, contributing to agglomeration. Evaporation of water from the sample leads to the unexpected agglomeration of the sample on the TEM grid due to surface tension during the air-drying step, though it is a temporary clustering [48,49], Since these bond formations are reversible, the shape and size of the individual NPs remain unchanged [50]. According to the histogram (Figure 3b), the average size of these NPs are only 13.24 nm which shows the application potential of this miniature size C-AuNPs, since smaller NPs have robust and better activity compared to large size AuNPs [51,52,53].
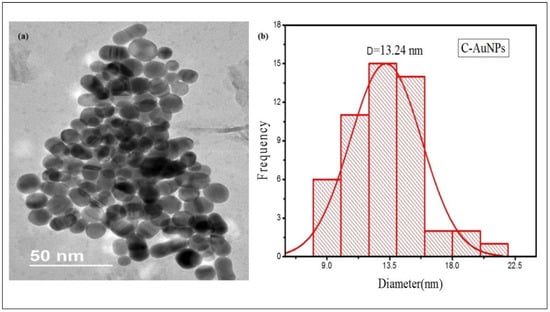
Figure 3.
TEM micrograph of C-AuNPs (a) TEM images of C-AuNPs depicting spherical morphology (b) Size distribution histograms for C-AuNPs denoting an average size of C-AuNPs as 13.24 nm.
3.2. Optimization of Reagents and Reactions
The AChE maximally hydrolyzed ACh (4.0 mmol·L−1) after incubating for 20 min with Tris HCl buffer (pH 7.6) as a reaction medium sketched in the Supplementary Materials (Section S1). The 100 pM of C-AuNPs best oxidized the 0.4 mmol·L−1 TMB in acetate medium (pH 4.0) see Supplementary Materials (Section S2). Recently, Yan et al. and Sun et al. considered the optimization of concentrations of reagents, pH of buffer solutions, and incubation milieus as preliminary experiments for the development of a successful colorimetric assay [20,54]. The C-AuNPs have easy synthesis protocols, have more substantial catalytic power, and C-AuNPs + TMB assay needs less incubation time, making the overall process simple, easy, and quick.
3.3. AChE Assay via TMB Oxidation
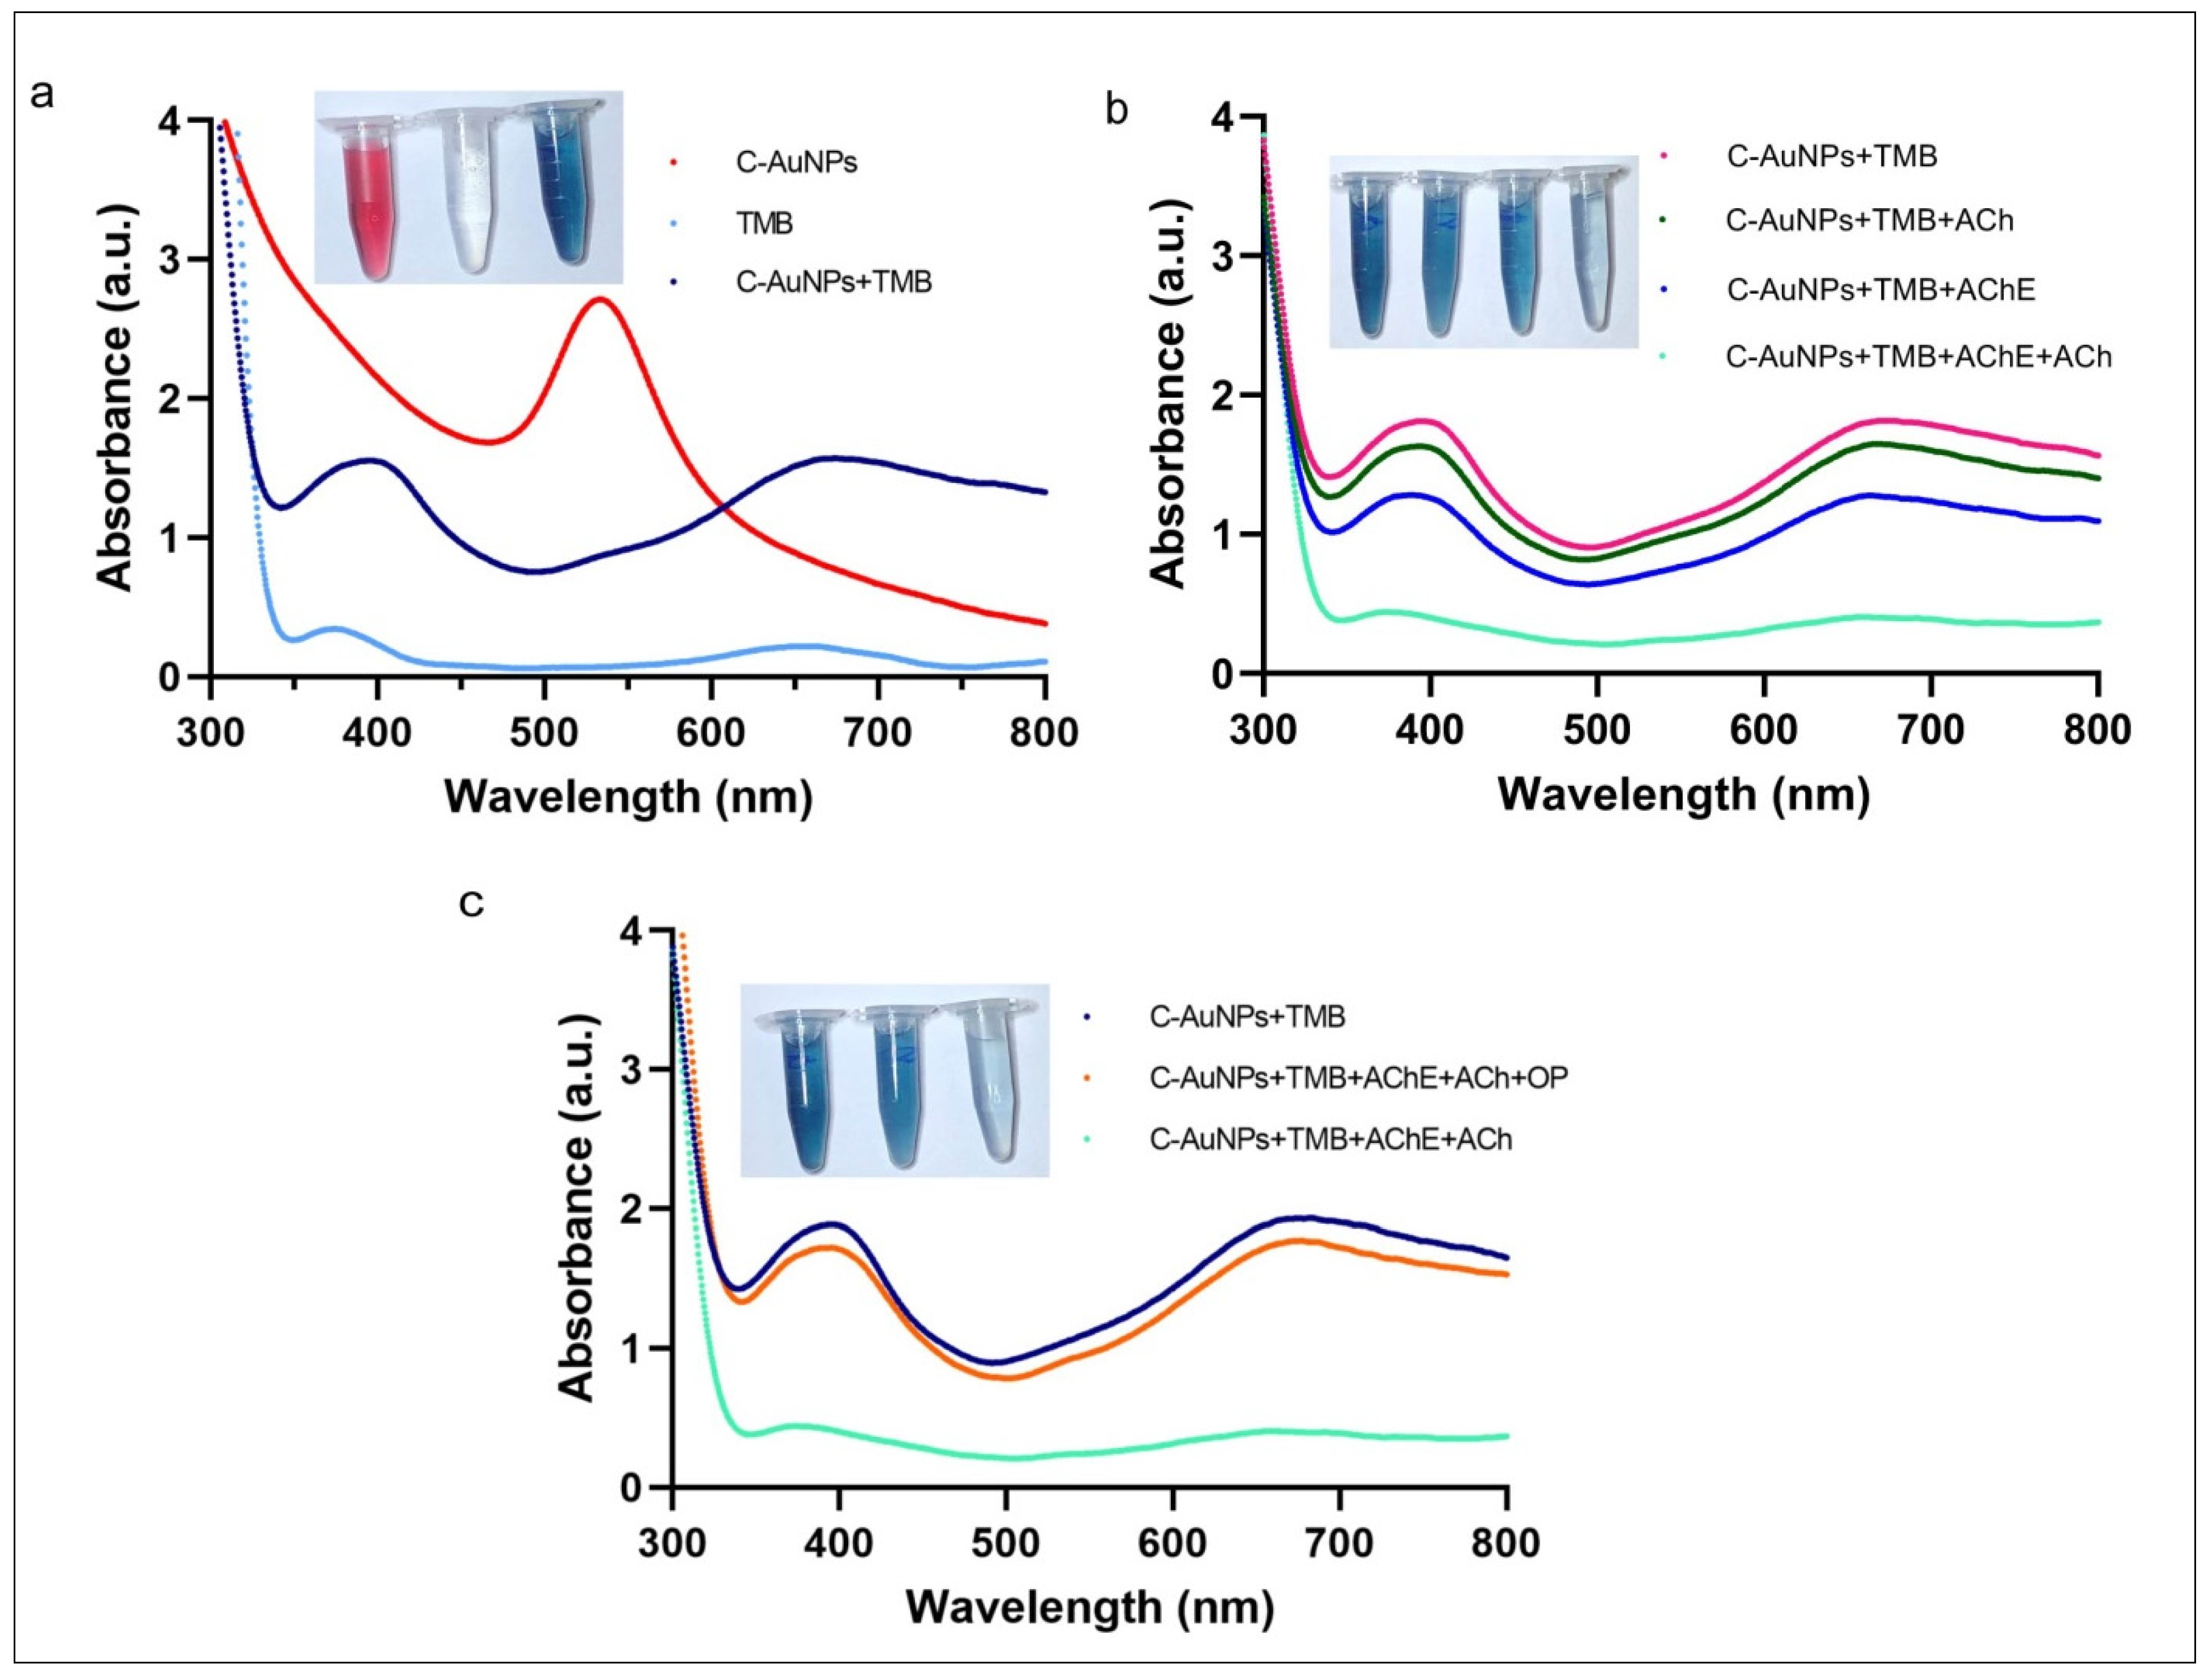
The peroxidase-like activity of C-AuNPs and the adverse effect of choline on the catalytic capabilities of these nanozymes were studied by utilizing TMB as a typical peroxidase substrate [55]. The red spectra in Figure 4a represent the UV-Vis spectra of C-AuNPs with a maximum peak at 530 nm. The aqua colour spectra with very shallow peaks at 370 nm and 652 nm are the UV-Vis spectra of colourless TMB where the dark blue spectra were obtained when C-AuNPs were incubated with TMB, in the presence of H2O2. The incidence of two sharp peaks confirmed the oxidation of TMB at 370 nm and 652 nm as shown in dark blue spectra. A noticeable change in the colour of TMB (colourless to intense blue) further confirms the oxidation of TMB within 60 sec at room temperature. This instant oxidation of TMB demonstrates the nanozymic nature of C-AuNPs and indicates the potential of the C-AuNPs + TMB system for the development of a quick monitoring assay. A similar observation was reported earlier by Liu et al. [56]. The inset figure of Figure 4a shows the colloidal solution of C-AuNPs (wine red), TMB (Colourless), and oxidized TMB (oxTMB) (Intense blue).
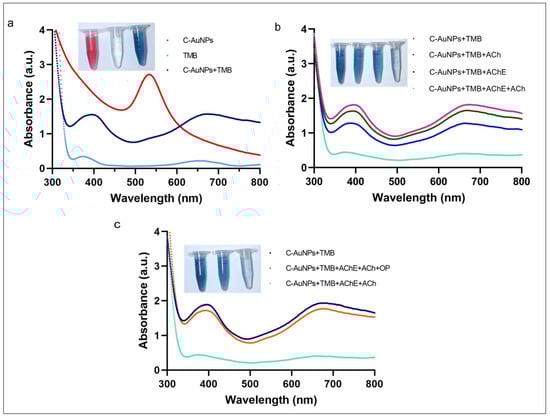
Figure 4.
Nanozymic nature of C-AuNPs, affected by choline and PE (a) The UV-Vis absorption spectra of C-AuNPs, TMB, and C-AuNPs + TMB confirm the formation of oxTMB. (b) UV-Vis absorption spectra confirm that the appearance of choline due to AChE and ACh ultimately causes the aggregation of C-AuNPs. (c) The difference in UV-vis spectra in the presence and absence of PE confirms choline production, which leads to the reduction in the catalytic activity of C-AuNPs.
To analyse the effects of choline on the C-AuNPs + TMB system, the possible combinations of the enzyme (AChE) and substrate (ACh) were made to rule out the false-negative results and ratify the proposition that the presence of choline induces aggregation in C-AuNPs. Results obtained by these combinations suggest that the TMB is being oxidized in all combinations where both reagents, i.e., substrate and enzyme, are not present together. The prominent peaks at 370 nm and 652 nm, as shown in Figure 4b, confirm the presence of oxTMB. The oxidation of TMB advocates for the existence of well-dispersed C-AuNPs. On the other hand, when both AChE and ACh are present, the TMB oxidation was not significantly observed, which is indicated by the colourless reagent in the inset diagram of Figure 4b, and further confirmed by the spectra with no significant peaks (Figure 4b). Thus, to produce choline, both the substrate and enzyme should be present with all other required conditions and the presence of choline induced aggregation in C-AuNPs.
The aggregation of C-AuNPs due to choline has also been reported by El et al. [57]. The reason behind this aggregation depends upon the deprotonation of cysteamine under the influence of pH. Capping agents (amine groups) of C-AuNPs are being deprotonated at alkaline pH [58]. The positively charged choline acts as a bridge among deprotonated C-AuNPs and leads to the aggregation of these NPs. The aggregated form of C-AuNPs loses its catalytic activity and is unable to catalyse the oxidization of TMB. Depending upon the pH of the medium, cysteamine exists in three ionic forms: the positively charged form (cys+), the zwitterionic form (cys-ZW), and the negatively charged form (cys-) [59].
To study the effect of PE on the above-discussed C-AuNPs + TMB system, PE was introduced to block the enzymatic activity of AChE. The presence of PE in the reaction mixture reduced the Ach hydrolysis; the lesser the hydrolysis, the lower the choline production will be. The presence of lesser choline will reduce the aggregation of C-AuNPs. However, the non-aggregated C-AuNPs will remain catalytically active and exhibit peroxidase-like activity. This non-aggregated and mono-dispersed state of C-AuNPs was indicated by the blue colour of the chromogenic reaction, which was confirmed by the prominent peaks at 370 nm and 652 nm, as shown in Figure 4c.
3.4. Sensing of Parathion Ethyl through C-AuNPs Probe
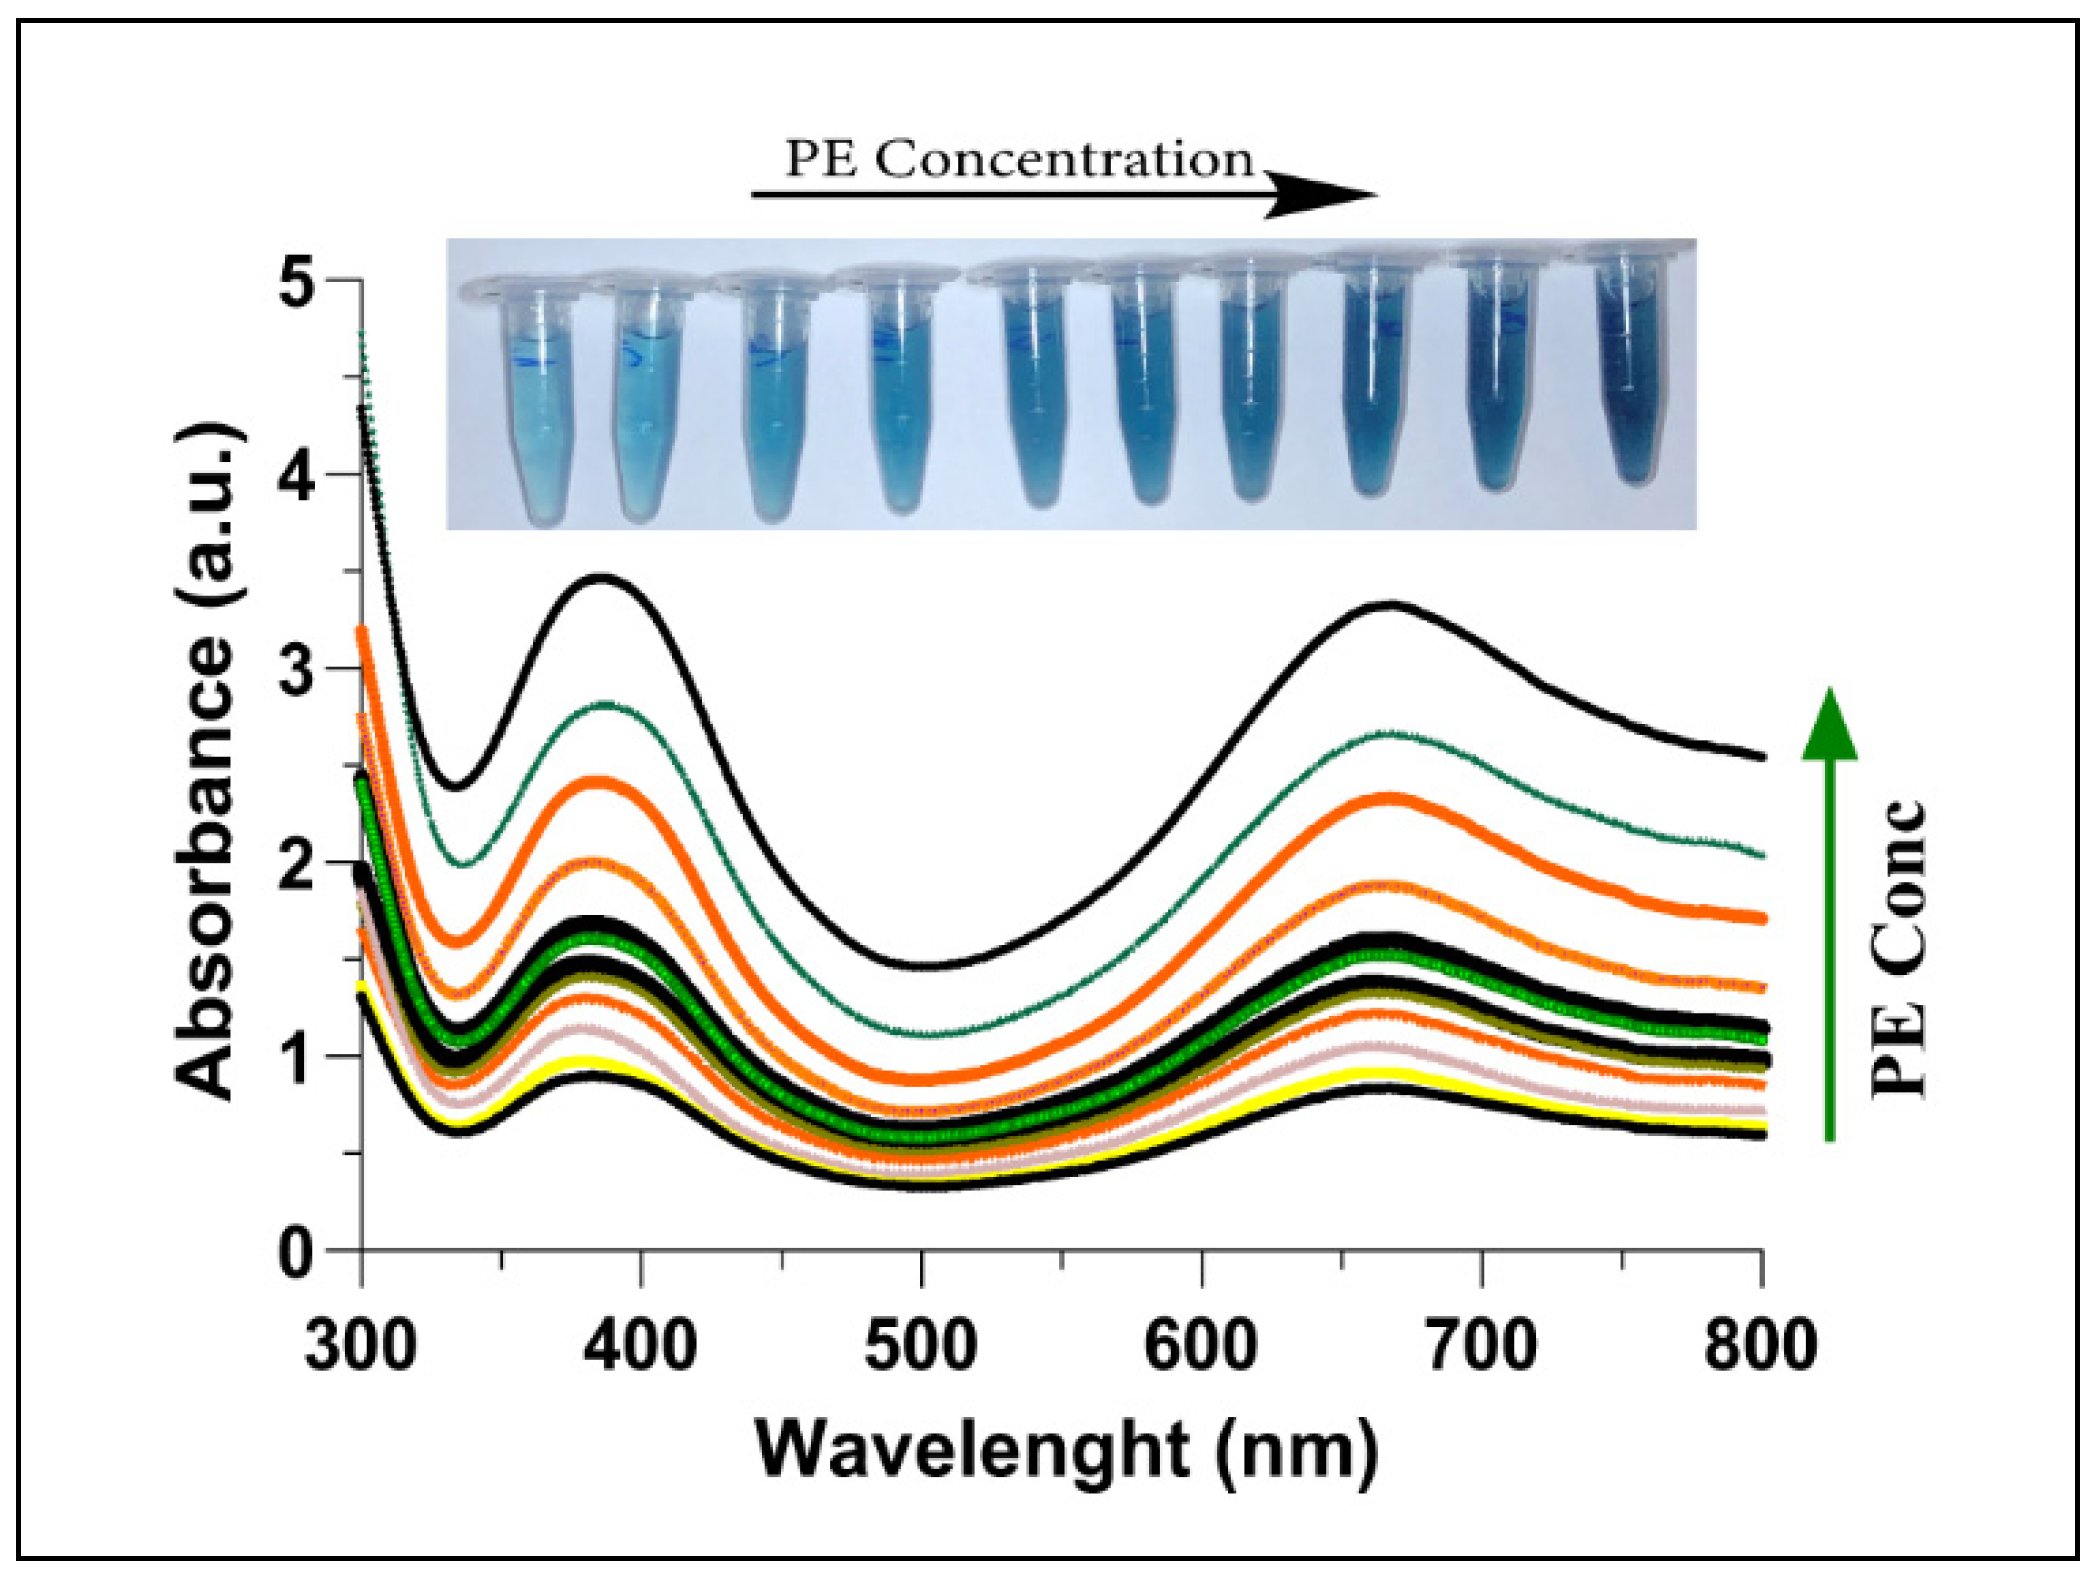
While characterizing the inhibition of AChE by PE, a reduced amount of choline production was observed as the presence of PE irreversibly inhibited the AChE consequently. With an increase in the concentration of PE, a gradual inactivation pattern of AChE was observed, which eventually led to higher oxidation of TMB (Figure 5). The transformation in colour (inset Figure 5) further explains the continuing oxidation of TMB, which is in agreement with Ren et al. [60]. Irreversible inhibition of AChE has already been reported due to the presence of OPs [61,62,63]. The formation of a covalent bond with the active site (phosphorylate serine residues) of AChE by these toxic chemicals converts the enzyme into a non-functioning molecule [64].
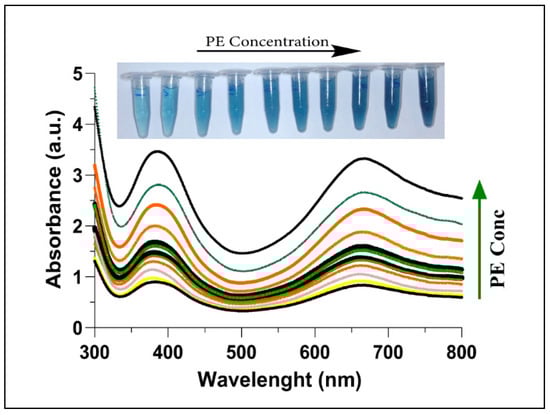
Figure 5.
UV-Vis absorption spectra of AChE + Ach + C-AuNPs + TMB plotted with increasing concentrations of PE (0–400 nM). The increase in PE concentration leads to less aggregation of C-AuNPs, thus a stronger catalysed colorimetric reaction with deeper colour from oxTMB. The inset shows the colour of the corresponding reaction mixtures.
3.5. Effect of C-AuNPs Concentration on Oxidation of TMB
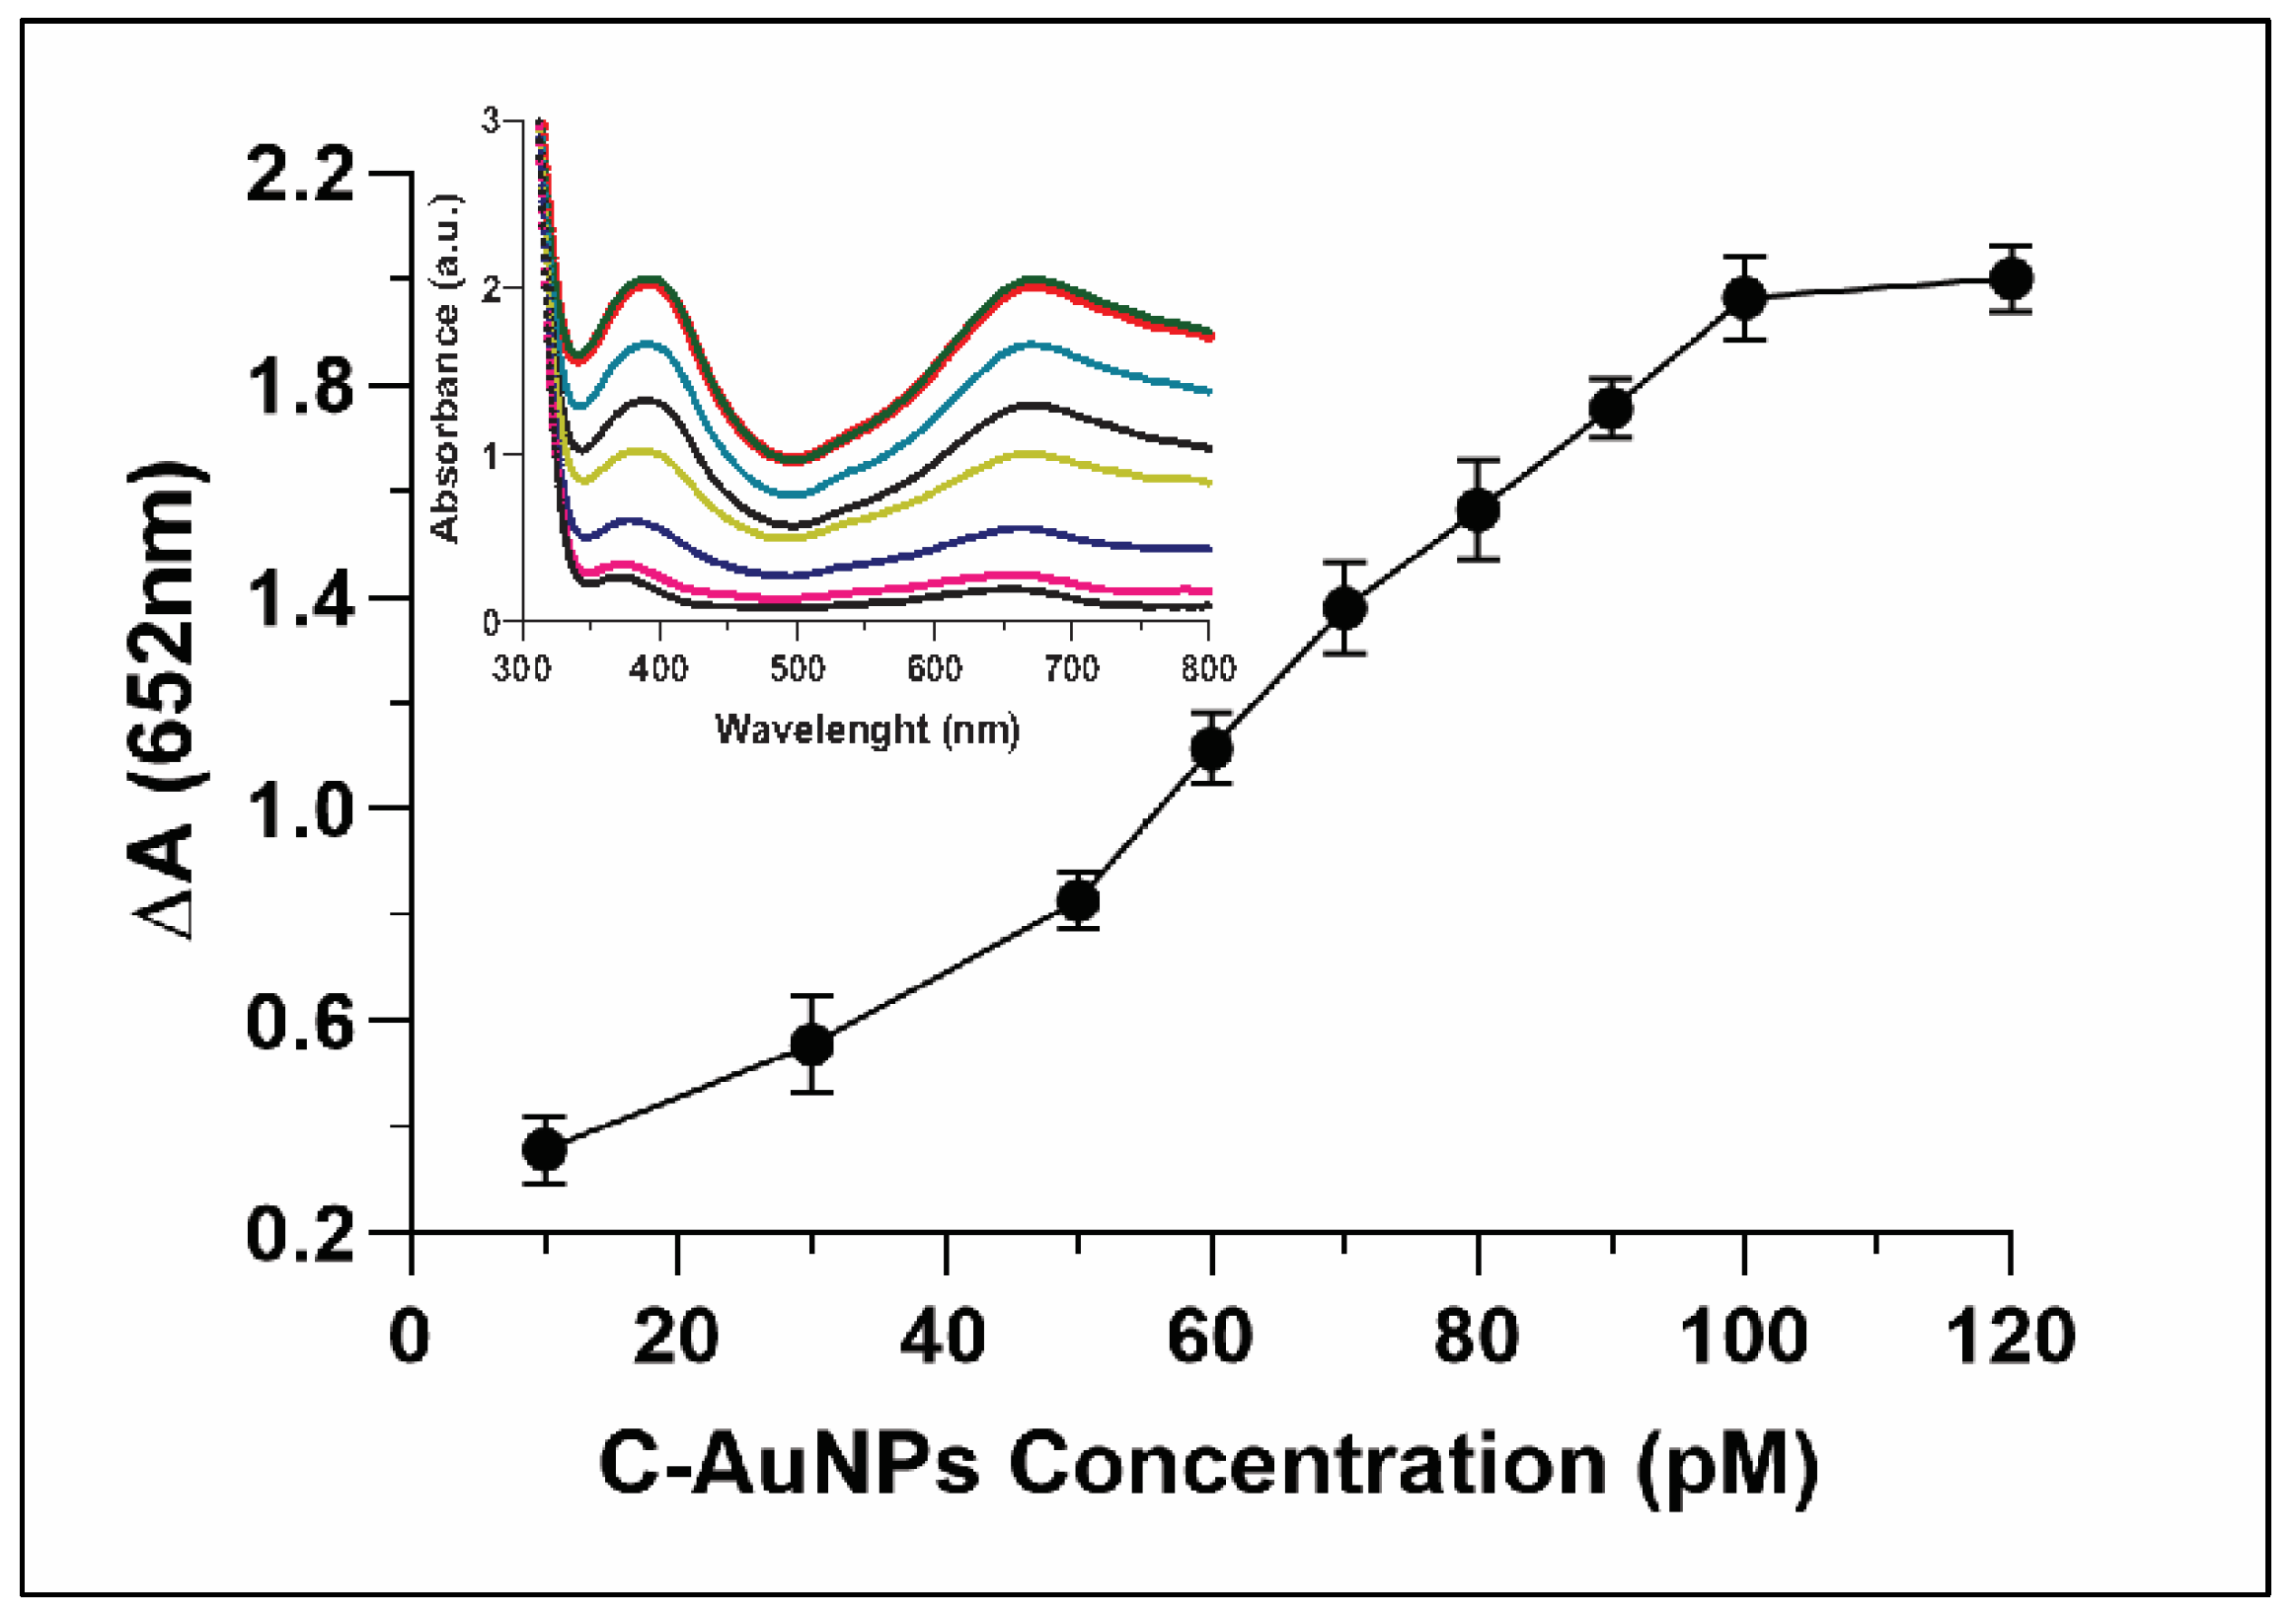
Whereas evaluating the correlation between concentrations of C-AuNP and oxidation of TMB, the relative absorbance ∆A (652nm) was only 0.3 when the concentration of C-AuNPs was just 10 pM. The ∆A reached up to 2.0 when the concentration of the C-AuNPs was increased to 100 pM (Figure 6). The inset in Figure 6 indicated continuous growth in the absorbance spectra with a gradual increase of the peak at 652 nm. A direct relationship was observed between the NPs concentrations and oxidation of TMB. Hence, the higher catalytic power of nanozyme was established with increasing concentration. Sun et al. also reported that in comparison to low concentration, high concentrations of nanomaterials have higher catalytic power to catalyse the oxidation of TMB [54].
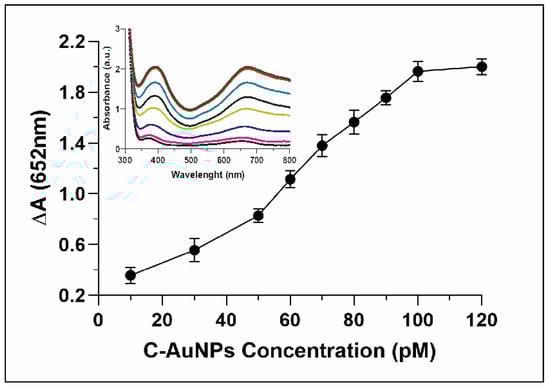
Figure 6.
Explicate the catalytic activity of C-AuNP increasing with increasing concentrations. Inset represents the UV-Vis spectra of C-AuNPs and TMB with growing concentrations of C-AuNPs.
3.6. The Efficiency of the C-AuNP Based Sensor
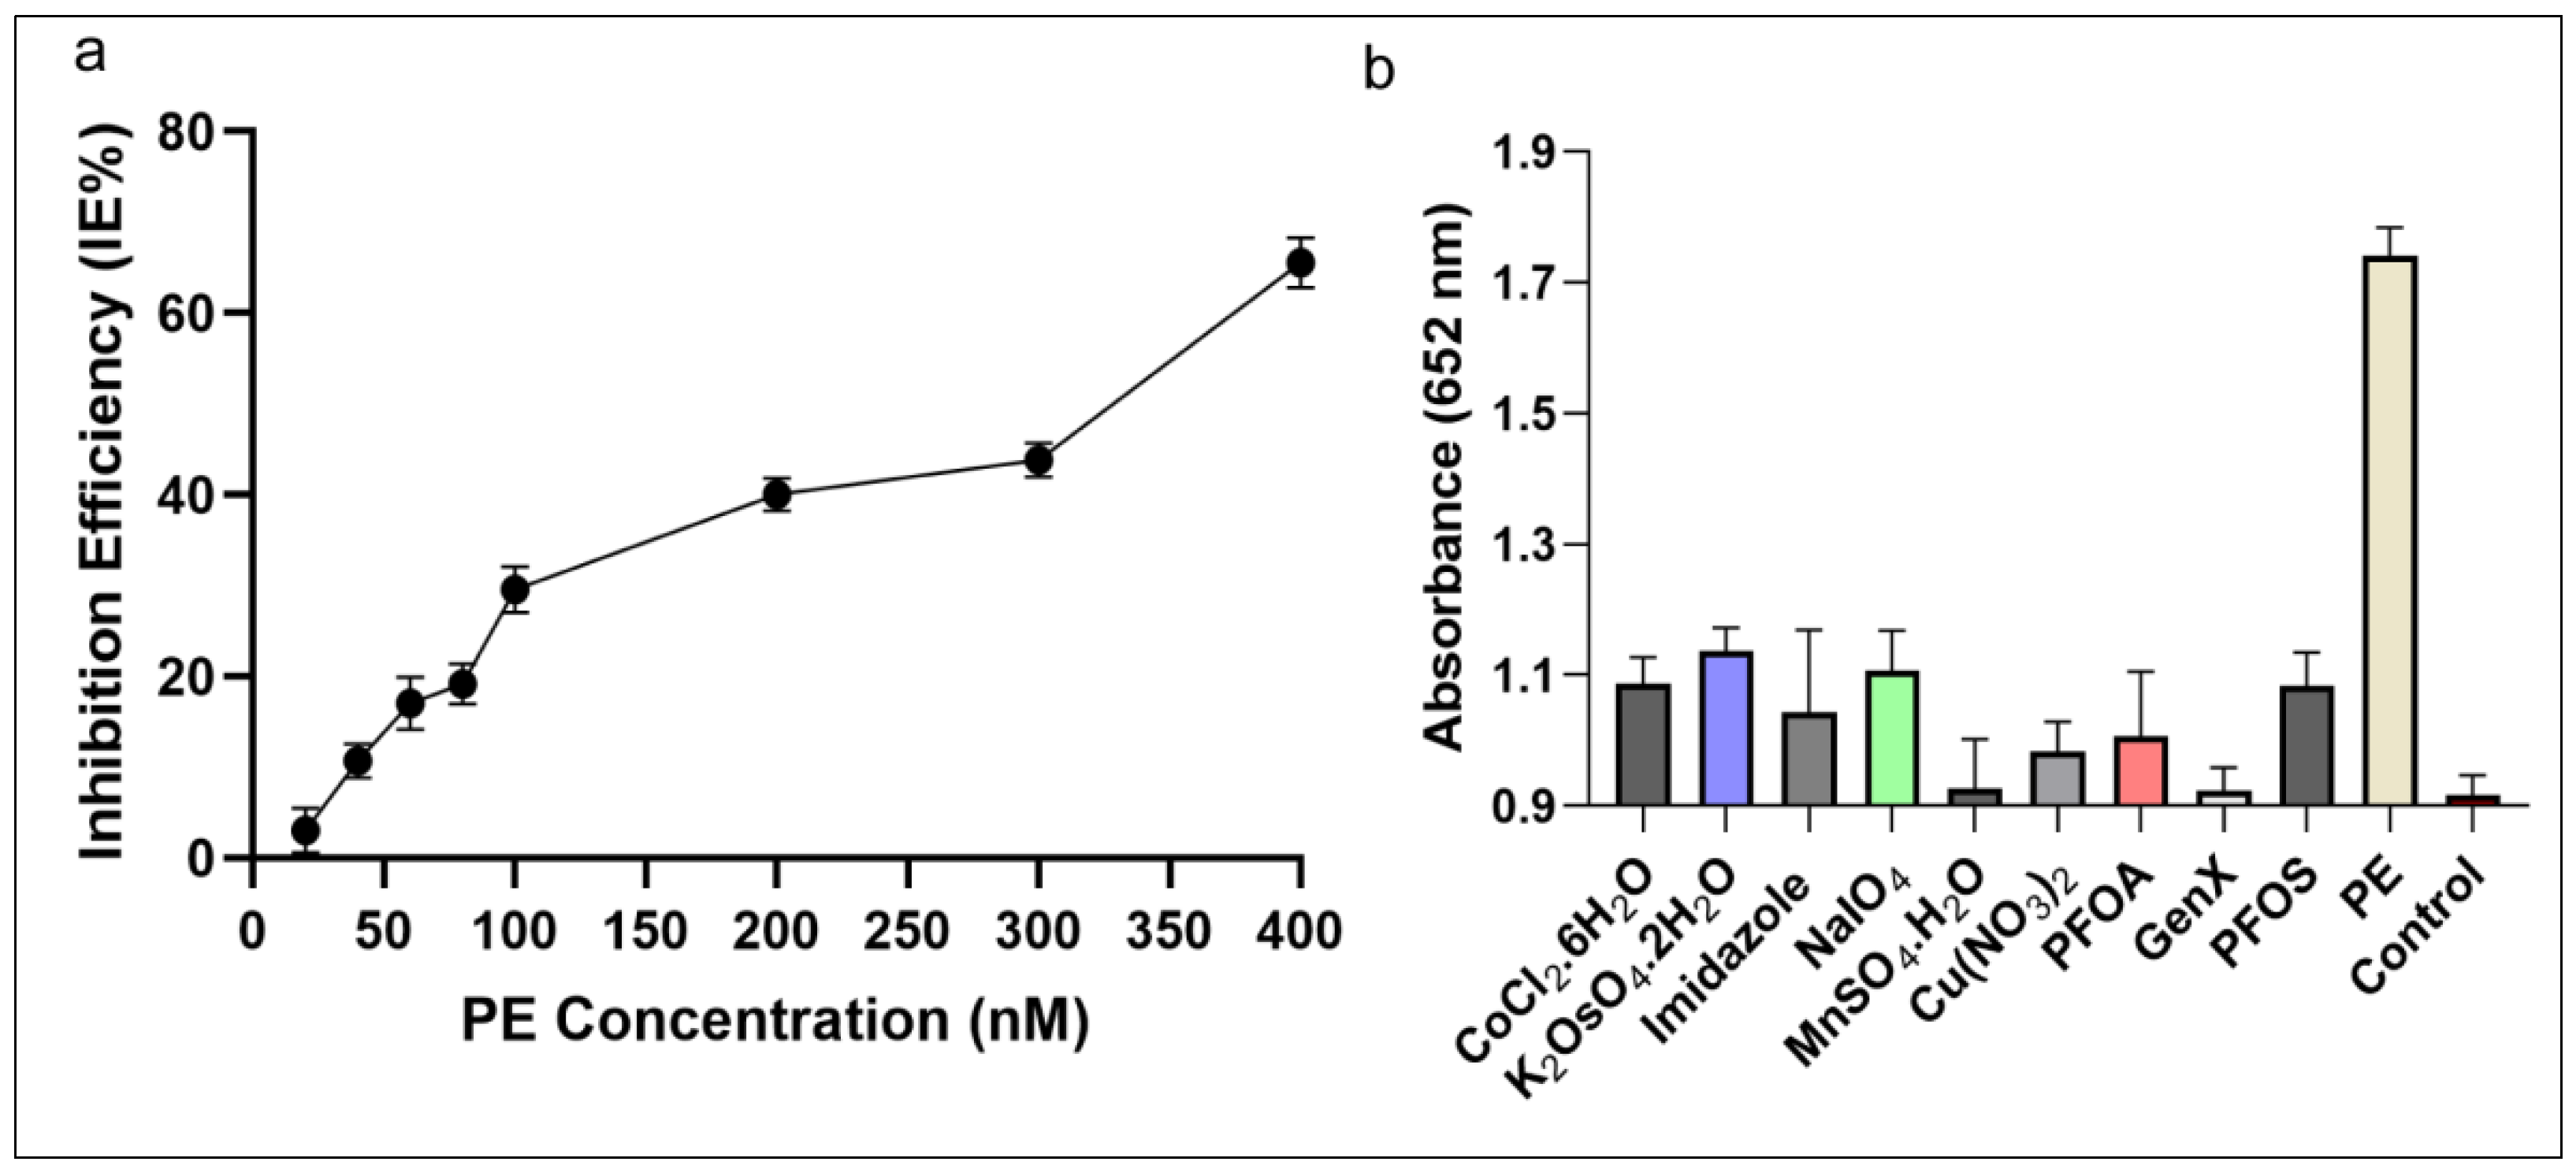
The IE% of AChE was detectable in the tested range between 20 and 400 nM concentration as shown in Figure 7a. The inhibitor (PE) showed a linear correlation in the range between 11.6–92.8 ng·mL−1 (40–320 nM), which is in agreement with the previously described studies [20,54]. The lower limit of detection of this C-AuNPs + TMB assay has been established as 5.8 ng·mL−1 (20 nM), which is better than several previous reports [34,35,40,41]. The LOD of classical analytical methods is comparable [36] and better [32,33] than our proposed system; however, these methods are less robust and expensive. Their electrochemical sensing approaches [37,39] have additional steps to follow long protocols and need high temperatures for hours to successfully synthesize nanomaterials. The protocol of gold nanoclusters-anchored MnO2 composite also needs 4–5 h to complete the synthesis in addition to other steps of the protocol [38]. Compared to nanozyme based biosensing [20] which capitalized the MnO2 sheets as nanozyme, the synthesis of MnO2 is complex and needs heating at 90 °C for an additional 15 min followed by MnO2 + TMB based detection, which needed more prolonged incubations. Contrarily, our protocol involves the simple synthesis of C-AuNPs, which is easy to follow, and all steps occur at room temperature. Our protocol requires 85–95 min, which includes synthesis of particles and sensing of the analytes. Thus we can say that in terms of simplicity, economics, easiness of procedure, and robustness of the protocol, the C-AuNPs + TMB sensing is better than all these reports.
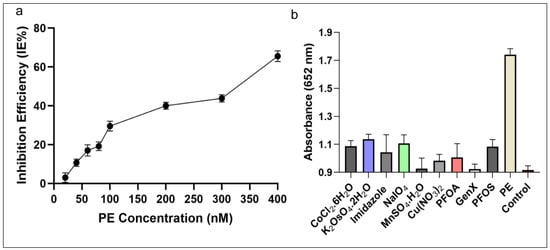
Figure 7.
Inhibition efficiency and specificity of the assay (a) The IE% of PE on AChE activity demonstrates that with growing concentration of PE the inhibition of AChE increasing (b) The selectivity of the developed assay towards PE, carcinogenic compounds, and other toxins at a wavelength of 652 nm. The absorbance of PE was much higher compared to other compounds tested.
The cross-reactivity assay results shown in Figure 7b demonstrate that none of the tested toxins induce the same colorimetric response as PE when presented at a concentration as high as 100 nM instead of PE (100 nM). Accordingly, these outcomes indicate that the C-AuNPs + TMB probe is specific enough to detect PE selectively with high precision and reliability. Compared to sensor technologies that utilize parathion-methyl as an analyte, our approach exhibited 180 times better sensitivity (5.8 ng·mL−1) compared to the MPH enzyme-based biosensor (1052.8 ng·mL−1) [35], and three times better than the QD-based sensor (18.0 ng·mL−1) [34]. The sensitivity achieved is comparable to the sensitivity of Fe3O4 imprinted polymers (5.2 ng·mL−1) [36], as described in Table 1. Overall, the developed assay was simple, sensitive, and highly selective in detecting OPs. Thus, our proposed sensor meets the detection requirements for on-site and robust visual detection of OPs with high sensitivity, precision, and reproducibility.
4. Conclusions
A simple and sensitive sensor assay based upon a nanozyme (C-AuNPs) and acetylcholinesterase inhibition by parathion ethyl (PE) was developed. The assay meets the detection requirements for on-site and robust visual monitoring of OPs with high sensitivity, precision, and reproducibility. The biosensor utilizes C-AuNPs to catalyse the oxidization of colourless TMB into a blue-coloured reagent for visual monitoring of PE with excellent specificity. The visual monitoring makes this method more adaptable than other analytical techniques which are dependent upon advanced instrumentations. This colorimetric detection system can be utilized for a range of applications to monitor PE in environmental and food processing applications such as irrigation water, juices, milk products, fruit, and vegetables for quality control, and safety purposes.
Supplementary Materials
The following are available online at https://www.mdpi.com/article/10.3390/s21238050/s1, S1 is providing the information of optimization steps for enzymatic hydrolysis of Ach byAChE. Figure S1: Optimization of the enzymatic reaction. (a) Enzymatic hydrolysis of ACh was noted to be the best at a pH of 7.6 (b) Selection of optimum incubation time (c) Maximum ∆A at 652 nm was obtained with a 4.0 mmol·L-1 concentration of ACh. Error bars represent the standard deviation from three replicates; S2 contains the data about the optimization reactions conducted to get the maximum nanozymic potentials of C-AuNPs. Figure S2: Optimization of chromogenic reaction. (a) The optimum ∆A of the chromogenic reaction was at a pH of 4.0. (b) The maximum ∆A of the reaction was noted at 0.4 mmol·L-1. (c) The maximum ∆A was observed at 100 pM concentration of C-AuNP. Error bars represent the standard deviation of three replicates. S3: Providing the details of the applied formula for the calculation of inhibition efficiency.
Author Contributions
Conceptualization, M.M.S. and B.A.; Formal analysis, M.M.S., J.I., M.I.A. and B.A.; Funding acquisition, A.A.S.; Investigation, M.M.S. and W.R.; Methodology, M.M.S. and W.R.; Resources, J.I. and A.A.S.; Supervision, J.I. and B.A.; Validation, W.R., M.I.A. and B.A.; Writing—original draft, M.M.S.; Writing—review & editing, W.R., J.I., A.A.S., M.I.A. and B.A. All authors have read and agreed to the published version of the manuscript.
Funding
This manuscript was funded by Khalifa University of Science and Technology Competitive Internal Research Award CIRA-ADEK and by Abu Dhabi Award for Research Excellence (AARE) 2019. M.M.S. was supported by the Higher Education Commission (HEC) of Pakistan under the International Research Support Initiative Program (IRSIP).
Institutional Review Board Statement
Not applicable.
Informed Consent Statement
Not applicable.
Data Availability Statement
Not applicable.
Acknowledgments
M.M.S. acknowledges input from Muhammad Fayyaz in the development of this manuscript.
Conflicts of Interest
The authors have no known competing interest or personal relationship.
References
- Shimada, H.; Kiyozumi, Y.; Koga, Y.; Ogata, Y.; Katsuda, Y.; Kitamura, Y.; Iwatsuki, M.; Nishiyama, K.; Baba, H.; Ihara, T. A novel cholinesterase assay for the evaluation of neurotoxin poisoning based on the electron-transfer promotion effect of thiocholine on an Au electrode. Sens. Actuators B Chem. 2019, 298, 126893. [Google Scholar] [CrossRef]
- Houze, P.; Hutin, A.; Lejay, M.; Baud, F.J. Comparison of the Respiratory Toxicity and Total Cholinesterase Activities in Dimethyl Versus Diethyl Paraoxon-Poisoned Rats. Toxics 2019, 7, 23. [Google Scholar] [CrossRef] [PubMed] [Green Version]
- Xiong, S.; Deng, Y.; Zhou, Y.; Gong, D.; Xu, Y.; Yang, L.; Chen, H.; Chen, L.; Song, T.; Luo, A. Current progress in biosensors for organophosphorus pesticides based on enzyme functionalized nanostructures: A review. Anal. Methods 2018, 10, 5468–5479. [Google Scholar] [CrossRef]
- Suwannakul, B.; Sapbamrer, R.; Wiwattanadittakul, N.; Hongsibsong, S. Organophosphate Pesticide Exposures in Early and Late Pregnancy Influence Different Aspects of Infant Developmental Performance. Toxics 2021, 9, 99. [Google Scholar] [CrossRef] [PubMed]
- Songa, E.A.; Okonkwo, J.O. Recent approaches to improving selectivity and sensitivity of enzyme-based biosensors for organophosphorus pesticides: A review. Talanta 2016, 155, 289–304. [Google Scholar] [CrossRef]
- Tiwari, N.; Asthana, A.; Upadhyay, K. Kinetic-spectrophotometric determination of methyl parathion in water and vegetable samples. Spectrochim. Acta Part A Mol. Biomol. Spectrosc. 2013, 101, 54–58. [Google Scholar] [CrossRef]
- Pundir, C.S.; Chauhan, N. Acetylcholinesterase inhibition-based biosensors for pesticide determination: A review. Anal. Biochem. 2012, 429, 19–31. [Google Scholar] [CrossRef]
- Yusoff, N.A.; Taib, I.S.; Budin, S.B.; Mohamed, M. Paternal Fenitrothion Exposures in Rats Causes Sperm DNA Fragmentation in F0 and Histomorphometric Changes in Selected Organs of F1 Generation. Toxics 2021, 9, 159. [Google Scholar] [CrossRef] [PubMed]
- Cheng, Z.; Dong, F.; Xu, J.; Liu, X.; Wu, X.; Chen, Z.; Pan, X.; Gan, J.; Zheng, Y. Simultaneous determination of organophosphorus pesticides in fruits and vegetables using atmospheric pressure gas chromatography quadrupole-time-of-flight mass spectrometry. Food Chem. 2017, 231, 365–373. [Google Scholar] [CrossRef]
- Behniwal, P.K.; She, J. Development of HPLC-MS/MS method for the simultaneous determination of metabolites of organophosphate pesticides, synthetic pyrethroids, herbicides and DEET in human urine. Int. J. Environ. Anal. Chem. 2017, 97, 548–562. [Google Scholar] [CrossRef]
- Muñoz, R.; Guevara-Lara, A.; Santos, J.L.; Miranda, J.M.; Rodriguez, J.A. Determination of glyphosate in soil samples using CdTe/CdS quantum dots in capillary electrophoresis. Microchem. J. 2019, 146, 582–587. [Google Scholar] [CrossRef]
- Guo, Y.; Liu, R.; Liu, Y.; Xiang, D.; Liu, Y.; Gui, W.; Li, M.; Zhu, G. A non-competitive surface plasmon resonance immunosensor for rapid detection of triazophos residue in environmental and agricultural samples. Sci. Total Environ. 2018, 613, 783–791. [Google Scholar] [CrossRef]
- Liang, B.; Han, L. Displaying of acetylcholinesterase mutants on surface of yeast for ultra-trace fluorescence detection of organophosphate pesticides with gold nanoclusters. Biosens. Bioelectron. 2020, 148, 111825. [Google Scholar] [CrossRef] [PubMed]
- Yaseen, T.; Sun, D.-W.; Pu, H.; Pan, T.-T. Detection of omethoate residues in peach with surface-enhanced Raman spectroscopy. Food Anal. Methods 2018, 11, 2518–2527. [Google Scholar] [CrossRef]
- Guo, Y.; Girmatsion, M.; Li, H.-W.; Xie, Y.; Yao, W.; Qian, H.; Abraha, B.; Mahmud, A. Rapid and ultrasensitive detection of food contaminants using surface-enhanced Raman spectroscopy-based methods. Crit. Rev. Food Sci. Nutr. 2020, 8, 1–14. [Google Scholar] [CrossRef]
- Weerathunge, P.; Behera, B.K.; Zihara, S.; Singh, M.; Prasad, S.N.; Hashmi, S.; Mariathomas, P.R.D.; Bansal, V.; Ramanathan, R. Dynamic interactions between peroxidase-mimic silver NanoZymes and chlorpyrifos-specific aptamers enable highly-specific pesticide sensing in river water. Anal. Chim. Acta 2019, 1083, 157–165. [Google Scholar] [CrossRef]
- Wang, B.; Li, Y.; Hu, H.; Shu, W.; Yang, L.; Zhang, J. Acetylcholinesterase electrochemical biosensors with graphene-transition metal carbides nanocomposites modified for detection of organophosphate pesticides. PLoS ONE 2020, 15, e0231981. [Google Scholar] [CrossRef]
- Hu, H.; Yang, L. Development of enzymatic electrochemical biosensors for organophosphorus pesticide detection. J. Environ. Sci. Health Part B 2020, 56, 168–180. [Google Scholar] [CrossRef]
- Yan, X.; Li, H.; Han, X.; Su, X. A ratiometric fluorescent quantum dots based biosensor for organophosphorus pesticides detection by inner-filter effect. Biosens. Bioelectron. 2015, 74, 277–283. [Google Scholar] [CrossRef]
- Yan, X.; Song, Y.; Wu, X.; Zhu, C.; Su, X.; Du, D.; Lin, Y. Oxidase-mimicking activity of ultrathin MnO 2 nanosheets in colorimetric assay of acetylcholinesterase activity. Nanoscale 2017, 9, 2317–2323. [Google Scholar] [CrossRef] [PubMed]
- Zhang, S.-X.; Xue, S.-F.; Deng, J.; Zhang, M.; Shi, G.; Zhou, T. Polyacrylic acid-coated cerium oxide nanoparticles: An oxidase mimic applied for colorimetric assay to organophosphorus pesticides. Biosens. Bioelectron. 2016, 85, 457–463. [Google Scholar] [CrossRef]
- Jiang, T.; Song, Y.; Wei, T.; Li, H.; Du, D.; Zhu, M.-J.; Lin, Y. Sensitive detection of Escherichia coli O157: H7 using Pt–Au bimetal nanoparticles with peroxidase-like amplification. Biosens. Bioelectron. 2016, 77, 687–694. [Google Scholar] [CrossRef]
- Zhang, D.; Chen, Z.; Omar, H.; Deng, L.; Khashab, N.M. Colorimetric peroxidase mimetic assay for uranyl detection in sea water. ACS Appl. Mater. Interfaces 2015, 7, 4589–4594. [Google Scholar] [CrossRef] [PubMed]
- Ren, W.; Liu, W.; Irudayaraj, J. A net fishing enrichment strategy for colorimetric detection of E. coli O157: H7. Sens. Actuators B Chem. 2017, 247, 923–929. [Google Scholar] [CrossRef] [Green Version]
- Manea, F.; Houillon, F.B.; Pasquato, L.; Scrimin, P. Nanozymes: Gold-nanoparticle-based transphosphorylation catalysts. Angew. Chem. Int. Ed. 2004, 43, 6165–6169. [Google Scholar] [CrossRef]
- Wu, Y.; Darland, D.C.; Zhao, J.X. Nanozymes—Hitting the Biosensing “Target”. Sensors 2021, 21, 5201. [Google Scholar] [CrossRef] [PubMed]
- Wang, Q.; Wei, H.; Zhang, Z.; Wang, E.; Dong, S. Nanozyme: An emerging alternative to natural enzyme for biosensing and immunoassay. TrAC Trends Anal. Chem. 2018, 105, 218–224. [Google Scholar] [CrossRef]
- Sun, J.; Li, C.; Qi, Y.; Guo, S.; Liang, X. Optimizing colorimetric assay based on V2O5 nanozymes for sensitive detection of H2O2 and glucose. Sensors 2016, 16, 584. [Google Scholar] [CrossRef] [Green Version]
- Arias, P.G.; Martinez-Perez-Cejuela, H.; Combes, A.; Pichon, V.; Pereira, E.; Herrero-Martinez, J.M.; Bravo, M. Selective solid-phase extraction of organophosphorus pesticides and their oxon-derivatives from water samples using molecularly imprinted polymer followed by high-performance liquid chromatography with UV detection. J. Chromatogr. A 2020, 1626, 461346. [Google Scholar] [CrossRef]
- Cho, I.-H.; Bhunia, A.; Irudayaraj, J. Rapid pathogen detection by lateral-flow immunochromatographic assay with gold nanoparticle-assisted enzyme signal amplification. Int. J. Food Microbiol. 2015, 206, 60–66. [Google Scholar] [CrossRef] [PubMed]
- Huang, Y.; Ren, J.; Qu, X. Nanozymes: Classification, catalytic mechanisms, activity regulation, and applications. Chem. Rev. 2019, 119, 4357–4412. [Google Scholar] [CrossRef] [PubMed]
- Okada, E.; Coggan, T.; Anumol, T.; Clarke, B.; Allinson, G. A simple and rapid direct injection method for the determination of glyphosate and AMPA in environmental water samples. Anal. Bioanal. Chem. 2019, 411, 715–724. [Google Scholar] [CrossRef] [PubMed]
- Xu, Z.-L.; Deng, H.; Deng, X.-F.; Yang, J.-Y.; Jiang, Y.-M.; Zeng, D.-P.; Huang, F.; Shen, Y.-D.; Lei, H.-T.; Wang, H. Monitoring of organophosphorus pesticides in vegetables using monoclonal antibody-based direct competitive ELISA followed by HPLC–MS/MS. Food Chem. 2012, 131, 1569–1576. [Google Scholar] [CrossRef]
- Yan, X.; Li, H.; Wang, X.; Su, X. A novel fluorescence probing strategy for the determination of parathion-methyl. Talanta 2015, 131, 88–94. [Google Scholar] [CrossRef]
- Lan, W.; Chen, G.; Cui, F.; Tan, F.; Liu, R.; Yushupujiang, M. Development of a novel optical biosensor for detection of organophoshorus pesticides based on methyl parathion hydrolase immobilized by metal-chelate affinity. Sensors 2012, 12, 8477–8490. [Google Scholar] [CrossRef] [PubMed]
- Xu, S.; Guo, C.; Li, Y.; Yu, Z.; Wei, C.; Tang, Y. Methyl parathion imprinted polymer nanoshell coated on the magnetic nanocore for selective recognition and fast adsorption and separation in soils. J. Hazard. Mater. 2014, 264, 34–41. [Google Scholar] [CrossRef] [PubMed]
- Sun, X.; Gao, C.; Zhang, L.; Yan, M.; Yu, J.; Ge, S. Photoelectrochemical sensor based on molecularly imprinted film modified hierarchical branched titanium dioxide nanorods for chlorpyrifos detection. Sens. Actuators B Chem. 2017, 251, 1–8. [Google Scholar] [CrossRef]
- Yan, X.; Kong, D.; Jin, R.; Zhao, X.; Li, H.; Liu, F.; Lin, Y.; Lu, G. Fluorometric and colorimetric analysis of carbamate pesticide via enzyme-triggered decomposition of Gold nanoclusters-anchored MnO2 nanocomposite. Sens. Actuators B Chem. 2019, 290, 640–647. [Google Scholar] [CrossRef]
- Dong, P.; Jiang, B.; Zheng, J. A novel acetylcholinesterase biosensor based on gold nanoparticles obtained by electroless plating on three-dimensional graphene for detecting organophosphorus pesticides in water and vegetable samples. Anal. Methods 2019, 11, 2428–2434. [Google Scholar] [CrossRef]
- Li, X.; Cui, H.; Zeng, Z. A simple colorimetric and fluorescent sensor to detect organophosphate pesticides based on adenosine triphosphate-modified gold nanoparticles. Sensors 2018, 18, 4302. [Google Scholar] [CrossRef] [Green Version]
- Wang, P.; Wan, Y.; Ali, A.; Deng, S.; Su, Y.; Fan, C.; Yang, S. Aptamer-wrapped gold nanoparticles for the colorimetric detection of omethoate. Sci. China Chem. 2016, 59, 237–242. [Google Scholar] [CrossRef]
- Ren, S.; Zhou, F.; Xu, C.; Li, B. Simple method for visual detection of glutathione S-transferase activity and inhibition using cysteamine-capped gold nanoparticles as colorimetric probes. Gold Bull. 2015, 48, 147–152. [Google Scholar] [CrossRef] [Green Version]
- Riaz, M.; Mutreja, V.; Sareen, S.; Ahmad, B.; Faheem, M.; Zahid, N.; Jabbour, G.; Park, J. Exceptional antibacterial and cytotoxic potency of monodisperse greener AgNPs prepared under optimized pH and temperature. Sci. Rep. 2021, 11, 1–11. [Google Scholar]
- Ganapuram, B.R.; Alle, M.; Dadigala, R.; Dasari, A.; Maragoni, V.; Guttena, V. Catalytic reduction of methylene blue and Congo red dyes using green synthesized gold nanoparticles capped by salmalia malabarica gum. Int. Nano Lett. 2015, 5, 215–222. [Google Scholar] [CrossRef] [Green Version]
- Sobczak-Kupiec, A.; Malina, D.; Zimowska, M.; Wzorek, Z. Characterization of gold nanoparticles for various medical application. Dig. J. Nanomater. Biostruct. 2011, 6, 803–808. [Google Scholar]
- Ren, S.; Li, B.; Zhang, L. Visual detection of hexokinase activity and inhibition with positively charged gold nanoparticles as colorimetric probes. Analyst 2013, 138, 3142–3145. [Google Scholar] [CrossRef] [PubMed]
- Shah, A.; Tauseef, I.; Ali, M.B.; Yameen, M.A.; Mezni, A.; Hedfi, A.; Haleem, S.K.; Haq, S. In-Vitro and In-Vivo Tolerance and Therapeutic Investigations of Phyto-Fabricated Iron Oxide Nanoparticles against Selected Pathogens. Toxics 2021, 9, 105. [Google Scholar] [CrossRef] [PubMed]
- Zheng, J. Improving Sample Preparation Methods to Assess Nanoparticle Agglomeration using TEM. Microsc. Microanal. 2014, 20, 1236–1237. [Google Scholar] [CrossRef] [Green Version]
- Nakaso, K.; Shimada, M.; Okuyama, K.; Deppert, K. Evaluation of the change in the morphology of gold nanoparticles during sintering. J. Aerosol Sci. 2002, 33, 1061–1074. [Google Scholar] [CrossRef]
- Keene, A.M.; Tyner, K.M. Analytical characterization of gold nanoparticle primary particles, aggregates, agglomerates, and agglomerated aggregates. J. Nanopart. Res. 2011, 13, 3465–3481. [Google Scholar] [CrossRef]
- Turner, M.; Golovko, V.B.; Vaughan, O.P.; Abdulkin, P.; Berenguer-Murcia, A.; Tikhov, M.S.; Johnson, B.F.; Lambert, R.M. Selective oxidation with dioxygen by gold nanoparticle catalysts derived from 55-atom clusters. Nature 2008, 454, 981–983. [Google Scholar] [CrossRef] [PubMed]
- Chang, C.-C.; Chen, C.-P.; Wu, T.-H.; Yang, C.-H.; Lin, C.-W.; Chen, C.-Y. Gold nanoparticle-based colorimetric strategies for chemical and biological sensing applications. Nanomaterials 2019, 9, 861. [Google Scholar] [CrossRef] [PubMed] [Green Version]
- Liu, D.; Yang, J.; Wang, H.-F.; Wang, Z.; Huang, X.; Wang, Z.; Niu, G.; Hight Walker, A.; Chen, X. Glucose oxidase-catalyzed growth of gold nanoparticles enables quantitative detection of attomolar cancer biomarkers. Anal. Chem. 2014, 86, 5800–5806. [Google Scholar] [CrossRef] [PubMed]
- Sun, Y.; Tan, H.; Li, Y. A colorimetric assay for acetylcholinesterase activity and inhibitor screening based on the thiocholine–induced inhibition of the oxidative power of MnO 2 nanosheets on 3, 3′, 5, 5′–tetramethylbenzidine. Microchim. Acta 2018, 185, 1–8. [Google Scholar] [CrossRef]
- Cho, I.-H.; Irudayaraj, J. Lateral-flow enzyme immunoconcentration for rapid detection of Listeria monocytogenes. Anal. Bioanal. Chem. 2013, 405, 3313–3319. [Google Scholar] [CrossRef] [PubMed]
- Liu, L.; Du, J.; Liu, W.-e.; Guo, Y.; Wu, G.; Qi, W.; Lu, X. Enhanced His@ AuNCs oxidase-like activity by reduced graphene oxide and its application for colorimetric and electrochemical detection of nitrite. Anal. Bioanal. Chem. 2019, 411, 2189–2200. [Google Scholar] [CrossRef]
- El Alami, A.; Lagarde, F.; Huo, Q.; Zheng, T.; Baitoul, M.; Daniel, P. Acetylcholine and acetylcholinesterase inhibitors detection using gold nanoparticles coupled with dynamic light scattering. Sens. Int. 2020, 1, 100007. [Google Scholar] [CrossRef]
- Ma, Y.; Jiang, L.; Mei, Y.; Song, R.; Tian, D.; Huang, H. Colorimetric sensing strategy for mercury (II) and melamine utilizing cysteamine-modified gold nanoparticles. Analyst 2013, 138, 5338–5343. [Google Scholar] [CrossRef]
- Atallah, C.; Charcosset, C.; Greige-Gerges, H. Challenges for cysteamine stabilization, quantification, and biological effects improvement. J. Pharm. Anal. 2020, 10, 499–516. [Google Scholar] [CrossRef]
- Ren, W.; Mohammed, S.I.; Wereley, S.; Irudayaraj, J. Magnetic focus lateral flow sensor for detection of cervical cancer biomarkers. Anal. Chem. 2019, 91, 2876–2884. [Google Scholar] [CrossRef]
- Meng, X.; Schultz, C.W.; Cui, C.; Li, X.; Yu, H.-Z. On-site chip-based colorimetric quantitation of organophosphorus pesticides using an office scanner. Sens. Actuators B Chem. 2015, 215, 577–583. [Google Scholar] [CrossRef]
- Guo, J.; Wong, J.X.; Cui, C.; Li, X.; Yu, H.-Z. A smartphone-readable barcode assay for the detection and quantitation of pesticide residues. Analyst 2015, 140, 5518–5525. [Google Scholar] [CrossRef] [PubMed]
- Shields, J.N.; Hales, E.C.; Ranspach, L.E.; Luo, X.; Orr, S.; Runft, D.; Dombkowski, A.; Neely, M.N.; Matherly, L.H.; Taub, J.W.J.T. Exposure of larval zebrafish to the insecticide propoxur induced developmental delays that correlate with behavioral abnormalities and altered expression of hspb9 and hspb11. Toxics 2019, 7, 50. [Google Scholar] [CrossRef] [Green Version]
- Colovic, M.B.; Krstic, D.Z.; Lazarevic-Pasti, T.D.; Bondzic, A.M.; Vasic, V.M. Acetylcholinesterase inhibitors: Pharmacology and toxicology. Curr. Neuropharmacol. 2013, 11, 315–335. [Google Scholar] [CrossRef] [PubMed] [Green Version]

Publisher’s Note: MDPI stays neutral with regard to jurisdictional claims in published maps and institutional affiliations. |
© 2021 by the authors. Licensee MDPI, Basel, Switzerland. This article is an open access article distributed under the terms and conditions of the Creative Commons Attribution (CC BY) license (https://creativecommons.org/licenses/by/4.0/).