
Smartphone-Based Device for Colorimetric Detection of MicroRNA Biomarkers Using Nanoparticle-Based Assay


Abstract
:1. Introduction
2. Methods
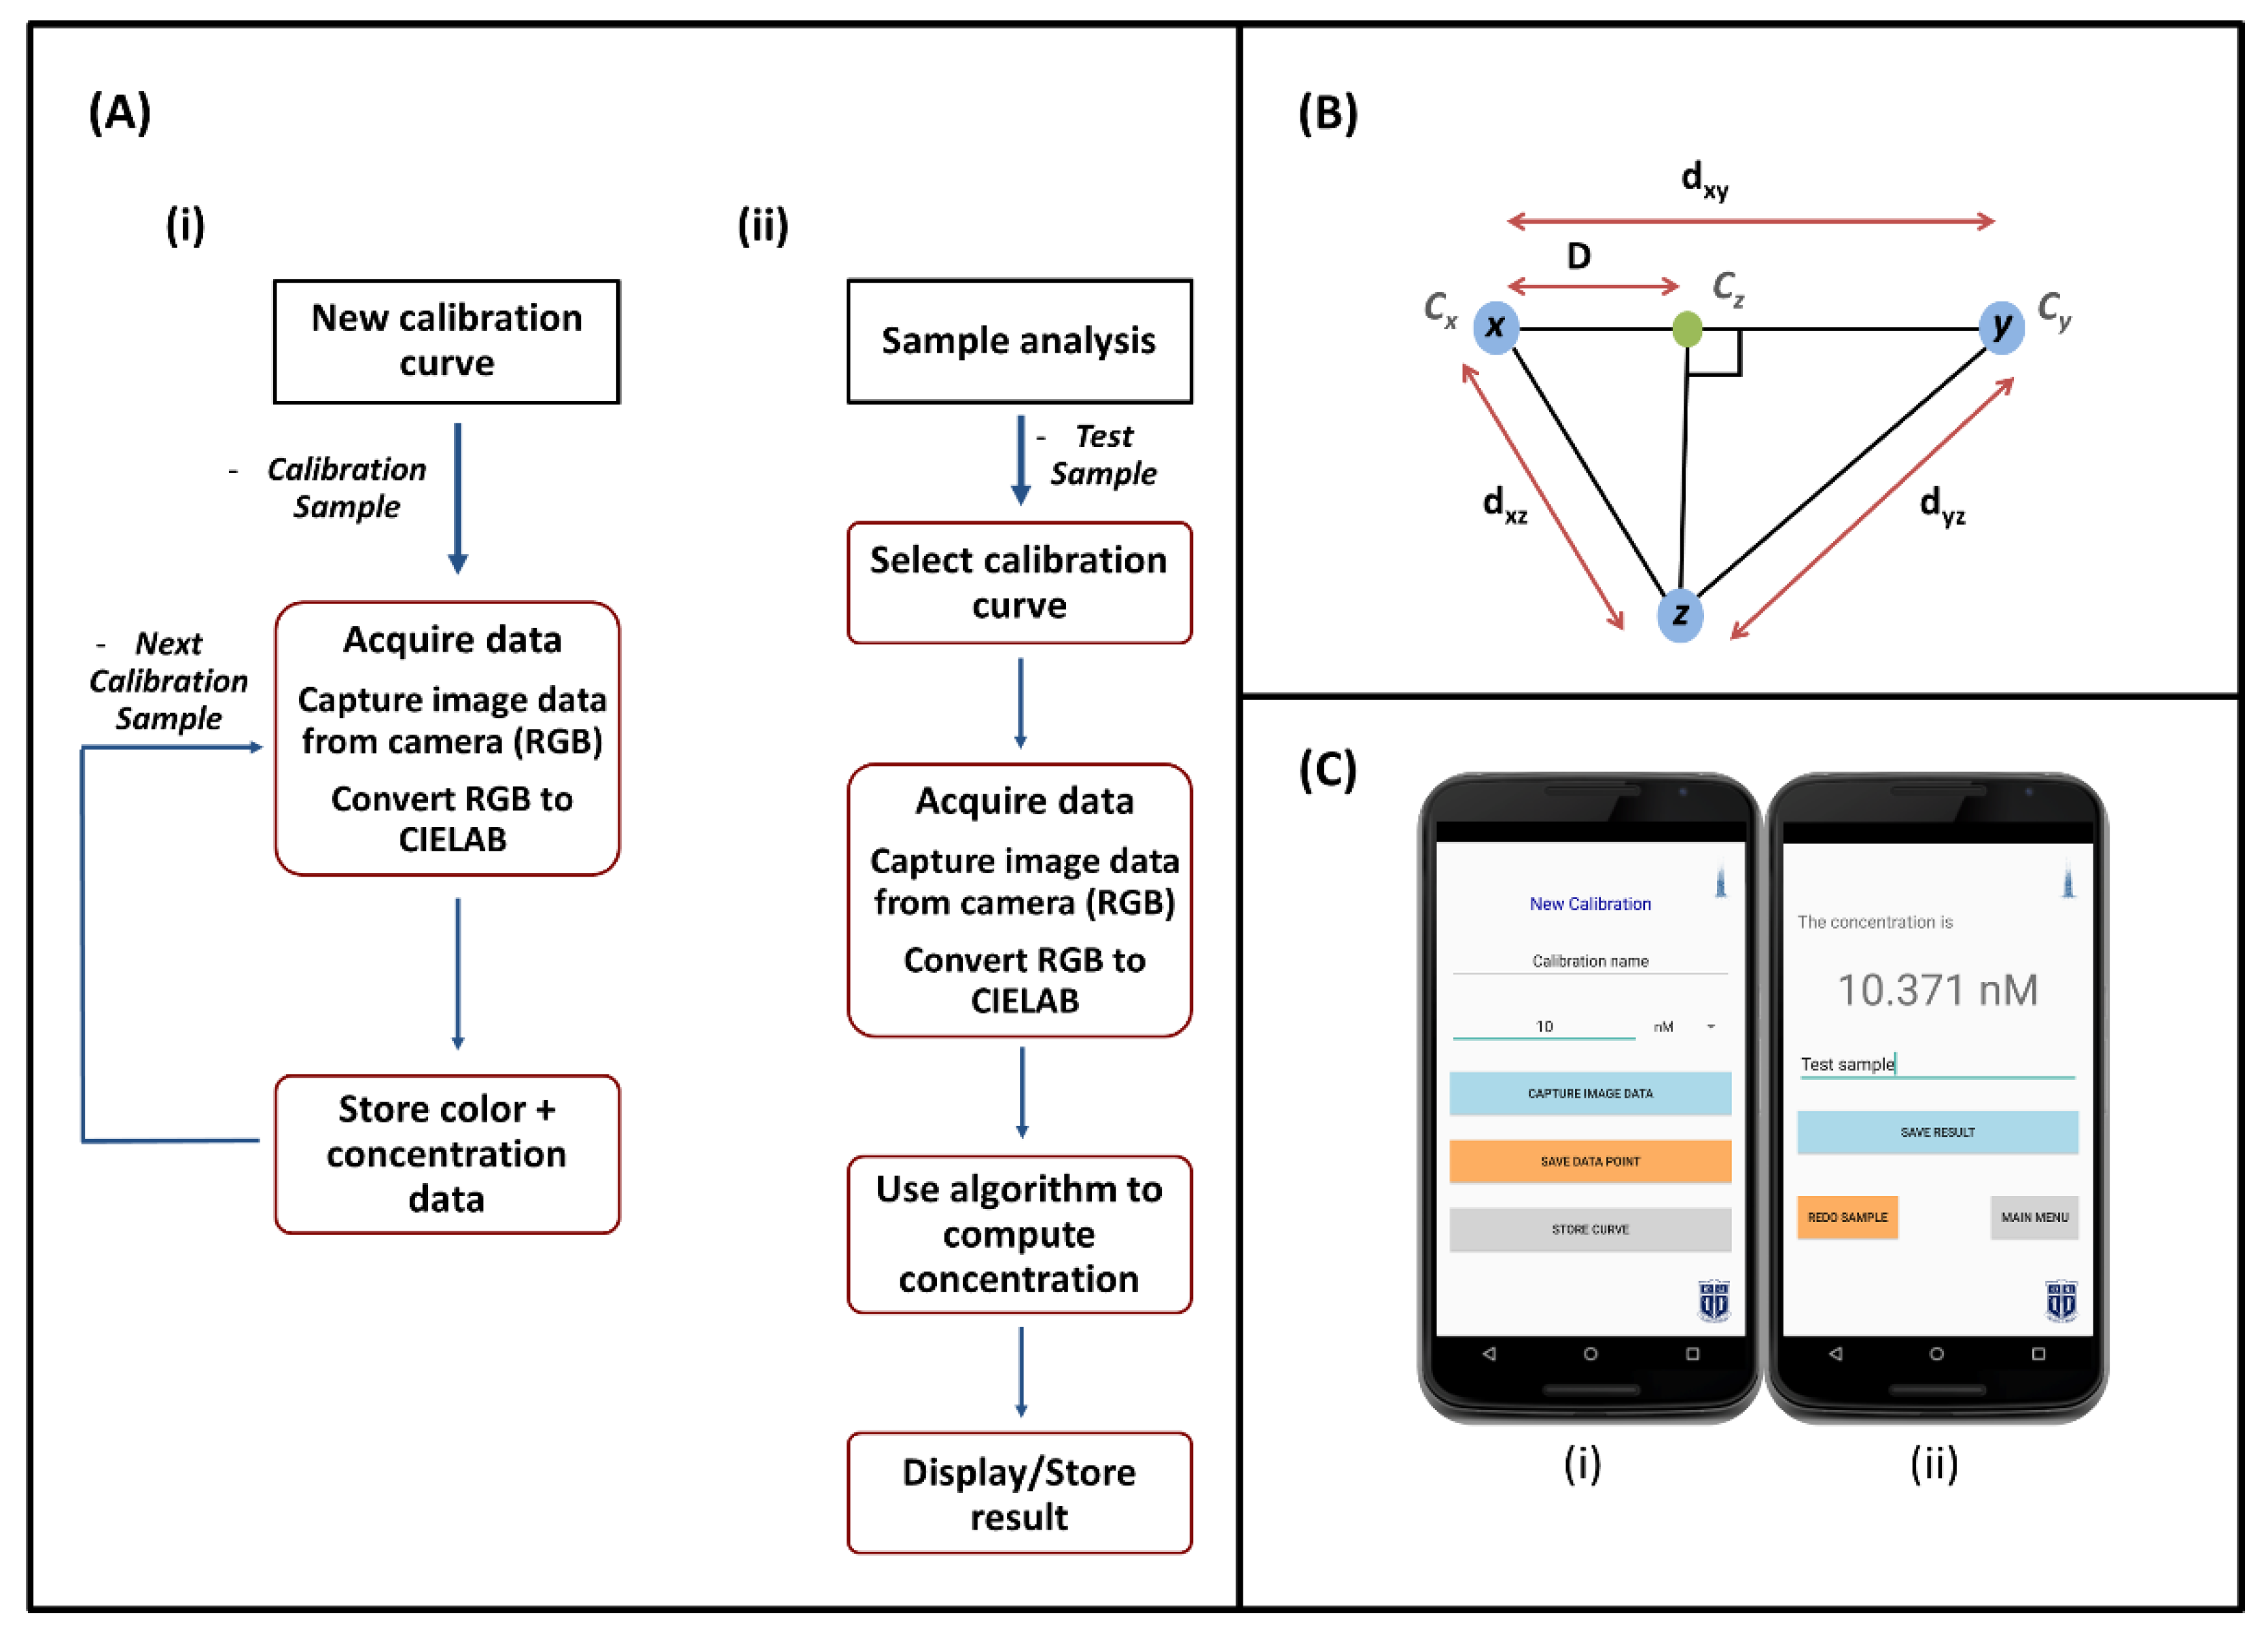
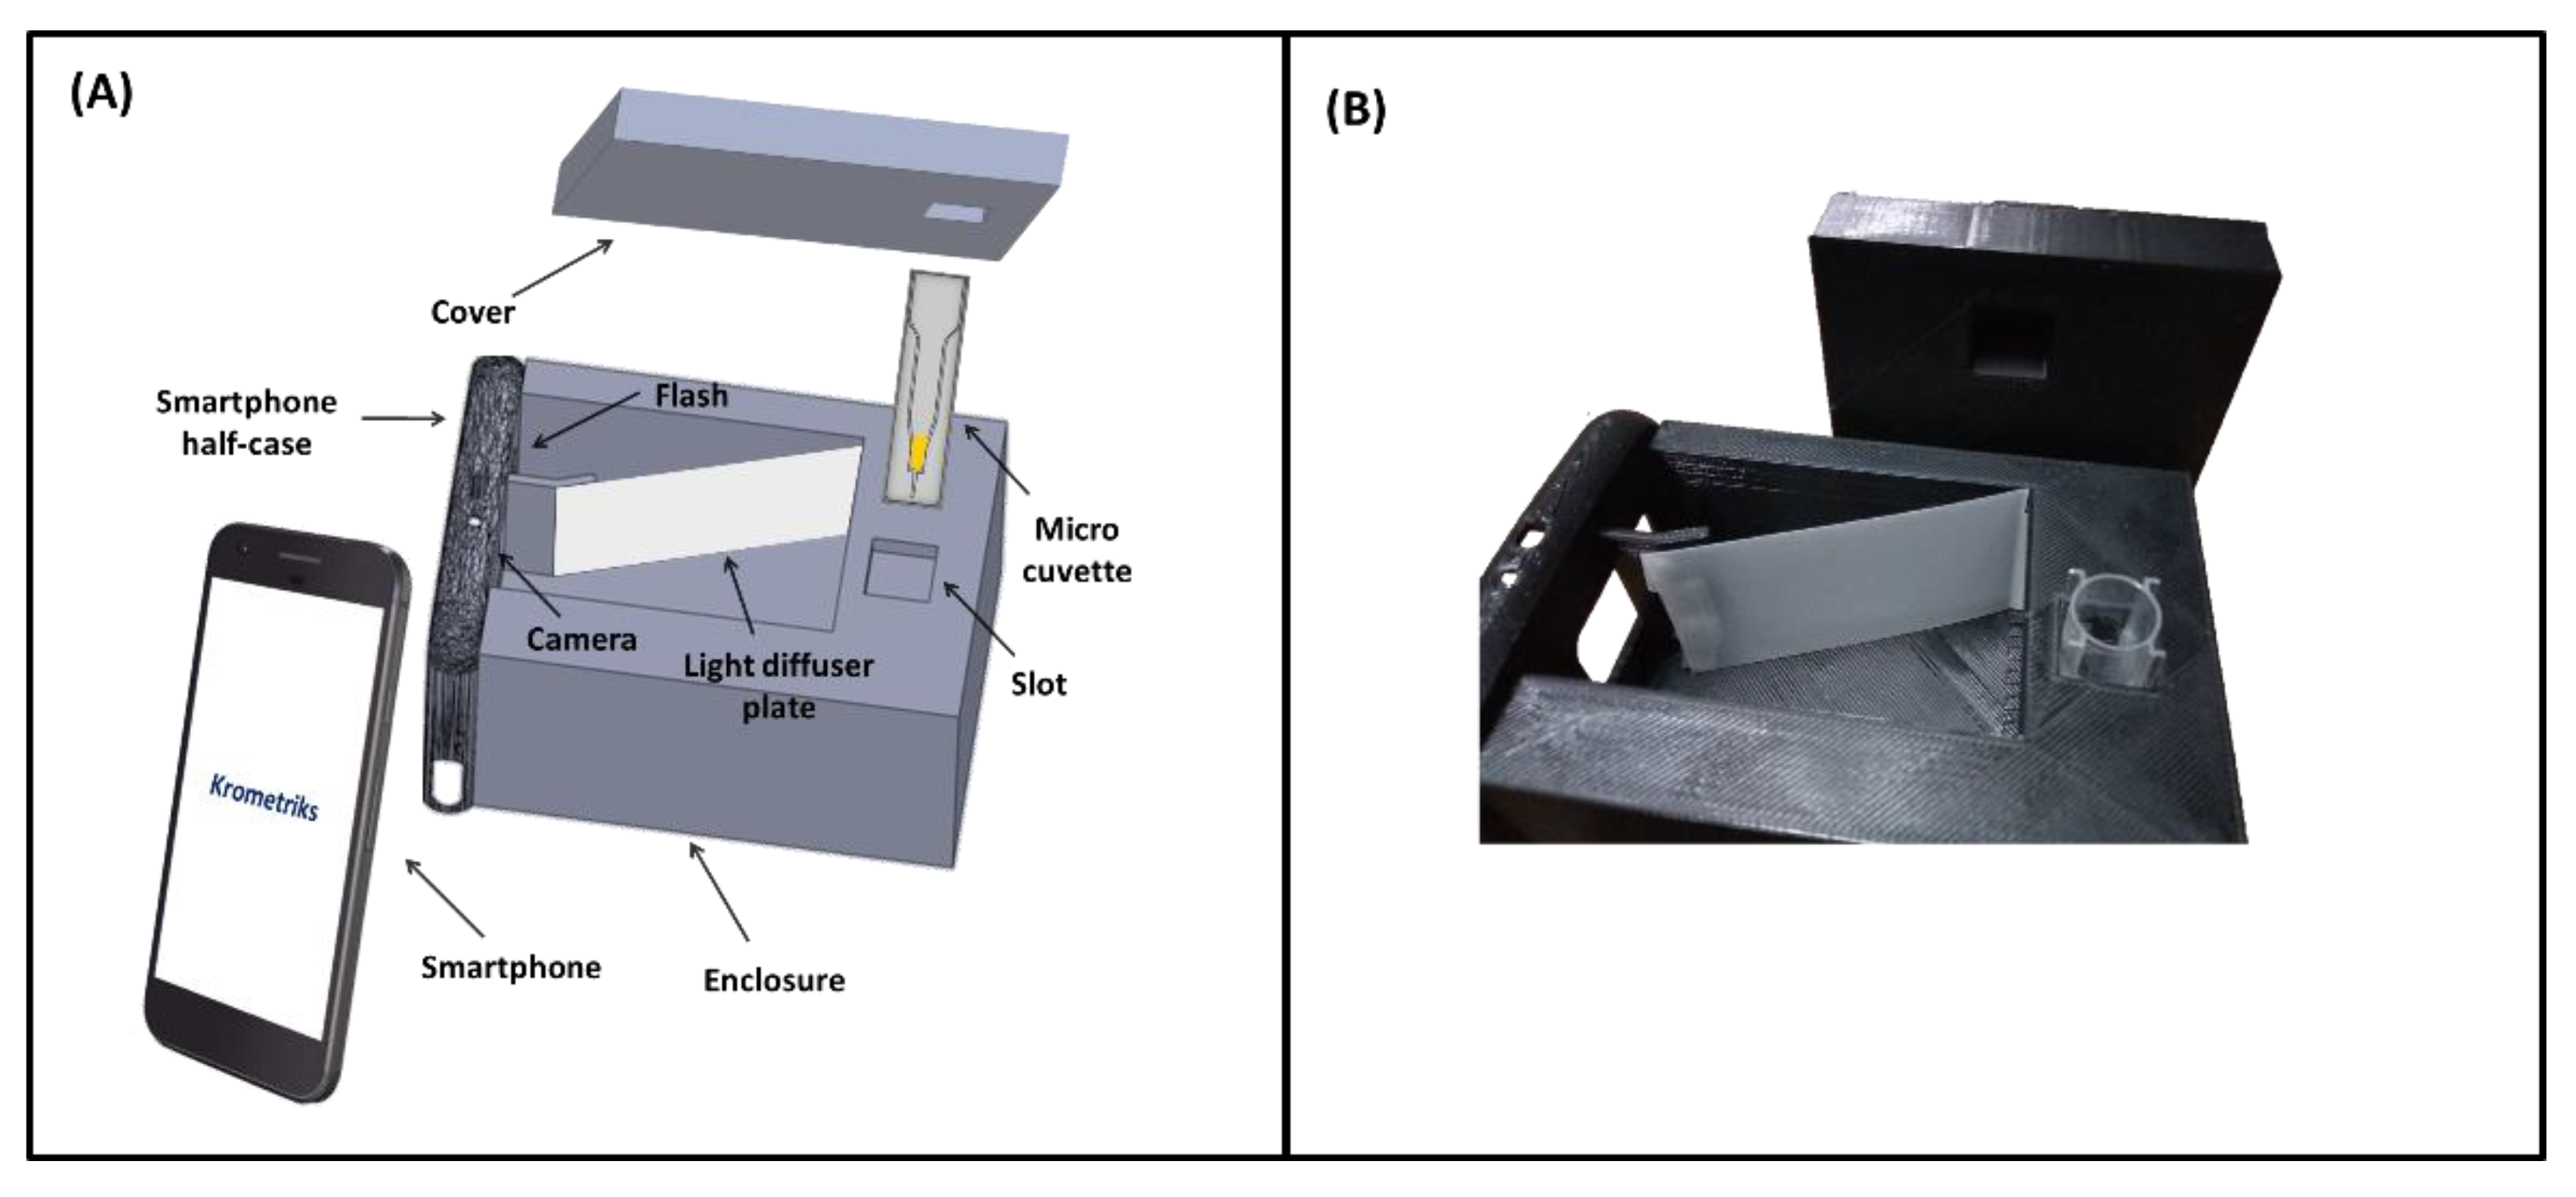
2.1. Device Design
2.2. Smartphone Software
2.2.1. Calibration
2.2.2. Color Space Conversion
2.2.3. Sample Analysis
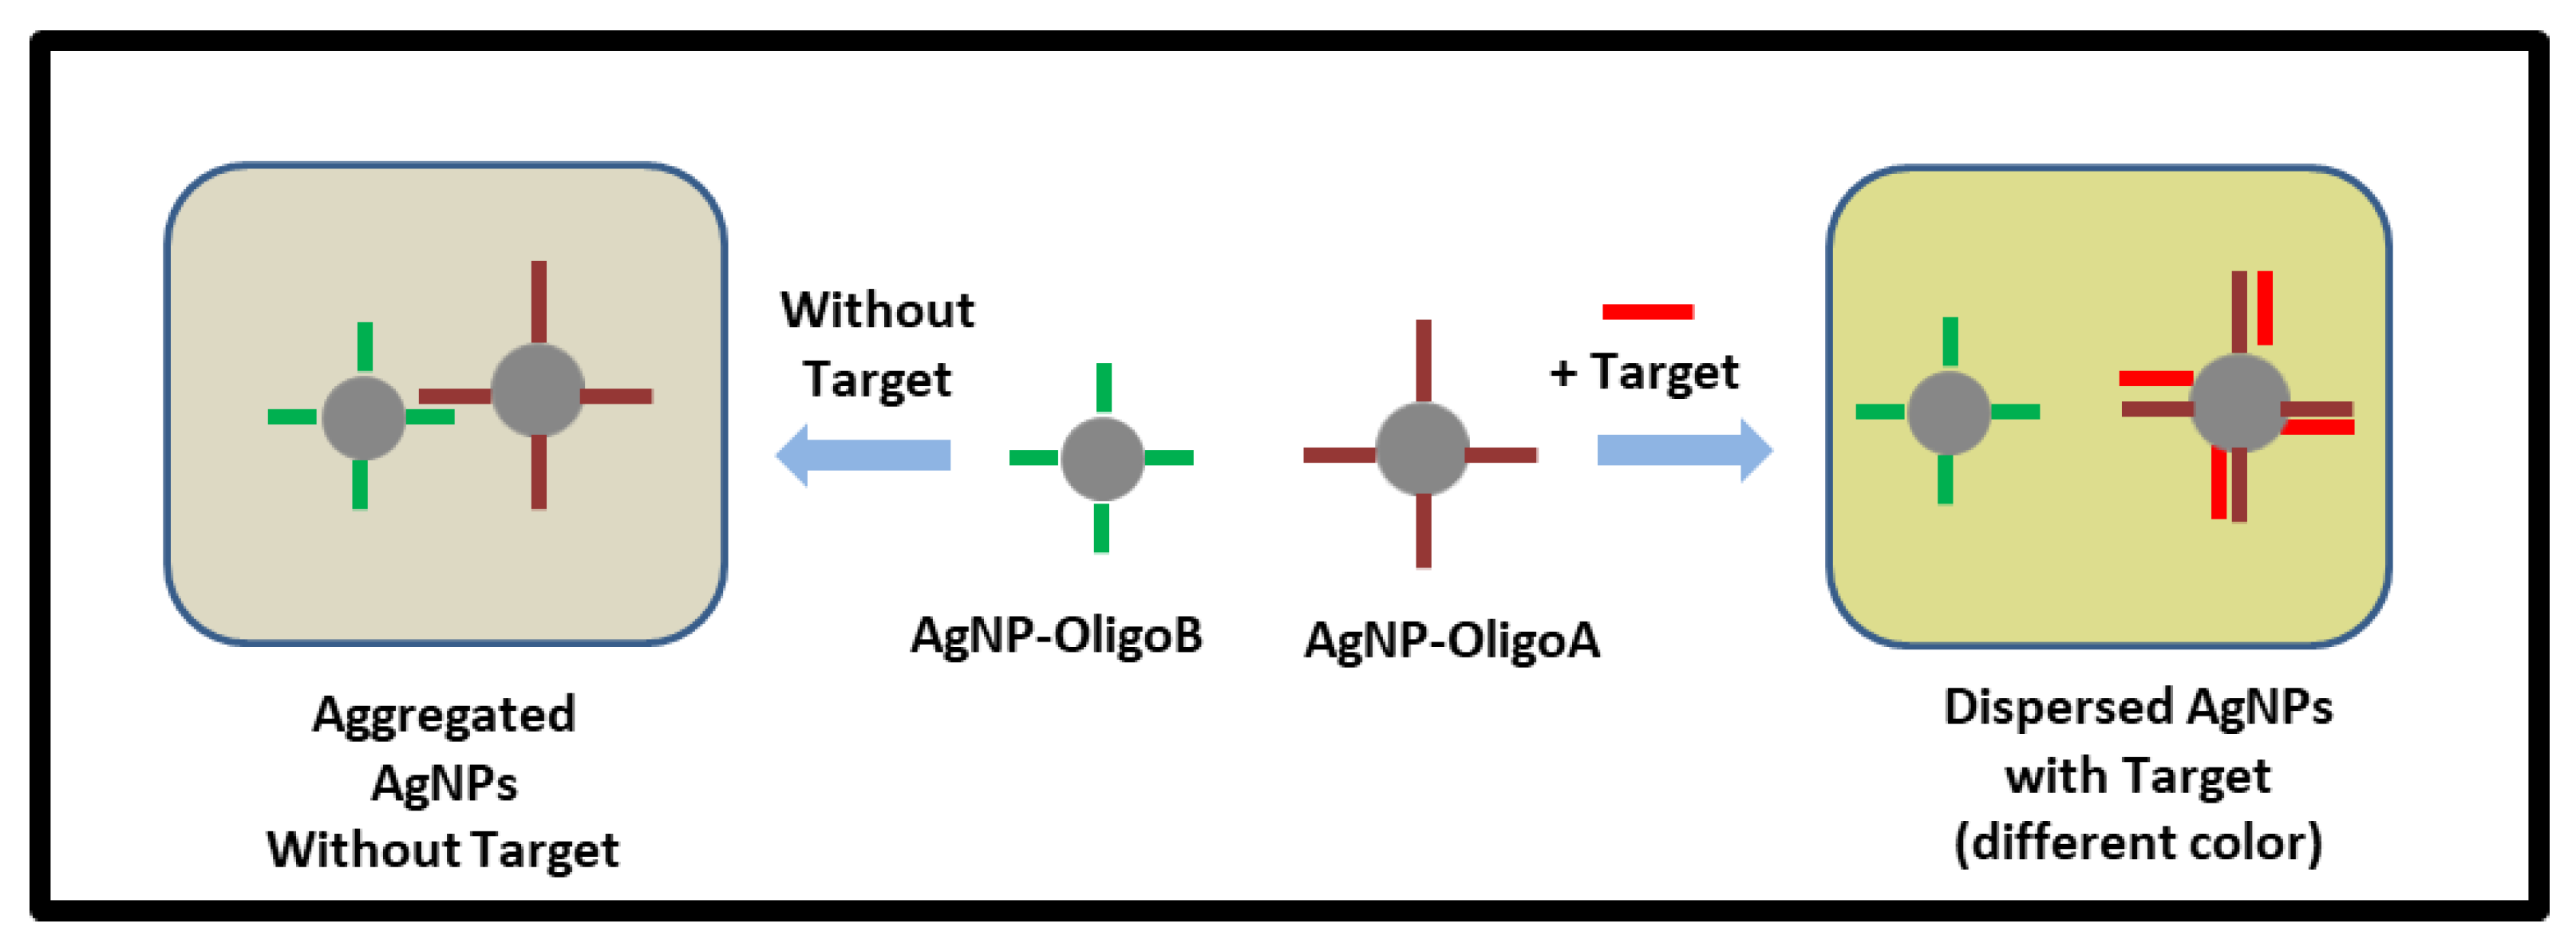
2.3. Nanoparticle Assay Based on Plasmonic Coupling Interference
2.4. Sample Preparation
2.5. Statistical Analysis
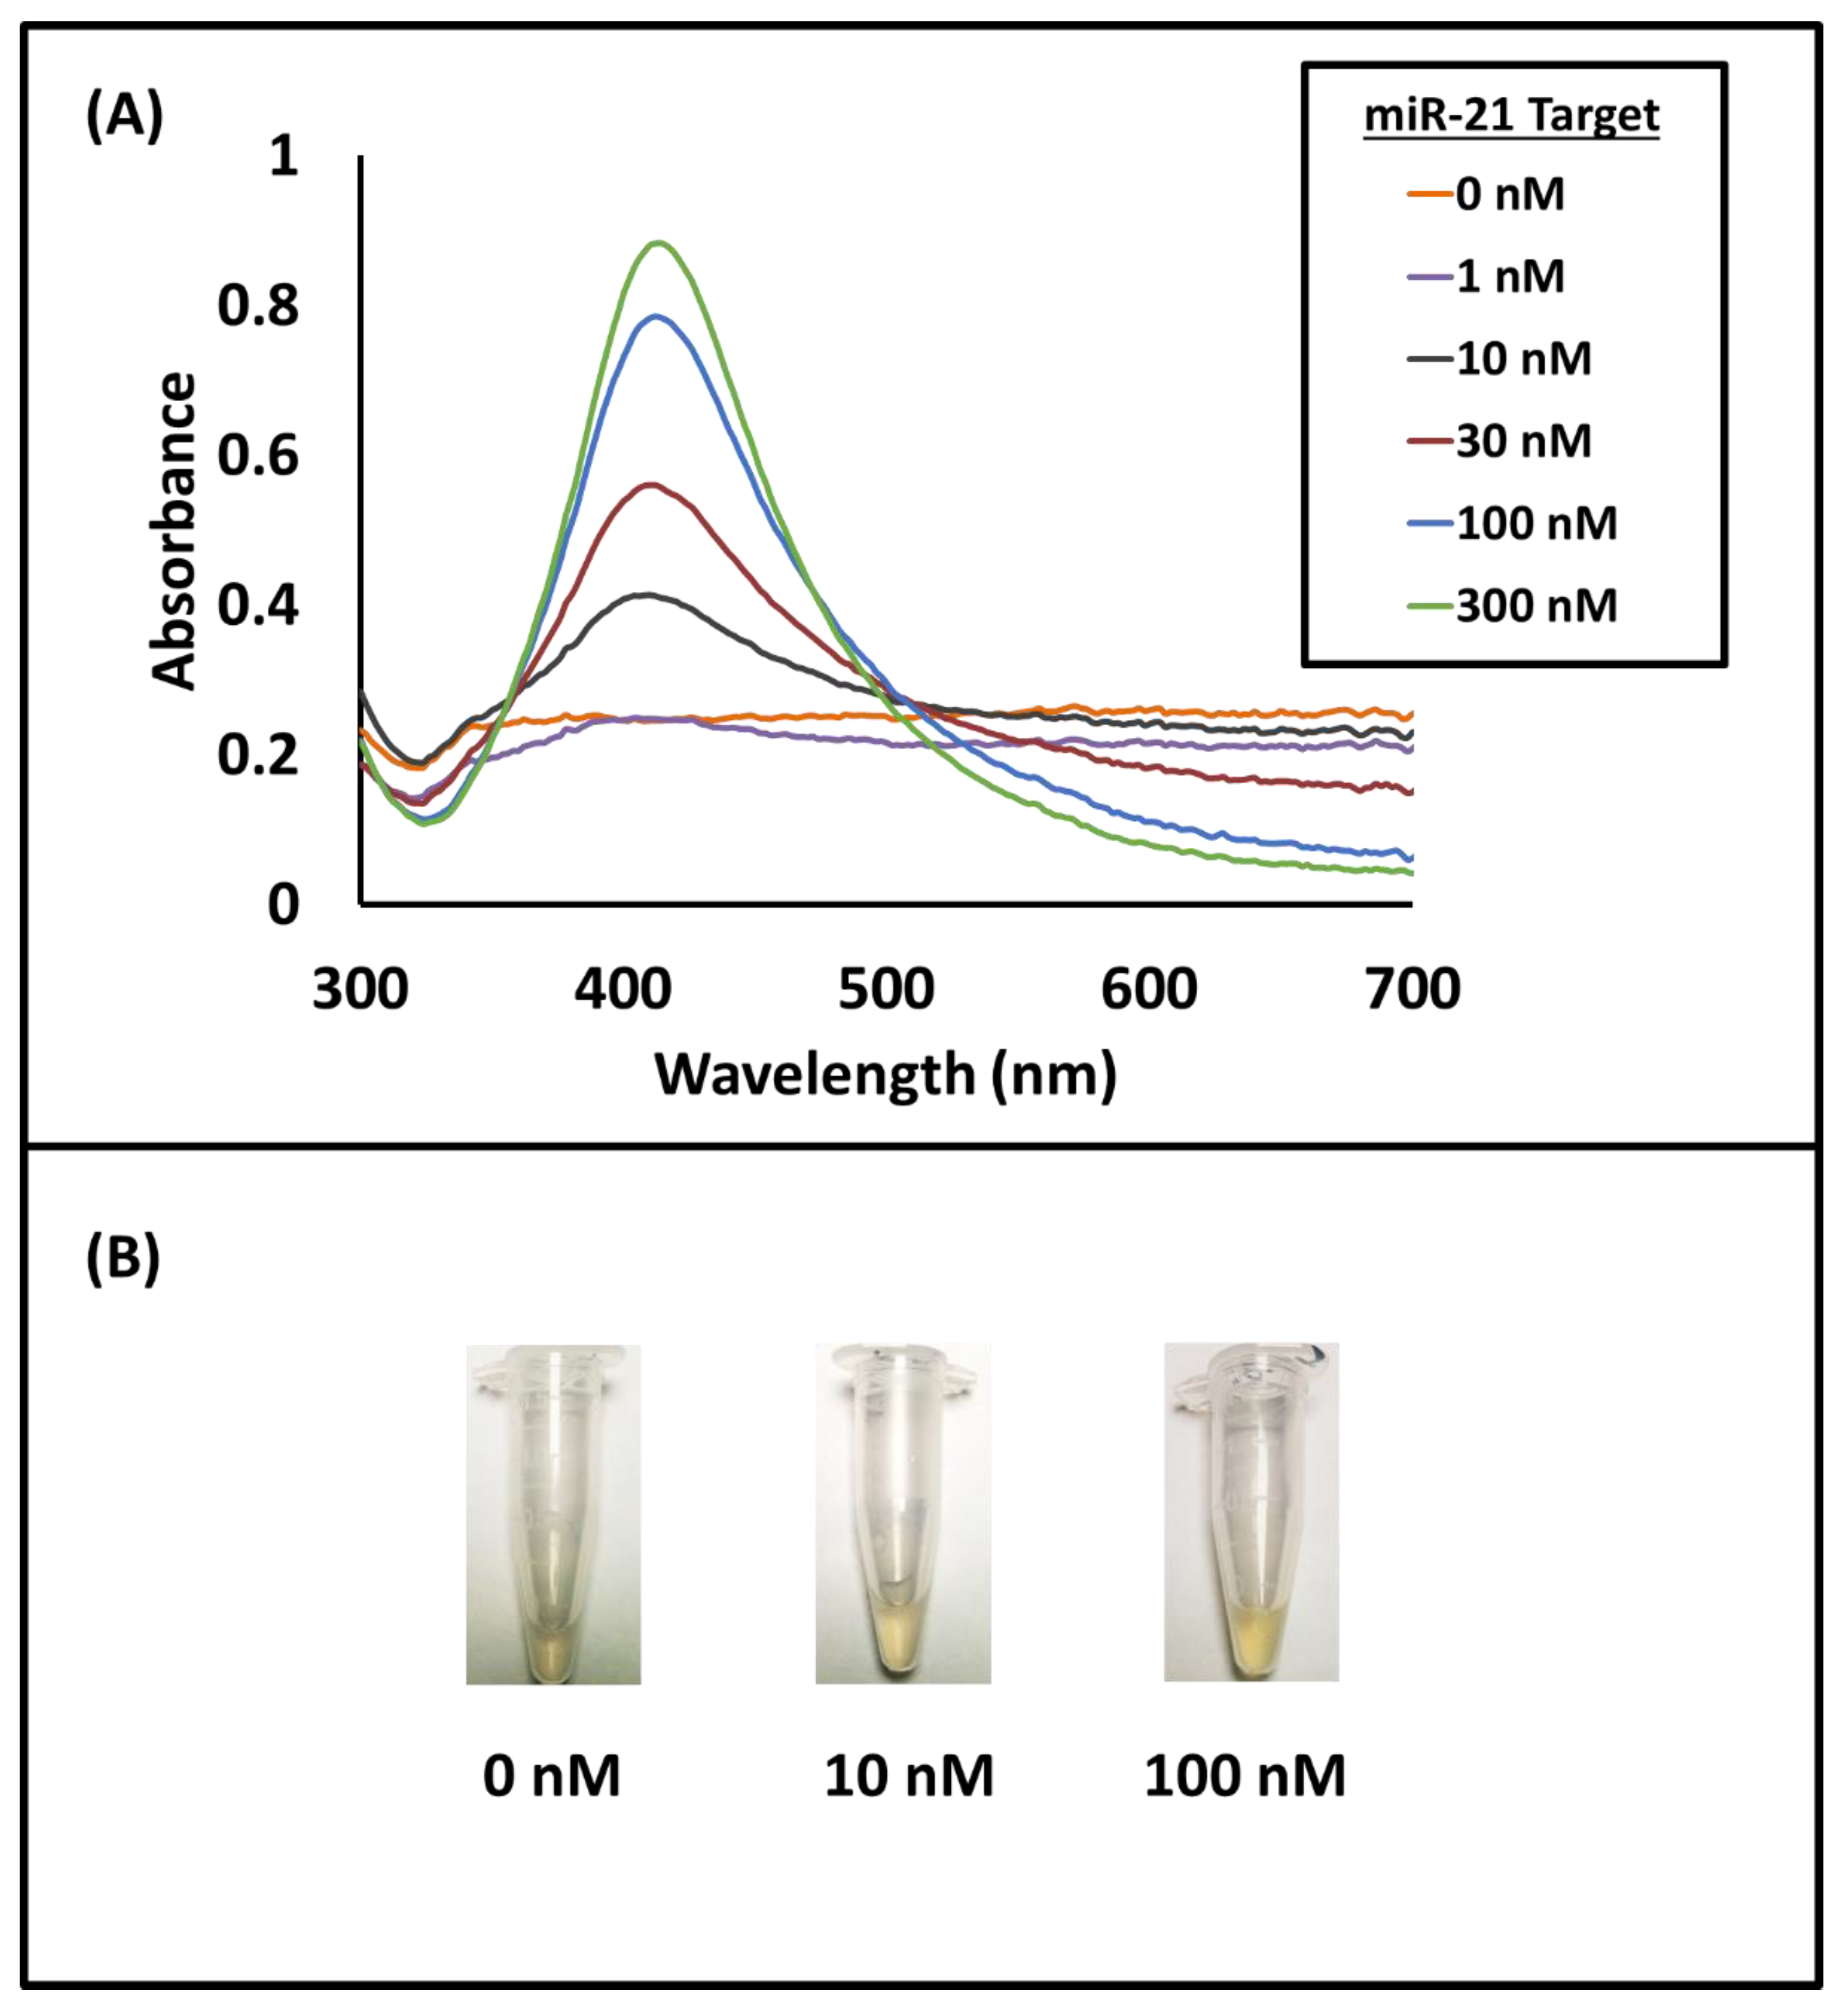
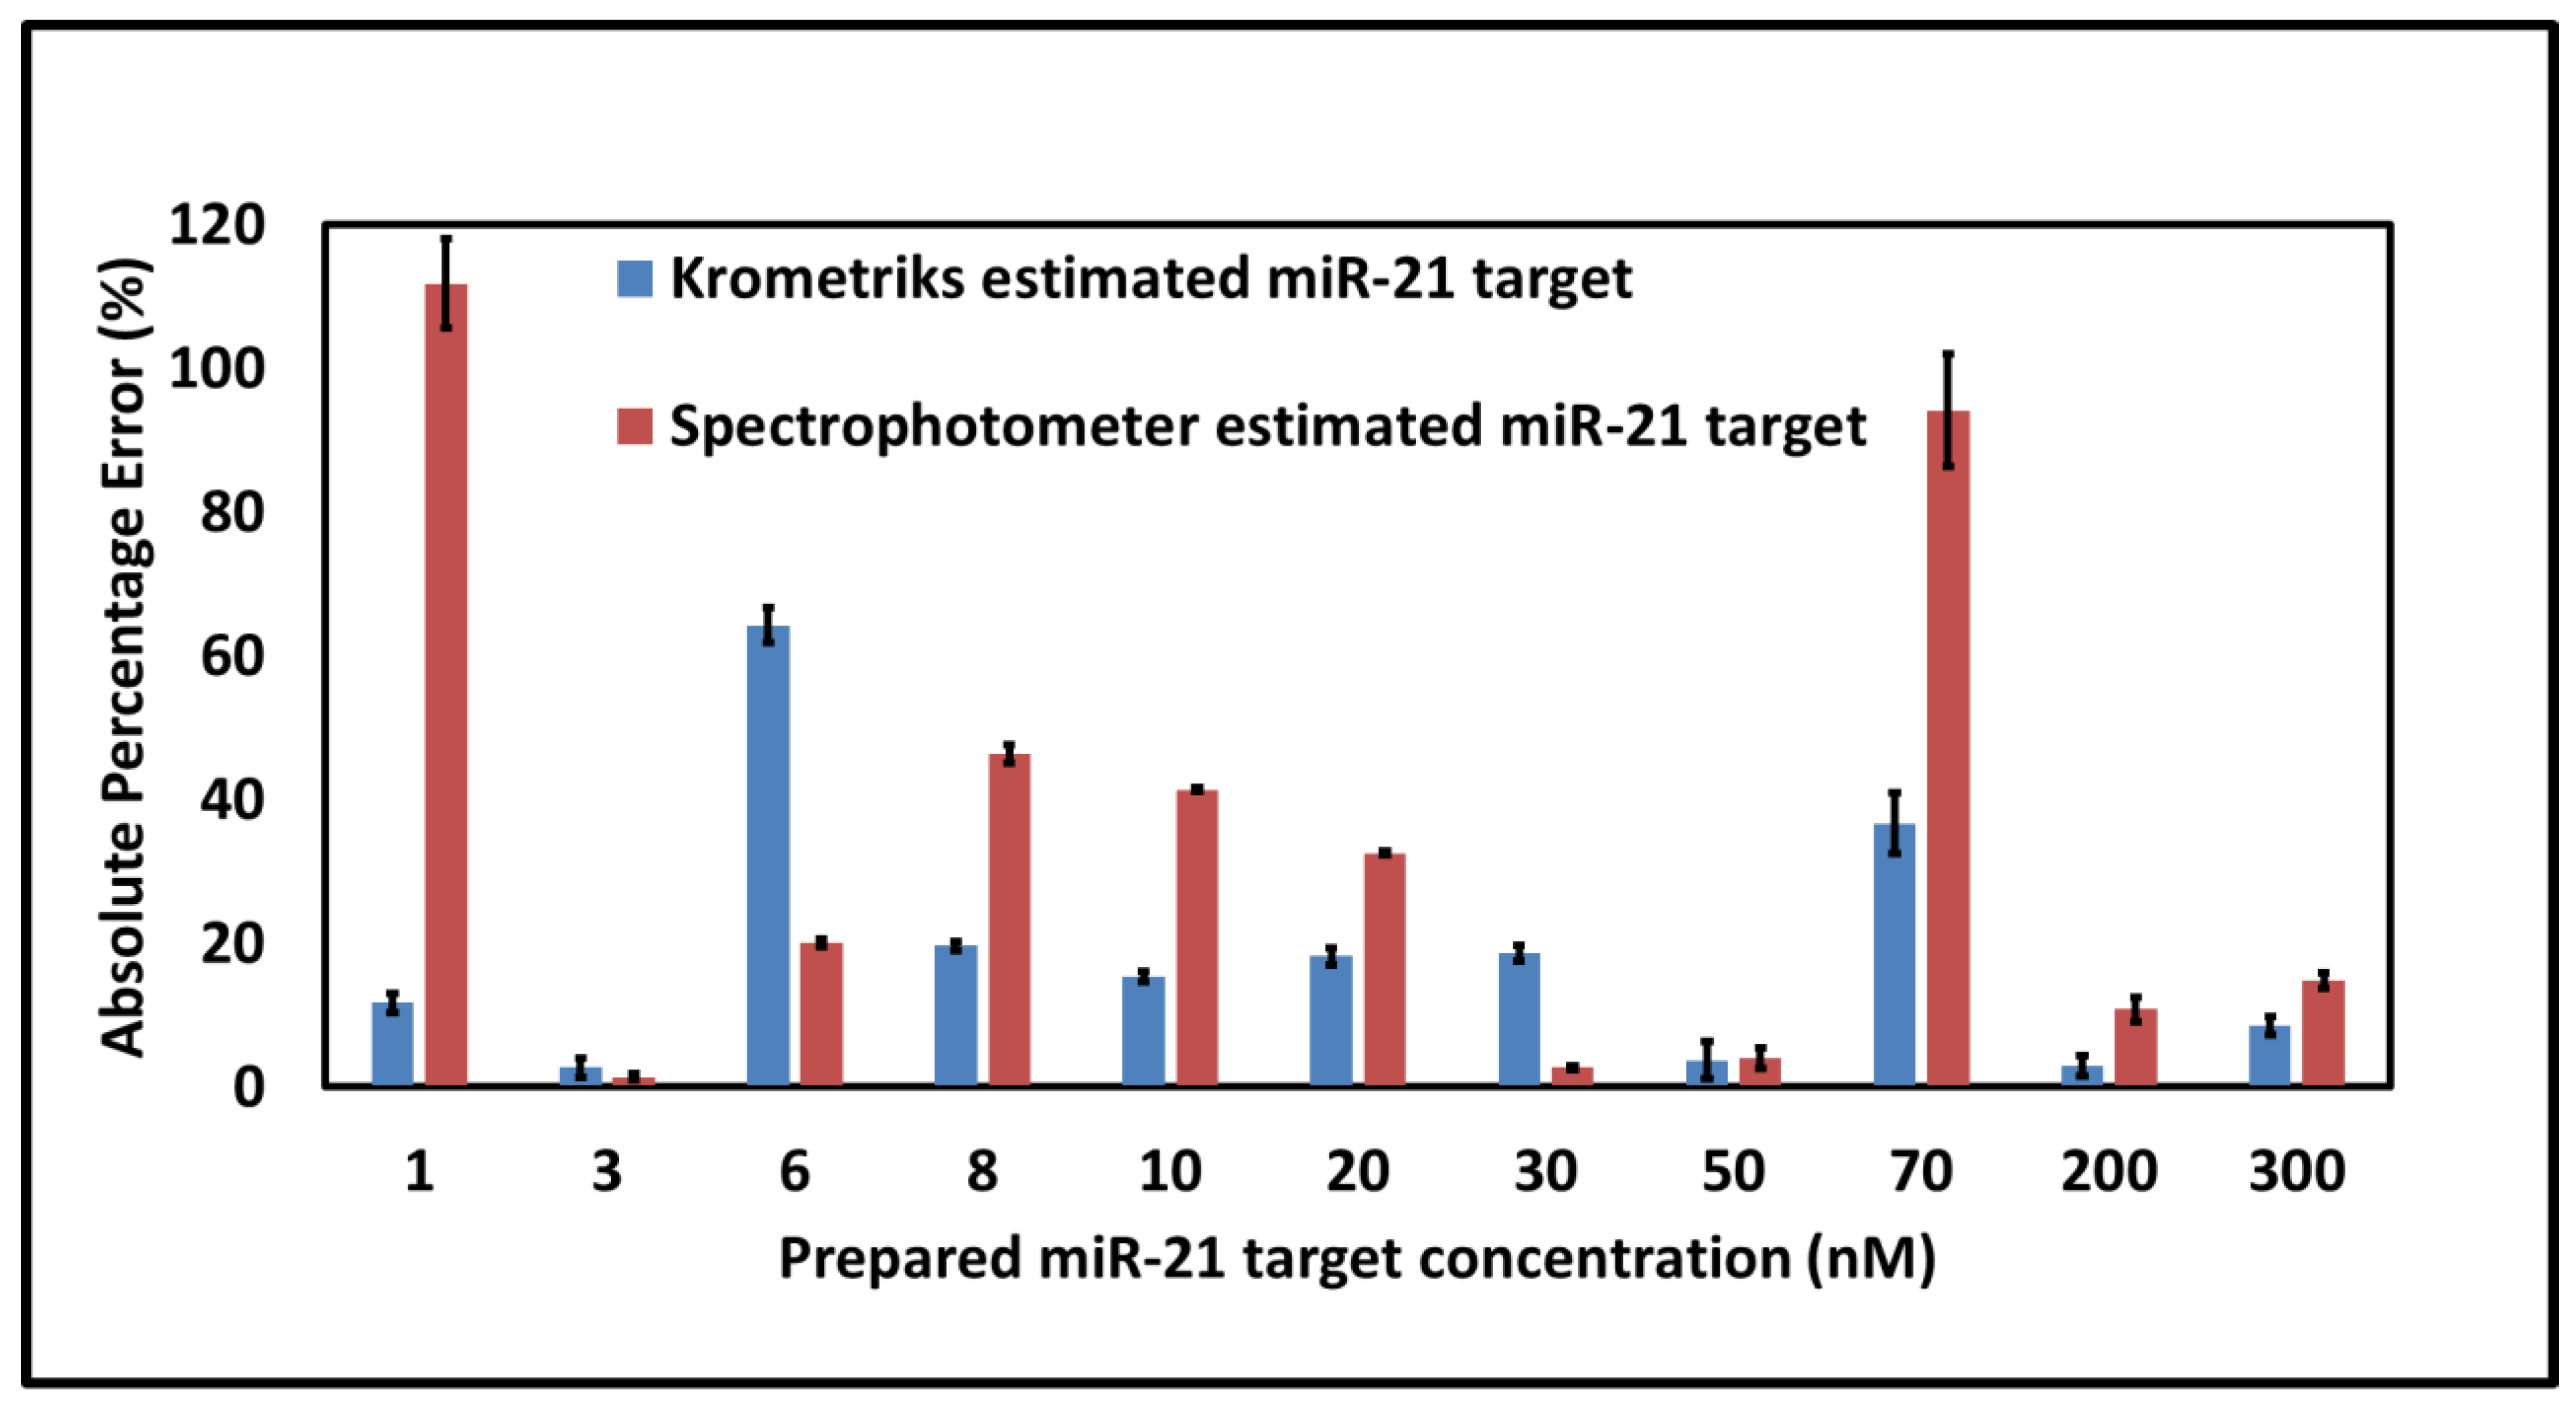
3. Results and Discussion
4. Conclusions
Supplementary Materials
Author Contributions
Funding
Institutional Review Board Statement
Informed Consent Statement
Acknowledgments
Conflicts of Interest
References
- He, L.; Hannon, G.J. MicroRNAs: Small RNAs with a Big Role in Gene Regulation. Nat. Rev. Genet. 2004, 5, 522–531. [Google Scholar] [CrossRef]
- Weber, J.A.; Baxter, D.H.; Zhang, S.; Huang, D.Y.; Huang, K.H.; Lee, M.J.; Galas, D.J.; Wang, K. The MicroRNA Spectrum in 12 Body Fluids. Clin. Chem. 2010, 56, 1733–1741. [Google Scholar] [CrossRef]
- Romaine, S.P.R.; Tomaszewski, M.; Condorelli, G.; Samani, N.J. MicroRNAs in Cardiovascular Disease: An Introduction for Clinicians. Heart 2015, 101, 921–928. [Google Scholar] [CrossRef]
- Verma, P.; Pandey, R.K.; Prajapati, P.; Prajapati, V.K. Circulating MicroRNAs: Potential and Emerging Biomarkers for Diagnosis of Human Infectious Diseases. Front. Microbiol. 2016, 7, 1274. [Google Scholar] [CrossRef]
- Basak, I.; Patil, K.S.; Alves, G.; Larsen, J.P.; Møller, S.G. MicroRNAs as Neuroregulators, Biomarkers and Therapeutic Agents in Neurodegenerative Diseases. Cell Mol. Life Sci. 2016, 73, 811–827. [Google Scholar] [CrossRef]
- Guay, C.; Regazzi, R. Circulating MicroRNAs as Novel Biomarkers for Diabetes Mellitus. Nat. Rev. Endocrinol. 2013, 9, 513–521. [Google Scholar] [CrossRef] [Green Version]
- Hicks, S.D.; Middleton, F.A. A Comparative Review of MicroRNA Expression Patterns in Autism Spectrum Disorder. Front. Psychiatry 2016, 7, 176. [Google Scholar] [CrossRef] [Green Version]
- Redell, J.B.; Moore, A.N.; Ward, N.H.; Hergenroeder, G.W.; Dash, P.K. Human Traumatic Brain Injury Alters Plasma MicroRNA Levels. J. Neurotrauma 2010, 27, 2147–2156. [Google Scholar] [CrossRef]
- Mouillet-Richard, S.; Baudry, A.; Launay, J.-M.; Kellermann, O. MicroRNAs and Depression. Neurobiol. Dis. 2012, 46, 272–278. [Google Scholar] [CrossRef]
- Reid, G.; Kirschner, M.B.; van Zandwijk, N. Circulating MicroRNAs: Association with Disease and Potential Use as Biomarkers. Crit. Rev. Oncol. Hematol. 2011, 80, 193–208. [Google Scholar] [CrossRef]
- Weiland, M.; Gao, X.-H.; Zhou, L.; Mi, Q.-S. Small RNAs Have a Large Impact: Circulating MicroRNAs as Biomarkers for Human Diseases. RNA Biol. 2012, 9, 850–859. [Google Scholar] [CrossRef] [Green Version]
- Hayes, J.; Peruzzi, P.P.; Lawler, S. MicroRNAs in Cancer: Biomarkers, Functions and Therapy. Trends Mol. Med. 2014, 20, 460–469. [Google Scholar] [CrossRef]
- Iorio, M.V.; Croce, C.M. MicroRNA Dysregulation in Cancer: Diagnostics, Monitoring and Therapeutics. A Comprehensive Review. EMBO Mol. Med. 2012, 4, 143–159. [Google Scholar] [CrossRef]
- Lu, J.; Getz, G.; Miska, E.A.; Alvarez-Saavedra, E.; Lamb, J.; Peck, D.; Sweet-Cordero, A.; Ebert, B.L.; Mak, R.H.; Ferrando, A.A.; et al. MicroRNA Expression Profiles Classify Human Cancers. Nature 2005, 435, 834–838. [Google Scholar] [CrossRef]
- Johnson, B.N.; Mutharasan, R. Biosensor-Based MicroRNA Detection: Techniques, Design, Performance, and Challenges. Analyst 2014, 139, 1576–1588. [Google Scholar] [CrossRef]
- Kilic, T.; Erdem, A.; Ozsoz, M.; Carrara, S. MicroRNA Biosensors: Opportunities and Challenges among Conventional and Commercially Available Techniques. Biosens. Bioelectron. 2018, 99, 525–546. [Google Scholar] [CrossRef]
- Degliangeli, F.; Pompa, P.P.; Fiammengo, R. Nanotechnology-Based Strategies for the Detection and Quantification of MicroRNA. Chem. A Eur. J. 2014, 20, 9476–9492. [Google Scholar] [CrossRef]
- Tian, T.; Wang, J.; Zhou, X. A Review: MicroRNA Detection Methods. Org. Biomol. Chem. 2015, 13, 2226–2238. [Google Scholar] [CrossRef]
- Sabela, M.; Balme, S.; Bechelany, M.; Janot, J.-M.; Bisetty, K. A Review of Gold and Silver Nanoparticle-Based Colorimetric Sensing Assays. Adv. Eng. Mater. 2017, 19, 1700270. [Google Scholar] [CrossRef]
- Doria, G.; Conde, J.; Veigas, B.; Giestas, L.; Almeida, C.; Assunção, M.; Rosa, J.; Baptista, P.V. Noble Metal Nanoparticles for Biosensing Applications. Sensors 2012, 12, 1657–1687. [Google Scholar] [CrossRef]
- Wang, W.; Kong, T.; Zhang, D.; Zhang, J.; Cheng, G. Label-Free MicroRNA Detection Based on Fluorescence Quenching of Gold Nanoparticles with a Competitive Hybridization. Anal. Chem. 2015, 87, 10822–10829. [Google Scholar] [CrossRef]
- Miao, J.; Wang, J.; Guo, J.; Gao, H.; Han, K.; Jiang, C.; Miao, P. A Plasmonic Colorimetric Strategy for Visual MiRNA Detection Based on Hybridization Chain Reaction. Sci. Rep. 2016, 6, 32219. [Google Scholar] [CrossRef]
- Kwon, L.; Long, K.D.; Wan, Y.; Yu, H.; Cunningham, B.T. Medical Diagnostics with Mobile Devices: Comparison of Intrinsic and Extrinsic Sensing. Biotechnol. Adv. 2016, 34, 291–304. [Google Scholar] [CrossRef] [Green Version]
- Roda, A.; Michelini, E.; Zangheri, M.; Fusco, M.D.; Calabria, D.; Simoni, P. Smartphone-Based Biosensors: A Critical Review and Perspectives. TrAC Trends Anal. Chem. 2016, C, 317–325. [Google Scholar] [CrossRef]
- Zhang, D.; Liu, Q. Biosensors and Bioelectronics on Smartphone for Portable Biochemical Detection. Biosens. Bioelectron. 2016, 75, 273–284. [Google Scholar] [CrossRef]
- Kanchi, S.; Sabela, M.I.; Mdluli, P.S.; Inamuddin; Bisetty, K. Smartphone Based Bioanalytical and Diagnosis Applications: A Review. Biosens. Bioelectron. 2018, 102, 136–149. [Google Scholar] [CrossRef]
- Nie, H.; Wang, W.; Li, W.; Nie, Z.; Yao, S. A Colorimetric and Smartphone Readable Method for Uracil-DNA Glycosylase Detection Based on the Target-Triggered Formation of G-Quadruplex. Analyst 2015, 140, 2771–2777. [Google Scholar] [CrossRef]
- Chen, Y.; Fu, Q.; Li, D.; Xie, J.; Ke, D.; Song, Q.; Tang, Y.; Wang, H. A Smartphone Colorimetric Reader Integrated with an Ambient Light Sensor and a 3D Printed Attachment for On-Site Detection of Zearalenone. Anal. Bioanal. Chem. 2017, 409, 6567–6574. [Google Scholar] [CrossRef]
- Lopez-Ruiz, N.; Curto, V.F.; Erenas, M.M.; Benito-Lopez, F.; Diamond, D.; Palma, A.J.; Capitan-Vallvey, L.F. Smartphone-Based Simultaneous PH and Nitrite Colorimetric Determination for Paper Microfluidic Devices. Anal. Chem. 2014, 86, 9554–9562. [Google Scholar] [CrossRef]
- Oncescu, V.; O’Dell, D.; Erickson, D. Smartphone Based Health Accessory for Colorimetric Detection of Biomarkers in Sweat and Saliva. Lab Chip 2013, 13, 3232–3238. [Google Scholar] [CrossRef]
- Kim, S.C.; Jalal, U.M.; Im, S.B.; Ko, S.; Shim, J.S. A Smartphone-Based Optical Platform for Colorimetric Analysis of Microfluidic Device. Sens. Actuators B Chem. 2017, 239, 52–59. [Google Scholar] [CrossRef]
- Chan, H.N.; Shu, Y.; Xiong, B.; Chen, Y.; Chen, Y.; Tian, Q.; Michael, S.A.; Shen, B.; Wu, H. Simple, Cost-Effective 3D Printed Microfluidic Components for Disposable, Point-of-Care Colorimetric Analysis. ACS Sens. 2016, 1, 227–234. [Google Scholar] [CrossRef]
- Lee, S.; Oncescu, V.; Mancuso, M.; Mehta, S.; Erickson, D. A Smartphone Platform for the Quantification of Vitamin D Levels. Lab Chip 2014, 14, 1437–1442. [Google Scholar] [CrossRef]
- Oncescu, V.; Mancuso, M.; Erickson, D. Cholesterol Testing on a Smartphone. Lab Chip 2014, 14, 759–763. [Google Scholar] [CrossRef]
- Choi, S.; Kim, S.; Yang, J.-S.; Lee, J.-H.; Joo, C.; Jung, H.-I. Real-Time Measurement of Human Salivary Cortisol for the Assessment of Psychological Stress Using a Smartphone. Sens. Bio-Sens. Res. 2014, 2, 8–11. [Google Scholar] [CrossRef] [Green Version]
- Jung, Y.; Kim, J.; Awofeso, O.; Kim, H.; Regnier, F.; Bae, E. Smartphone-Based Colorimetric Analysis for Detection of Saliva Alcohol Concentration. Appl. Opt. 2015, 54, 9183–9189. [Google Scholar] [CrossRef]
- Wang, F.; Lu, Y.; Yang, J.; Chen, Y.; Jing, W.; He, L.; Liu, Y. A Smartphone Readable Colorimetric Sensing Platform for Rapid Multiple Protein Detection. Analyst 2017, 142, 3177–3182. [Google Scholar] [CrossRef]
- Priye, A.; Wong, S.; Bi, Y.; Carpio, M.; Chang, J.; Coen, M.; Cope, D.; Harris, J.; Johnson, J.; Keller, A.; et al. Lab-on-a-Drone: Toward Pinpoint Deployment of Smartphone-Enabled Nucleic Acid-Based Diagnostics for Mobile Health Care. Anal. Chem. 2016, 88, 4651–4660. [Google Scholar] [CrossRef]
- Mancuso, M.; Cesarman, E.; Erickson, D. Detection of Kaposi’s Sarcoma Associated Herpesvirus Nucleic Acids Using a Smartphone Accessory. Lab Chip 2014, 14, 3809–3816. [Google Scholar] [CrossRef] [Green Version]
- Wang, H.-N.; Vo-Dinh, T. Plasmonic Coupling Interference (PCI) Nanoprobes for Nucleic Acid Detection. Small 2011, 7, 3067–3074. [Google Scholar] [CrossRef]
- Wang, H.-N.; Crawford, B.M.; Norton, S.J.; Vo-Dinh, T. Direct and Label-Free Detection of MicroRNA Cancer Biomarkers Using SERS-Based Plasmonic Coupling Interference (PCI) Nanoprobes. J. Phys. Chem. B 2019, 123, 10245–10251. [Google Scholar] [CrossRef]
- Jain, P.K.; El-Sayed, M.A. Plasmonic Coupling in Noble Metal Nanostructures. Chem. Phys. Lett. 2010, 487, 153–164. [Google Scholar] [CrossRef]
- Duan, J.; Yin, H.; Wei, R.; Wang, W. Facile Colorimetric Detection of Hg2+ Based on Anti-Aggregation of Silver Nanoparticles. Biosens. Bioelectron. 2014, 57, 139–142. [Google Scholar] [CrossRef]
- Liu, Y.; Zhang, L.; Wei, W.; Zhao, H.; Zhou, Z.; Zhang, Y.; Liu, S. Colorimetric Detection of Influenza A Virus Using Antibody-Functionalized Gold Nanoparticles. Analyst 2015, 140, 3989–3995. [Google Scholar] [CrossRef]
- Krichevsky, A.M.; Gabriely, G. MiR-21: A Small Multi-Faceted RNA. J. Cell Mol. Med. 2009, 13, 39–53. [Google Scholar] [CrossRef]
- Selcuklu, S.D.; Donoghue, M.T.A.; Spillane, C. MiR-21 as a Key Regulator of Oncogenic Processes. Biochem Soc. Trans. 2009, 37, 918–925. [Google Scholar] [CrossRef] [Green Version]
- Wu, Y.E.; Parikshak, N.N.; Belgard, T.G.; Geschwind, D.H. Genome-Wide, Integrative Analysis Implicates MicroRNA Dysregulation in Autism Spectrum Disorder. Nat. Neurosci. 2016, 19, 1463–1476. [Google Scholar] [CrossRef]
- Ebner, M. Color. Constancy; John Wiley & Sons: Hoboken, NJ, USA, 2007. [Google Scholar]
- Hunt, R.W.G.; Pointer, M.R. Measuring Colour; John Wiley & Sons: Hoboken, NJ, USA, 2011. [Google Scholar]
- Vo-Dinh, T. Surface-Enhanced Raman Spectroscopy Using Metallic Nanostructures. TrAC Trends Anal. Chem. 1998, 17, 557–582. [Google Scholar] [CrossRef]
- Chen, K.; Leona, M.; Vo-Dinh, K.-C.; Yan, F.; Wabuyele, M.; Vo-Dinh, T. Application of Surface-enhanced Raman Scattering (SERS) for the Identification of Anthraquinone Dyes Used in Works of Art. J. Raman Spectrosc. 2005, 37, 520–527. [Google Scholar] [CrossRef]
- Wang, H.-N.; Crawford, B.M.; Fales, A.M.; Bowie, M.L.; Seewaldt, V.L.; Vo-Dinh, T. Multiplexed Detection of MicroRNA Biomarkers Using SERS-Based Inverse Molecular Sentinel (IMS) Nanoprobes. J. Phys. Chem. C Nanomater. Interfaces 2016, 120, 21047–21050. [Google Scholar] [CrossRef] [Green Version]
- Cupil-Garcia, V.; Strobbia, P.; Crawford, B.M.; Wang, H.-N.; Ngo, H.; Liu, Y.; Vo-Dinh, T. Plasmonic Nanoplatforms: From Surface-Enhanced Raman Scattering Sensing to Biomedical Applications. J. Raman Spectrosc. 2021, 52, 541–553. [Google Scholar] [CrossRef]
- Johnson, R.A.; Miller, I.; Freund, J.E. Miller & Freund’s Probability and Statistics for Engineers, 9th ed.; Pearson: Boston, MA, USA, 2016. [Google Scholar]
- Yetisen, A.K.; Martinez-Hurtado, J.L.; Garcia-Melendrez, A.; da Vasconcellos, F.C.; Lowe, C.R. A Smartphone Algorithm with Inter-Phone Repeatability for the Analysis of Colorimetric Tests. Sens. Actuators B Chem. 2014, 196, 156–160. [Google Scholar] [CrossRef]
- Hong, J.I.; Chang, B.-Y. Development of the Smartphone-Based Colorimetry for Multi-Analyte Sensing Arrays. Lab Chip 2014, 14, 1725–1732. [Google Scholar] [CrossRef]
- Vashist, S.K.; van Oordt, T.; Schneider, E.M.; Zengerle, R.; von Stetten, F.; Luong, J.H.T. A Smartphone-Based Colorimetric Reader for Bioanalytical Applications Using the Screen-Based Bottom Illumination Provided by Gadgets. Biosens. Bioelectron. 2015, 67, 248–255. [Google Scholar] [CrossRef]
- Dutta, S.; Saikia, G.P.; Sarma, D.J.; Gupta, K.; Das, P.; Nath, P. Protein, Enzyme and Carbohydrate Quantification Using Smartphone through Colorimetric Digitization Technique. J. Biophotonics 2017, 10, 623–633. [Google Scholar] [CrossRef]
- Su, K.; Zou, Q.; Hu, N.; Wang, P. High-Sensitive and High-Efficient Biochemical Analysis Method Using a Bionic Electronic Eye in Combination with a Smartphone-Based Colorimetric Reader System. Annu. Int. Conf. IEEE Eng. Med. Biol. Soc. 2015, 2015, 7720–7723. [Google Scholar] [CrossRef]
- Chen, C.; Ridzon, D.A.; Broomer, A.J.; Zhou, Z.; Lee, D.H.; Nguyen, J.T.; Barbisin, M.; Xu, N.L.; Mahuvakar, V.R.; Andersen, M.R.; et al. Real-Time Quantification of MicroRNAs by Stem–Loop RT–PCR. Nucleic Acids Res. 2005, 33, e179. [Google Scholar] [CrossRef]
- miRCURY LNA miRNA Custom PCR Panels. Available online: https://www.qiagen.com/us/products/discovery-and-translational-research/pcr-qpcr-dpcr/qpcr-assays-and-instruments/mirna-qpcr-assay-and-panels/mircury-lna-mirna-custom-pcr-panels/ (accessed on 21 November 2021).
- Wang, J.-W.; Czech, B.; Weigel, D. MiR156-Regulated SPL Transcription Factors Define an Endogenous Flowering Pathway in Arabidopsis Thaliana. Cell 2009, 138, 738–749. [Google Scholar] [CrossRef] [Green Version]
- Crawford, B.M.; Strobbia, P.; Wang, H.-N.; Zentella, R.; Boyanov, M.I.; Pei, Z.-M.; Sun, T.-P.; Kemner, K.M.; Vo-Dinh, T. Plasmonic Nanoprobes for in Vivo Multimodal Sensing and Bioimaging of MicroRNA within Plants. ACS Appl. Mater. Interfaces 2019, 11, 7743–7754. [Google Scholar] [CrossRef]


Publisher’s Note: MDPI stays neutral with regard to jurisdictional claims in published maps and institutional affiliations. |
© 2021 by the authors. Licensee MDPI, Basel, Switzerland. This article is an open access article distributed under the terms and conditions of the Creative Commons Attribution (CC BY) license (https://creativecommons.org/licenses/by/4.0/).
Share and Cite
Krishnan, T.; Wang, H.-N.; Vo-Dinh, T. Smartphone-Based Device for Colorimetric Detection of MicroRNA Biomarkers Using Nanoparticle-Based Assay. Sensors 2021, 21, 8044. https://doi.org/10.3390/s21238044
Krishnan T, Wang H-N, Vo-Dinh T. Smartphone-Based Device for Colorimetric Detection of MicroRNA Biomarkers Using Nanoparticle-Based Assay. Sensors. 2021; 21(23):8044. https://doi.org/10.3390/s21238044
Chicago/Turabian StyleKrishnan, Tushar, Hsin-Neng Wang, and Tuan Vo-Dinh. 2021. "Smartphone-Based Device for Colorimetric Detection of MicroRNA Biomarkers Using Nanoparticle-Based Assay" Sensors 21, no. 23: 8044. https://doi.org/10.3390/s21238044
APA StyleKrishnan, T., Wang, H.-N., & Vo-Dinh, T. (2021). Smartphone-Based Device for Colorimetric Detection of MicroRNA Biomarkers Using Nanoparticle-Based Assay. Sensors, 21(23), 8044. https://doi.org/10.3390/s21238044