
Stock Price Movement Prediction Using Sentiment Analysis and CandleStick Chart Representation


Abstract
:1. Introduction
- We employed a one-dimensional (1D) CNN (1D-CNN) that performed more favorably than traditional machine learning and long short-term memory models for stock trend prediction based on social-media data.
- We proposed a novel collaborative deep learning network for stock-price-movement prediction. The main features were incorporated internal (candlestick chart) and external (social media sentiment) stock features that helped to improve the accuracy of the prediction of stock price movement.
- We formulated a new accuracy-level metric for comparing the accuracy ranges between classification models for stock trend prediction.
- We observed that price movement prediction for a “high-demand stock” achieved more favorable performance in the long term.
2. Related Works
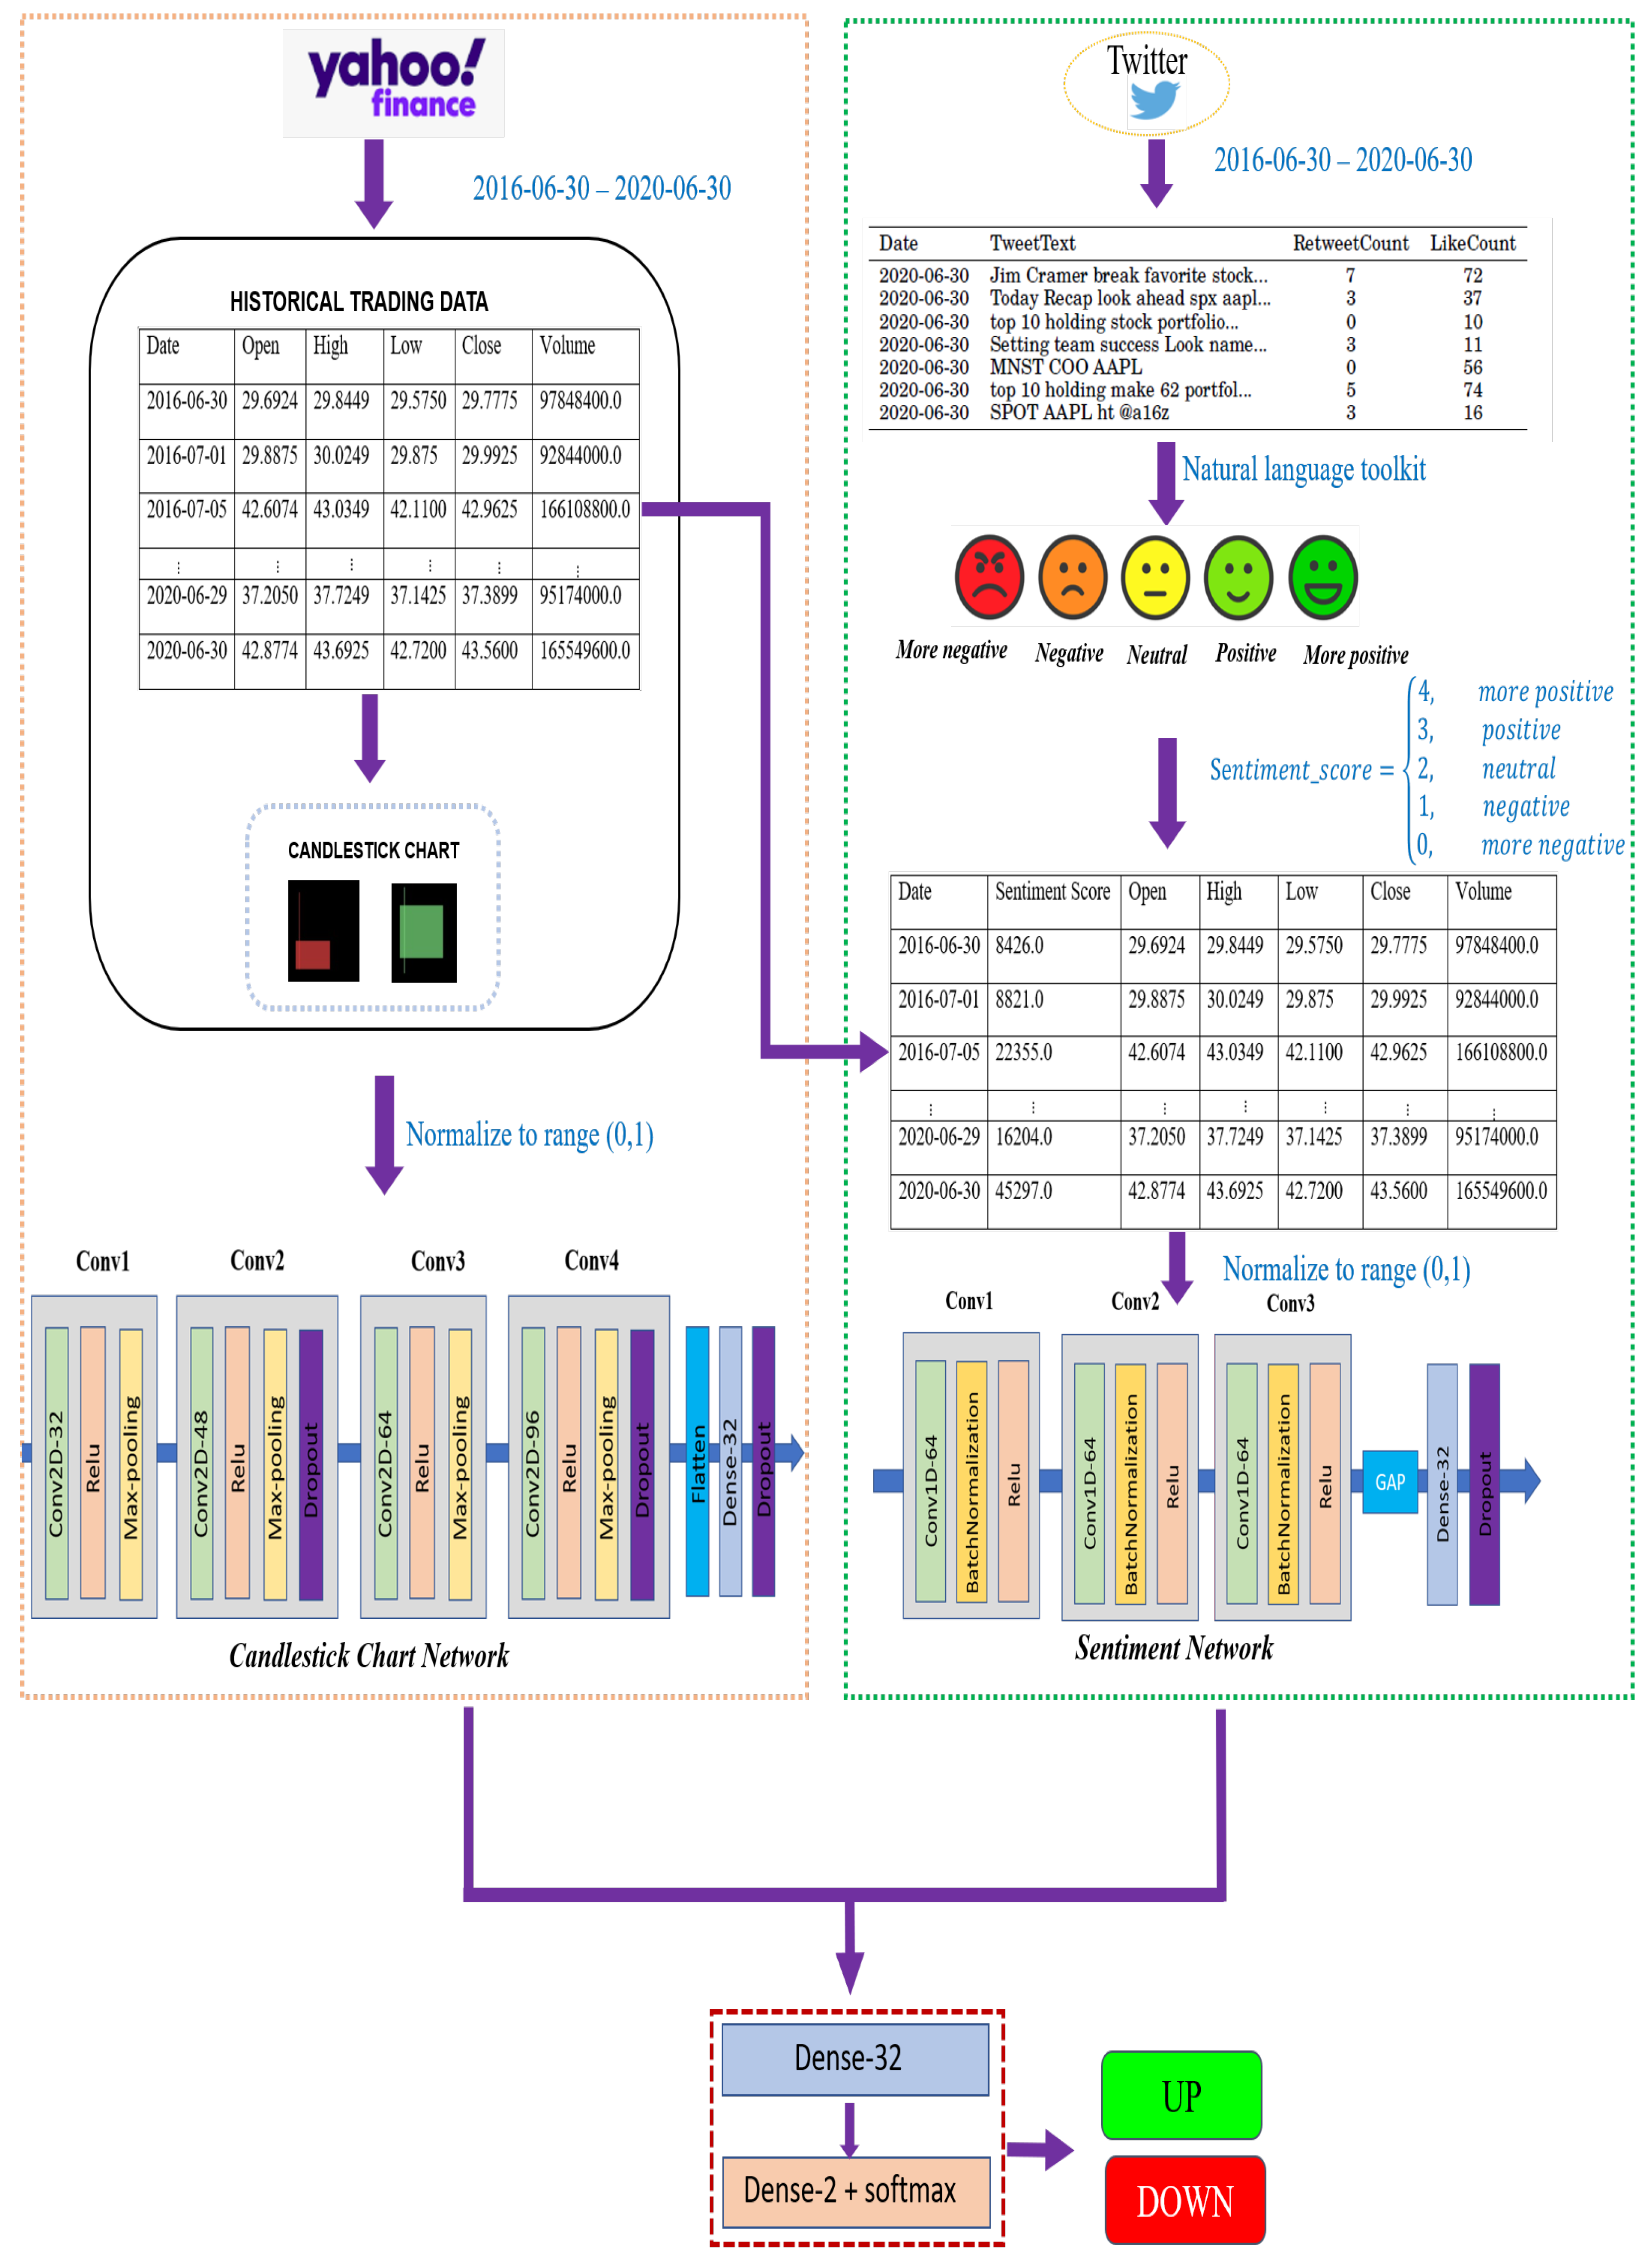
3. Approach
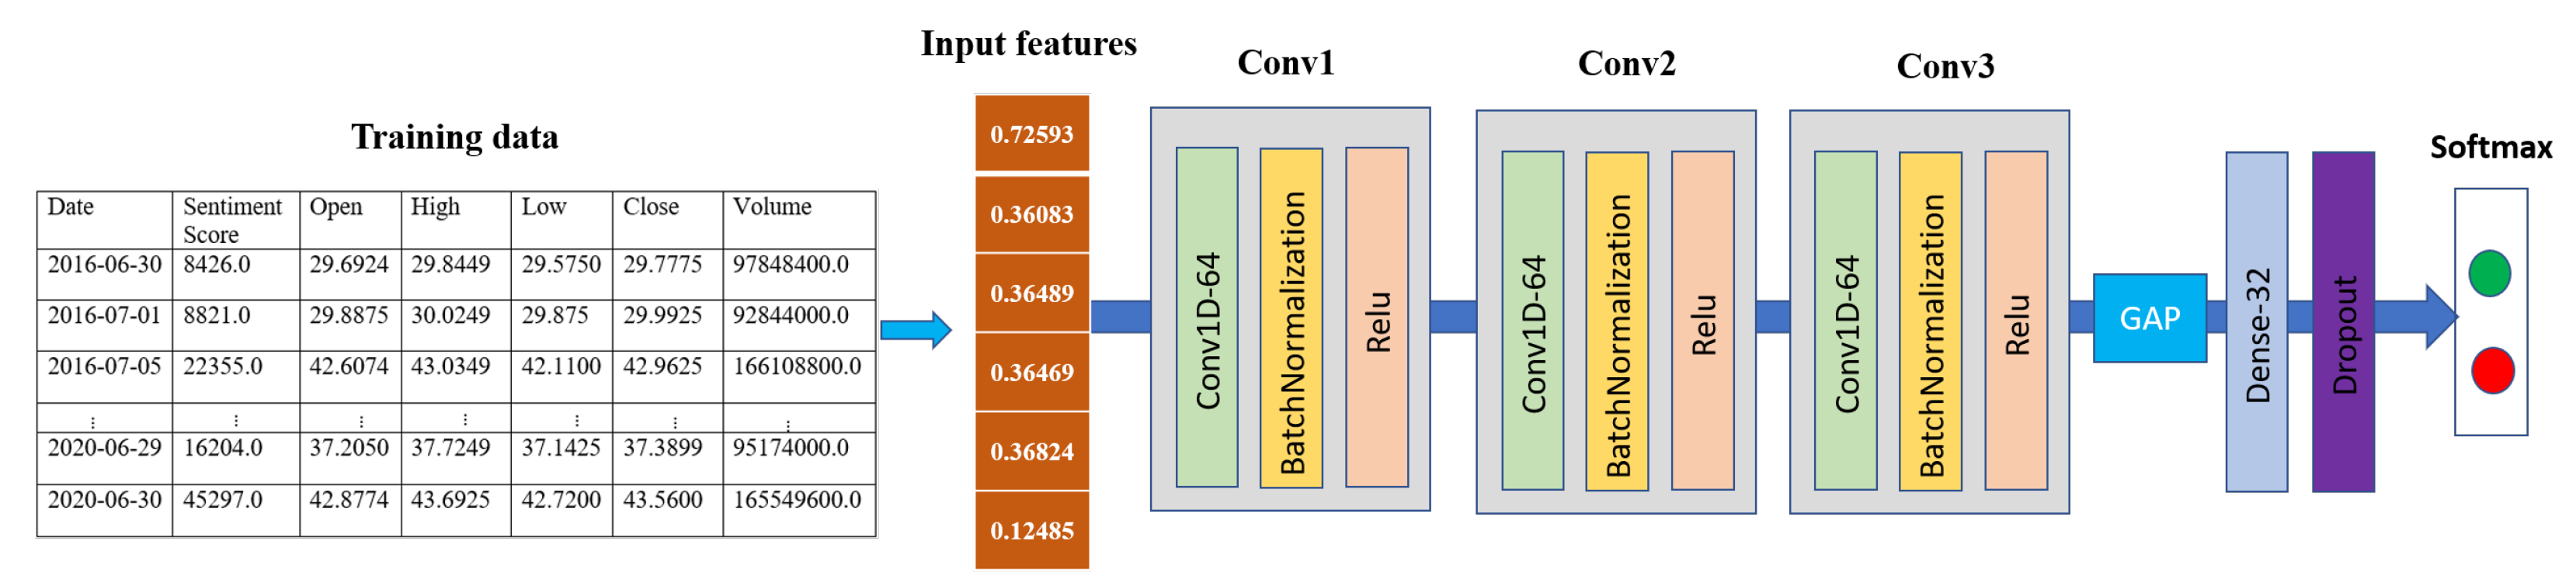
3.1. Sentiment Analysis for Stock Trend Prediction
3.1.1. Sentiment Analysis Using Social Media Data
3.1.2. Sentiment Networks
Random Forest (RF)
Linear Support Vector Classification (LinearSVC)
Gaussian Naive Bayes (GaussianNB)
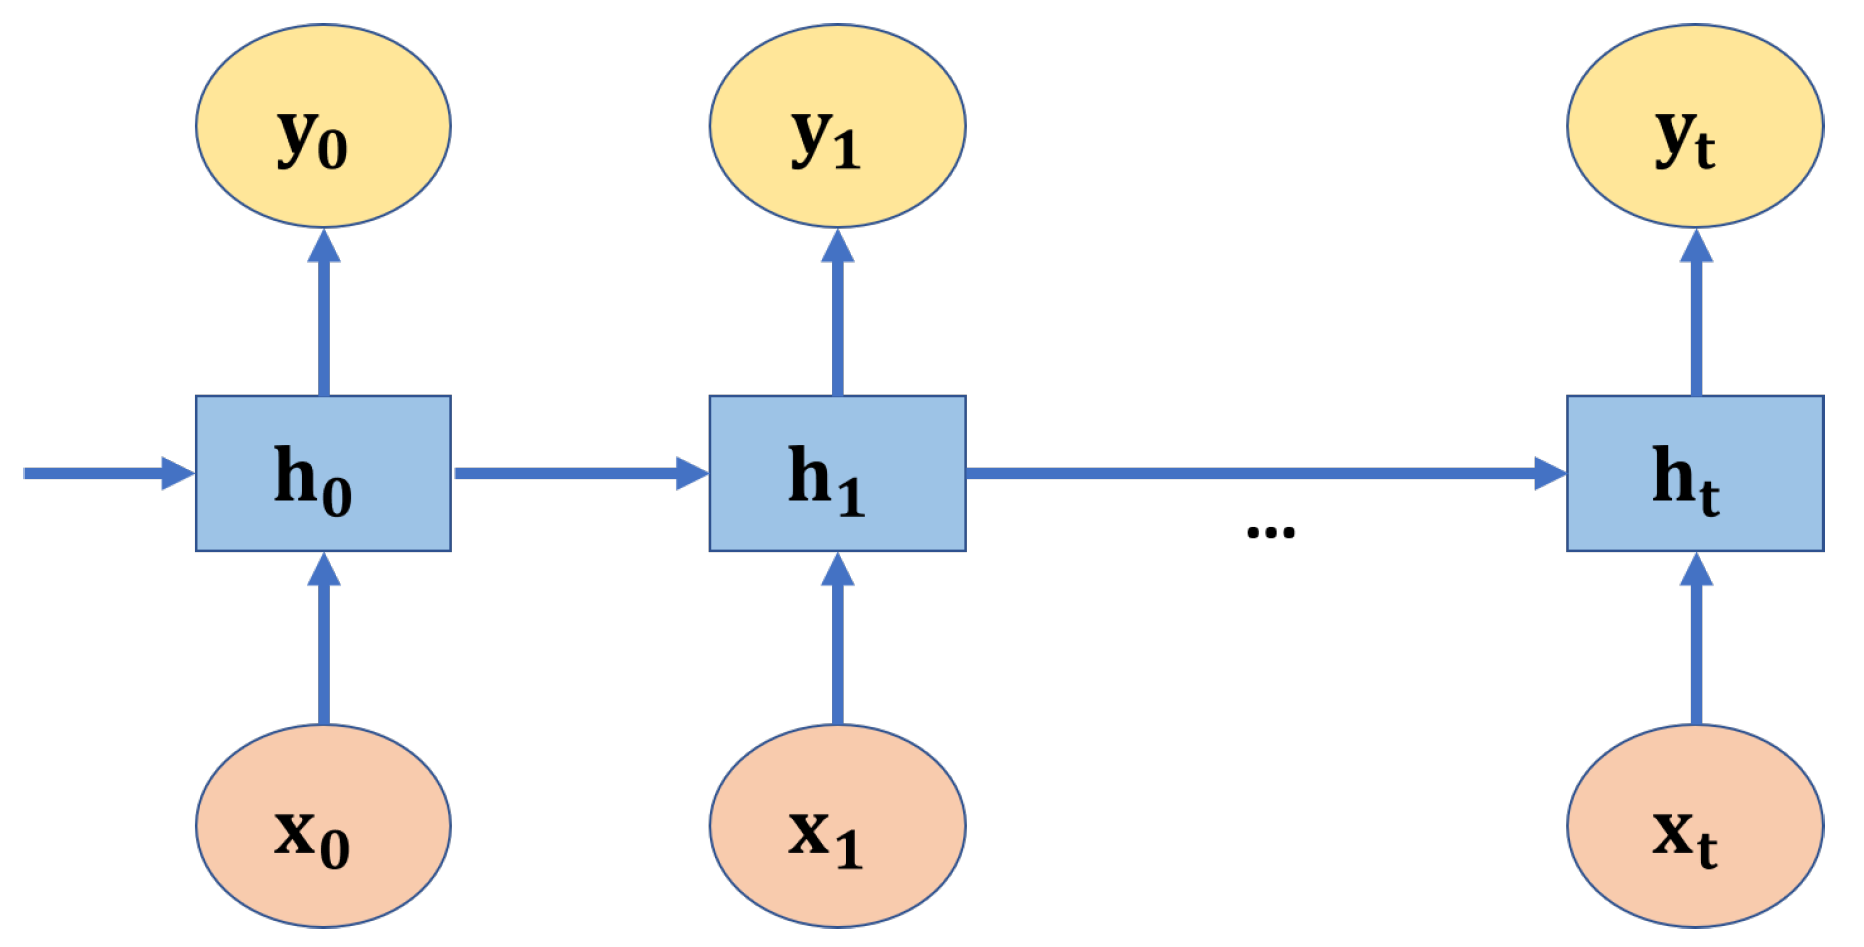
Long Short-Term Memory (LSTM)
1D-CNN
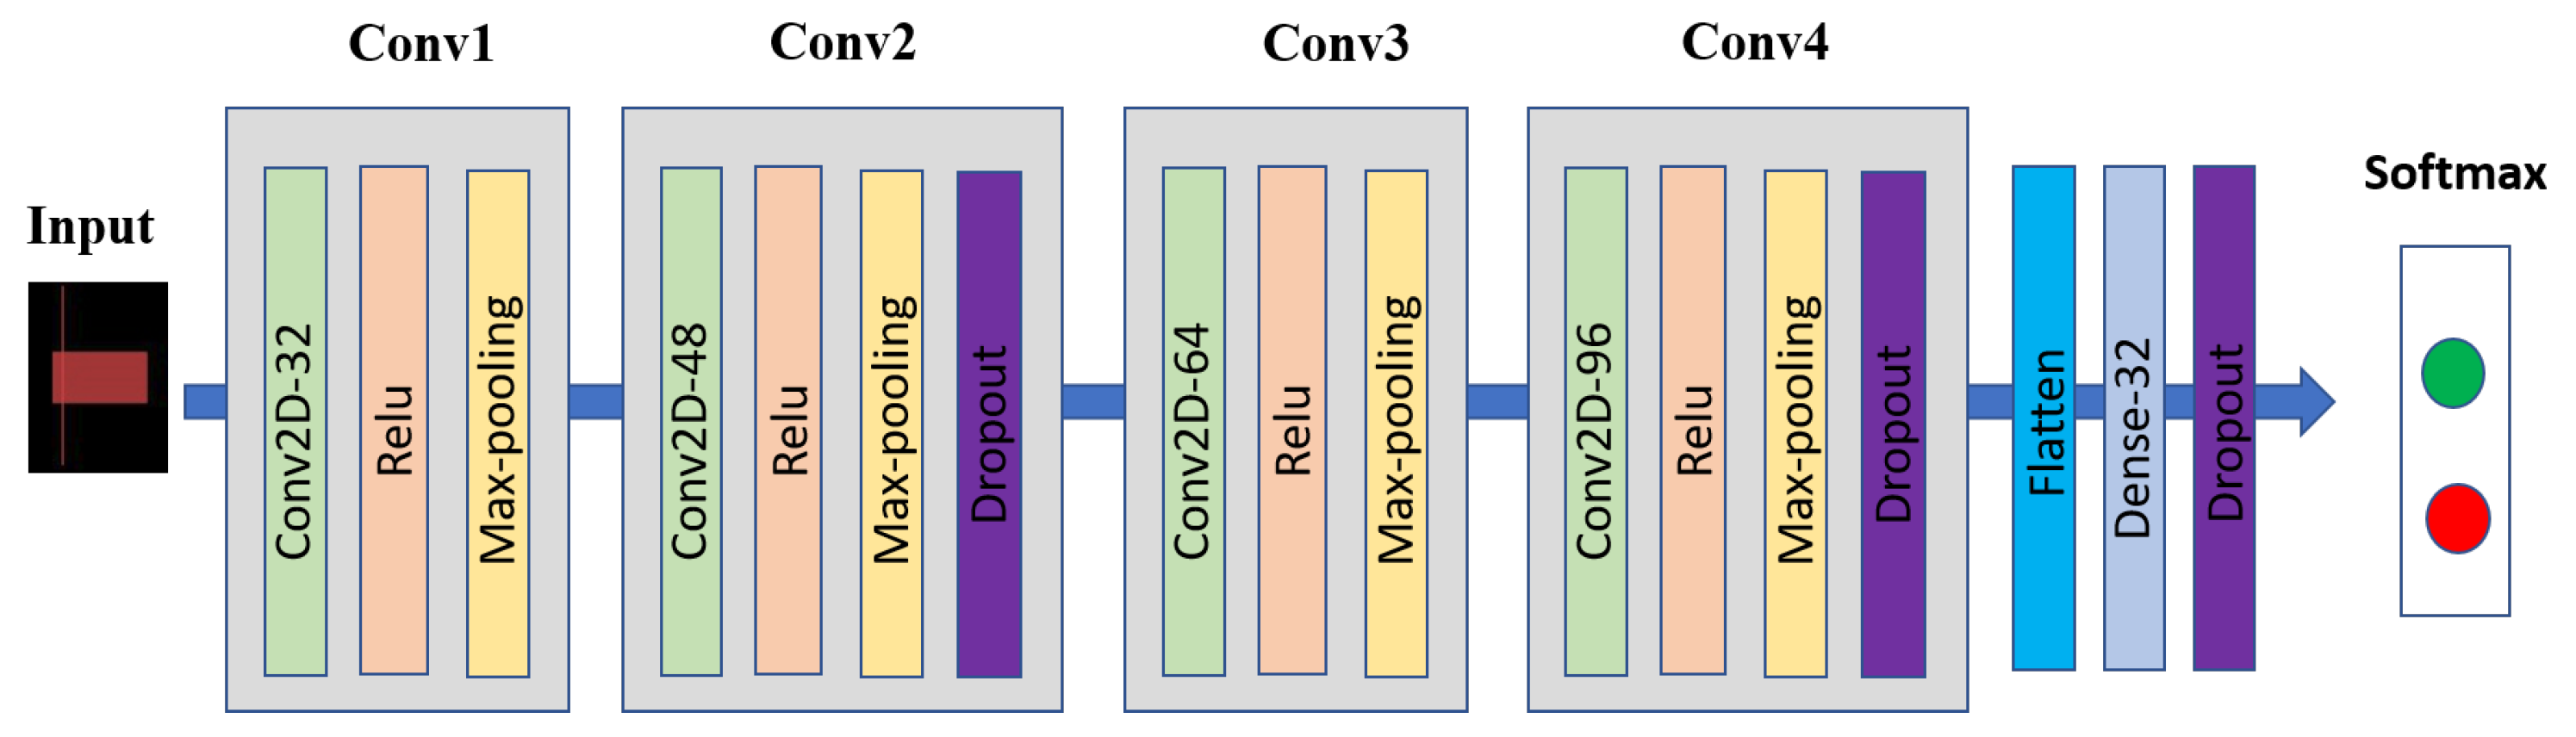
3.2. CandleStickChart for Stock Trend Prediction
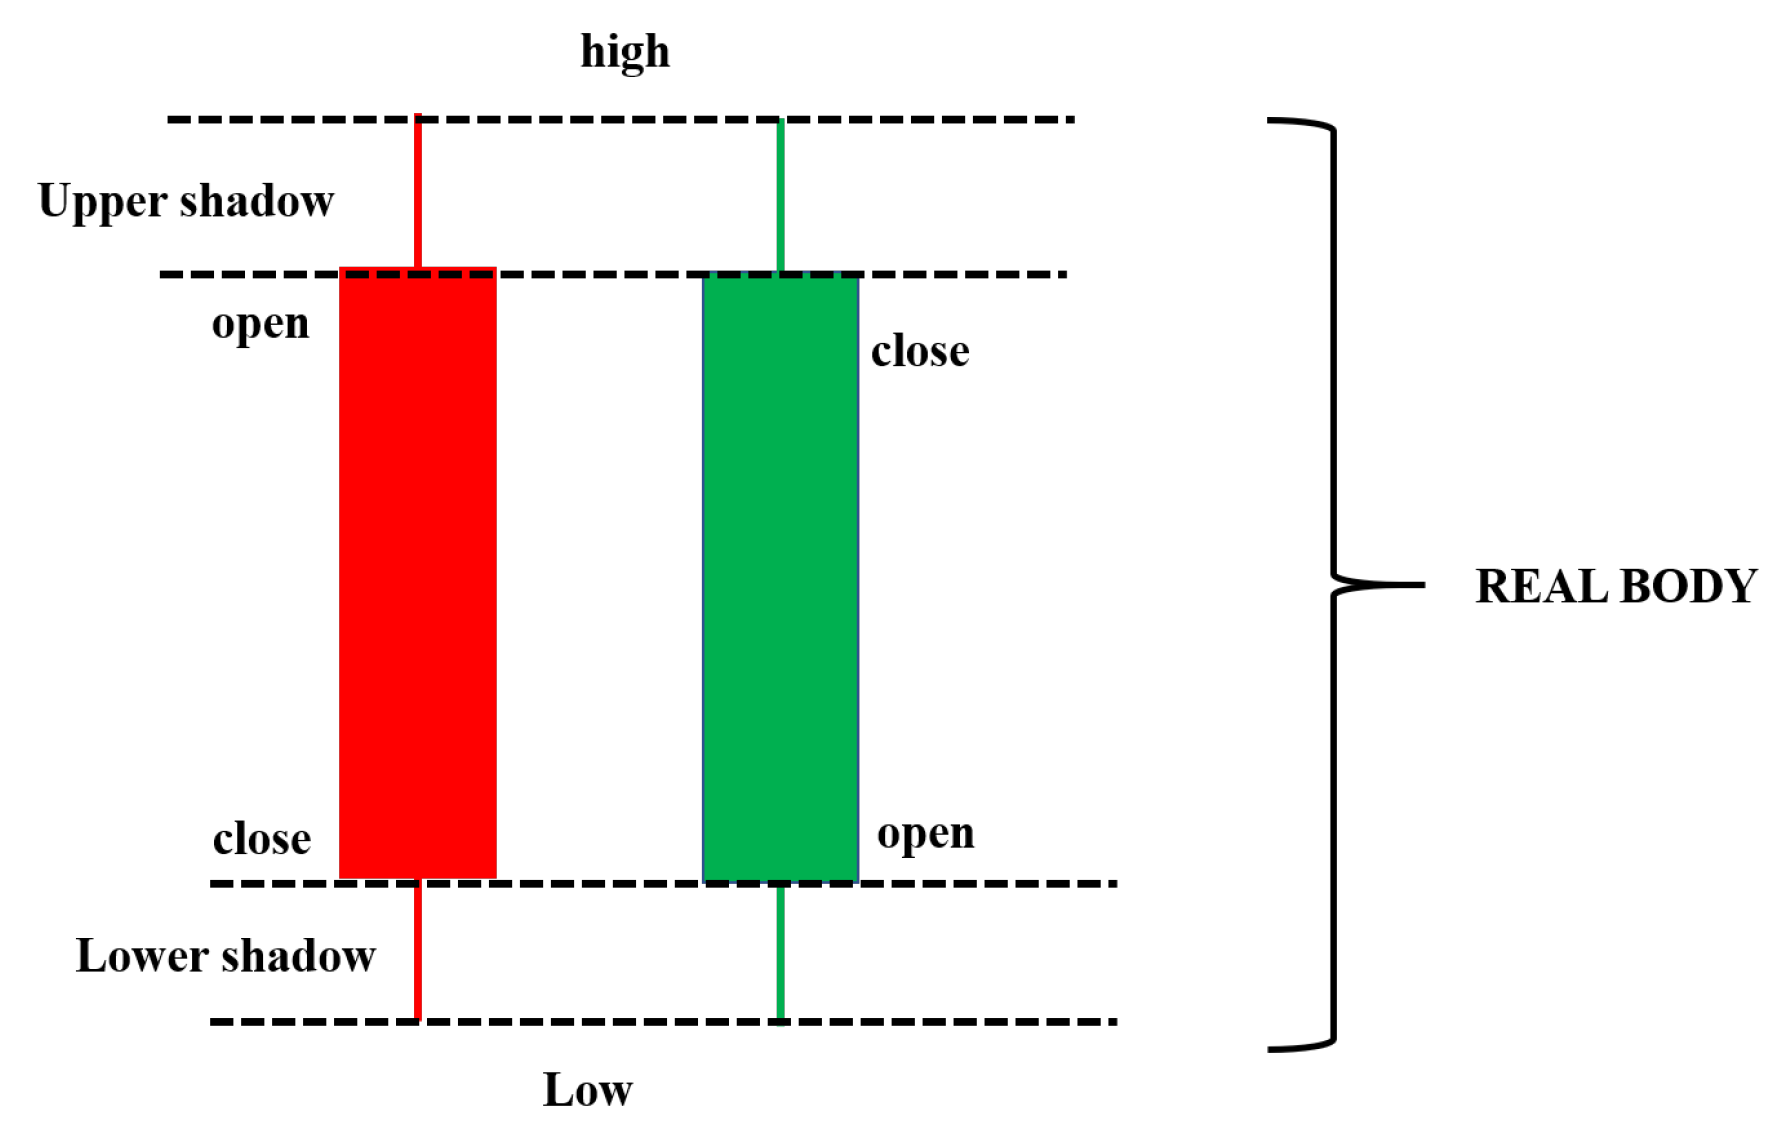
3.2.1. Candlestick Chart
3.2.2. Candlestick Chart Network
3.3. Joint Sentiment and Candlestick Chart Model
3.4. Performance Measures
4. Experiment
4.1. Data Collection and Processing
4.1.1. Historical Data from Yahoo Finance
4.1.2. Sentiment Data from Social Media (Twitter)
- Removing the unimportant/spam tweets that contained ReTweetCount and LikeCount values <5 and <10, respectively.
- Tweets were split and converted into word tokens.
- Removing the non-Ascii char, hyperlinks, punctuations, tokenize, stopwords(for example, the, are, is, an, etc.) inside the tweets because these components carry no useful information for sentiment analysis.
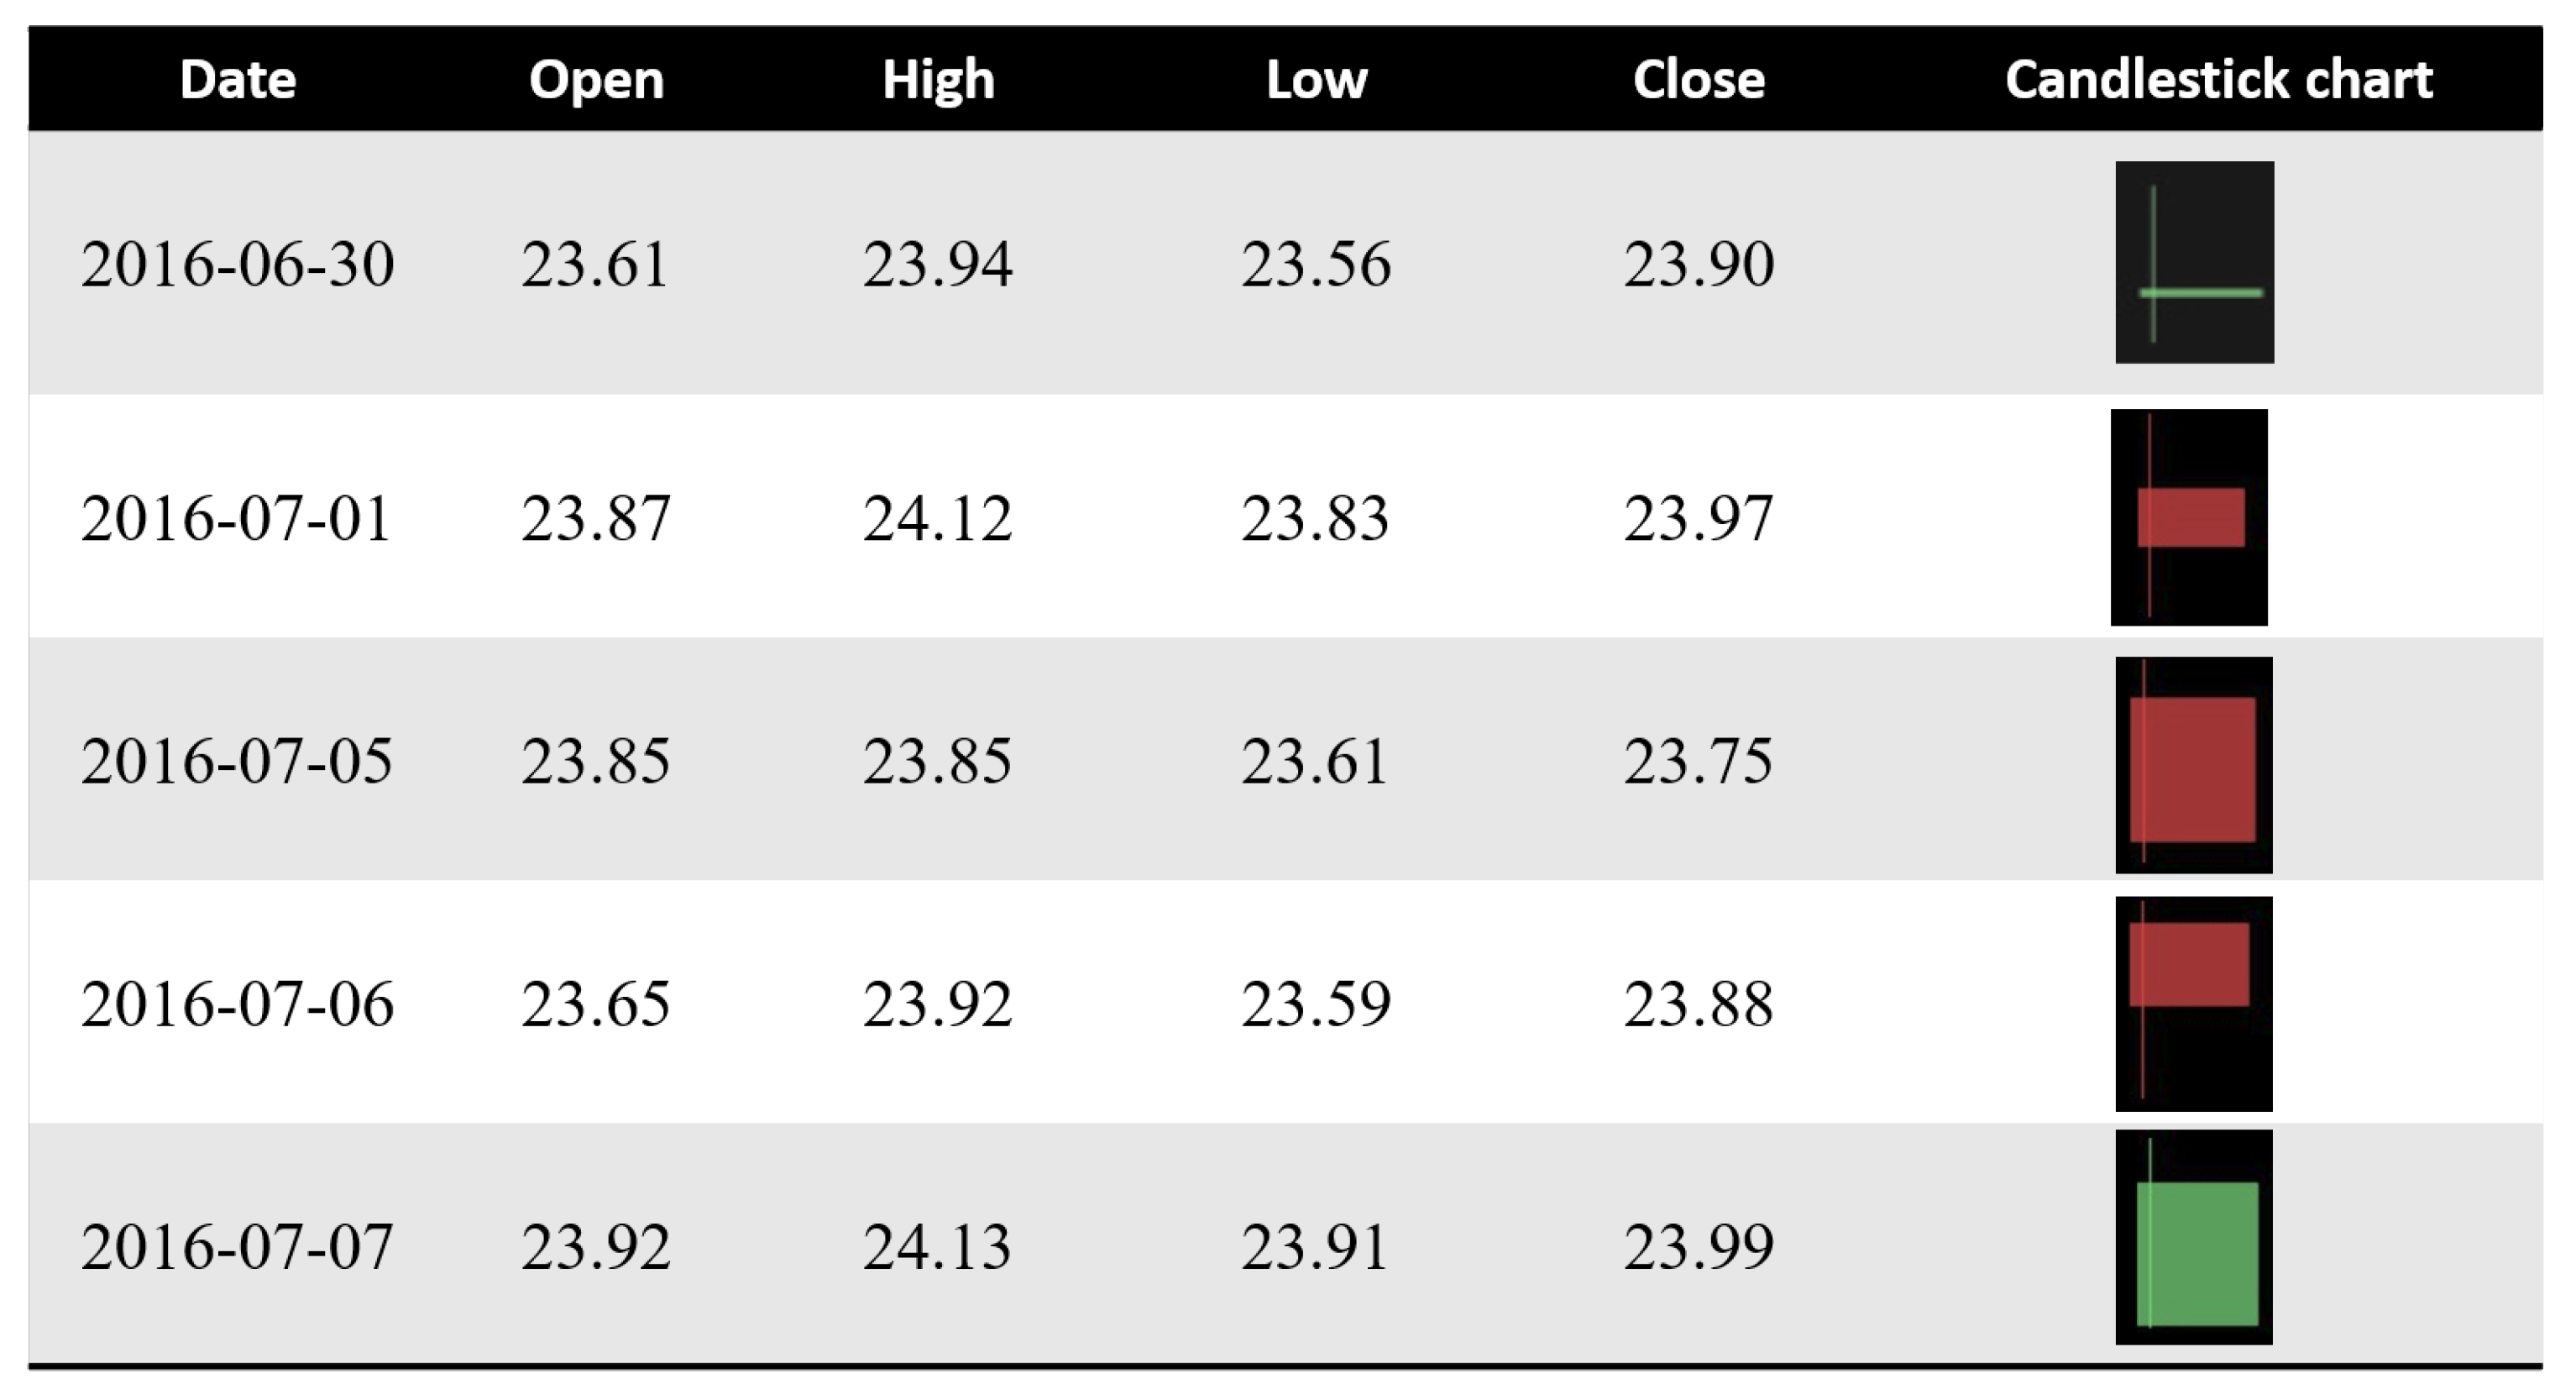
4.1.3. From Historical Data to Candlestick Chart
4.2. Experimental Setting
4.3. Improvement in Stock Trend Prediction Based on Sentiment Analysis and 1D-CNN
4.4. Improvement inStock Trend Prediction Based on the Joint Network
4.4.1. Ablation Study
- Sentiment: the sentiment analysis network based on social-media data and the 1D-convolutional neural network described in Section 3.1.2.
- Candlestick chart: 2D-convolutional neural network based on candlestick-chart data described in Section 3.2.2.
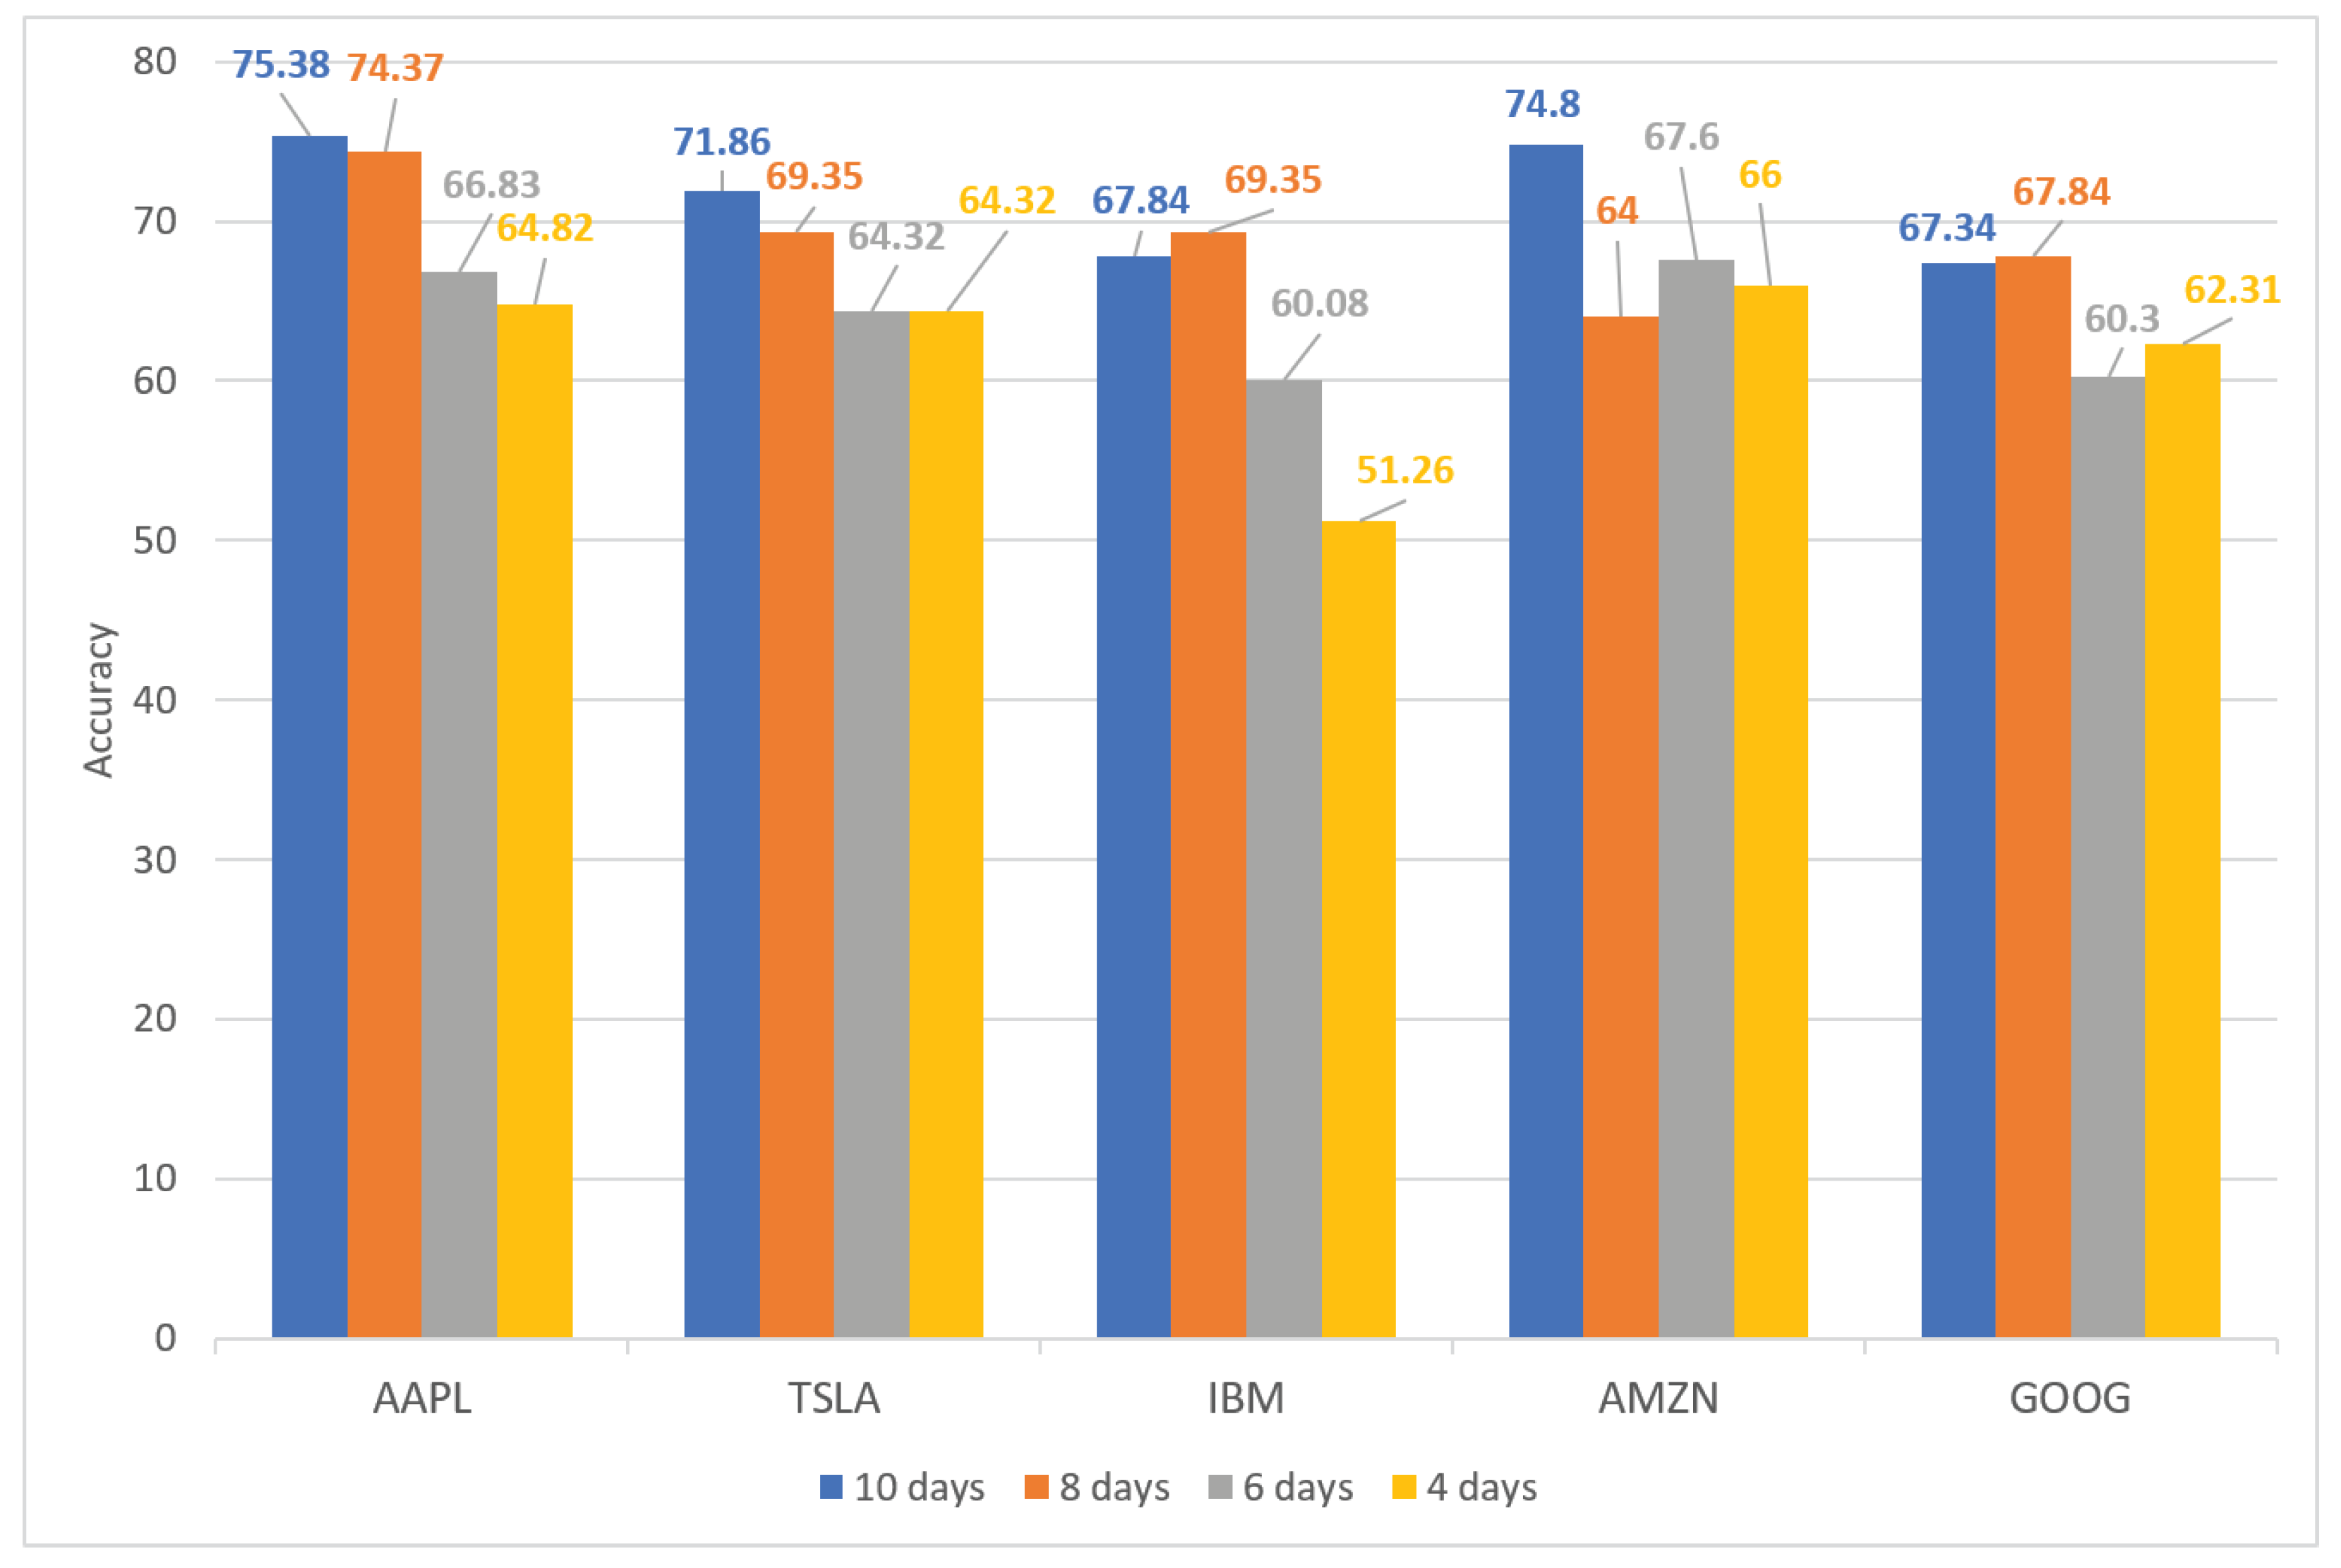
4.4.2. Stock Trend Prediction on Different Time Periods
5. Conclusions
Author Contributions
Funding
Conflicts of Interest
References
- Malkiel, B.G.; Fama, E.F. Efficient capital markets a review of theory and empirical work. J. Financ. 1970, 25, 383–417. [Google Scholar] [CrossRef]
- Hua, K.-L.; Ho, T.-T.; Jangtjik, K.-A.; Chen, Y.-J.; Yeh, M.-C. Artist-based painting classification using Markov random fields with convolution neural network. Multimed. Tools Appl. 2020, 79, 12635–12658. [Google Scholar] [CrossRef]
- Jangtjik, K.A.; Ho, T.-T.; Yeh, M.-C.; Hua, K.-L. A CNN-LSTM framework for authorship classification of paintings. In Proceedings of the 2017 IEEE International Conference on Image Processing (ICIP), Beijing, China, 17–20 September 2017; pp. 2866–2870. [Google Scholar]
- Redmon, J.; Divvala, S.; Girshick, R.; Farhadi, A. You only look once: Unified, real-time object detection. In Proceedings of the IEEE Conference on Computer Vision and Pattern Recognition, Las Vegas, NV, USA, 27–30 June 2016; pp. 779–788. [Google Scholar]
- He, K.; Gkioxari, G.; Dollár, P.; Girshick, R. Mask r-cnn. In Proceedings of the IEEE International Conference on Computer Vision, Venice, Italy, 22–29 October 2017; pp. 2961–2969. [Google Scholar]
- Ho, T.-T.; Virtusio, J.J.; Chen, Y.-Y.; Hsu, C.-M.; Hua, K.-L. Sketch-guided deep portrait generation. ACM Trans. Multimed. Comput. Commun. Appl. (TOMM) 2020, 16, 1–18. [Google Scholar] [CrossRef]
- Zhang, Z.; Xu, W.; Qin, Q.; Long, Z. Downscaling solar-induced chlorophyll fluorescence based on convolutional neural network method to monitor agricultural drought. IEEE Trans. Geosci. Remote Sens. 2020, 59, 1012–1028. [Google Scholar] [CrossRef]
- Jiao, L.; Dong, S.; Zhang, S.; Xie, C.; Wang, H. AF-RCNN: An anchor-free convolutional neural network for multi-categories agricultural pest detection. Comput. Electron. Agric. 2020, 174, 105522. [Google Scholar] [CrossRef]
- Liu, L.; Wu, F.-X.; Wang, Y.-P.; Wang, J. Multi-receptive-field CNN for semantic segmentation of medical images. IEEE J. Biomed. Health Inform. 2020, 24, 3215–3225. [Google Scholar] [CrossRef] [PubMed]
- Tseng, K.-K.; Zhang, R.; Chen, C.-M.; Hassan, M.M. DNetUnet: A semi-supervised CNN of medical image segmentation for super-computing AI service. J. Supercomput. 2021, 77, 3594–3615. [Google Scholar] [CrossRef]
- Lu, W.; Li, J.; Wang, J.; Qin, L. A CNN-BiLSTM-AM method for stock price prediction. Neural Comput. Appl. 2021, 33, 4741–4753. [Google Scholar]
- Mehtab, S.; Sen, J.; Dasgupta, S. Analysis and forecasting of financial time series using CNN and LSTM-based deep learning models. In Proceedings of the 2nd International Conference on Advances in Distributed Computing and Machine Learning (ICADCML’21), Bhubaneswar, India, 15–16 January 2021; Volume 33, pp. 15–16. [Google Scholar]
- Perdiz, J.; Garrote, L.; Pires, G.; Nunes, U.J. A Reinforcement Learning Assisted Eye-Driven Computer Game Employing a Decision Tree-Based Approach and CNN Classification. IEEE Access 2021, 9, 46011–46021. [Google Scholar] [CrossRef]
- Lee, J.; Lee, S. Robust CNN Compression Framework for Security-Sensitive Embedded Systems. Appl. Sci. 2021, 11, 1093. [Google Scholar] [CrossRef]
- Ji, Y.; Zhang, H.; Zhang, Z.; Liu, M. CNN-based encoder-decoder networks for salient object detection: A comprehensive review and recent advances. Inf. Sci. 2021, 546, 835–857. [Google Scholar] [CrossRef]
- Hegazy, O.; Soliman, O.S.; Salam, M.A. A machine learning model for stock market prediction. arXiv 2014, arXiv:1402.7351. [Google Scholar]
- Shen, S.; Jiang, H.; Zhang, T. Stock Market Forecasting Using Machine Learning Algorithms; Department of Electrical Engineering, Stanford University: Stanford, CA, USA, 2012; pp. 1–5. [Google Scholar]
- Chen, L.; Qiao, Z.; Wang, M.; Wang, C.; Du, R.; Stanley, H.E. Which artificial intelligence algorithm better predicts the Chinese stock market? IEEE Access 2018, 6, 48625–48633. [Google Scholar] [CrossRef]
- Yetis, Y.; Kaplan, H.; Jamshidi, M. Stock market prediction by using artificial neural network. In Proceedings of the 2014 World Automation Congress (WAC), Waikoloa, HI, USA, 3–7 August 2014; pp. 718–722. [Google Scholar]
- Chen, L.; Qiao, Z.; Wang, M.; Wang, C.; Du, R.; Stanley, H.E. Prediction of stock market index movement by ten data mining techniques? Mod. Appl. Sci. 2009, 3, 28–42. [Google Scholar]
- Kusuma, R.M.I.; Ho, T.-T.; Kao, W.-C.; Ou, Y.-Y.; Hua, K.-L. Using deep learning neural networks and candlestick chart representation to predict stock market. arXiv 2019, arXiv:1903.12258. [Google Scholar]
- Tsai, C.-F.; Quan, Z.-Y. Stock prediction by searching for similarities in candlestick charts. ACM Trans. Manag. Inf. Syst. (TMIS) 2014, 5, 1–21. [Google Scholar] [CrossRef]
- Hu, G.; Hu, Y.; Yang, K.; Yu, Z.; Sung, F.; Zhang, Z.; Xie, F.; Liu, J.; Robertson, N.; Hospedales, T.; et al. Deep stock representation learning: From candlestick charts to investment decisions. In Proceedings of the 2018 IEEE International Conference on Acoustics, Speech and Signal Processing (ICASSP), Calgary, AB, Canada, 15–20 April 2018; pp. 2706–2710. [Google Scholar]
- Hung, C.-C.; Chen, Y.-J. DPP: Deep predictor for price movement from candlestick charts. PLoS ONE 2021, 16, e0252404. [Google Scholar] [CrossRef] [PubMed]
- Birogul, S.; Temür, G.; Kose, U. YOLO object recognition algorithm and “buy-sell decision” model over 2D candlestick chart. IEEE Access 2020, 8, 91894–91915. [Google Scholar] [CrossRef]
- do Prado, H.A.; Ferneda, E.; Morais, L.C.R.; Luiz, A.J.B.; Matsura, E. On the effectiveness of candlestick chart analysis for the Brazilian stock market. Neurocomputing 2013, 22, 1136–1145. [Google Scholar] [CrossRef] [Green Version]
- Urolagin, S. Text mining of tweet for sentiment classification and association with stock prices. In Proceedings of the 2017 International Conference on Computer and Applications (ICCA), Doha, United Arab Emirates, 6–7 September 2017; pp. 384–388. [Google Scholar]
- Chakraborty, P.; Pria, U.S.; Rony, M.R.A.H.; Majumdar, M.A. Predicting stock movement using sentiment analysis of Twitter feed. In Proceedings of the 2017 6th International Conference on Informatics, Electronics and Vision & 2017 7th International Symposium in Computational Medical and Health Technology (ICIEV-ISCMHT), Himeji, Japan, 1–3 September 2017; pp. 1–6. [Google Scholar]
- Mehta, P.; Pandya, S.; Kotecha, K. Harvesting social media sentiment analysis to enhance stock market prediction using deep learning. PeerJ Comput. Sci. 2021, 7, e476. [Google Scholar] [CrossRef] [PubMed]
- Khatri, S.K.; Srivastava, A. Using sentimental analysis in prediction of stock market investment. In Proceedings of the 2016 5th International Conference on Reliability, Infocom Technologies and Optimization (Trends and Future Directions) (ICRITO), Noida, India, 7–9 September 2016; pp. 566–569. [Google Scholar]
- Yan, D.; Zhou, G.; Zhao, X.; Tian, Y.; Yang, F. Predicting stock using microblog moods. China Commun. 2016, 13, 244–257. [Google Scholar] [CrossRef]
- Zhou, Z.; Zhao, J.; Xu, K. Can online emotions predict the stock market in China? In Proceedings of the International Conference on Web Information Systems Engineering, Shanghai, China, 8–10 November 2016; pp. 328–342. [Google Scholar]
- Dang, M.; Duong, D. Improvement methods for stock market prediction using financial news articles. In Proceedings of the 2016 3rd National Foundation for Science and Technology Development Conference on Information and Computer Science (NICS), Danang, Vietnam, 14–16 September 2016; pp. 125–129. [Google Scholar]
- Vargas, M.R.; dos Anjos, C.E.M.; Bichara, G.L.G.; Evsukoff, A.G. Deep leaming for stock market prediction using technical indicators and financial news articles. In Proceedings of the 2018 International Joint Conference on Neural Networks (IJCNN), Rio de janeiro, Brazil, 8–13 July 2018; pp. 1–8. [Google Scholar]
- Chen, W.; Yeo, C.K.; Lau, C.T.; Lee, B.S. A study on real-time low-quality content detection on Twitter from the users’ perspective. PLoS ONE 2017, 12, e0182487. [Google Scholar] [CrossRef] [PubMed] [Green Version]
- Li, Q.; Wang, T.; Li, P.; Liu, L.; Gong, Q.; Chen, Y. The effect of news and public mood on stock movements. Inf. Sci. 2014, 278, 826–840. [Google Scholar] [CrossRef]
- dgoldfarb. Mplfinance a Matplotlib Utilities for the Visualization, and Visual Analysis, of Financial Data. 2020. Available online: https://github.com/matplotlib/mplfinance (accessed on 24 June 2021).
- Schöneburg, E. Stock price prediction using neural networks: A project report. Neurocomputing 1990, 2, 17–27. [Google Scholar] [CrossRef]
- Khoa, N.L.D.; Sakakibara, K.; Nishikawa, I. Stock price forecasting using back propagation neural networks with time and profit based adjusted weight factors. In Proceedings of the 2006 SICE-ICASE International Joint Conference, Busan, Korea, 18–21 October 2006; pp. 5484–5488. [Google Scholar]
- Chen, J.-F.; Chen, W.-L.; Huang, C.-P.; Huang, S.-H.; Chen, A.-P. Financial time-series data analysis using deep convolutional neural networks. In Proceedings of the 2016 7th International Conference on Cloud Computing and Big Data (CCBD), Macau, China, 16–18 November 2016; pp. 87–92. [Google Scholar]
- Al Amrani, Y.; Lazaar, M.; El Kadiri, K.E. Random forest and support vector machine based hybrid approach to sentiment analysis. Procedia Comput. Sci. 2018, 127, 511–520. [Google Scholar] [CrossRef]
- Ali, F.; El-Sappagh, S.; Kwak, D. Fuzzy ontology and LSTM-based text mining: A transportation network monitoring system for assisting travel. Sensors 2019, 19, 234. [Google Scholar] [CrossRef] [Green Version]
- Ali, F.; Ali, A.; Imran, M.; Naqvi, R.A.; Siddiqi, M.H.; Kwak, K.-S. Traffic accident detection and condition analysis based on social networking data. Accid. Anal. Prev. 2021, 151, 105973. [Google Scholar] [CrossRef] [PubMed]
- Basiri, M.E.; Nemati, S.; Abdar, M.; Cambria, E.; Acharya, U.R. ABCDM: An attention-based bidirectional CNN-RNN deep model for sentiment analysis. Future Gener. Comput. Syst. 2021, 115, 279–294. [Google Scholar] [CrossRef]
- Li, W.; Shao, W.; Ji, S.; Cambria, E. BiERU: Bidirectional emotional recurrent unit for conversational sentiment analysis. Neurocomputing 2021, 467, 73–82. [Google Scholar] [CrossRef]
- Khan, W.; Ghazanfar, M.A.; Azam, M.A.; Karami, A.; Alyoubi, K.H.; Alfakeeh, A.S. Stock market prediction using machine learning classifiers and social media, news. J. Ambient. Intell. Humaniz. Comput. 2020, 1–24. [Google Scholar] [CrossRef]
- Team NLTK. NLTK Is a Suite of Libraries and Programs for Symbolic and Statistical Natural Language Processing for English Written in the Python Programming Language. 2001. Available online: https://www.nltk.org (accessed on 24 June 2021).
- Smailović, J.; Grčar, M.; Lavrač, N.; Žnidaršič, M. Stream-based active learning for sentiment analysis in the financial domain. Inf. Sci. 2014, 285, 181–203. [Google Scholar] [CrossRef]
- Risius, M.; Akolk, F.; Beck, R.L. Differential emotions and the stock market-the case of company-specific trading. In Proceedings of the Twenty-Third European Conference on Information Systems (ECIS), Munster, Germany, 26–29 May 2015. [Google Scholar]
- Pedregosa, F.; Varoquaux, G.; Gramfort, A.; Michel, V.; Thirion, B.; Grisel, O.; Blondel, M.; Prettenhofer, P.; Weiss, R.; Dubourg, V.; et al. Scikit-learn: Machine learning in Python. J. Mach. Learn. Res. 2011, 12, 2825–2830. [Google Scholar]
- Joshi, R.; Tekchandani, R. Comparative analysis of Twitter data using supervised classifiers. In Proceedings of the 2016 International Conference on Inventive Computation Technologies (ICICT), Coimbatore, India, 26–27 August 2016; Volume 3, pp. 1–6. [Google Scholar]
- Swinburne, R. Bayes’ Theorem. Rev. Philos. Fr. 2004, 194, 2825–2830. [Google Scholar]
- Lakshmi, V.; Harika, K.; Bavishya, H.; Harsha, C.S. Sentiment analysis of twitter data. Int. Res. J. Eng. Technol. 2017, 4, 2224–2227. [Google Scholar]
- Xiao, Q.; Chang, X.; Zhang, X.; Liu, X. Multi-information spatial–temporal LSTM fusion continuous sign language neural machine translation. IEEE Access 2020, 8, 216718–216728. [Google Scholar] [CrossRef]
- Karevan, Z.; Suykens, J.A.K. Transductive LSTM for time-series prediction: An application to weather forecasting. Neural Netw. 2020, 125, 1–9. [Google Scholar] [CrossRef] [PubMed]
- Behera, R.K.; Jena, M.; Rath, S.K.; Misra, S. Co-LSTM: Convolutional LSTM model for sentiment analysis in social big data. Inf. Process. Manag. 2021, 58, 102435. [Google Scholar] [CrossRef]
- Wang, Z.; Yan, W.; Oates, T. Time series classification from scratch with deep neural networks: A strong baseline. In Proceedings of the 2017 International Joint Conference on Neural Networks (IJCNN), Anchorage, AK, USA, 14–19 May 2017; pp. 1578–1585. [Google Scholar]
- Malley, T.; Bursztein, E.; Long, J.; Chollet, F.; Jin, H.; Invernizzi, L. KerasTuner Is an Easy-to-Use, Scalable Hyperparameter Optimization Framework That Solves the Pain Points of Hyperparameter Search. 2019. Available online: https://github.com/keras-team/keras-tuner (accessed on 24 July 2021).
- Morris, G.L. Candlestick Charting Explained: Timeless Techniques for Trading Stocks and Futures: Timeless Techniques for Trading Stocks and Sutures; McGraw Hill Professional: New York City, NY, USA, 2006. [Google Scholar]
- Nison, S. Japanese Candlestick Charting Techniques: A Contemporary Guide to the Ancient Investment Techniques of the Far East; Penguin: London, UK, 2001. [Google Scholar]
- GNU General Public License. Snscrape a Scraper for Social Networking Services (SNS). 2020. Available online: https://github.com/JustAnotherArchivist/snscrape (accessed on 24 May 2021).
- Joshua, R. Tweepy An Easy-to-Use Python Library for Accessing the Twitter API. 2009. Available online: https://www.tweepy.org/ (accessed on 24 May 2021).


| No | Stock Name | Ticker Symbol | Country/Stock Exchange |
|---|---|---|---|
| 1 | Apple | AAPL | USA |
| 2 | Tesla | TSLA | USA |
| 3 | IBM | IBM | USA |
| 4 | Amazon | AMZN | USA |
| 5 | Alphabet (Google) | GOOG | USA |
| Date | TweetText | RetweetCount | LikeCount |
|---|---|---|---|
| 30 June 2020 | Jim Cramer break favorite stock… | 7 | 72 |
| 30 June 2020 | Today Recap look ahead spx aapl… | 3 | 37 |
| 30 June 2020 | top 10 holding stock portfolio… | 0 | 10 |
| 30 June 2020 | Setting team success Look name… | 3 | 11 |
| 30 June 2020 | MNST COO AAPL… | 0 | 56 |
| 30 June 2020 | top 10 holding make 62 portfol… | 5 | 74 |
| 30 June 2020 | SPOT AAPL ht @a16z… | 3 | 16 |
| Date | SentimentScore | Open | High | Low | Close | Volume |
|---|---|---|---|---|---|---|
| 30 June 2016 | 36 | 23.61 | 23.94 | 23.56 | 23.90 | 143,345,600 |
| 1 July 2016 | 86 | 23.87 | 24.12 | 23.83 | 23.97 | 104,106,000 |
| 5 July 2016 | 182 | 23.85 | 23.85 | 23.61 | 23.75 | 110,820,800 |
| 6 July 2016 | 218 | 23.65 | 23.92 | 23.59 | 23.88 | 123,796,400 |
| 7 July 2016 | 240 | 23.92 | 24.13 | 23.91 | 23.99 | 100,558,400 |
| 8 July 2016 | 262 | 24.12 | 24.22 | 24.01 | 24.17 | 115,648,400 |
| 11 July 2016 | 322 | 24.19 | 24.41 | 24.18 | 24.25 | 95,179,600 |
| 12 July 2016 | 346 | 24.29 | 24.42 | 24.28 | 24.35 | 96,670,000 |
| Stock | Time Period | RF | LinearSVC | GaussianNB | LSTM | 1D-CNN |
|---|---|---|---|---|---|---|
| AAPL | 10 days | 62.81% | 51.76% | 58.79% | 62.81% | 71.36% |
| 8 days | 61.31% | 56.28% | 60.30% | 60.30% | 71.86% | |
| 6 days | 56.78% | 55.28% | 59.30% | 57.29% | 65.33% | |
| 4 days | 61.31% | 51.76% | 55.28% | 60.80% | 67.84% | |
| TSLA | 10 days | 60.80% | 55.78% | 58.29% | 64.82% | 63.32% |
| 8 days | 57.29% | 55.78% | 56.28% | 60.30% | 63.32% | |
| 6 days | 58.79% | 54.77% | 52.76% | 61.81% | 68.34% | |
| 4 days | 57.29% | 55.78% | 57.29% | 54.27% | 59.80% | |
| IBM | 10 days | 60.30% | 62.81% | 61.31% | 60.80% | 64.82% |
| 8 days | 59.80% | 60.30% | 59.80% | 62.31% | 64.82% | |
| 6 days | 55.28% | 56.28% | 59.30% | 56.78% | 59.80% | |
| 4 days | 46.73% | 56.78% | 54.27% | 57.79% | 52.76% | |
| AMZN | 10 days | 64.80% | 52.80% | 61.20% | 62.80% | 69.60% |
| 8 days | 61.60% | 53.60% | 60.00% | 58.00% | 64.80% | |
| 6 days | 61.20% | 58.40% | 59.60% | 56.40% | 61.60% | |
| 4 days | 64.40% | 60.80% | 64.00% | 60.40% | 61.60% | |
| GOOG | 10 days | 55.28% | 59.30% | 53.77% | 55.78% | 67.34% |
| 8 days | 57.29% | 59.30% | 56.28% | 56.28% | 67.34% | |
| 6 days | 56.78% | 57.29% | 57.29% | 58.79% | 58.79% | |
| 4 days | 54.27% | 53.77% | 56.78% | 59.30% | 62.81% |
| Stock | Period Time | Sentiment | Candlestick Chart | Joint Network |
|---|---|---|---|---|
| Accuracy (Accuracy_Level) | Accuracy (Accuracy_Level) | Accuracy (Accuracy_Level) | ||
| AAPL | 10 days | 71.36% (7) | 62.81% (6) | 75.38% (7) |
| 8 days | 71.86% (7) | 61.31% (6) | 74.37% (7) | |
| 6 days | 65.33% (6) | 57.29% (5) | 66.83% (6) | |
| 4 days | 67.84% (6) | 61.31% (6) | 64.82% (6) | |
| TSLA | 10 days | 63.32% (6) | 50.75% (5) | 71.86% (7) |
| 8 days | 63.32% (6) | 52.76% (5) | 69.35% (6) | |
| 6 days | 68.34% (6) | 56.28% (5) | 64.32% (6) | |
| 4 days | 59.80% (5) | 52.76% (5) | 64.32% (6) | |
| IBM | 10 days | 64.82% (6) | 47.74% (4) | 67.84% (6) |
| 8 days | 64.82% (6) | 49.25% (4) | 69.35% (6) | |
| 6 days | 59.80% (5) | 49.25% (4) | 60.08% (6) | |
| 4 days | 52.76% (5) | 44.72% (4) | 51.26% (5) | |
| AMZN | 10 days | 69.60% (6) | 61.20% (6) | 74.80% (7) |
| 8 days | 64.80% (6) | 57.60% (5) | 64.00% (6) | |
| 6 days | 61.60% (6) | 56.40% (5) | 67.60% (6) | |
| 4 days | 61.60% (6) | 60.40% (6) | 66.00% (6) | |
| GOOG | 10 days | 67.34% (6) | 54.77% (5) | 67.34% (6) |
| 8 days | 67.34% (6) | 56.28% (5) | 67.84% (6) | |
| 6 days | 58.79% (5) | 56.78% (5) | 60.30% (6) | |
| 4 days | 62.81% (6) | 57.29% (5) | 62.31% (6) |
| Stock | Time Period | Accuracy | Precision | Recall | F-Score |
|---|---|---|---|---|---|
| AAPL | 10 days | 75.38% | 68.66% | 62.16% | 65.25% |
| 8 days | 74.37% | 76.00% | 49.35% | 59.84% | |
| 6 days | 66.83% | 64.18% | 50.59% | 56.58% | |
| 4 days | 64.48% | 65.22% | 19.48% | 30.00% | |
| TSLA | 10 days | 71.86% | 68.42% | 79.59% | 73.58% |
| 8 days | 69.35% | 70.37% | 60.64% | 65.14% | |
| 6 days | 64.32% | 60.53% | 52.87% | 56.44% | |
| 4 days | 64.32% | 60.75% | 69.15% | 64.68% | |
| IBM | 10 days | 67.84% | 72.73% | 61.53% | 66.67% |
| 8 days | 69.35% | 70.83% | 67.33% | 69.04% | |
| 6 days | 60.80% | 65.33% | 48.51% | 55.68% | |
| 4 days | 51.26% | 57.83% | 43.64% | 49.74% | |
| AMZN | 10 days | 74.80% | 68.09% | 65.98% | 67.02% |
| 8 days | 64.00% | 61.11% | 41.51% | 49.44% | |
| 6 days | 67.60% | 68.42% | 47.71% | 56.22% | |
| 4 days | 66.00% | 60.94% | 39.39% | 47.85% | |
| GOOG | 10 days | 67.34% | 82.05% | 35.56% | 49.61% |
| 8 days | 67.84% | 78.05% | 36.78% | 50.00% | |
| 6 days | 60.30% | 57.78% | 30.23% | 39.69% | |
| 4 days | 62.31% | 66.67% | 23.53% | 34.78% |
Publisher’s Note: MDPI stays neutral with regard to jurisdictional claims in published maps and institutional affiliations. |
© 2021 by the authors. Licensee MDPI, Basel, Switzerland. This article is an open access article distributed under the terms and conditions of the Creative Commons Attribution (CC BY) license (https://creativecommons.org/licenses/by/4.0/).
Share and Cite
Ho, T.-T.; Huang, Y. Stock Price Movement Prediction Using Sentiment Analysis and CandleStick Chart Representation. Sensors 2021, 21, 7957. https://doi.org/10.3390/s21237957
Ho T-T, Huang Y. Stock Price Movement Prediction Using Sentiment Analysis and CandleStick Chart Representation. Sensors. 2021; 21(23):7957. https://doi.org/10.3390/s21237957
Chicago/Turabian StyleHo, Trang-Thi, and Yennun Huang. 2021. "Stock Price Movement Prediction Using Sentiment Analysis and CandleStick Chart Representation" Sensors 21, no. 23: 7957. https://doi.org/10.3390/s21237957
APA StyleHo, T.-T., & Huang, Y. (2021). Stock Price Movement Prediction Using Sentiment Analysis and CandleStick Chart Representation. Sensors, 21(23), 7957. https://doi.org/10.3390/s21237957