
Mental Stress Classification Based on a Support Vector Machine and Naive Bayes Using Electrocardiogram Signals


Abstract
:1. Introduction
2. Materials and Methods
2.1. Subject
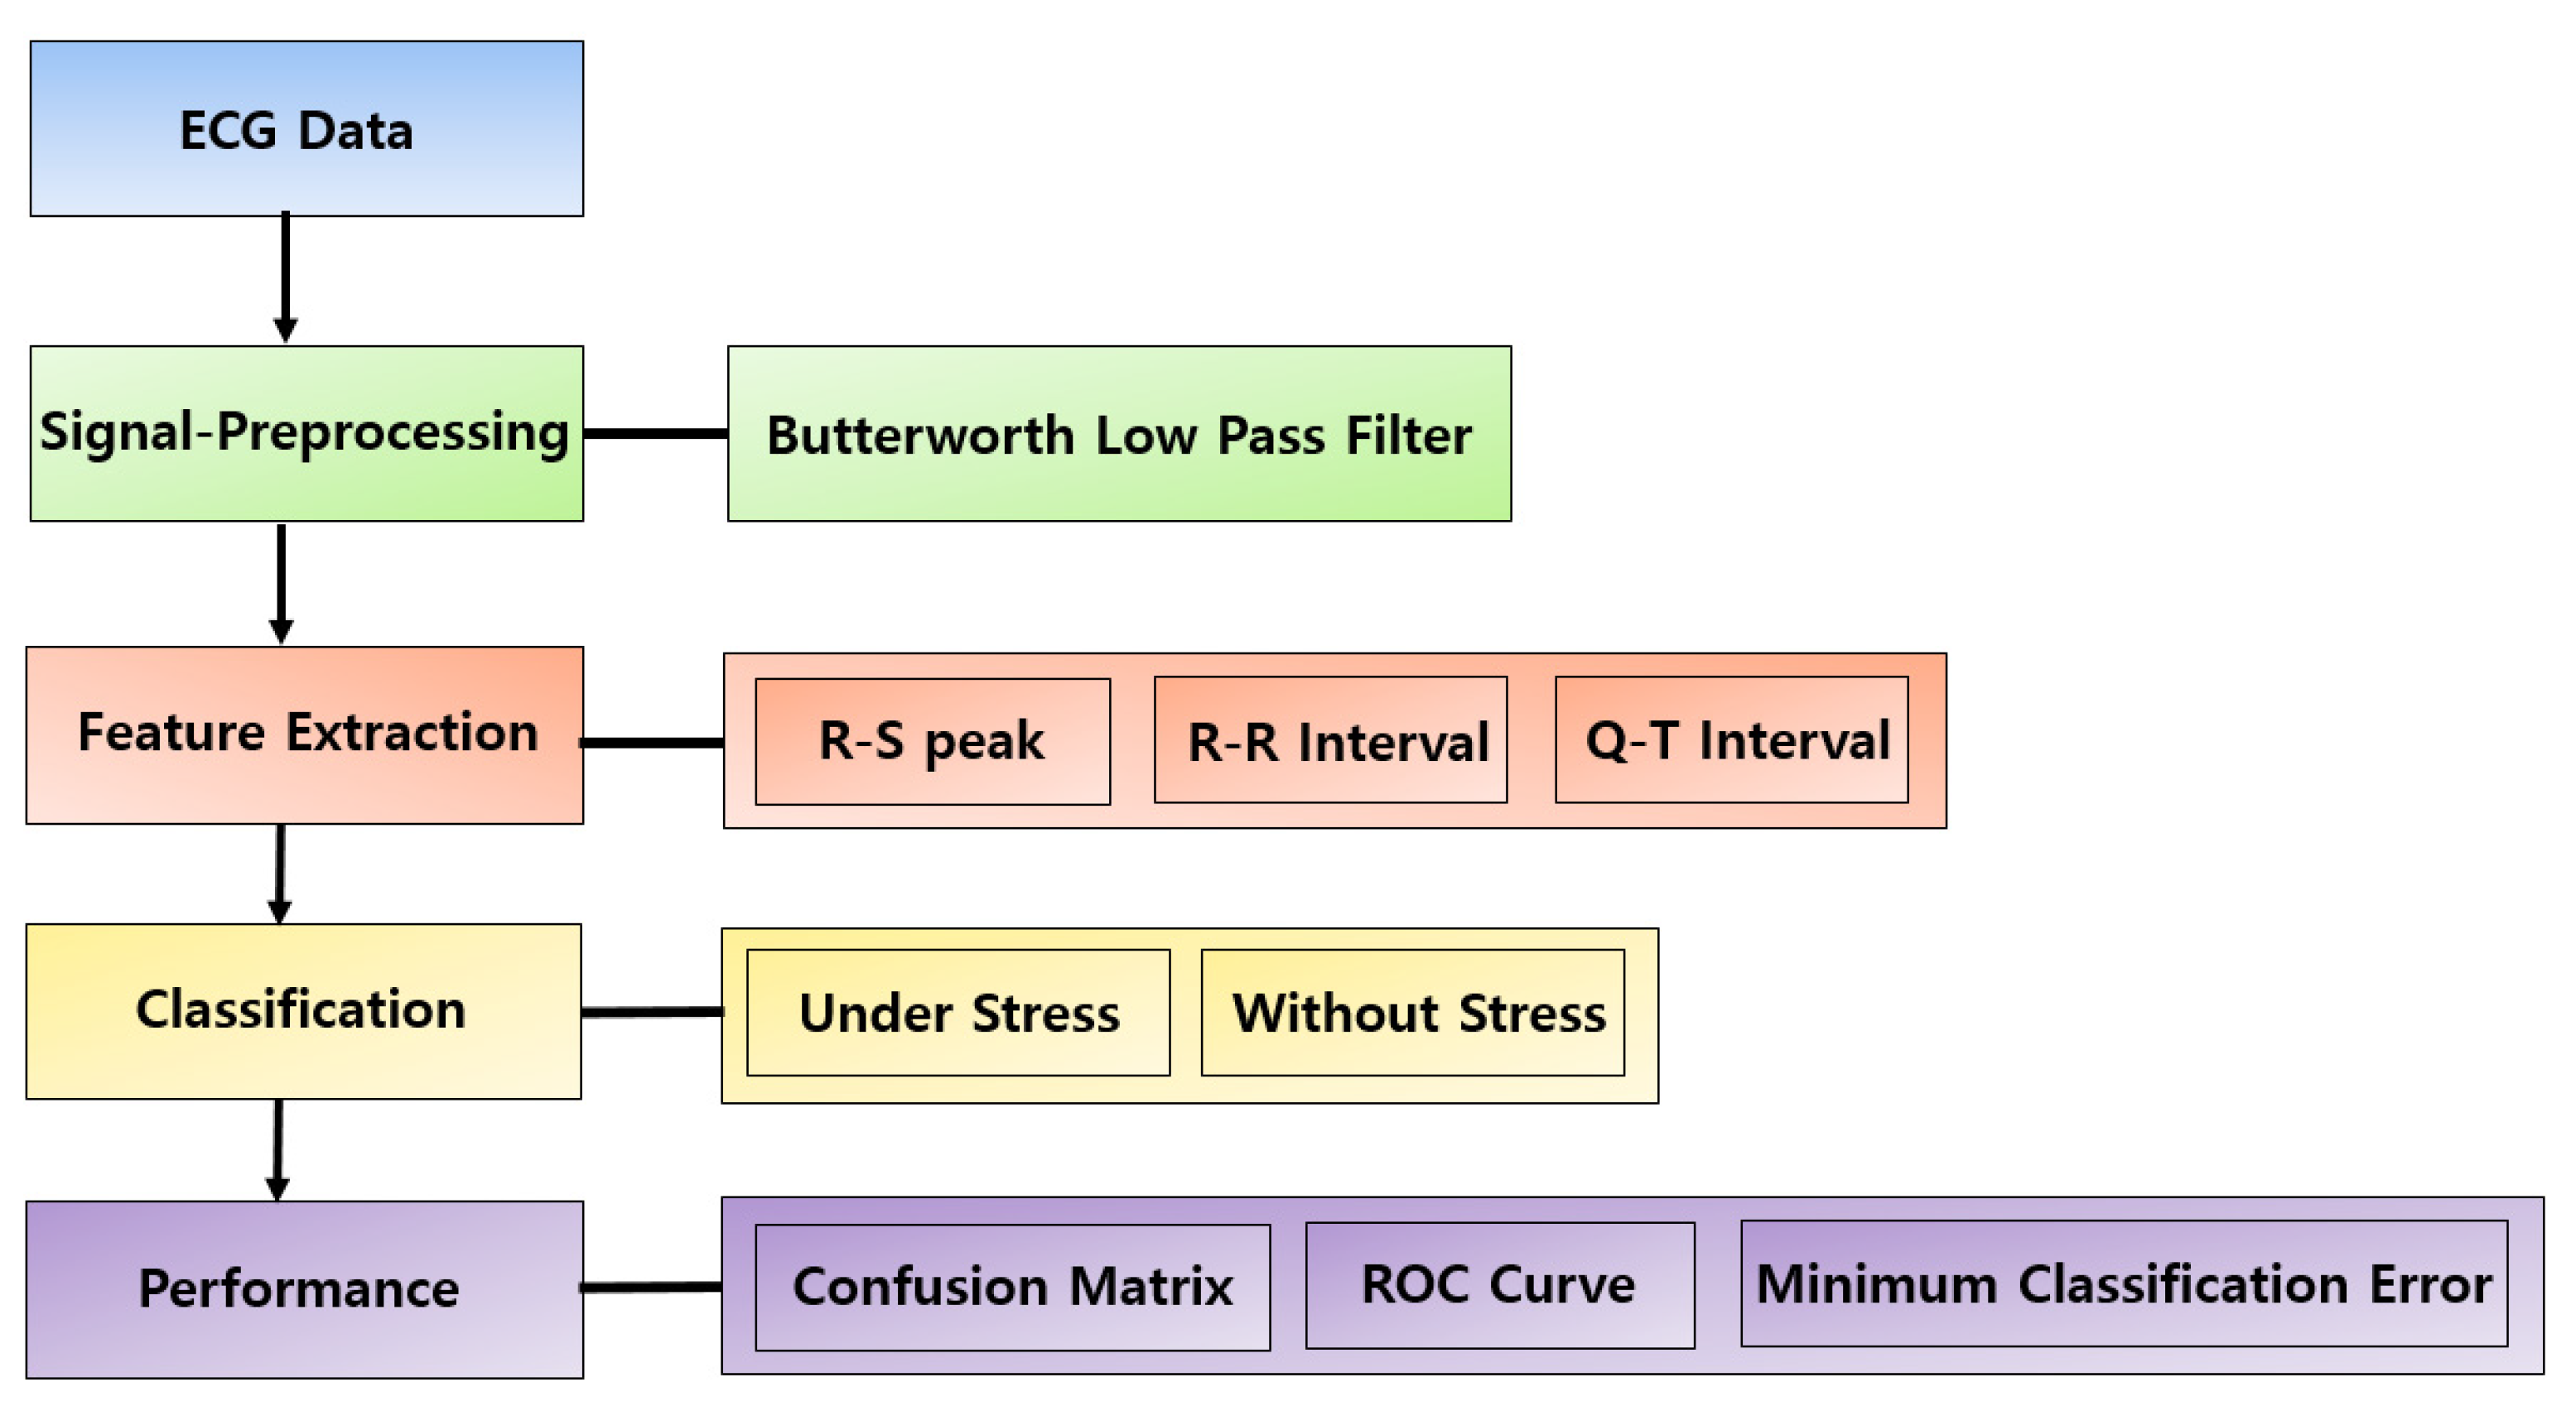
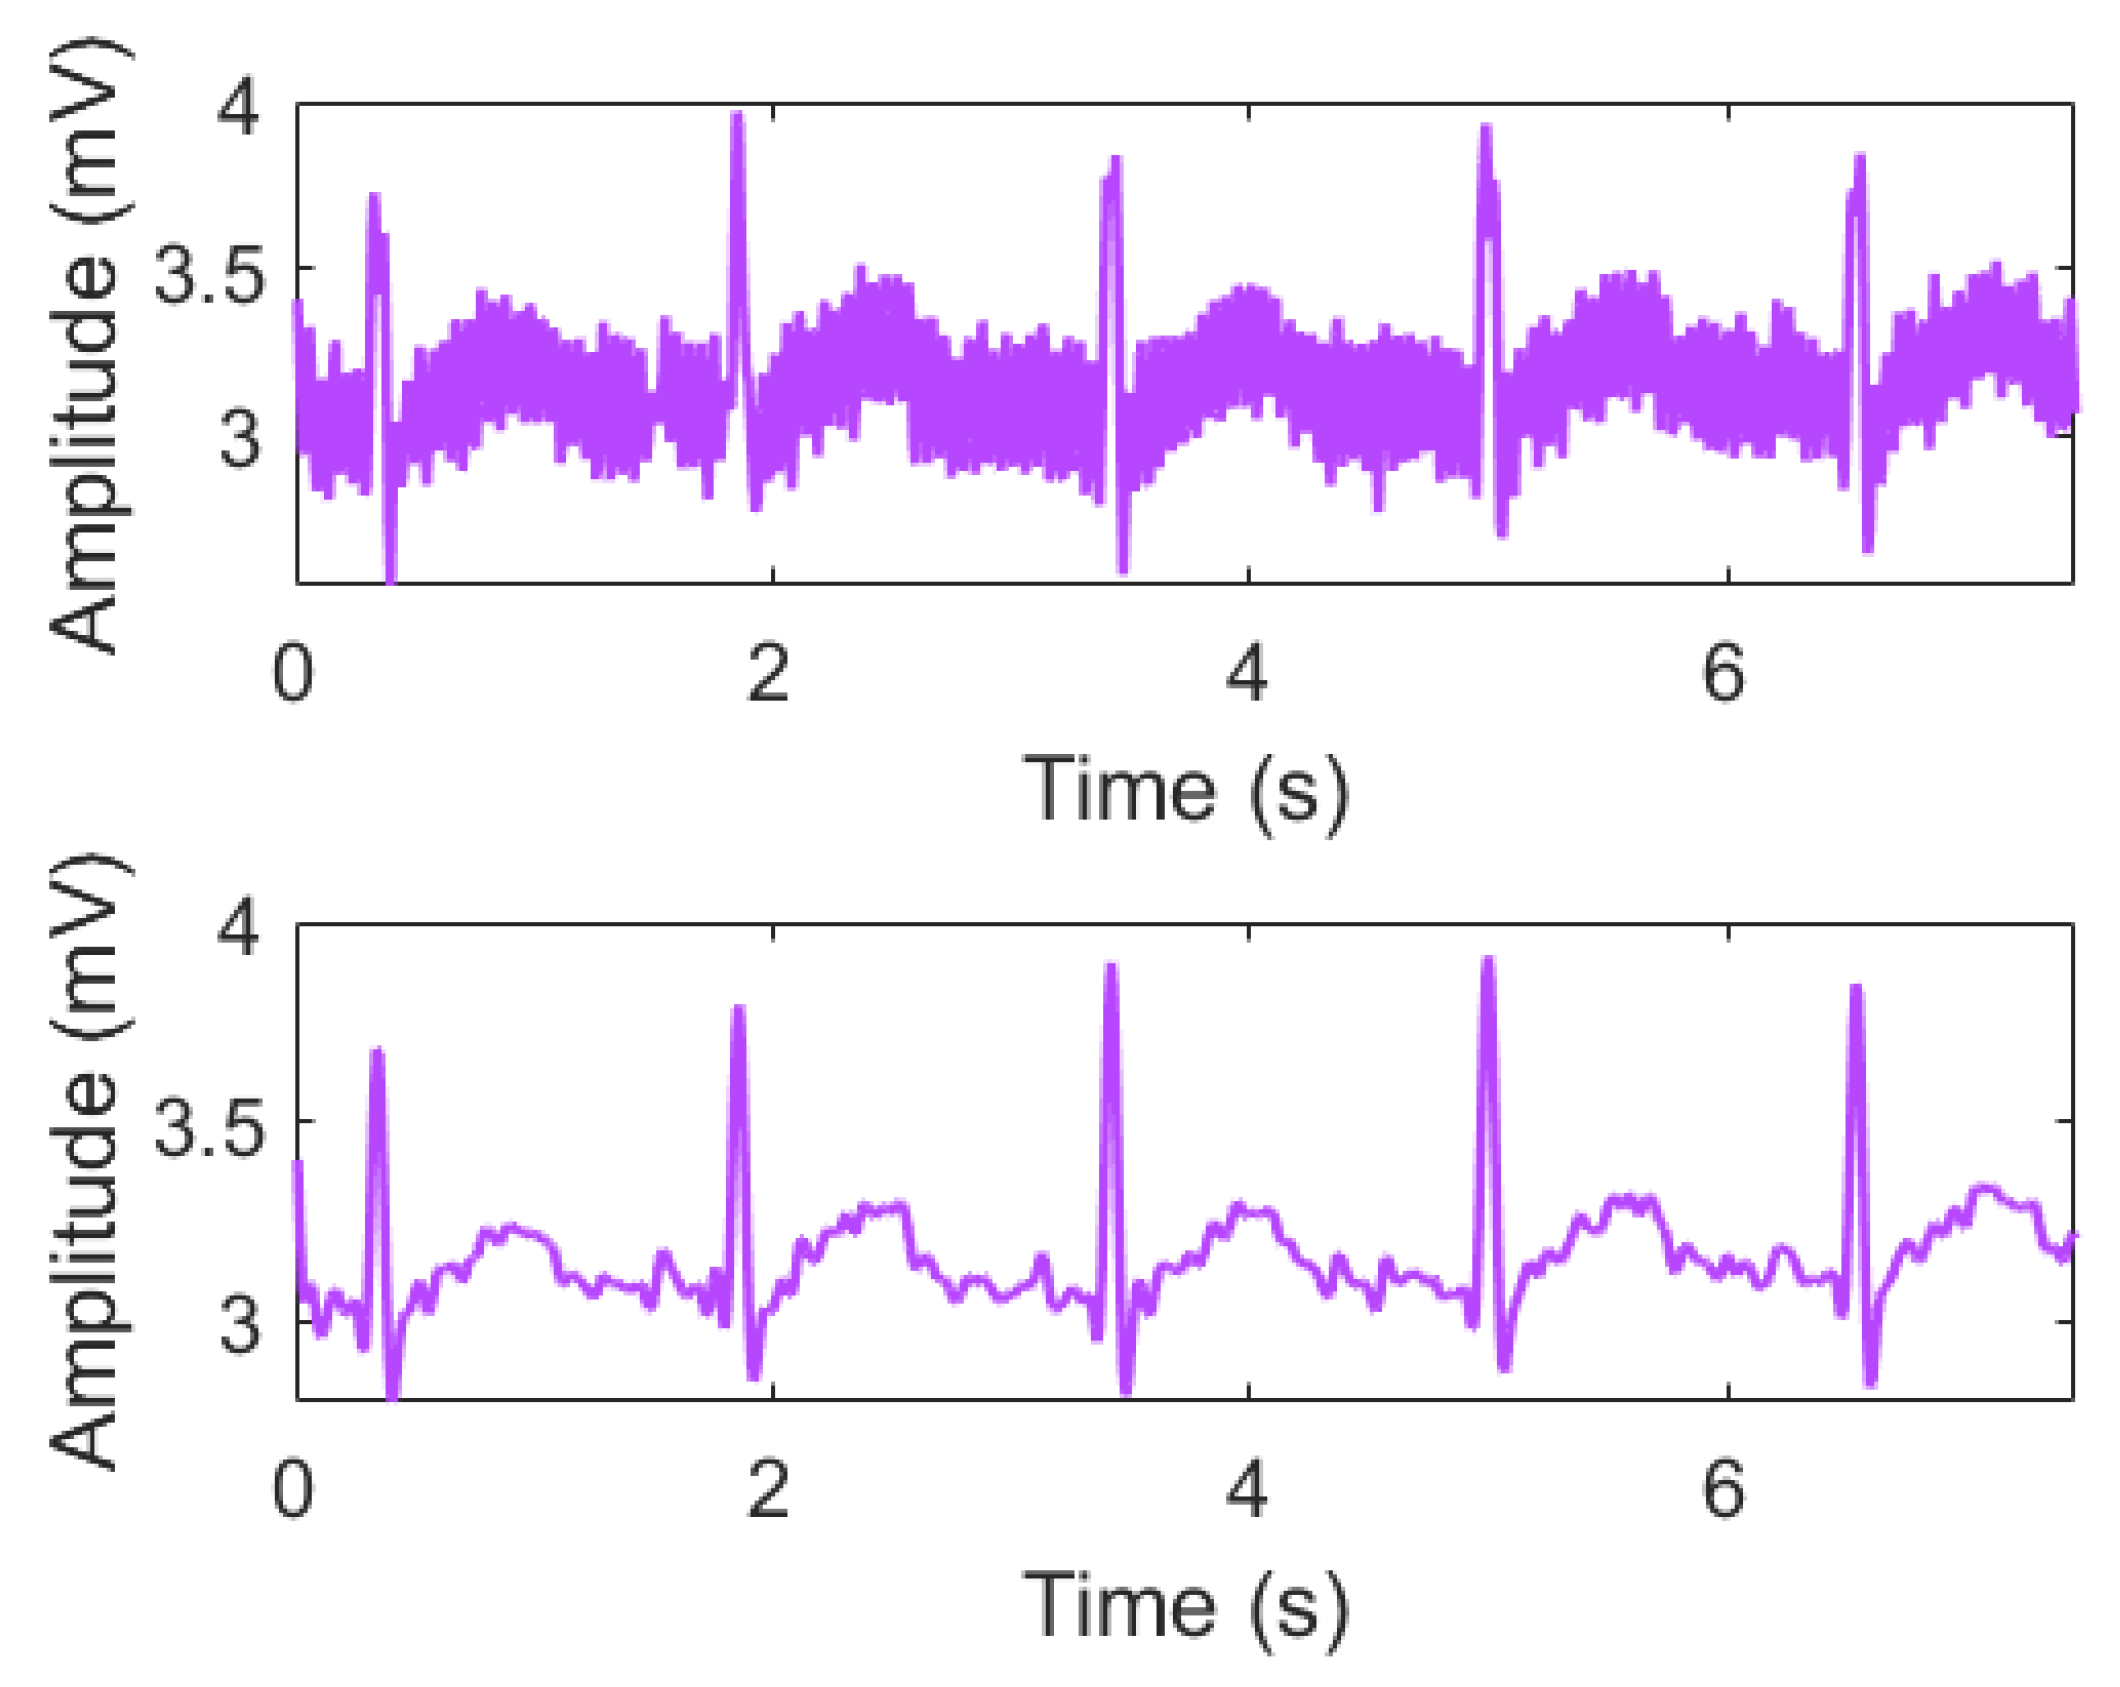
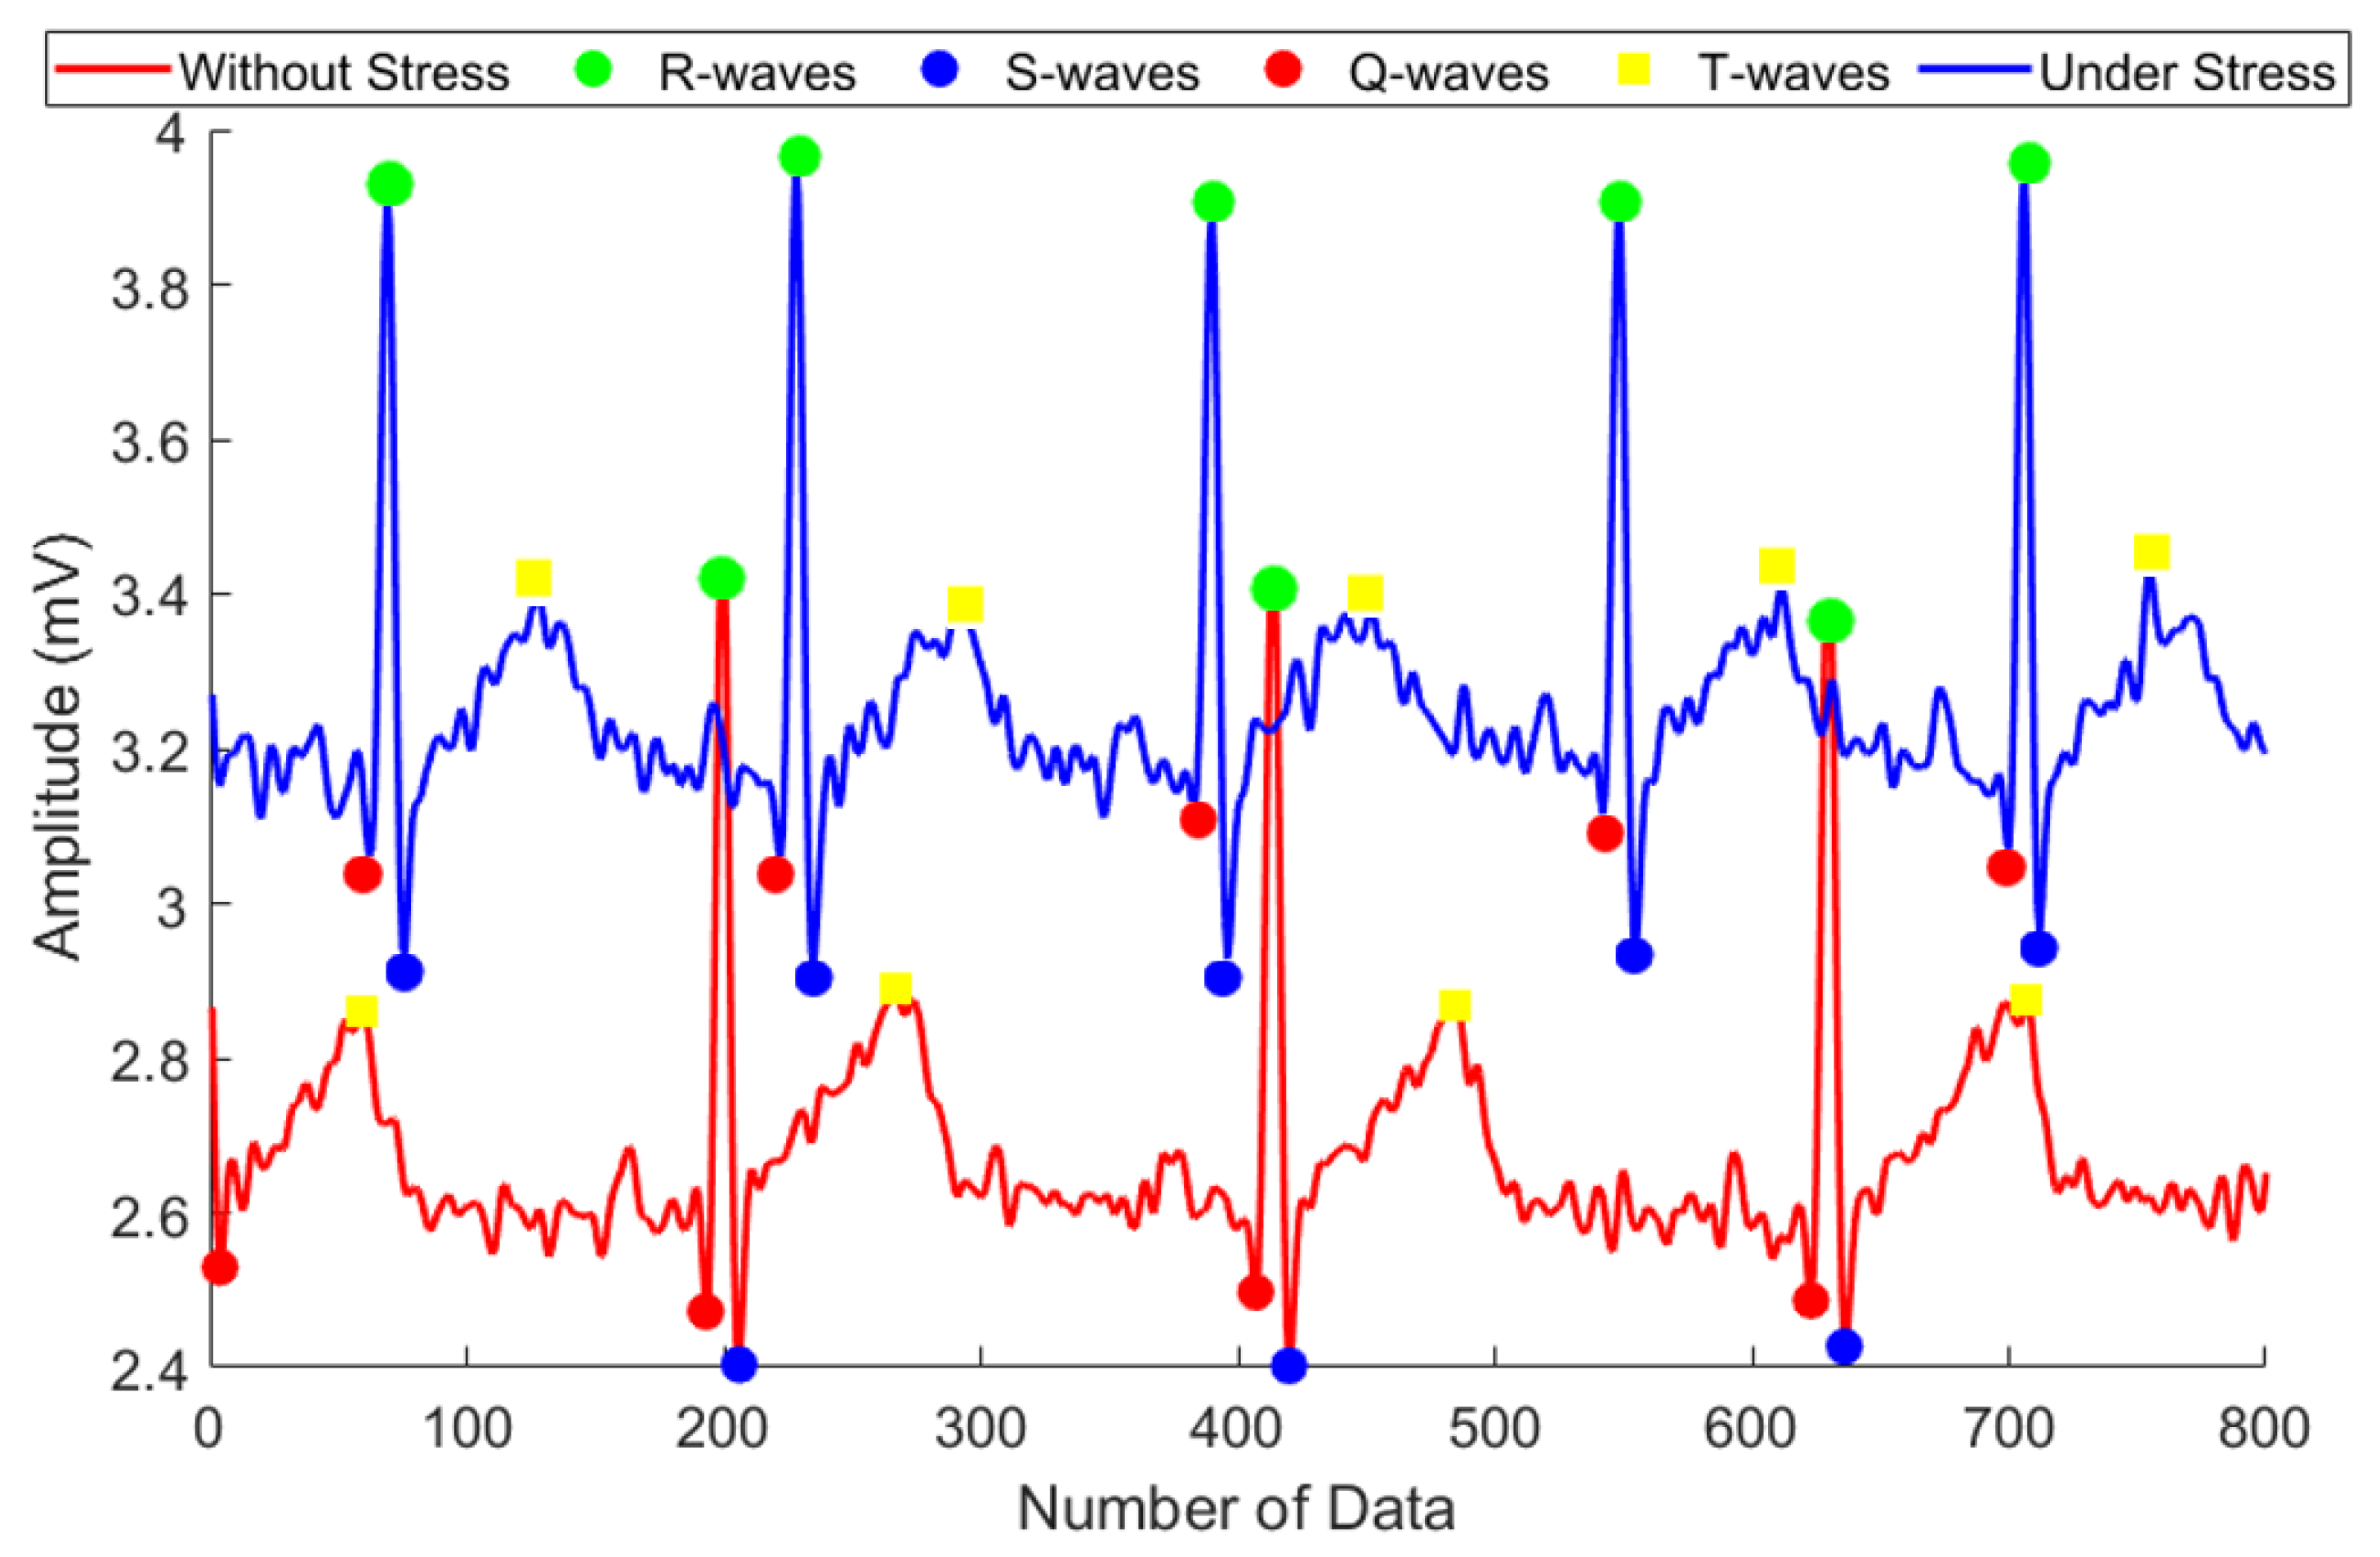
2.2. Preprocessing and Feature Extraction
3. Training Model
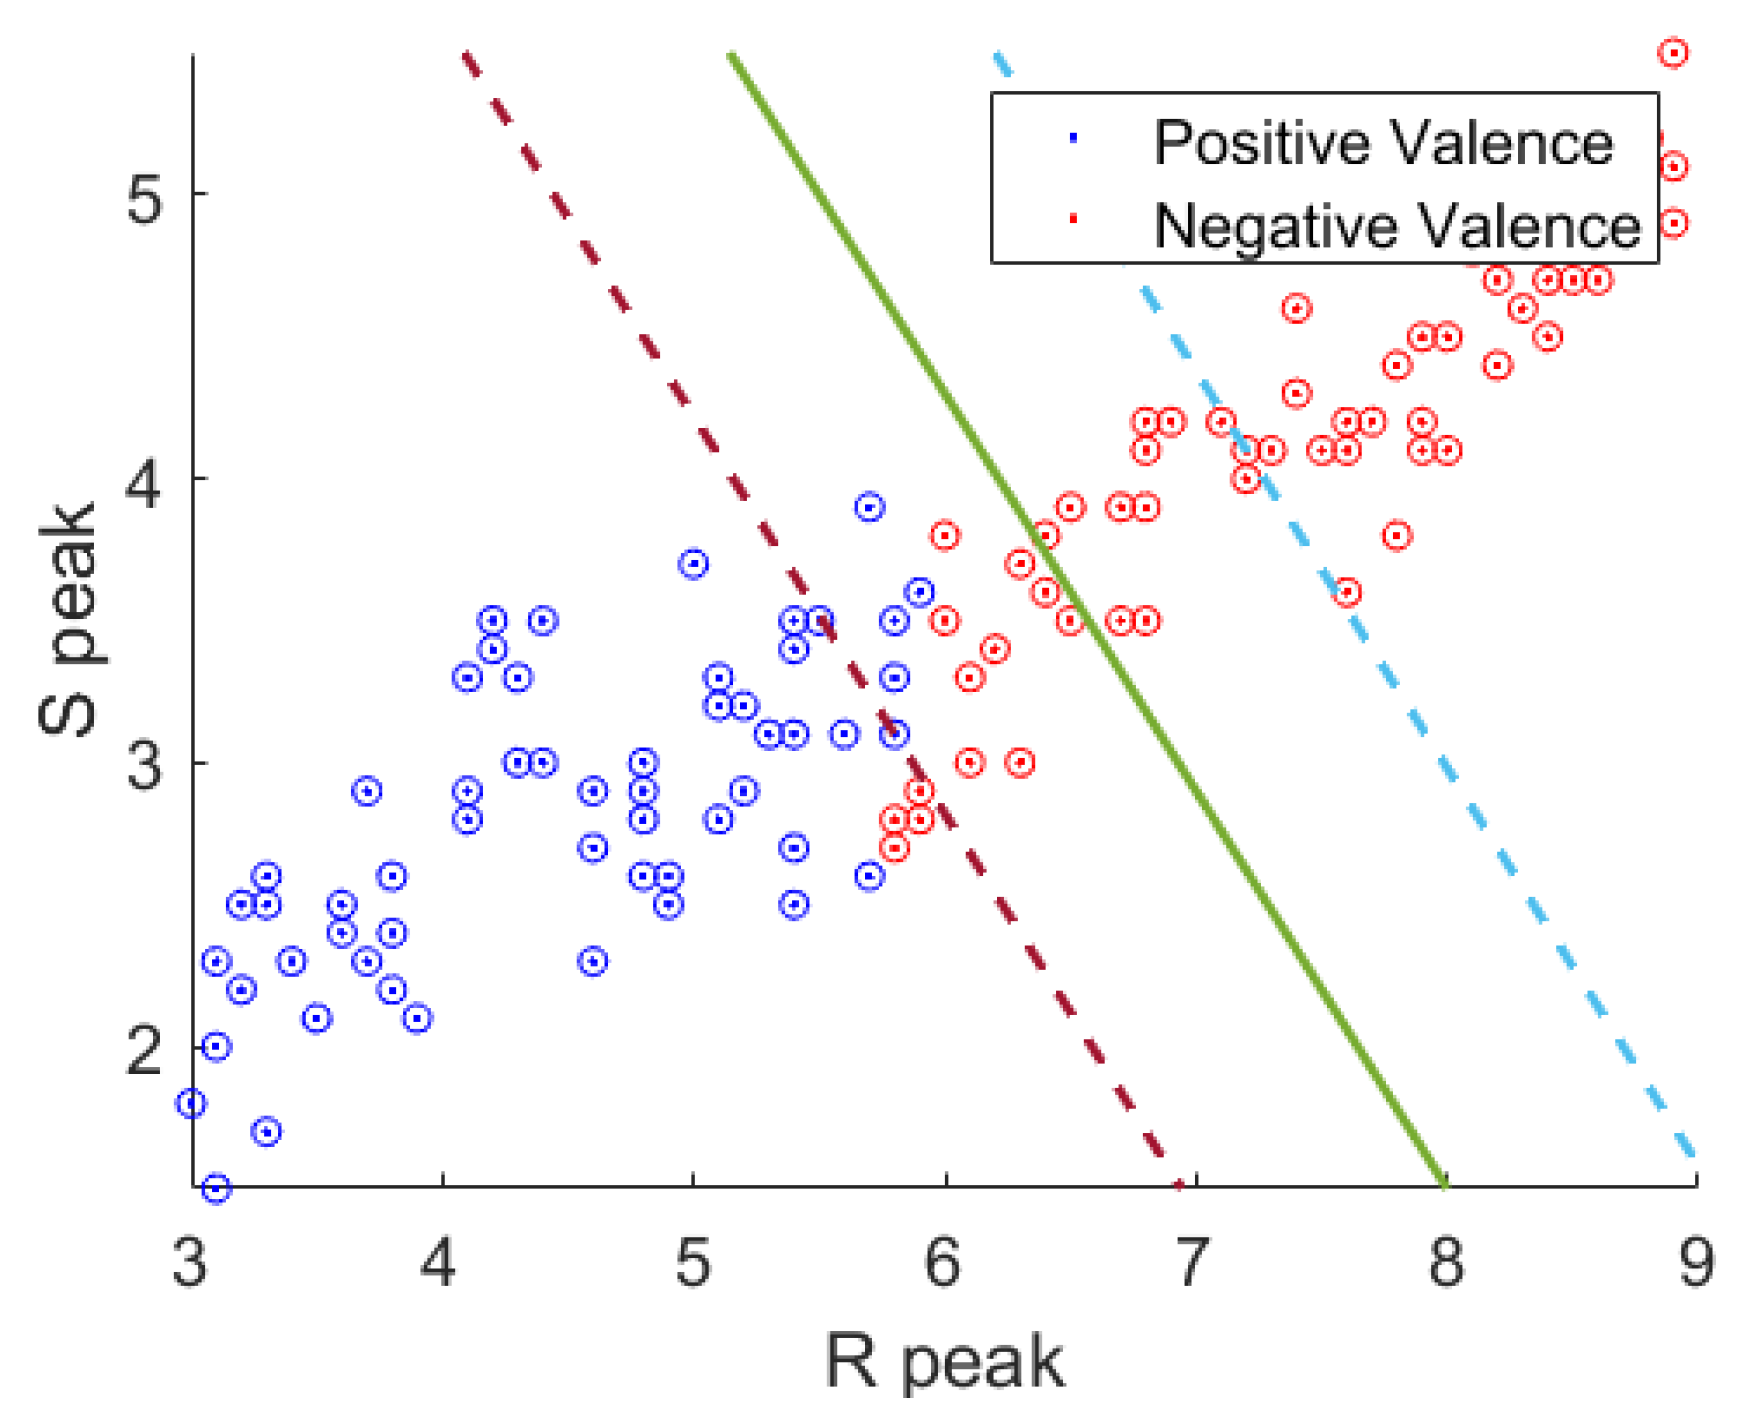
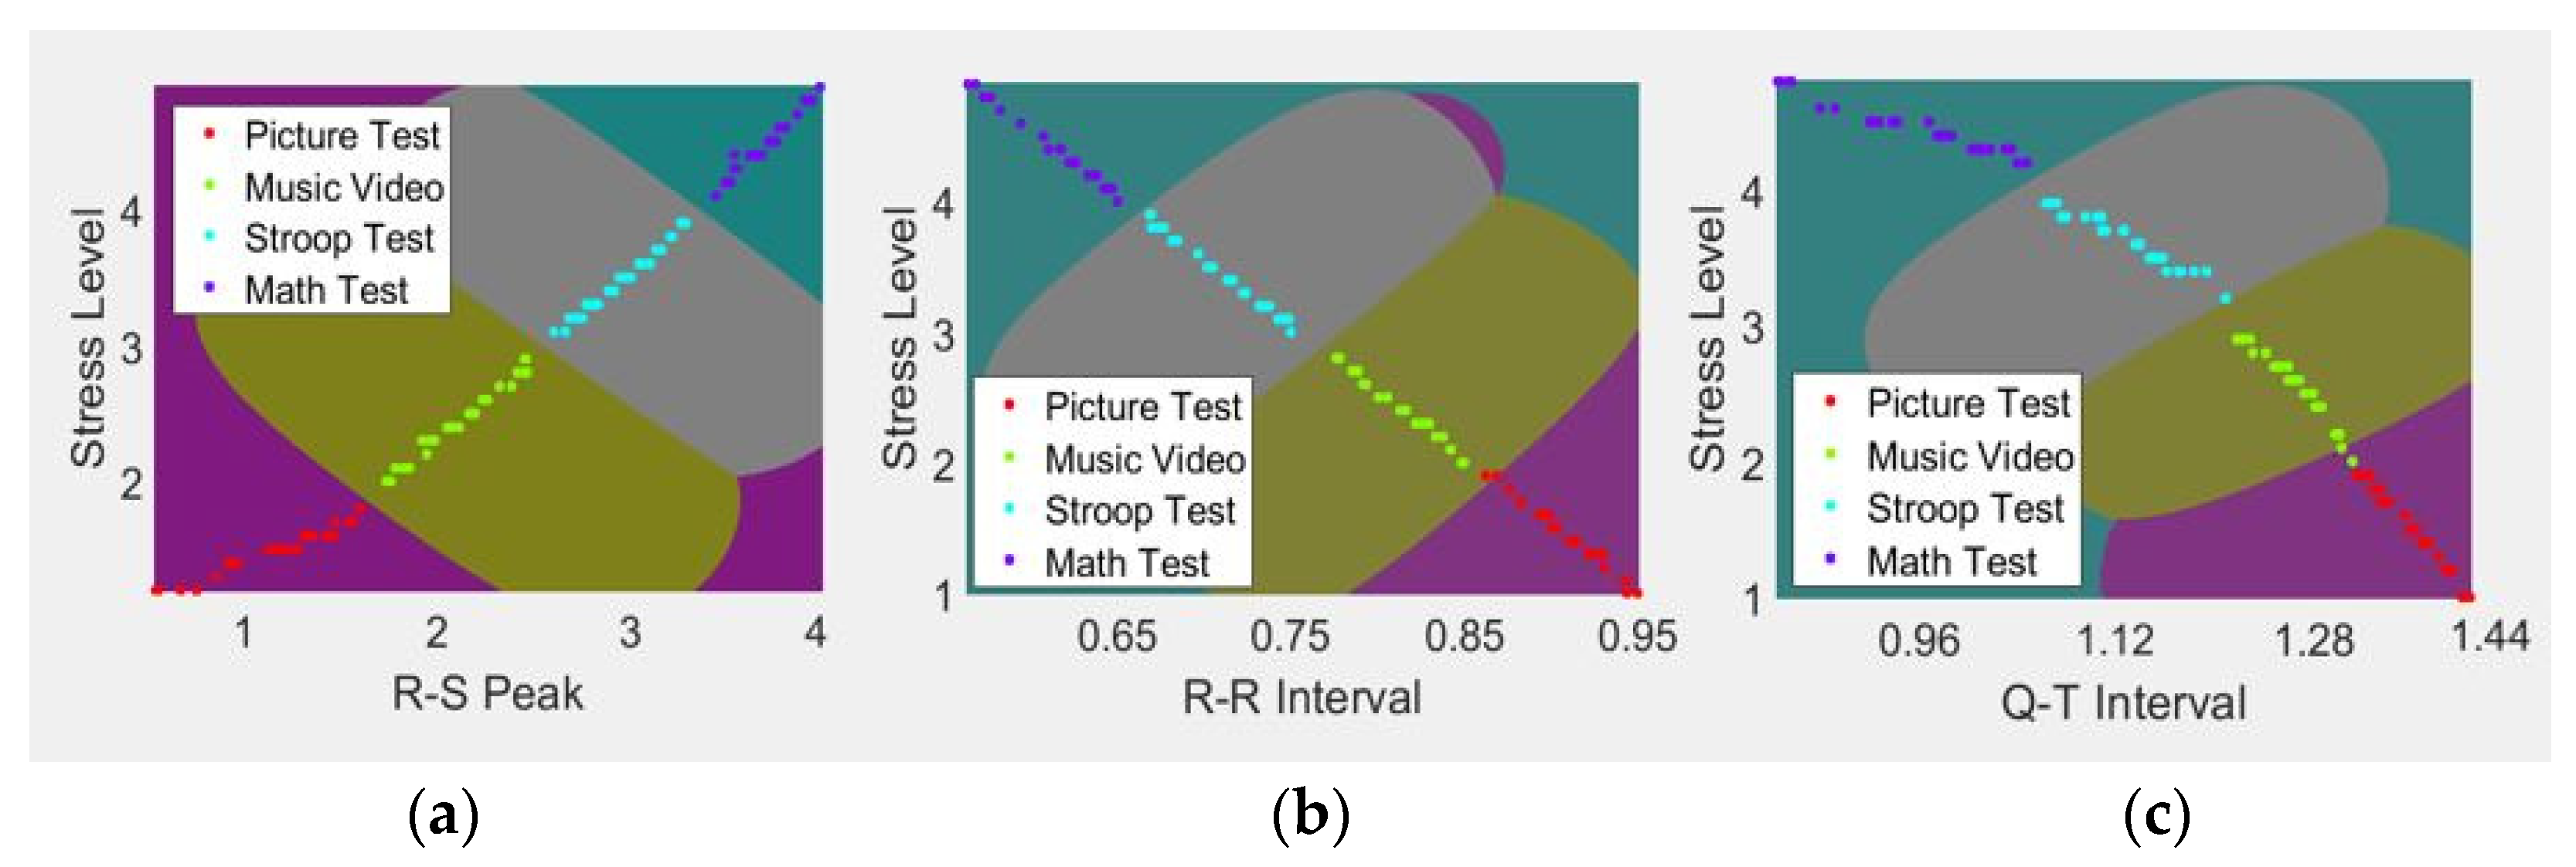
3.1. Support Vector Machine (SVM)
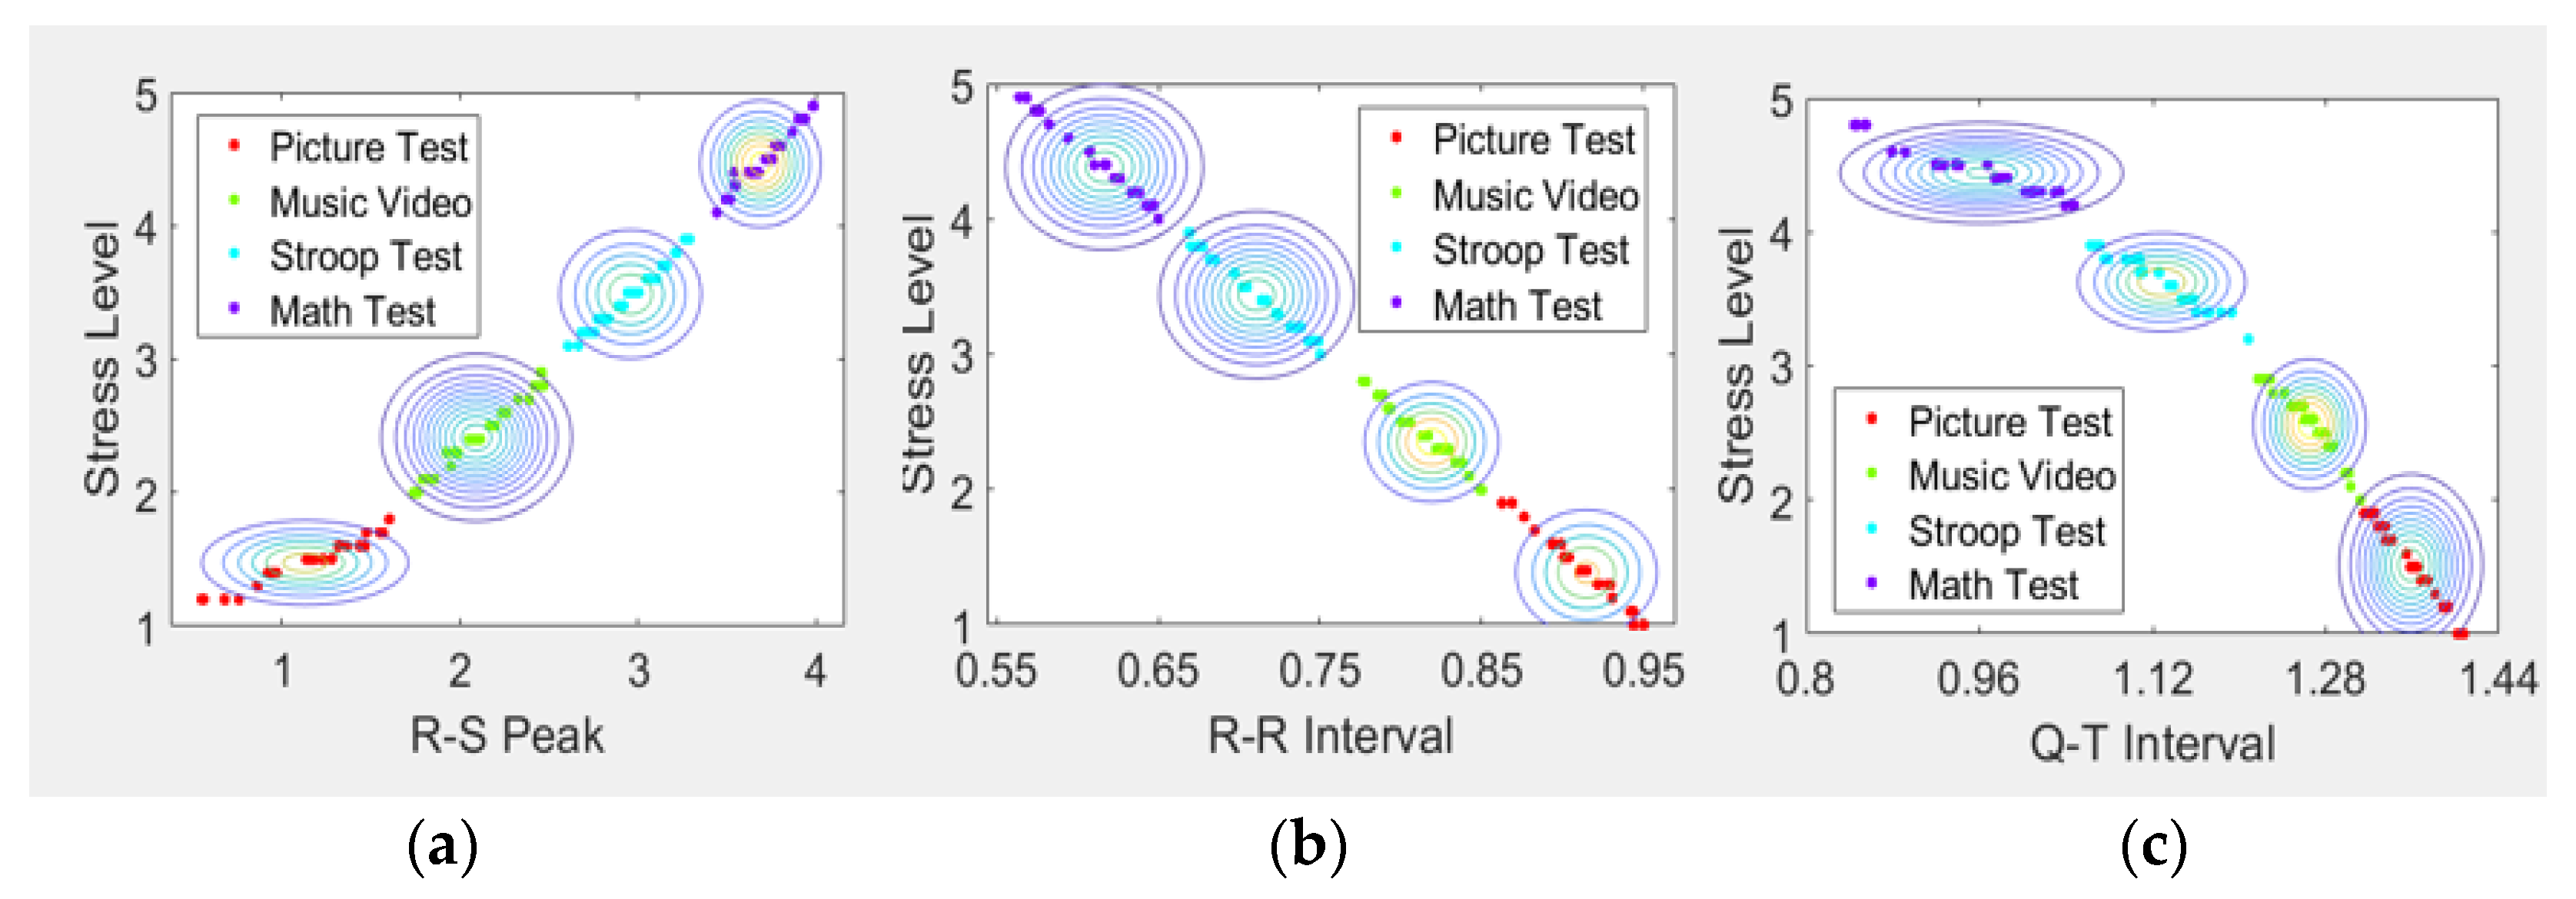
3.2. Naive Bayes
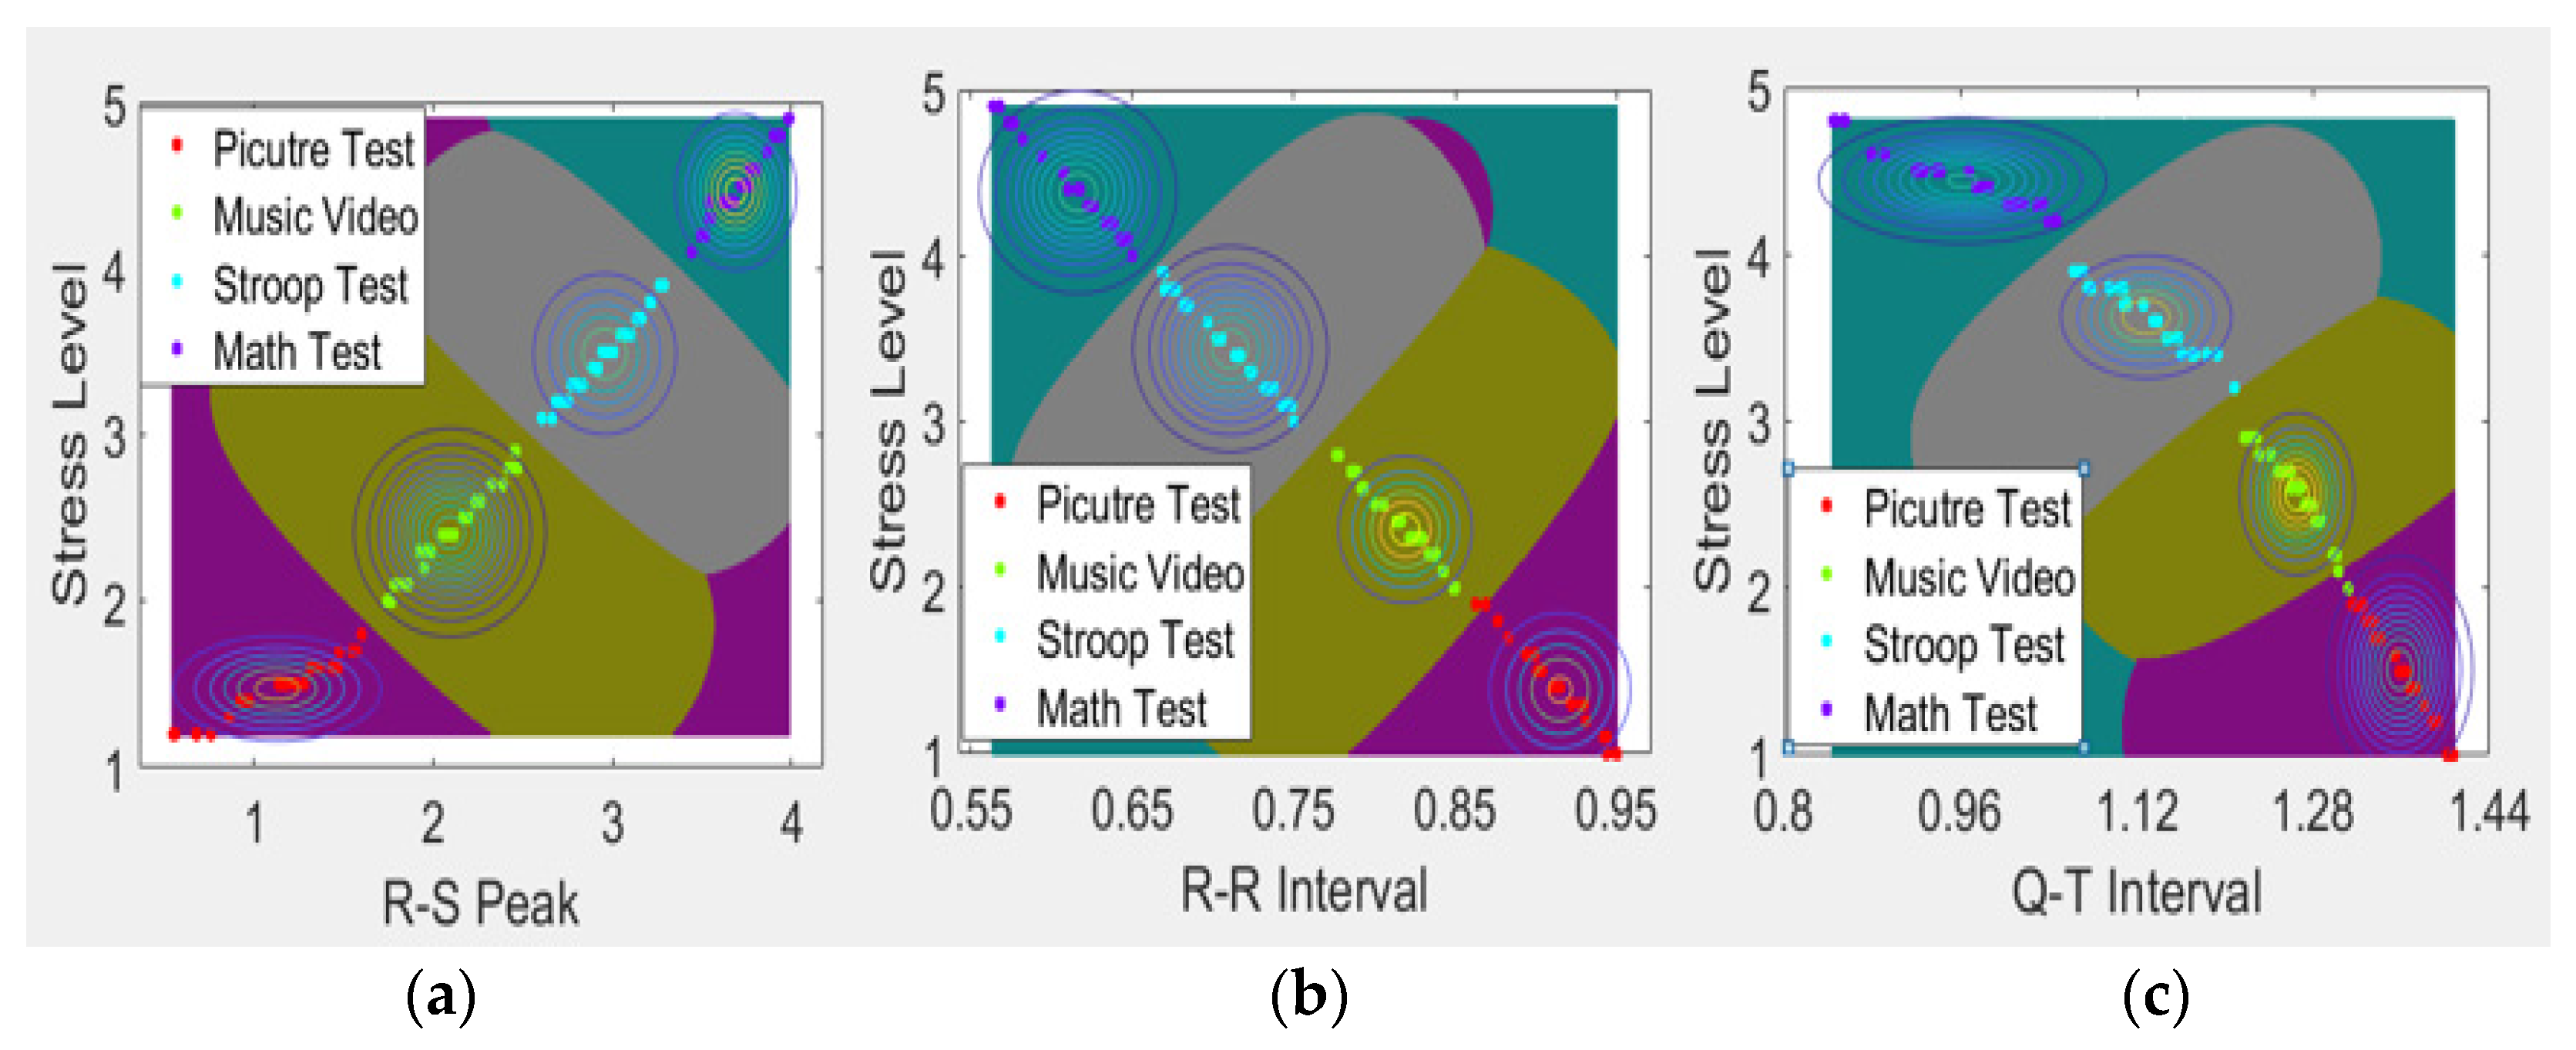
3.3. Support Vector Machine and Naive Bayes
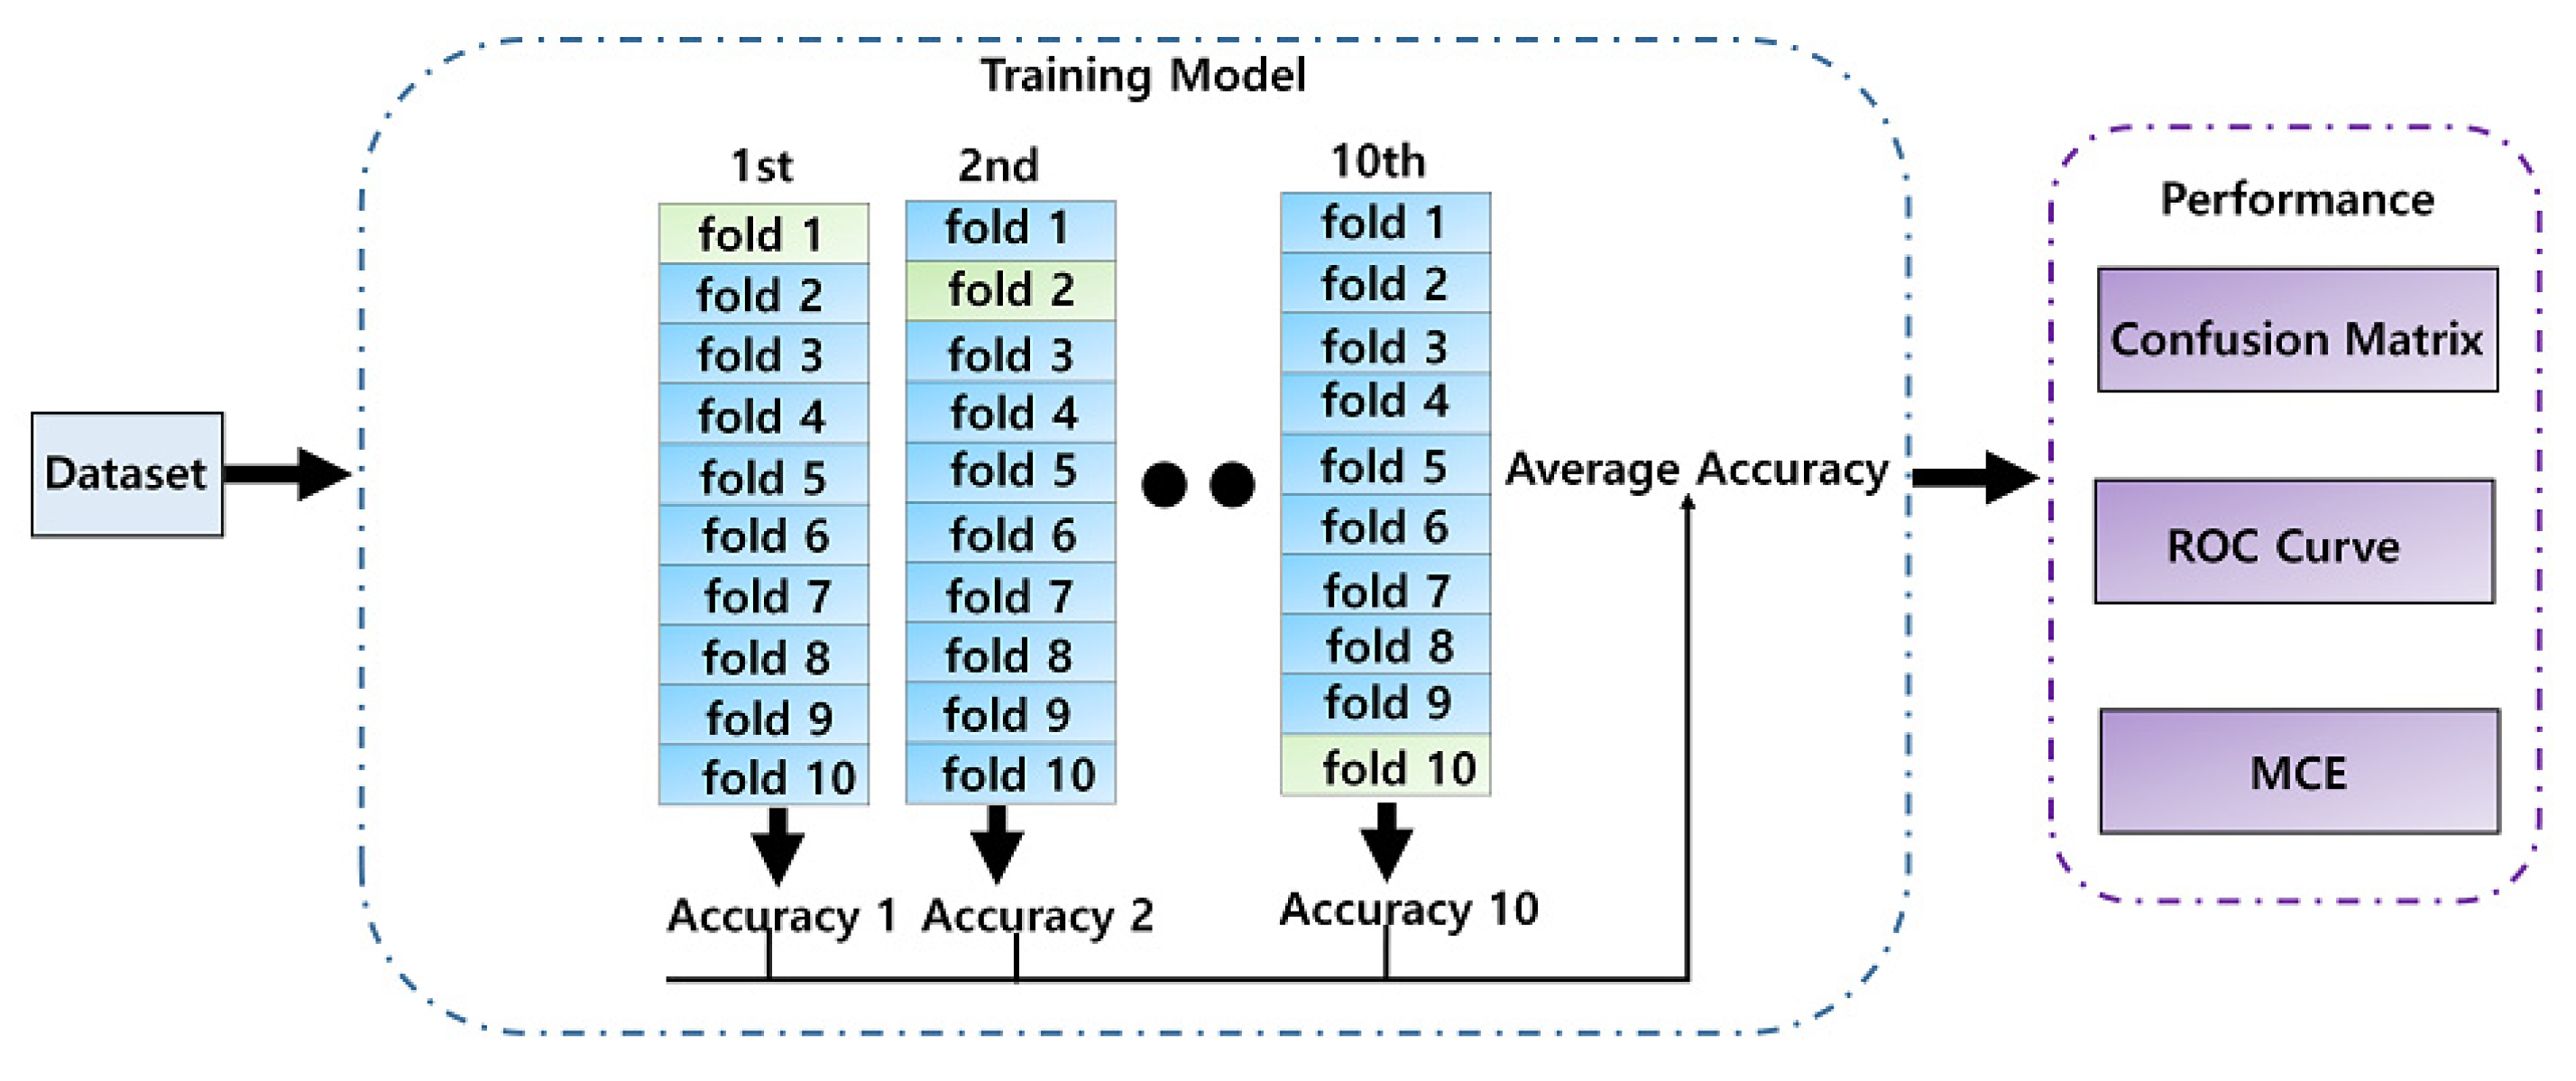
3.4. K-Fold Cross-Validation
4. Experimental Results
5. Discussion
6. Conclusions
Author Contributions
Funding
Institutional Review Board Statement
Informed Consent Statement
Data Availability Statement
Conflicts of Interest
References
- O’Connor, D.B.; Thayer, J.F.; Vedhara, K. Stress and health: A review of psychobiological processes. Annu. Rev. Psychol. 2021, 72, 663–688. [Google Scholar] [CrossRef] [PubMed]
- Chauvet-Gelinier, J.-C.; Bonin, B. Stress, anxiety and depression in heart disease patients: A major challenge for cardiac rehabilitation. Ann. Phys. Rehabil. Med. 2017, 60, 6–12. [Google Scholar] [CrossRef]
- De Hert, M.; Detraux, J.; Vancampfort, D. The intriguing relationship between coronary heart disease and mental disorders. Dialogues Clin. Neurosci. 2018, 20, 31–40. [Google Scholar]
- Knol, L.L.; Brantley, C. Weight Status and Emotion-and Stress-Related Eating: Testing Constructs of the Transactional Model of Stress and Coping. Am. J. Health Educ. 2021, 52, 117–126. [Google Scholar] [CrossRef]
- Huang, L.; Wang, L.; Hu, X.; Chen, S.; Tao, Y.; Su, H.; Yang, J.; Xu, W.; Vedarethinam, V.; Wu, S.; et al. Machine learning of serum metabolic patterns encodes early-stage lung adenocarcinoma. Nat. Commun. 2020, 11, 1–11. [Google Scholar] [CrossRef] [PubMed]
- Li, R.; Zhou, Y.; Liu, C.; Pei, C.; Shu, W.; Zhang, C.; Liu, L.; Zhou, L.; Wan, J. Design of multi-shelled hollow Cr2O3 spheres for metabolic fingerprinting. Angew. Chem. 2021, 133, 12612–12620. [Google Scholar] [CrossRef]
- Jebelli, H.; Hwang, S.; Lee, S. EEG-based workers’ stress recognition at construction sites. Autom. Constr. 2018, 93, 315–324. [Google Scholar] [CrossRef]
- Orguc, S.; Khurana, H.S.; Stankovic, K.M.; Leel, H.S.; Chandrakasan, A.P. EMG-based real time facial gesture recognition for stress monitoring. In Proceedings of the 2018 40th Annual International Conference of the IEEE Engineering in Medicine and Biology Society (EMBC), Honolulu, HI, USA, 18–21 July 2018; IEEE: New York, NY, USA, 2018; Volume 257, pp. 2651–2654. [Google Scholar]
- Subhani, A.R.; Mumtaz, W.; Saad, M.N.B.M.; Kamel, N.; Malik, A.S. Machine learning framework for the detection of mental stress at multiple levels. IEEE Access 2017, 5, 13545–13556. [Google Scholar] [CrossRef]
- Prasanthi, T.L. Machine Learning-based Signal Processing by Physiological Signals Detection of Stress. Turk. J. Comput. Math. Educ. 2021, 11, 4831–4840. [Google Scholar]
- Liu, D.; Ulrich, M. Listen to your heart: Stress prediction using consumer heart rate sensors. Final. Proj. Standford CS 229 Mach. Learn. 2014, 229–233. [Google Scholar]
- Karthikeyan, P.; Murugappan, M.; Yaacob, S. ECG signals based mental stress assessment using wavelet transform. In Proceedings of the 2011 IEEE International Conference on Control System, Computing and Engineering, Penang, Malaysia, 25–27 November 2011; pp. 258–262. [Google Scholar]
- Ishaque, S. Physiological Signal Analysis and Classification of Stress from Virtual Reality Video Game. In Proceedings of the 2020 42nd Annual International Conference of the IEEE Engineering in Medicine & Biology Society, Montreal, QC, Canada, 20–24 July 2020; IEEE: New York, NY, USA, 2020; pp. 867–870. [Google Scholar]
- Jeroh, O.E.; Powers, L.S.; Roveda, J.M. Determination of stress in humans using data fusion of off-the-shelf wearable sensors data for electrocardiogram and galvanic skin response. J. Biomed. Sci. 2018, 7, 11–14. [Google Scholar] [CrossRef]
- Valentina, M.; Ganchev, T.; Kalinkov, K. Clas: A database for cognitive load, affect and stress recognition. In Proceedings of the 2019 International Conference on Biomedical Innovations and Applications, Varna, Bulgaria, 8–9 November 2019; IEEE: New York, NY, USA, 2019; pp. 1–4. [Google Scholar]
- Radhika, K.; Oruganti, V.R.M. Deep Multimodal Fusion for Subject-Independent Stress Detection. In Proceedings of the 2021 11th International Conference on Cloud Computing, Data Science & Engineering, Noida, India, 28–29 January 2021; IEEE: New York, NY, USA, 2021; pp. 105–109. [Google Scholar]
- Veselin, A.; Sivkov, Y.; Velikov, N. An approach of Feature extraction of ECG signal of CLAS database. In Proceedings of the 2020 International Conference on Biomedical Innovations and Applications, Varna, Bulgaria, 24–27 September 2020; IEEE: New York, NY, USA, 2021; pp. 93–96. [Google Scholar]
- Seok-Joo, Y.; Kim, G.-J. Personal Biometric Identification based on ECG Features. J. Korea Inst. Electron. Commun. Sci. 2015, 4, 521–526. [Google Scholar]
- Ravaja, N. Contributions of psychophysiology to media research: Review and recommendations. Media Psychol. 2004, 6, 193–235. [Google Scholar] [CrossRef]
- Dori, G.R.; Bitterman, H. ECG variability contour—A reference for evaluating the significance of amplitude ECG changes in two states. Physiol. Meas. 2008, 29, 989–997. [Google Scholar] [CrossRef] [PubMed]
- Gamal El Din Fathy, A. Respiratory Information Extraction from Electrocardiogram Signals. Master’s Thesis, King Abdullah University of Science and Technology, Thuwal, Kingdom of Saudi Arabia, December 2010. [Google Scholar]
- Zheng, B.S.; Murugappan, M.; Yaacob, S. FCM clustering of emotional stress using ECG features. In Proceedings of the 2013 International Conference on Communication and Signal Processing, Melmaruvathur, India, 3–5 April 2013; IEEE: New York, NY, USA, 2013; pp. 305–309. [Google Scholar]
- Karmakar, C.; Imam, M.H.; Khandoker, A.; Palaniswami, M. Influence of psychological stress on QT interval. In Proceedings of the Computing in Cardiology 2014, Cambridge, MA, USA, 7–10 September 2014; IEEE: New York, NY, USA, 2014; pp. 1009–1012. [Google Scholar]
- Manikandan, J.; Venkataramani, B. Design of a modified one-against-all SVM classifier. In Proceedings of the 2009 IEEE International Conference on Systems, Man and Cybernetics, San Antonio, TX, USA, 11–14 October 2009; IEEE: New York, NY, USA, 2009; pp. 1869–1874. [Google Scholar]
- Belousov, A.I.; Verzakov, S.A.; von Frese, J. A flexible classification approach with optimal generalisation performance: Support vector machines. Chemom. Intell. Lab. Syst. 2002, 1, 15–25. [Google Scholar] [CrossRef]
- Changki, L.; Jang, M.-G. Fast Training of Structured SVM Using Fixed-Threshold Sequential Minimal Optimization. ETRI J. 2009, 2, 121–128. [Google Scholar]
- Duan, Y. OAA-SVM-MS: A fast and efficient multi-class classification algorithm. Neurocomputing 2021, 454, 448–460. [Google Scholar] [CrossRef]
- Sharma, N.; Singh, M. Modifying Naive Bayes classifier for multinomial text classification. In Proceedings of the 2nd International Conference on Recent Advances and Innovations in Engineering (ICRAIE), Jaipur, India, 23–25 December 2016. [Google Scholar]
- Purbolaksono, M.D.; Widiastuti, K.C.; Mubarok, M.S.; Adiwijaya; Ma’Ruf, F.A. Implementation of mutual information and bayes theorem for classification microarray data. J. Phys. Conf. Ser. 2018, 1, 971. [Google Scholar] [CrossRef]
- Schneider, J.; Moore, A.W. Cross validation. In A Locally Weighted Learning Tutorial Using Vizier; Carnegie Mellon University: Pittsburgh, PA, USA, 1997; Volume 1. [Google Scholar]
- Ohsaki, M. Confusion-matrix-based kernel logistic regression for imbalanced data classification. Trans. Knowl. Data Eng. IEEE 2017, 29, 1806–1819. [Google Scholar] [CrossRef]
- Likun, X.; Malik, A.S.; Subhani, A.R. A physiological signal-based method for early mental-stress detection. Biomed. Signal Process. Control IEEE 2018, 46, 18–32. [Google Scholar]
- Bhanushali, S.P.; Sadasivuni, S.; Banerjee, I.; Sanyal, A. Digital Machine Learning Circuit for Real-Time Stress Detection from Wearable ECG Sensor. In Proceedings of the 2020 IEEE 63rd International Midwest Symposium on Circuits and Systems, Springfield, MA, USA, 9–12 August 2020; IEEE: New York, NY, USA, 2020; pp. 978–981. [Google Scholar]
- Janssens AC, J.; Martens, F.K. Reflection on modern methods: Revisiting the area under the ROC curve. Int. J. Epidemiol. 2020, 49, 1397–1403. [Google Scholar] [CrossRef] [PubMed]
- Zhang, P.; Li, F.; Zhao, R.; Zhou, R.; Du, L.; Zhao, Z.; Chen, X.; Fang, Z. Real-Time Psychological Stress Detection According to ECG Using Deep Learning. Appl. Sci. 2021, 9, 3838. [Google Scholar] [CrossRef]
- Zhang, P.; Li, F.; Zhao, R.; Zhou, R.; Du, L.; Zhao, Z.; Chen, X.; Fang, Z. Stress Classification of ECG-Derived HRV Features Extracted from Wearable Devices. Math. Comput. Sci. 2021, 21, 2873–2892. [Google Scholar]
- Castaldo, R.; Xu, W.; Melillo, P.; Pecchia, L.; Santamaria, L.; James, C. Detection of mental stress due to oral academic examination via ultra-short-term HRV analysis. In Proceedings of the 2016 38th Annual International Conference of the IEEE Engineering in Medicine and Biology Society (EMBC), Orlando, FL, USA, 16–20 August 2016; IEEE: New York, NY, USA, 2016; pp. 3805–3808. [Google Scholar]
- Cruz, A.P.; Pradeep, A.; Sivasankar, K.R.; Krishnaveni, K.S. A Decision Tree Optimised SVM Model for Stress Detection using Biosignals. In Proceedings of the 2020 International Conference on Communication and Signal Processing, Chennai, India, 28–30 July 2020; IEEE: New York, NY, USA, 2020; pp. 841–845. [Google Scholar]
- Naeem, M.; Asghar, S. A Parameter Free BBN Discriminant Function for Optimum Model Complexity versus Goodness of Data Fitting. J. Appl. Res. Technol. 2014, 12, 734–749. [Google Scholar] [CrossRef]


| Mean Value | R-S Peak (mv) | R-R Interval (s) | Q-T Interval (s) | |
|---|---|---|---|---|
| Method | ||||
| Picture Test | 1.4 mv | 0.88 s | 1.38 s | |
| Music video | 2.3 mv | 0.78 s | 1.24 s | |
| Stroop Test | 2.9 mv | 0.68 s | 1.09 s | |
| Math Test | 3.7 mv | 0.61 s | 0.9 s | |
| Feature Value | Stress Level | R-S Peak (mv) | R-R Interval (s) | Q-T interval (s) | |
|---|---|---|---|---|---|
| Method | |||||
| Picture Test | 1–1.9 | 0–1.69 | 0.85–0.95 | 1.3–1.44 | |
| Music video | 2–2.9 | 1.7–2.5 | 0.76–0.849 | 1.191–1.29 | |
| Stroop Test | 3–3.9 | 2.51–3.3 | 0.65–0.759 | 0.981–1.19 | |
| Math Test | 4–4.9 | 3.31–4 | 0.57–0.649 | 0.85–0.98 | |
| Model | R-S Peak (mv) | R-R Interval (s) | Q-T Interval (s) | Mean | ||||||||
|---|---|---|---|---|---|---|---|---|---|---|---|---|
| AC (%) | AP (%) | AR (%) | AC (%) | AP (%) | AR (%) | AC (%) | AP (%) | AR (%) | AC (%) | AP (%) | AR (%) | |
| SVM | 97.6 | 96 | 95.4 | 94.4 | 93 | 92.8 | 96.8 | 95.4 | 94.4 | 96.3 | 94.8 | 94.2 |
| NB | 96.8 | 95.7 | 94.1 | 93.5 | 92.8 | 92.2 | 95.2 | 94.8 | 93.6 | 95.2 | 94.3 | 92.3 |
| SVM and NB | 98.4 | 98.2 | 98.1 | 96.8 | 96.7 | 96.7 | 97.6 | 97.5 | 97.3 | 97.6 | 97.5 | 97.4 |
| AUC (ROC Curve) | R-S Peak (mv) | R-R Interval (s) | Q-T Interval (s) | Mean AUC (%) |
|---|---|---|---|---|
| SVM | 97.5% | 96.8% | 96.2% | 96.8% |
| NB | 96.2% | 95.1% | 94.9% | 95.4% |
| SVM and NB | 98.2% | 98% | 97.6% | 97.9% |
| CNN-LSTM (Zhang, et al. 2021 [35]) | - | 87% | - | 87% |
| RF, SVM, MLP, KNN (Dalmeida, et al. 2021 [36]) | - | (avg.) 83.25% | - | (avg.) 83.25% |
| MLP, NB, SVM (Castaldo, et al. 2016 [37]) | - | (avg.) 70% | (avg.) 70% |
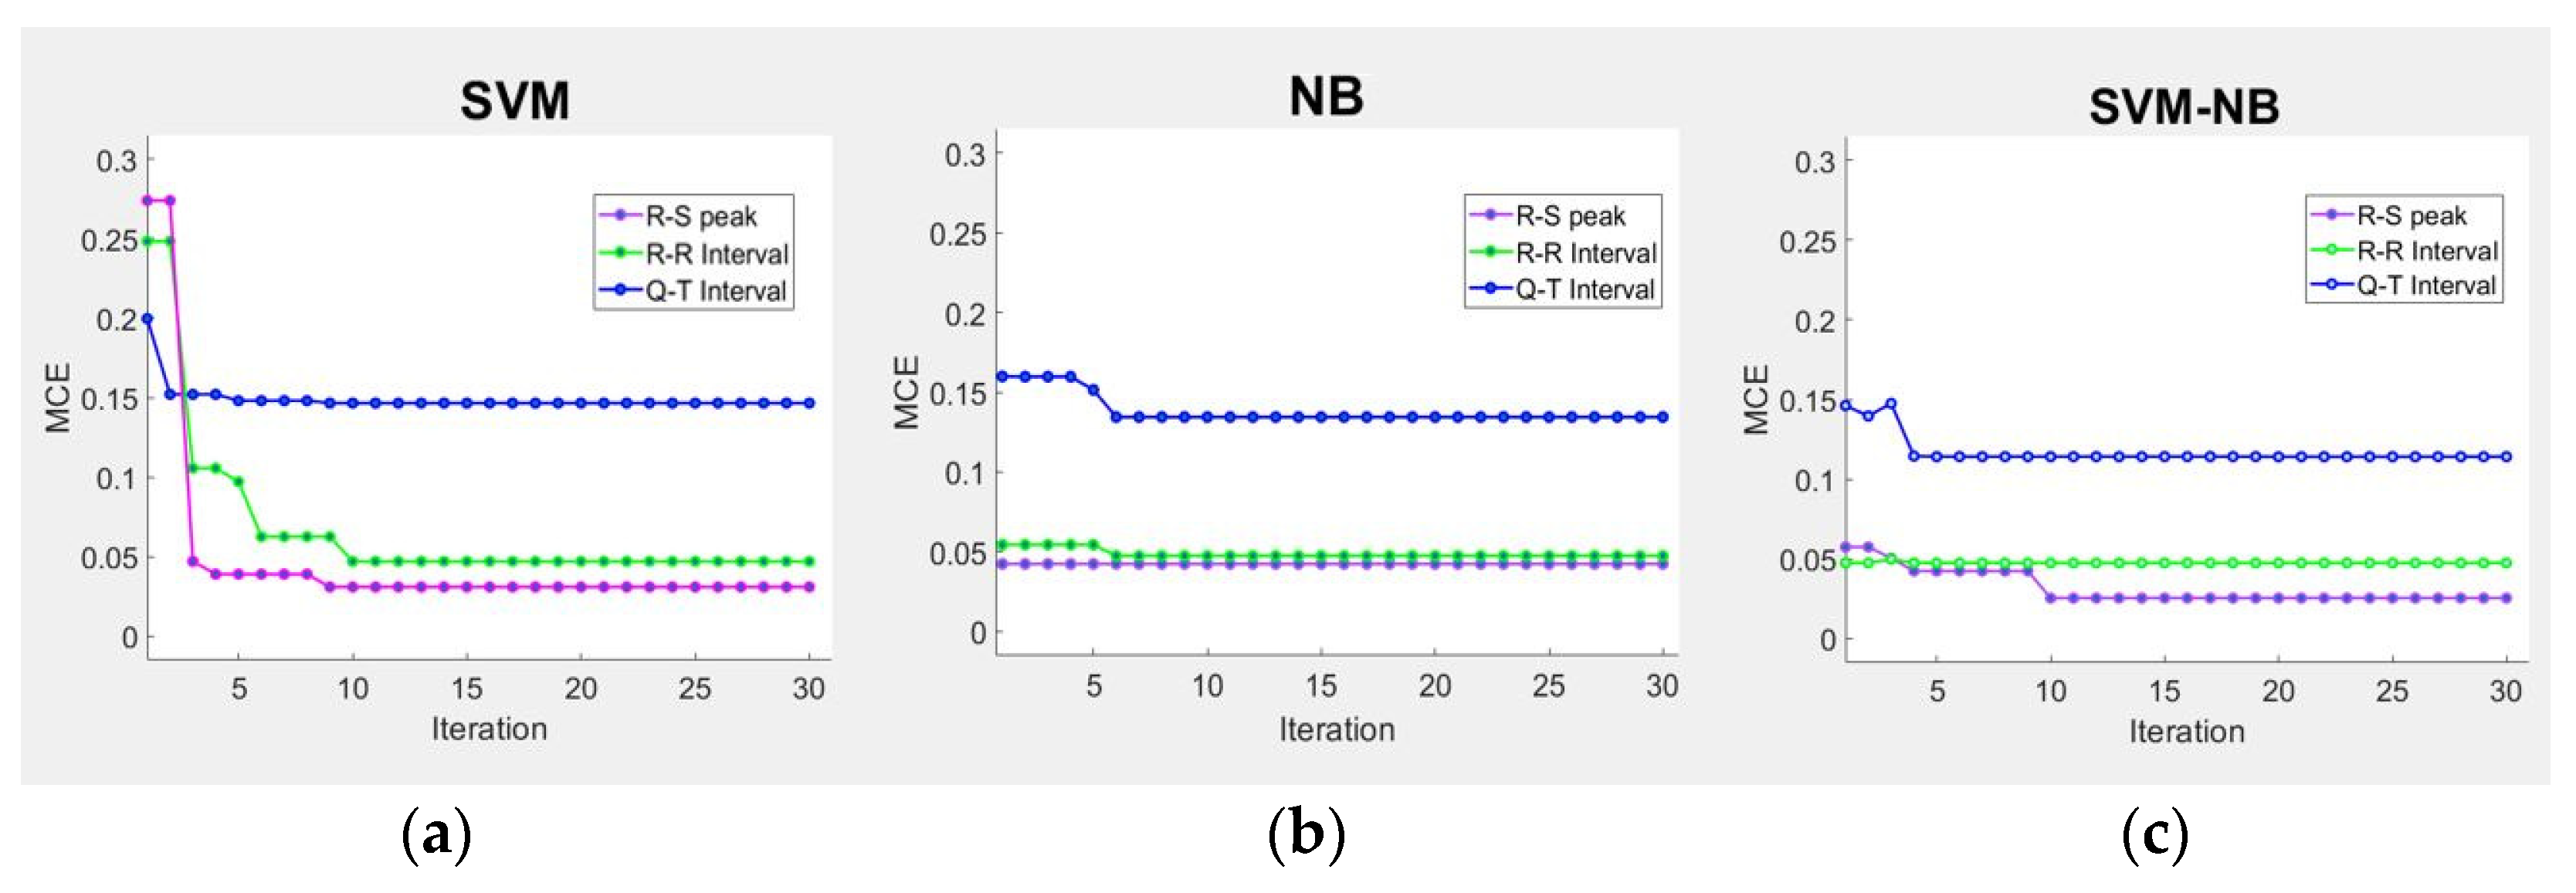
| Model | MCE (%) | Elapsed Time (s) | MCE (%) | Elapsed Time (s) | MCE (%) | Elapsed Time (s) | MCE (%) | Elapsed Time (s) |
|---|---|---|---|---|---|---|---|---|
| SVM | 0.034 | 86.26 | 0.052 | 81.48 | 0.114 | 78.84 | 0.066 | 82.19 |
| NB | 0.042 | 98.65 | 0.067 | 97.16 | 0.133 | 96.54 | 0.080 | 97.45 |
| SVM and NB | 0.024 | 68.89 | 0.041 | 69.19 | 0.097 | 61.92 | 0.054 | 66.66 |
| MLP, RF, GB (Dameida, et al) | - | - | (avg.) 0.092 | - | - | - | (avg.) 0.092 | - |
| Stress Classification | Mean Accuracy (%) | p-Value (%) |
|---|---|---|
| SVM | 96.3 | 0.094 |
| NB | 95.2 | 0.065 |
| SVM and NB | 97.6 | 0.032 |
Publisher’s Note: MDPI stays neutral with regard to jurisdictional claims in published maps and institutional affiliations. |
© 2021 by the authors. Licensee MDPI, Basel, Switzerland. This article is an open access article distributed under the terms and conditions of the Creative Commons Attribution (CC BY) license (https://creativecommons.org/licenses/by/4.0/).
Share and Cite
Kang, M.; Shin, S.; Zhang, G.; Jung, J.; Kim, Y.T. Mental Stress Classification Based on a Support Vector Machine and Naive Bayes Using Electrocardiogram Signals. Sensors 2021, 21, 7916. https://doi.org/10.3390/s21237916
Kang M, Shin S, Zhang G, Jung J, Kim YT. Mental Stress Classification Based on a Support Vector Machine and Naive Bayes Using Electrocardiogram Signals. Sensors. 2021; 21(23):7916. https://doi.org/10.3390/s21237916
Chicago/Turabian StyleKang, Mingu, Siho Shin, Gengjia Zhang, Jaehyo Jung, and Youn Tae Kim. 2021. "Mental Stress Classification Based on a Support Vector Machine and Naive Bayes Using Electrocardiogram Signals" Sensors 21, no. 23: 7916. https://doi.org/10.3390/s21237916
APA StyleKang, M., Shin, S., Zhang, G., Jung, J., & Kim, Y. T. (2021). Mental Stress Classification Based on a Support Vector Machine and Naive Bayes Using Electrocardiogram Signals. Sensors, 21(23), 7916. https://doi.org/10.3390/s21237916