1. Introduction
Internet of Things (IoT) technology enables the integration of wearable and mobile devices to gather historical data from users. Personalized services are designed based on this data to contribute to people’s well-being and quality of life [
1,
2]. Researchers, in recognition of emotional patterns, find the physiological data of people that is relevant in their daily lives. These devices become a ubiquitous source for providing this data [
3]. Emotional detection can be applied in various contexts, including tourism, to improve the tourist experience at destinations [
4,
5].
On the other hand, tourist expectations from a temporal perspective are analyzed in three phases: before, during, and after the tourist visit [
6,
7]. This study focuses on the preliminary phase of the visit, which detects the affective condition of people as a contextual factor of a recommender system. To this end, the World Tourism Organization highlights that the tourism industry is more competitive when receptive tourists are more inclined to the emotional benefits than to the physical features and cost of the destination [
8].
Preliminarily, the literature review was conducted to identify the components of the emotion-based tourism recommender frameworks [
9]. This study showed the gap in integrating physiological data from wearable sensors to detect the affective condition of the user as a relevant contextual factor in the satisfaction of the recommendation. The analyzed approaches mainly considered sentiment analysis techniques to detect emotional states from the social networks reviews. Moreover, these models did not consider low-cost wearables to discover emotional patterns in the user’s daily life.
In this review of the state-of-the-art, it was also found that there is a disparity of formats, emotional states, and physiological signals in the datasets. Wearables of a different range were also used, mainly medium and high-end. Most of these studies took biosignal measurements in controlled experiments [
9,
10,
11,
12,
13]. As wristbands evolve, they integrate more sensors and with better accuracy. The most common sensors measure heart rate (HR), Galvanic Skin Response (GSR), and temperature. In the context of tourism, the most common wearables are those that are affordable and non-intrusive. Therefore, in this study, the wearable Xiaomi Mi Band was chosen because it is cheap, includes basic physiological sensors, is comfortable, and is easy to use.
One of the research challenges of this study was detecting changes in people’s emotional states in natural and uncontrolled conditions, using wearables with low accuracy in their measurements. To do this, we developed a mobile application to record emotions, independent of the HR record. As a result of this double registration, creating a time series synchronization algorithm called the adjustable and sliding window became necessary.
There are different types of emotions, and therefore their duration and intensity are varied. Norman’s model [
14] describes three levels of brain processing to explain the distinct emotional reactions that a person experiences: visceral, behavioral, and reflective. Each person interprets their emotional response according to their identity, culture, personality, and context. Therefore, the automatic detection of emotional states in a time series of physiological measurements became another challenge for this research. In this way, another algorithm was proposed to detect emotional states, known as Emotional Slicing (ES). This algorithm groups HR instances into a time slot to which it assigns an emotional label.
In the previous study of emotional detection on the AMIGOS dataset [
15], Convolutional Neural Networks (CNN) [
16] were used. Now, in this study, a hybrid Deep Learning (DL) algorithm from CNN and Long Short-Term Memory (LSTM) networks [
17,
18,
19] was implemented for Emotion Recognition (ER) from the ES dataset.
Once the emotion was detected, the Tourist Experience Recommendation System based on the ER (TERS-ER) was developed as the last phase of this study. An interface was designed with the Tourist Traceability Ontology (OntoTouTra) [
20] to get the contextual data.
In addition, for the TERS engine, two approaches to Content-Based Filtering (CBF) [
21,
22] and Collaborative Filtering (CF) based on CNN [
2,
9,
23] were designed to generate the top-N list of Tourist Experiences (TE) recommendations. The TERS engine integrated a user similarity algorithm, selecting candidate users from the ontology based on the profile and contextual data of the wearable user.
This document is organized as follows:
Section 2 describes the background to this study and discusses related papers.
Section 3 defines the method used for this study. Then
Section 4 describes the TERS-ER architecture and its components. Later,
Section 5 outlines the TERS-ER performance evaluation and validation. Finally,
Section 6 presents the discussion of the results, conclusions, and future work.
3. Materials and Methods
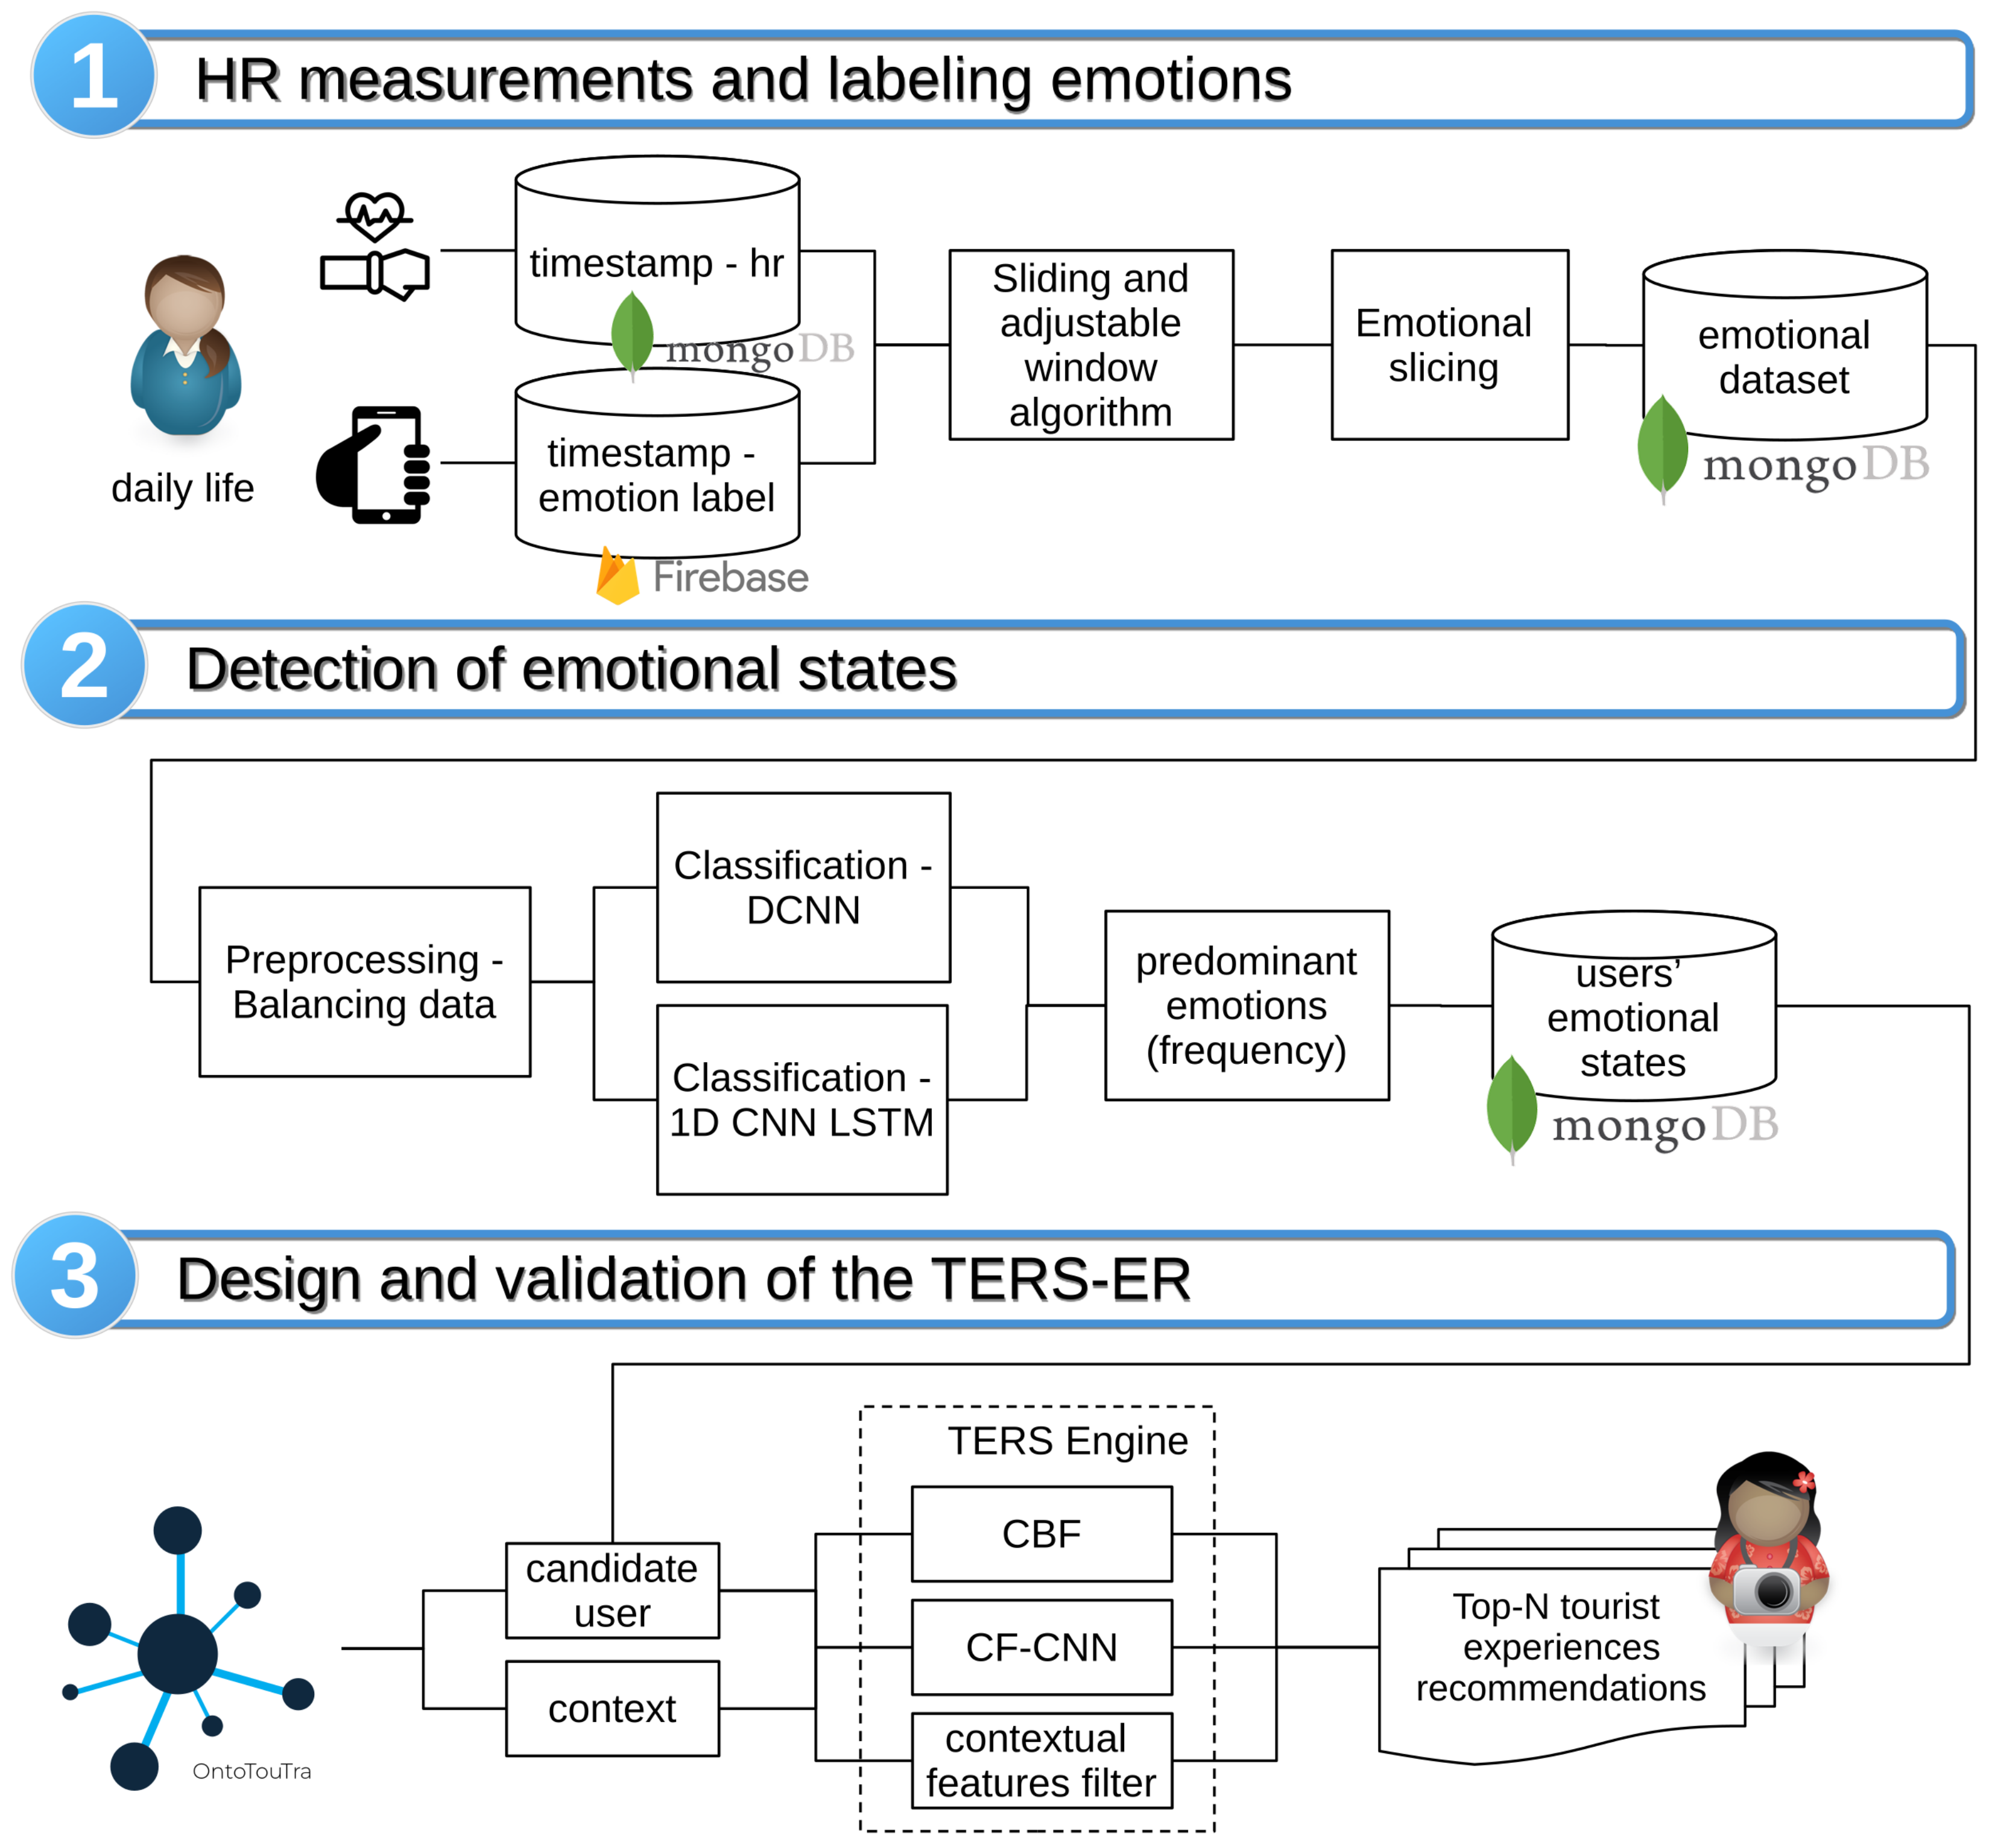
The general process of the methodology used is depicted in
Figure 1, which comprises three phases: HR measurements and emotion labeling, detection of emotional states, and TERS-ER design and validation.
3.1. HR Measurement and Labeling Emotions
The purpose of this phase was to create an emotional dataset. This dataset is a time series of HR measurements tagged with the emotion felt by the wearable user. The HR register is an objective response to the elicitation of the perceived stimulus in the context, while the emotion register is a subjective response.
As in the similar experiments described in
Section 2.2.1, a group of 18 participants was formed, nine men and nine women, whose ages ranged from 18 to 44 years. However, unlike the related work experiments, the study was carried out in contexts outside a laboratory, in the participants’ daily lives. However, three group sessions of controlled elicitation of emotions were programmed to verify the correct recording of the measurements. Each participant was given a Xiaomi Mi Band wristband, and two applications were installed on their mobile device: Master For mi Band (MFB) [
45] and MyEmotionBand (MEB). The first app recorded heart rate measurements. The second app was developed in this study to record the person’s emotional states, activities, and location. Before starting the experiment, a group of healthcare professionals assessed the physical and emotional state of the participants. Once the group of participants knew the purpose and procedure of the investigation, they signed the consent for participation. The duration of the experiment was eleven weeks. Short videos were projected for the three group sessions: 19, 19, and 11 videos, respectively. These videos were chosen from the FilmStim repository [
46] according to the emotional elicitation of the four AV quadrants [
24].
As a result of registering HR measurements, a dataset was created in MongoDB, and from registering the labels, another dataset was created in Firebase. Later, both datasets were synchronized so that the time series coincided with labeling the HR measurements with emotions. For this, Algorithm 1 was developed. Then it was necessary to determine the duration of emotional states [
14] using Algorithm 2. Once both algorithms were executed, the emotional dataset was created.
| Algorithm 1. Sliding and adjustable window for the time series data tagging. |
- 1:
proceduregetTagDataset - 2:
- 3:
for k, v in do - 4:
- 5:
for , in do - 6:
- 7:
for , in do - 8:
if = k then - 9:
for , in do - 10:
while ≤ do - 11:
= − - 12:
= + - 13:
- 14:
for in do - 15:
if ≤ ≤ then - 16:
- 17:
- 18:
break; - 19:
end if - 20:
end for - 21:
if = True then - 22:
break; - 23:
else - 24:
- 25:
end if - 26:
= - 27:
end while - 28:
end for - 29:
end if - 30:
end for - 31:
end for - 32:
- 33:
end for - 34:
end procedure
|
| Algorithm 2. Emotional slicing. |
- 1:
procedurebuildSlices - 2:
; ; ; - 3:
- 4:
- 5:
- 6:
- 7:
for in do - 8:
- 9:
- 10:
if = then - 11:
if − ≤ then - 12:
if then - 13:
if ≠ then - 14:
- 15:
end if - 16:
- 17:
else - 18:
- 19:
end if - 20:
else - 21:
- 22:
- 23:
end if - 24:
else - 25:
- 26:
- 27:
end if - 28:
end for - 29:
end procedure
|
3.2. Detection of Emotional States
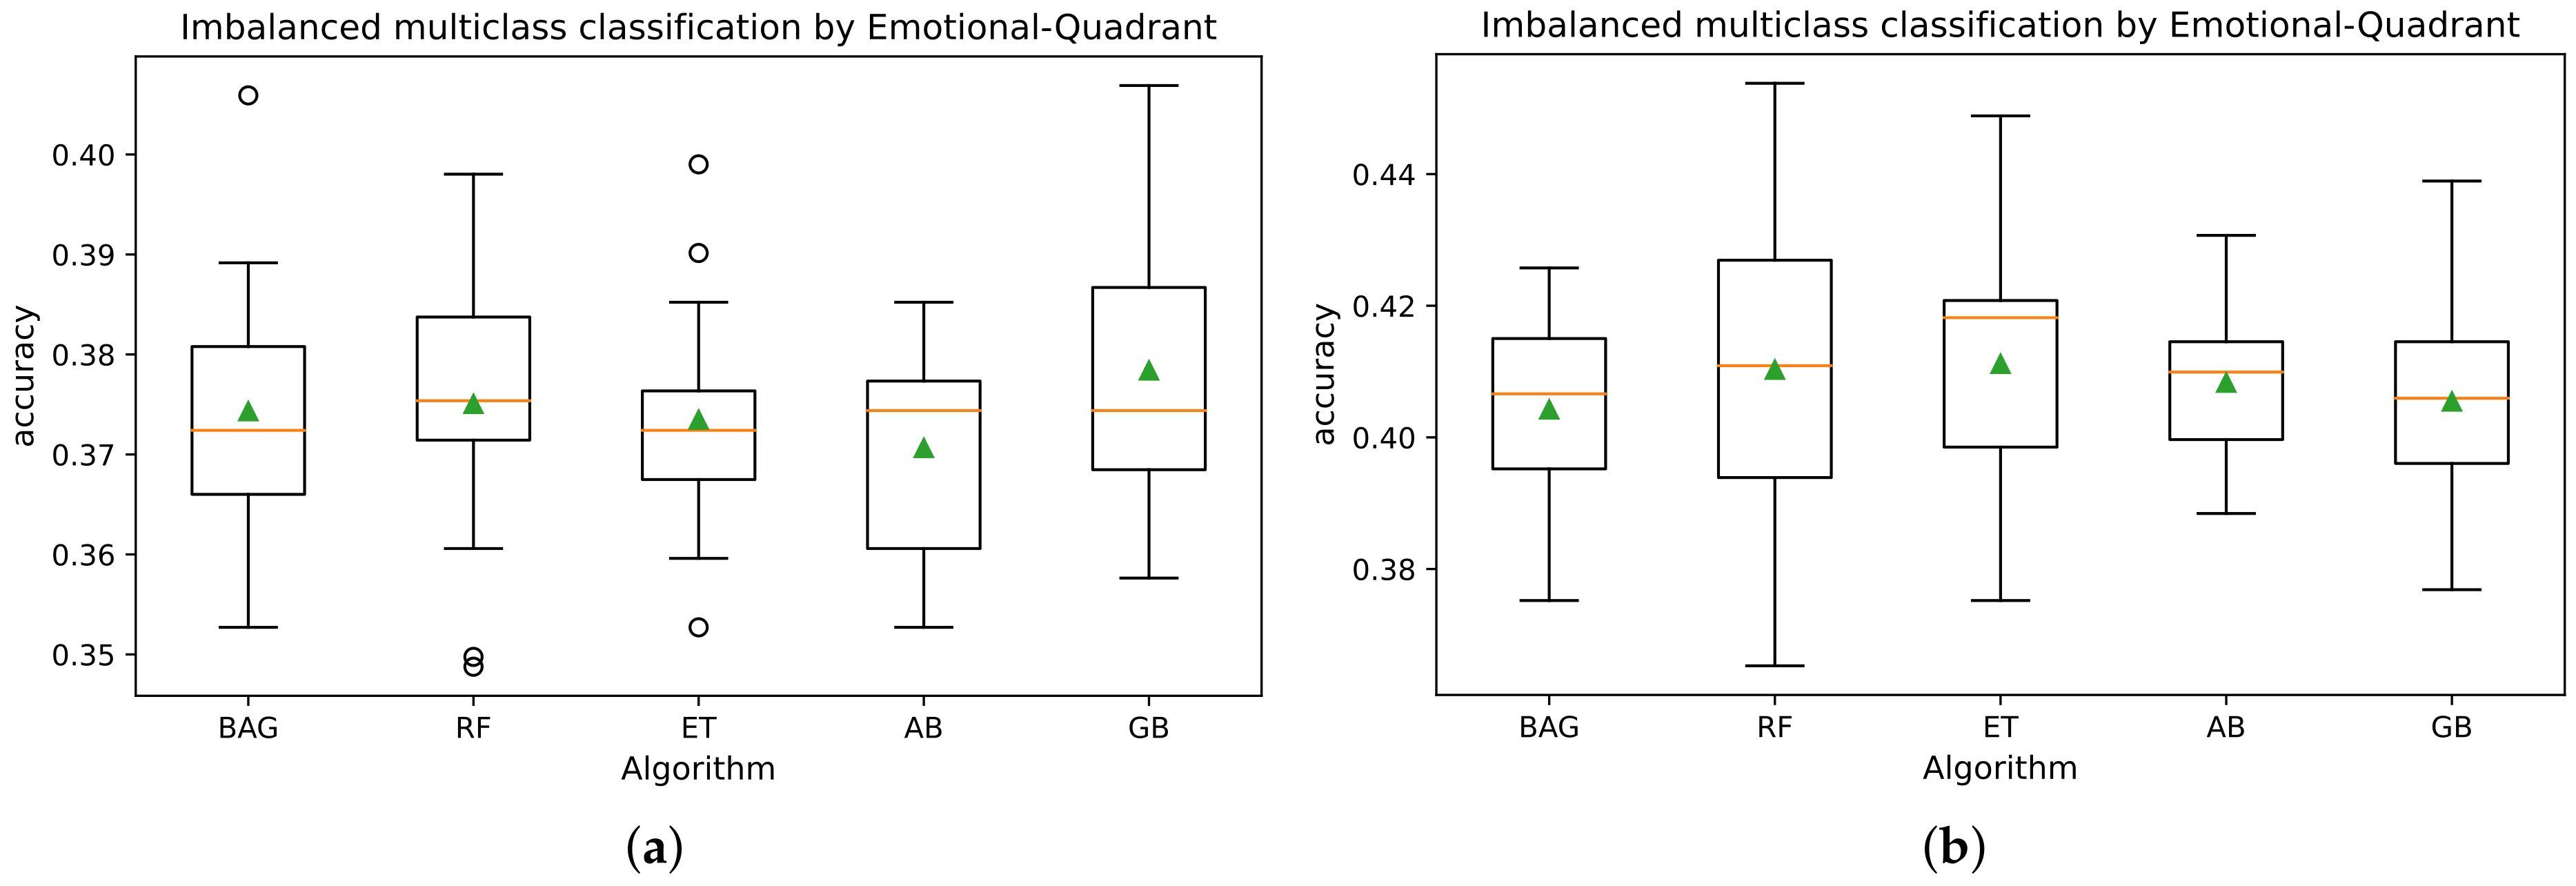
In IoT environments, the collection of user datasets can lead to multi-class imbalance, which affects the efficiency and performance of the prediction models. The consolidated dataset in this study presented an unequal distribution in the emotion classes (see
Figure 2b) because the participants showed different affective behaviors in their contexts. Likewise, the participants were predisposed to the affective states of pleased, calm, tired, and glad. In contrast to the lower emotional classes of HR records (embarrassed, alarmed, and depressed). In
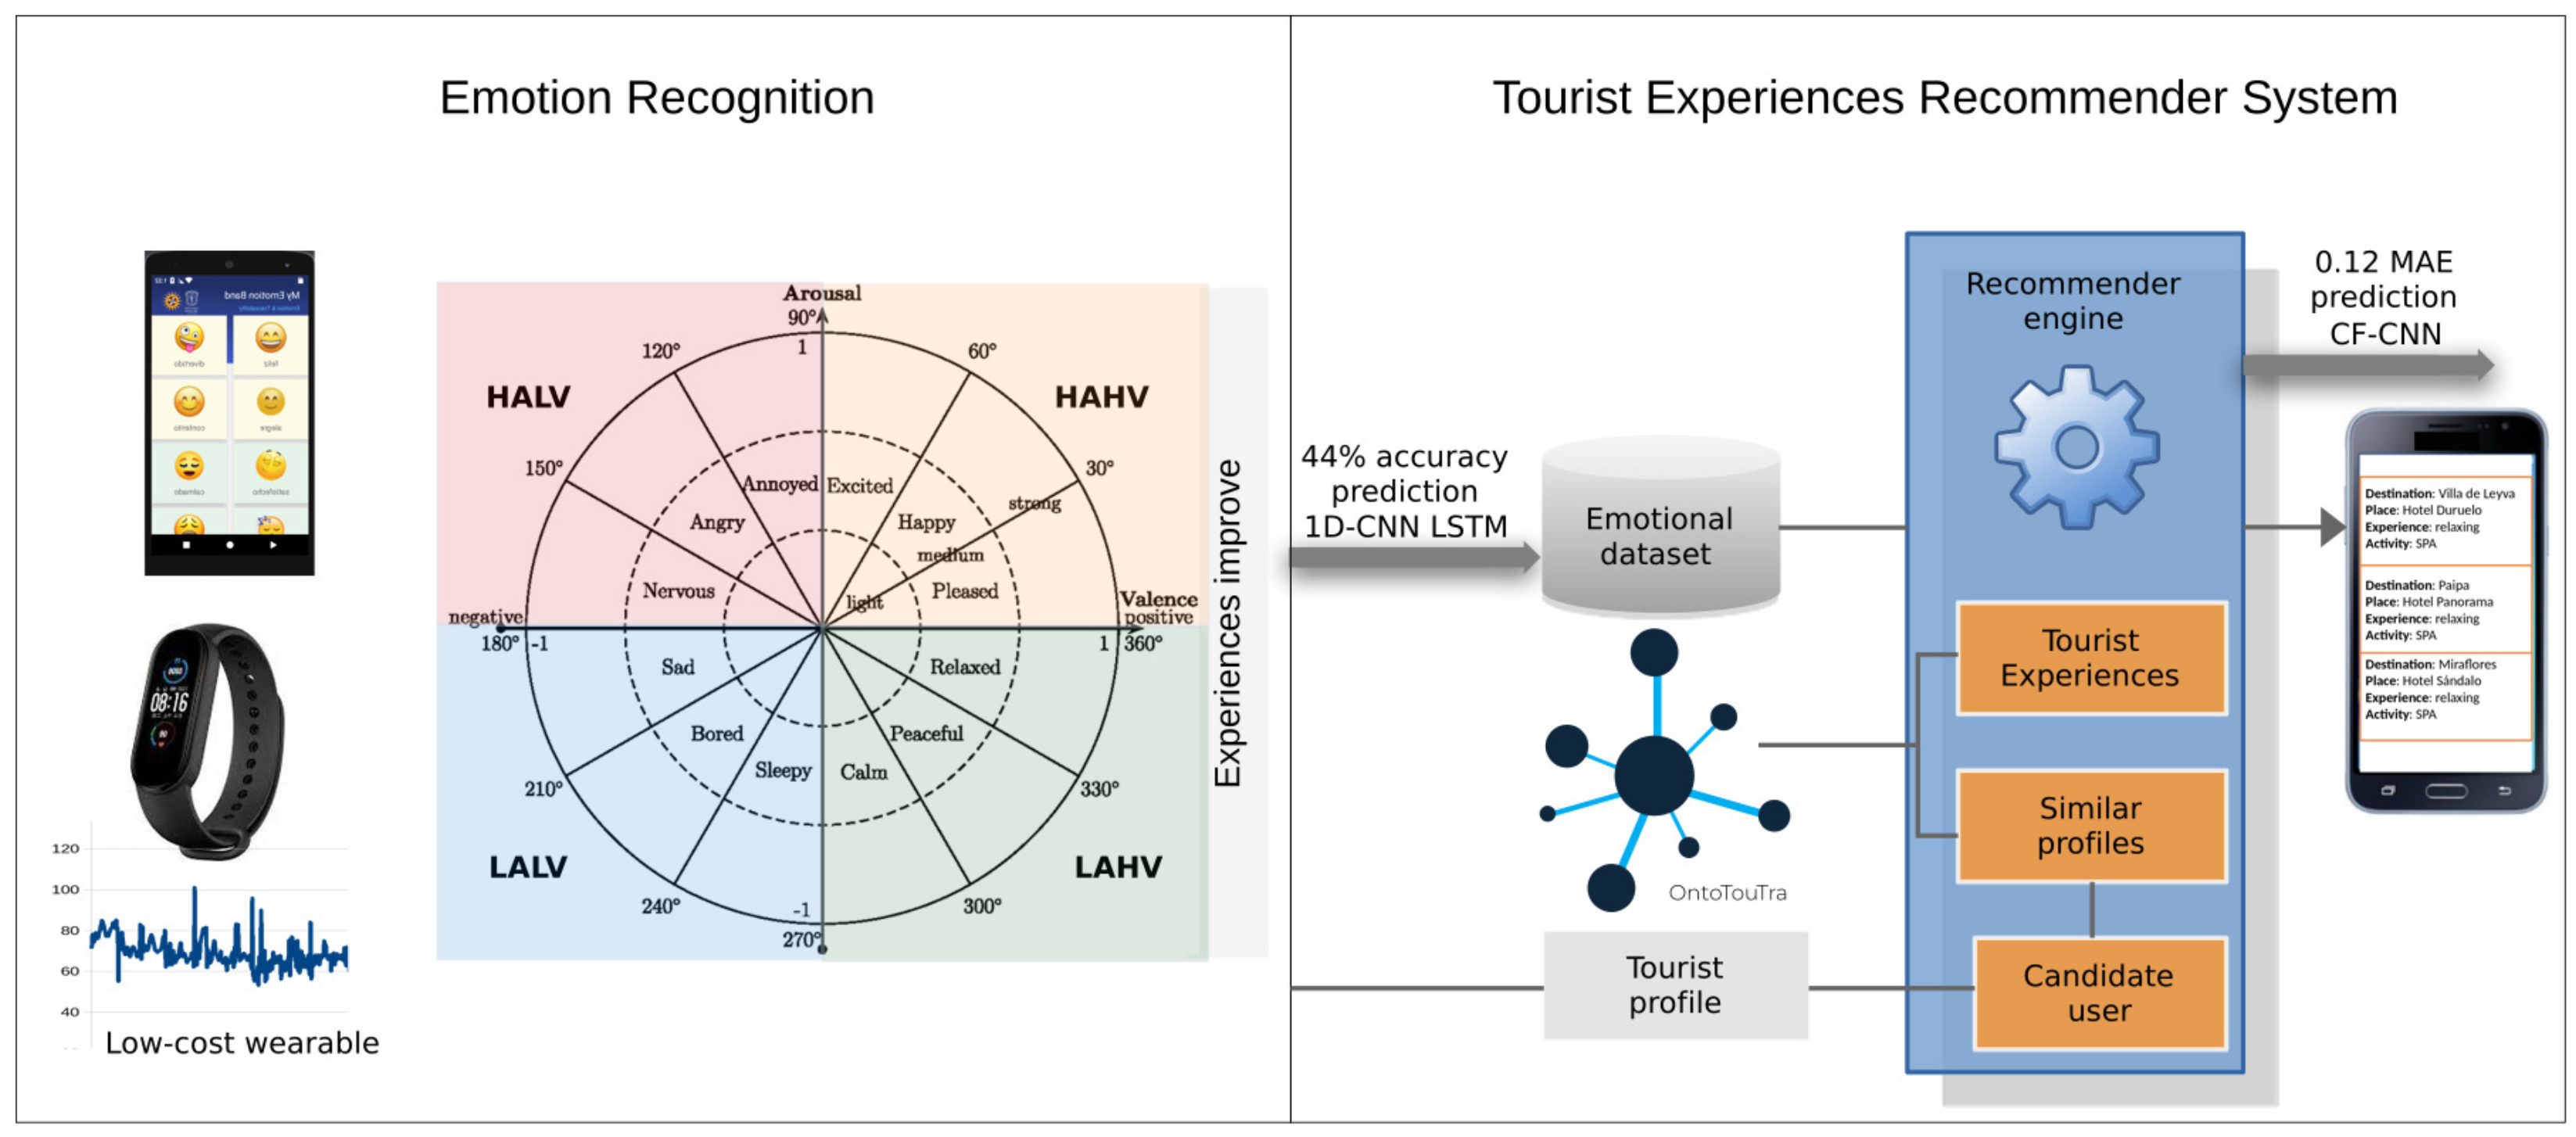
Figure 2a, this same distribution was confirmed for the positive emotion quadrants (HVHA and HVLA) compared to the negative emotion quadrants (LVHA, LVLA).
For this purpose, some studies have used heuristic sampling methods and oversampling techniques for the Multi-class Imbalanced Classification (MIC) using neural networks [
47,
48,
49]. These sampling techniques are based on the nearest neighbor rule of the feature space of each class [
49,
50]. For the above, the data balancing component sizes the dataset and adjusts the label names by quadrants or emotional states. It also uses class balancing methods to evaluate the performance of affective detection models. That is, the dataset is transformed with the ES instance interpolation methods in the minority classes [
51] with the Synthetic Minority Oversampling Technique approaches with K-means (K-SMOTE) [
49,
52] and TomekLinks (TL) [
50]. Subsequently, the combined techniques (K-SMOTE + TL) and oversampling (K-SMOTE) were implemented separately to process the dataset in training [
51].
Once the emotional dataset had been balanced, a CNN and LSTM networks hybrid model was used to detect emotion. This model was chosen because it better classified the shallow algorithms’ emotional quadrants (happy, calm, sad, and angry).
An algorithm was designed to determine the predominant emotional state that defined the frequency of the emotion felt by the participants. The results of the execution of this algorithm were stored in a MongoDB collection.
3.3. Design and Validation
This phase corresponds to the moment that the wearable device user plans their next TE. The emotional dataset has already been collected, and the predominant emotion of the user has been calculated. So, a TERS is needed that recommends TE according to the person’s emotional state, context, and profile. Therefore, as input sources, the TERS needs the emotional dataset, and concerning the other two requirements, a knowledge base in tourism is used. For this study, OntoTouTra was used.
Initially, similar features were selected among users of the tourist review dataset. To know the profiles of the participants of the experiment, they, in advance, completed a survey with their profile data and TE preferences. With the data from these profiles, similar users were filtered using NLP techniques applied to the username in the ontology to determine its gender. Features of the ontology such as country, ratings, TE, and location were also extracted. The location was compared with the geographic coordinates obtained in the emotional dataset. Then, the similarity was calculated using the Cosine Similarity (CS) metric. In this way, the candidate users were obtained from OntoTouTra.
Two approaches were developed for the TERS engine: A CBF method that determines the similarity between tourist destinations and the other CF-CNN method to relate user preferences. These classification methods processed the filtered information from the destination dataset and extracted the most relevant TE items for the recommendation process. Finally, the list of recommended TE was generated based on the target user’s profile, preferences, context, and emotions.
The following categories of TE [
53,
54,
55] were established:
Adventure: defines experiences of risky activities such as scuba diving, waterskiing, horse riding, and canoeing.
Ecological: relates experiences of contact with nature such as hiking, ecological walks, and bicycle tours.
Entertainment: involves experiences of fun attractions such as movie theaters, theme parks, live music, and sports shows.
Family: promotes experiences of strengthening relationships between parents and children through attractions on the beach, in the pool, family and children’s games.
Fitness: promotes wellness experiences and physical activities such as aerobics, gym routine, personal training, and dance.
Heritage/Culture: promotes experiences of authentic activities such as visits to museums, archaeological sites, and typical food festivals.
Romantic: involves couples’ romance experiences such as themed dinners, fun in nightclubs and bars.
Relaxation: involves health care experiences and relaxation activities such as spa, hydrotherapy, sauna, yoga, among others.
The distribution analysis of affective states showed a high rate of participants who registered positive emotions in contrast to negative ones (see
Figure 2a). This study assumed that the TE recommendations that people seek are strongly related to increased satisfaction and improving their experiences at destinations [
5,
6,
7]. For this reason, if the detected emotion was negative (sad: LVLA quadrant or anger: LVHA quadrant) or positive (happy: HVHA or calm: HVLA emotional quadrant), the recommender emphasizes positive emotions and mitigates negative ones. For instance, the suggestion for a person who was stressed is the relaxation experience. At the same time, the recommendation for someone calm may be the ecological experience. In this sense, the relationship of emotions with the categories of TE was:
Happy (HVHA) or sad (LVLA): encourages adventure, family, romantic, and heritage/culture experiences.
Calm (HVLA) or angry (LVHA): promotes ecological, entertainment, fitness, and relaxation experiences.
4. System Architecture
This section describes the operational and structural levels of detail of the TERS-ER architecture. For this purpose, the functional modules, data models, user profiles, and services represented in the context diagrams, containers, components, and classes were identified [
56]. Also, according to the IoT architecture [
2,
19], the TERS-ER layers are:
The perception layer: It is responsible for collecting HR data using the PPG sensor of the wearable and the emotion and context data from the MEB app installed on smartphones
The network layer: Transfers HR measurement data using the Bluetooth connection between the wearable and the mobile device. In addition, the smartphone using mobile networks for transferring the emotion and location data of the MyEmotionBand app to the Firebase cloud.
The service layer: Provides the connections to the Firebase cloud to get the emotion data, the MongoDB server to obtain the HR collections, and the SPARQL endpoint server to retrieve the tourism knowledge base. These datasets are then pre-processed and filtered for the TERS-ER subsystems.
The application layer: Manages an intelligent RS that displays TE suggestions according to the user’s preferences and contextual factors.
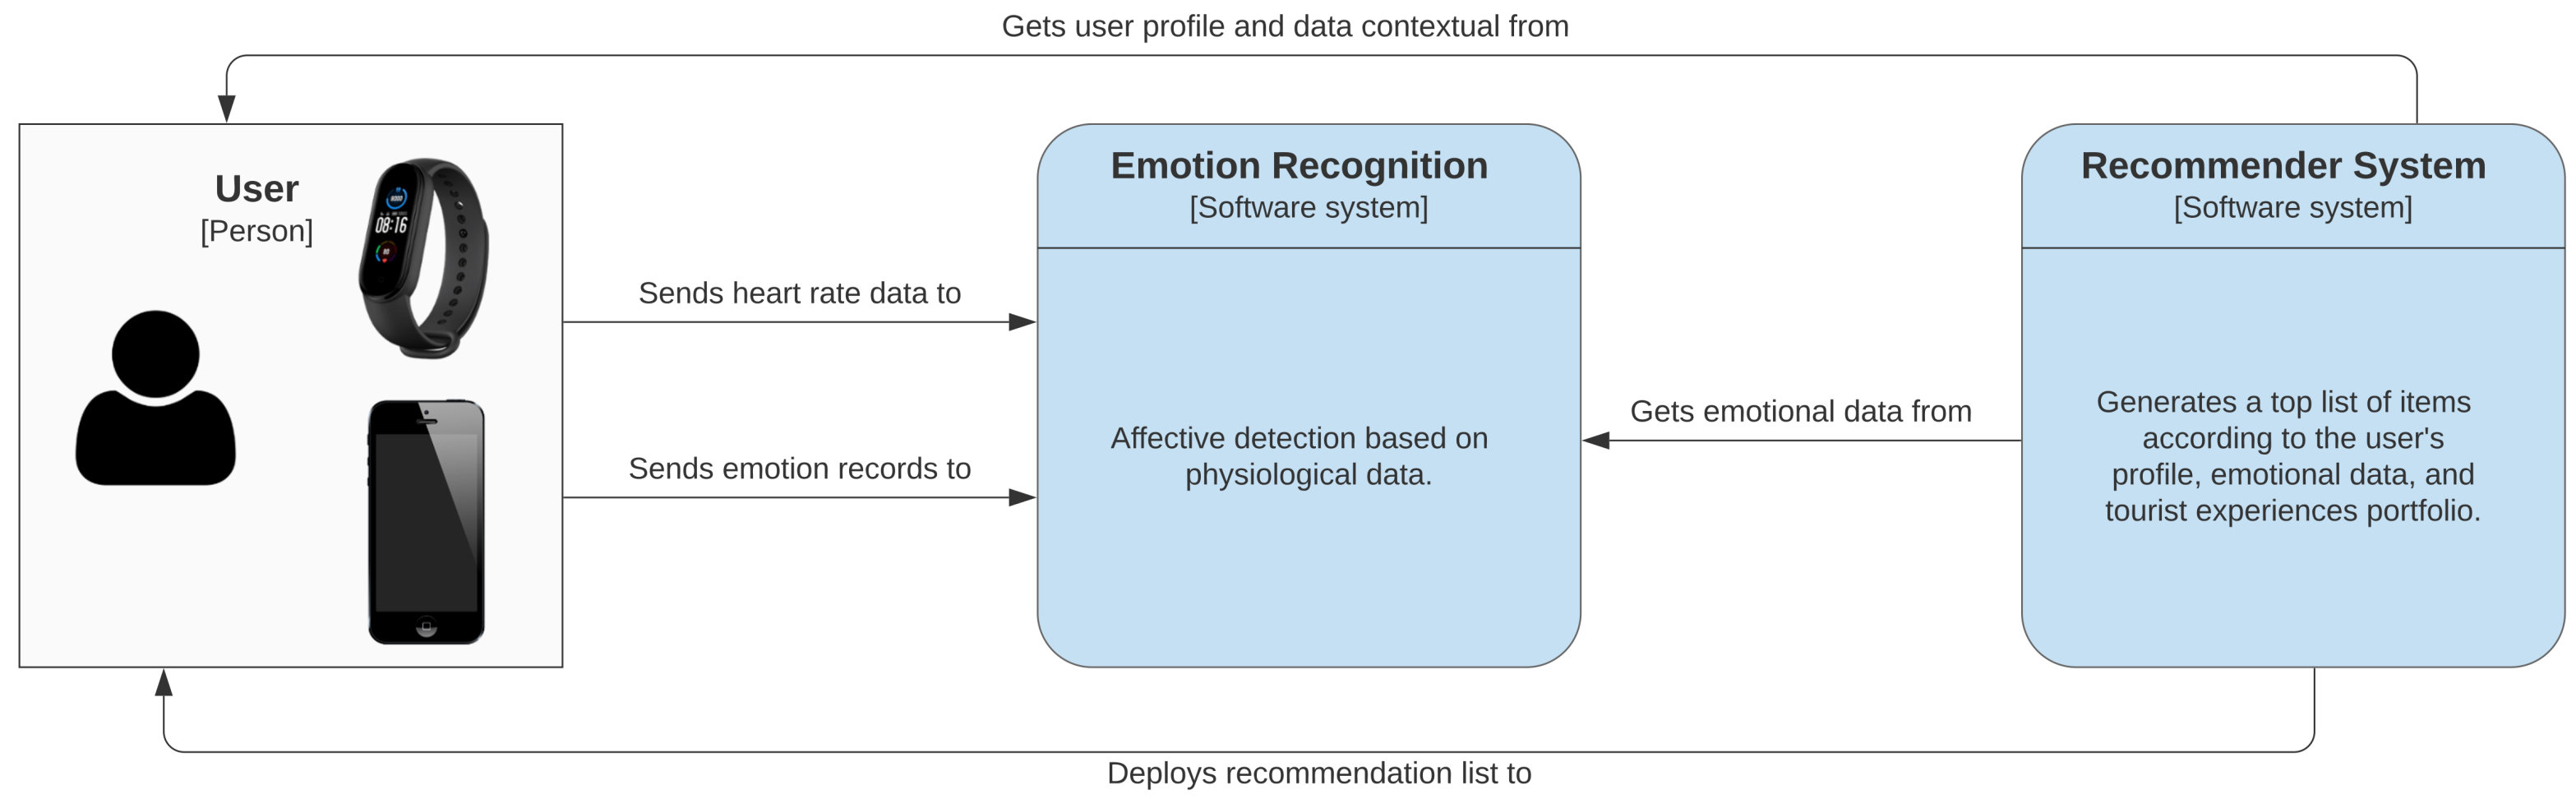
4.1. System Context
How satisfying is a particular tourist experience for a person? It depends mainly on the reason for the tourist visit. Often a person looks for options according to information from travel agencies, suggestions from friends, cost of the plans, or the desire to know new destinations. However, the emotional burden that the person manifested before the visit is seldom taken into account. Specifically, to understand the emotional state in a period before the tourist visit, wearable devices are an exciting alternative for capturing physiological and context data. In this way, with the processing of these data, the user’s emotions can be recognized and therefore recommend the appropriate tourist experiences to their affective state. The research question arises: How to design a TERS based on the wearable users’ emotional state in the preliminary visit phase?
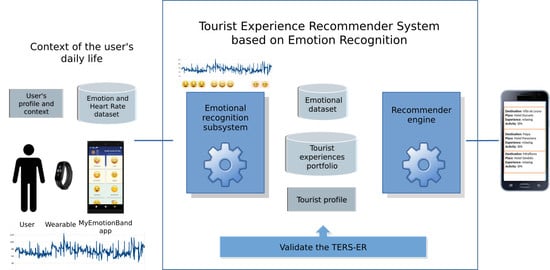
Before the visit that can measure in days or weeks, a person in their daily life uses the wristband and mobile devices to record physiological and affective data. In this scenario (see
Figure 3), a user, depending on the activity type, (for instance, working, watching movies, resting, traveling, driving, among others) can experience an emotional change caused by various stimuli from the context. Then, through mobile applications, the user can measure HR and record the emotion perceived at that moment (happy, content, sad, calm, angry, and stressed). Afterward, the data from the objective and subjective measurements are processed and analyzed by machine learning (ML) algorithms that detect the person’s affective state.
The recommender system uses the user’s profile (gender and tourist preferences), emotional data, location, and TE portfolio as input items to display destination suggestions. The recommendation list is created from similarity metrics and ML algorithms. Subsequently, the user checks the recommendations of TE according to their emotional state, profile, and preferences.
4.2. TERS-ER Architecture
The TERS-ER architecture has two main subsystems. The first is the ER built with the following components: data collection, preprocessing, ES analysis, emotion class balancing, and affective detection using DNN models. The second is TERS, which is implemented with the dataset management components and the recommender engine. This recommender generates the most relevant TE according to the preferences, location, and user emotion in a period before the tourist visit.
Figure 4 summarizes the model, and it shows the integration of the subsystems of the TERS-ER architecture.
4.3. Technological Container Communication
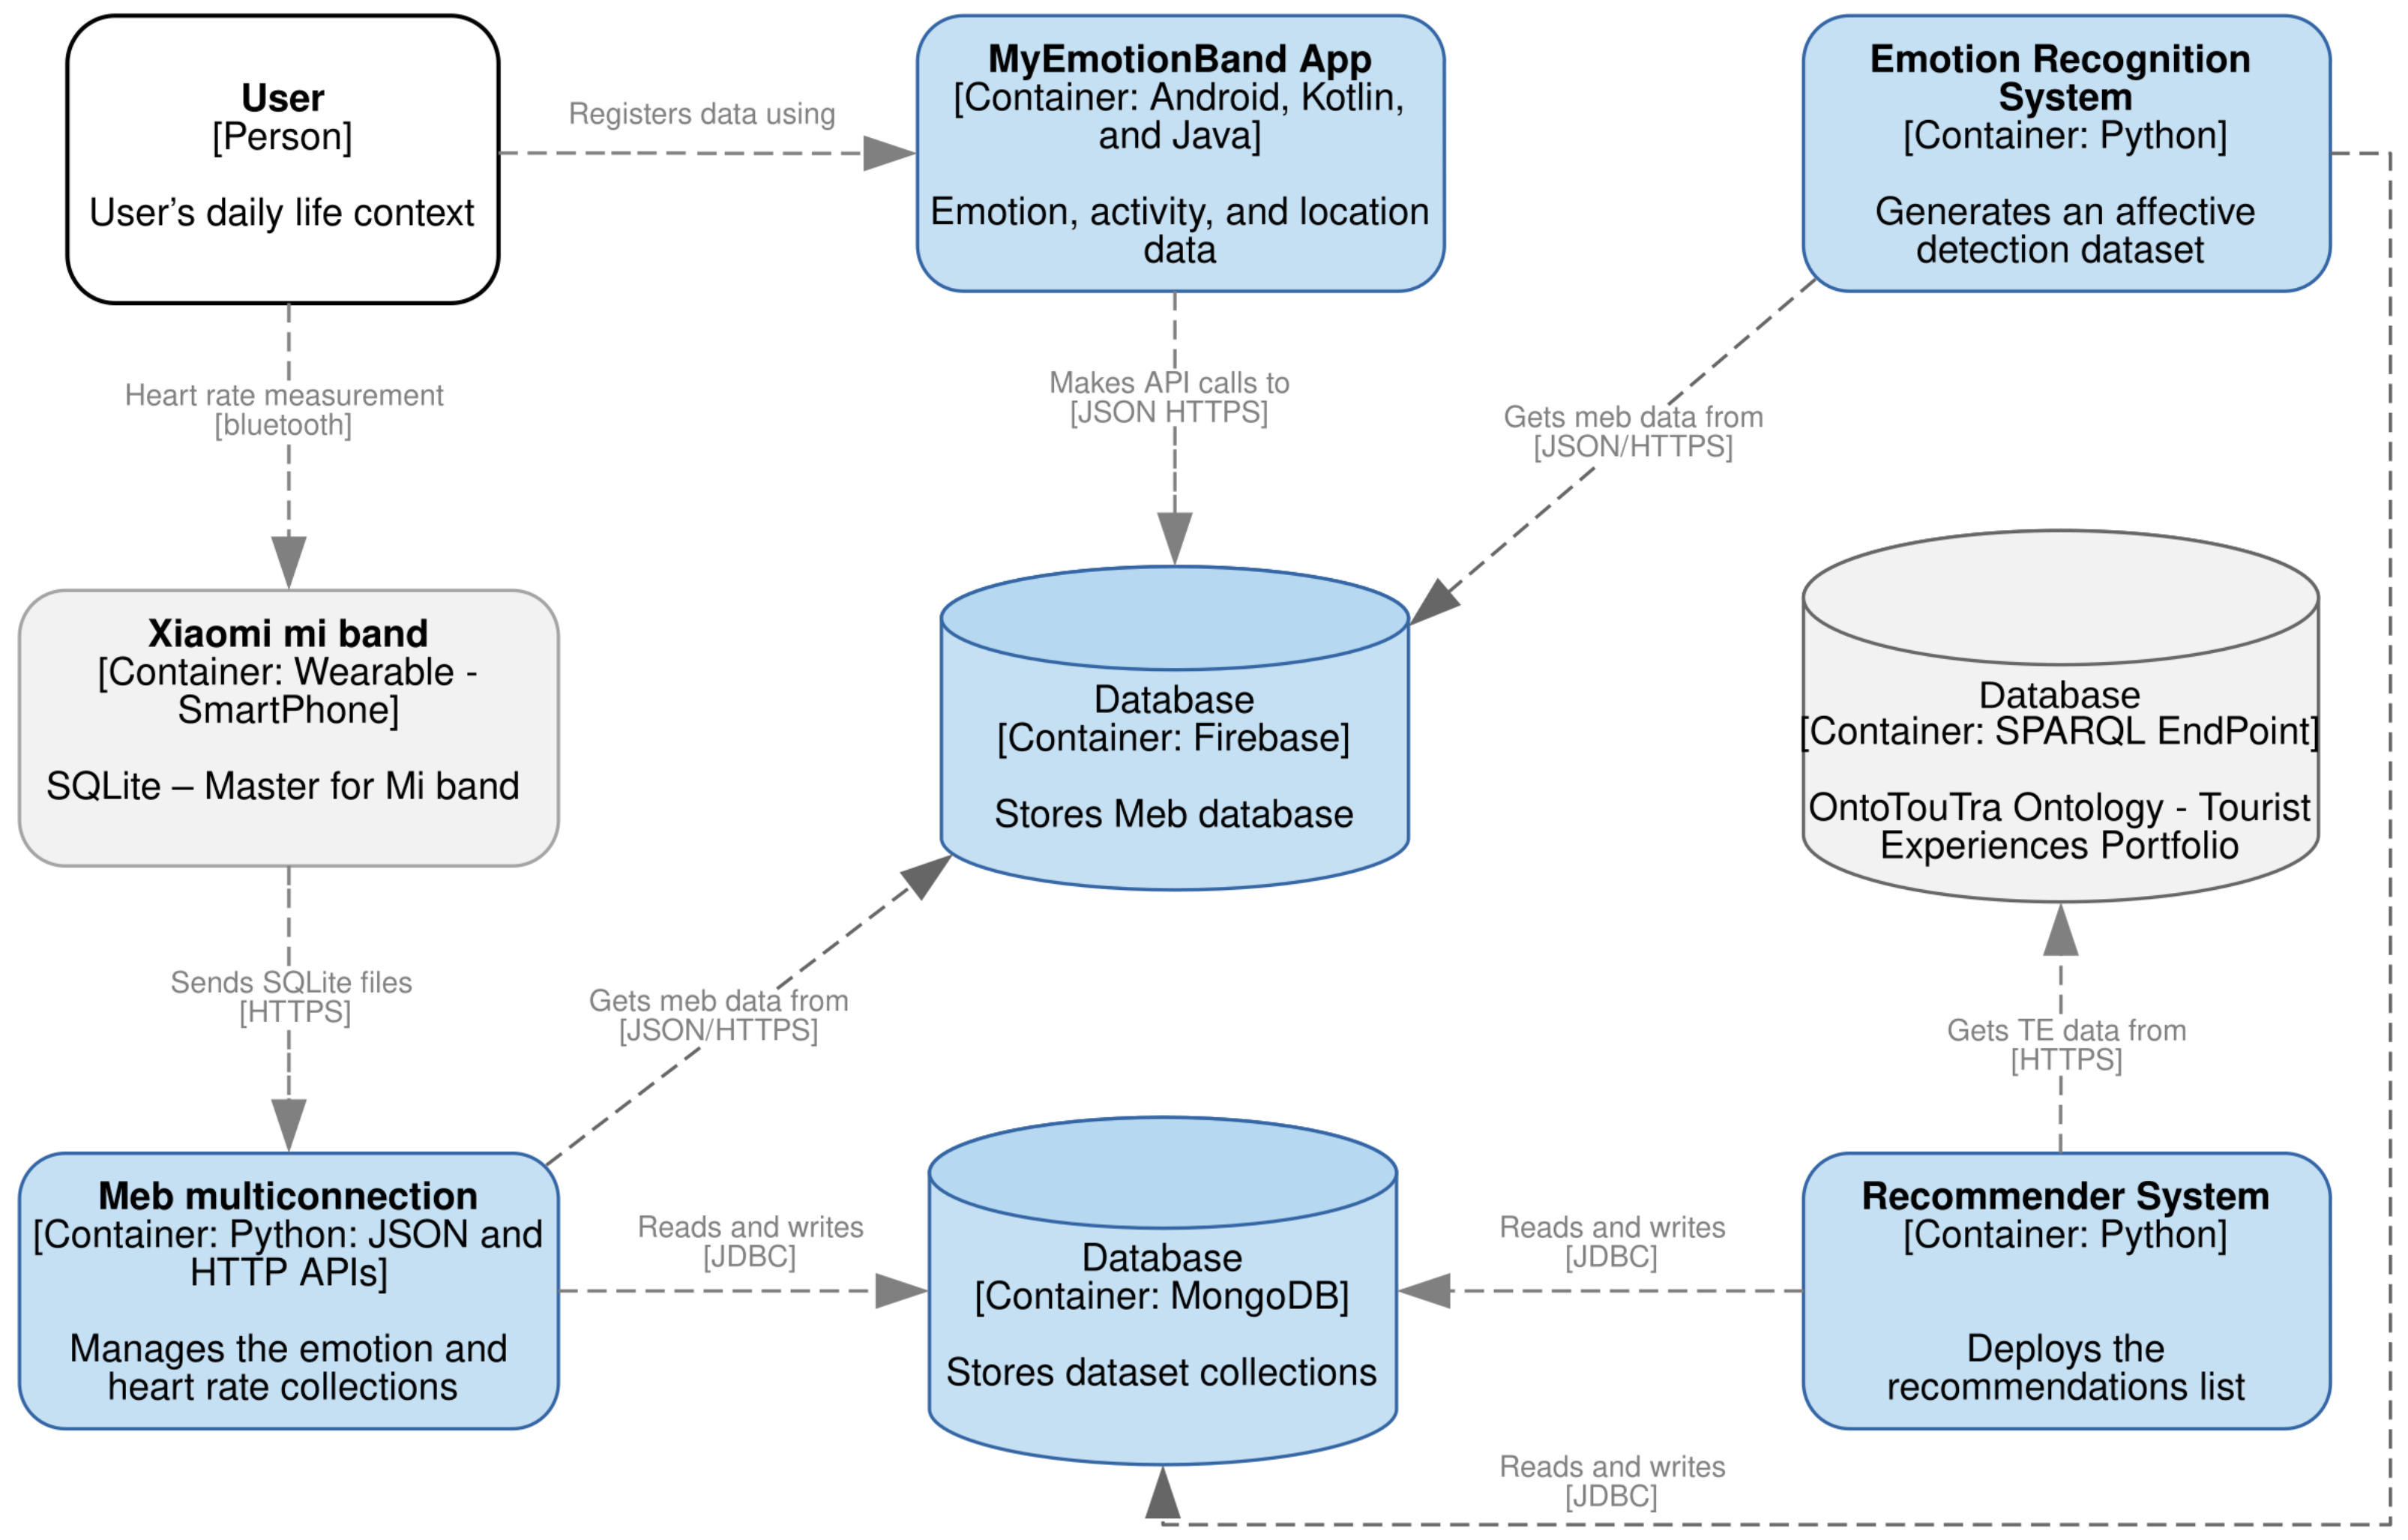
In this section,
Figure 5 depicts the distribution of the technological infrastructure functionalities and the interaction in the TERS-ER subsystems. The following outlines the high-level implementation of the software architecture:
The users in their context use the Xiaomi Mi Band wristband and the MFB mobile application [
45] to store HR data in an SQLite database. In turn, the emotion, activity, and location data is recorded in the MyEmotionBand (MEB) mobile application.
A real-time database that stores the JSON files of the MEB application in the Firebase cloud.
An application that manages the connection to the Firebase and MongoDB databases. Also, it handles the collections gathered from wearable and mobile devices.
A MongoDB database to store collections of HR, emotions, and user profiles.
An application for ER that generates an affective detection dataset.
A dataset of the TE portfolio is consulted from the SPARQL endpoint server. This dataset was acquired from the Ontology of Tourist Traceability (OntoTouTra) proposed in [
20].
A recommender engine that processes MongoDB data collections and TE datasets. It then analyzes and displays a list of tourist recommendations.
Figure 5.
Containers of technological infrastructure.
Figure 5.
Containers of technological infrastructure.
4.4. Apps Architecture
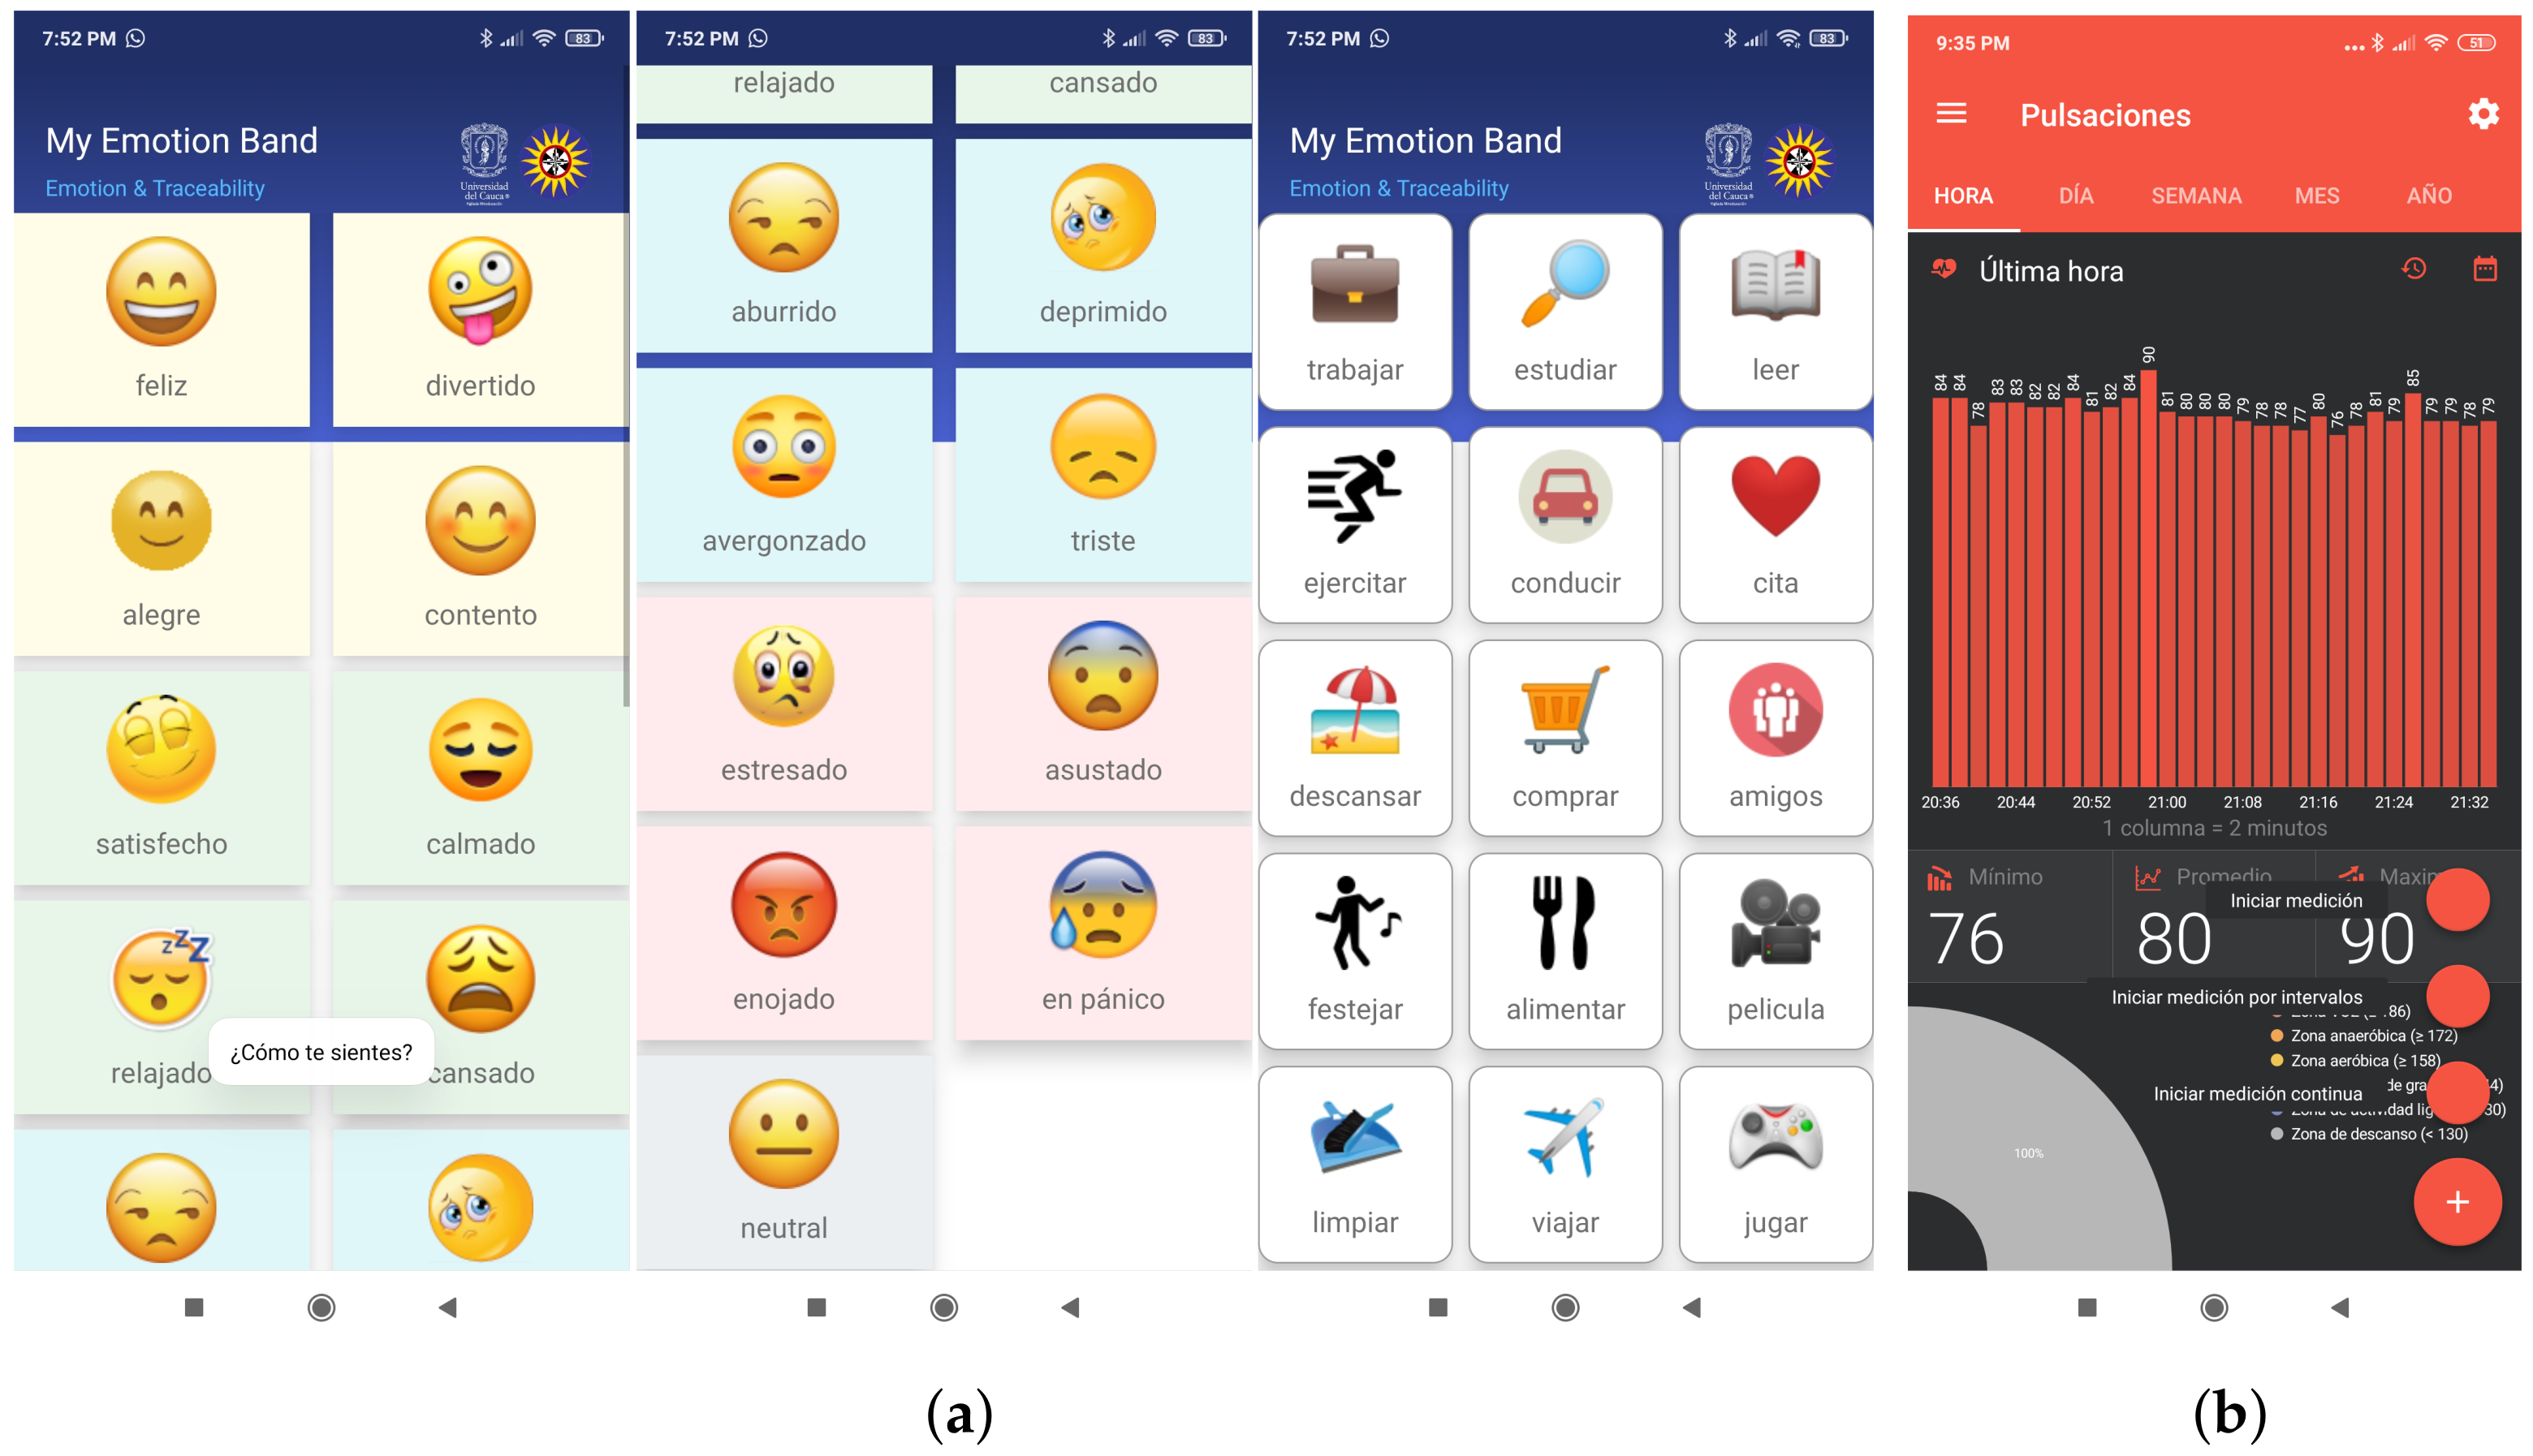
Figure 6 shows the user interface of the mobile applications developed and used by the participants during the experiment.
The MEB app provided the user interface for recording the affective state (16 emotions and one neutral state) and the activity performed (21 tasks). According to the context of the participants, categorical emotions were associated with activation (Arousal) and emotional polarity (Valence) of Russell’s bi-dimensional model [
9,
24]. That is, four emotions were defined for each emotional quadrant: happy (HAHV: excited, amused, glad, and pleased), calm (LAHV: satisfied, calm, relaxed, and tired), sad (LALV: bored, depressed, embarrassed, and sad), and anger (HALV: stressed, afraid, angry, and alarmed). The location (latitude and longitude), the date, and time were obtained from the smartphone GPS. In addition, the authentication and synchronization methods were created to store the data on the Firebase server. In particular, the emotional dataset collected 21,000 records from the participants. The SQLite files of the MFB application were converted into CSV files, and a dataset of 1,535,992 HR instances was collected.
In other studies [
9,
16] the recording of emotions, either by the participant of the experiment or by an observer, was carried out manually on a sheet of paper; this instrument is called SAM [
25]. SAM can be used in controlled experiments, but its use is inappropriate in the context of a person’s daily life. For this reason, the MEB app was developed (see
Figure 6a). Although the emotion recording is still manual, it is more practical and complete than SAM because the user makes a tap on the emoticon that depicts the emotion that he was feeling at that moment and then another tap on the icon of the activity performed. In this way, MEB correlates the variables of emotion and activity.
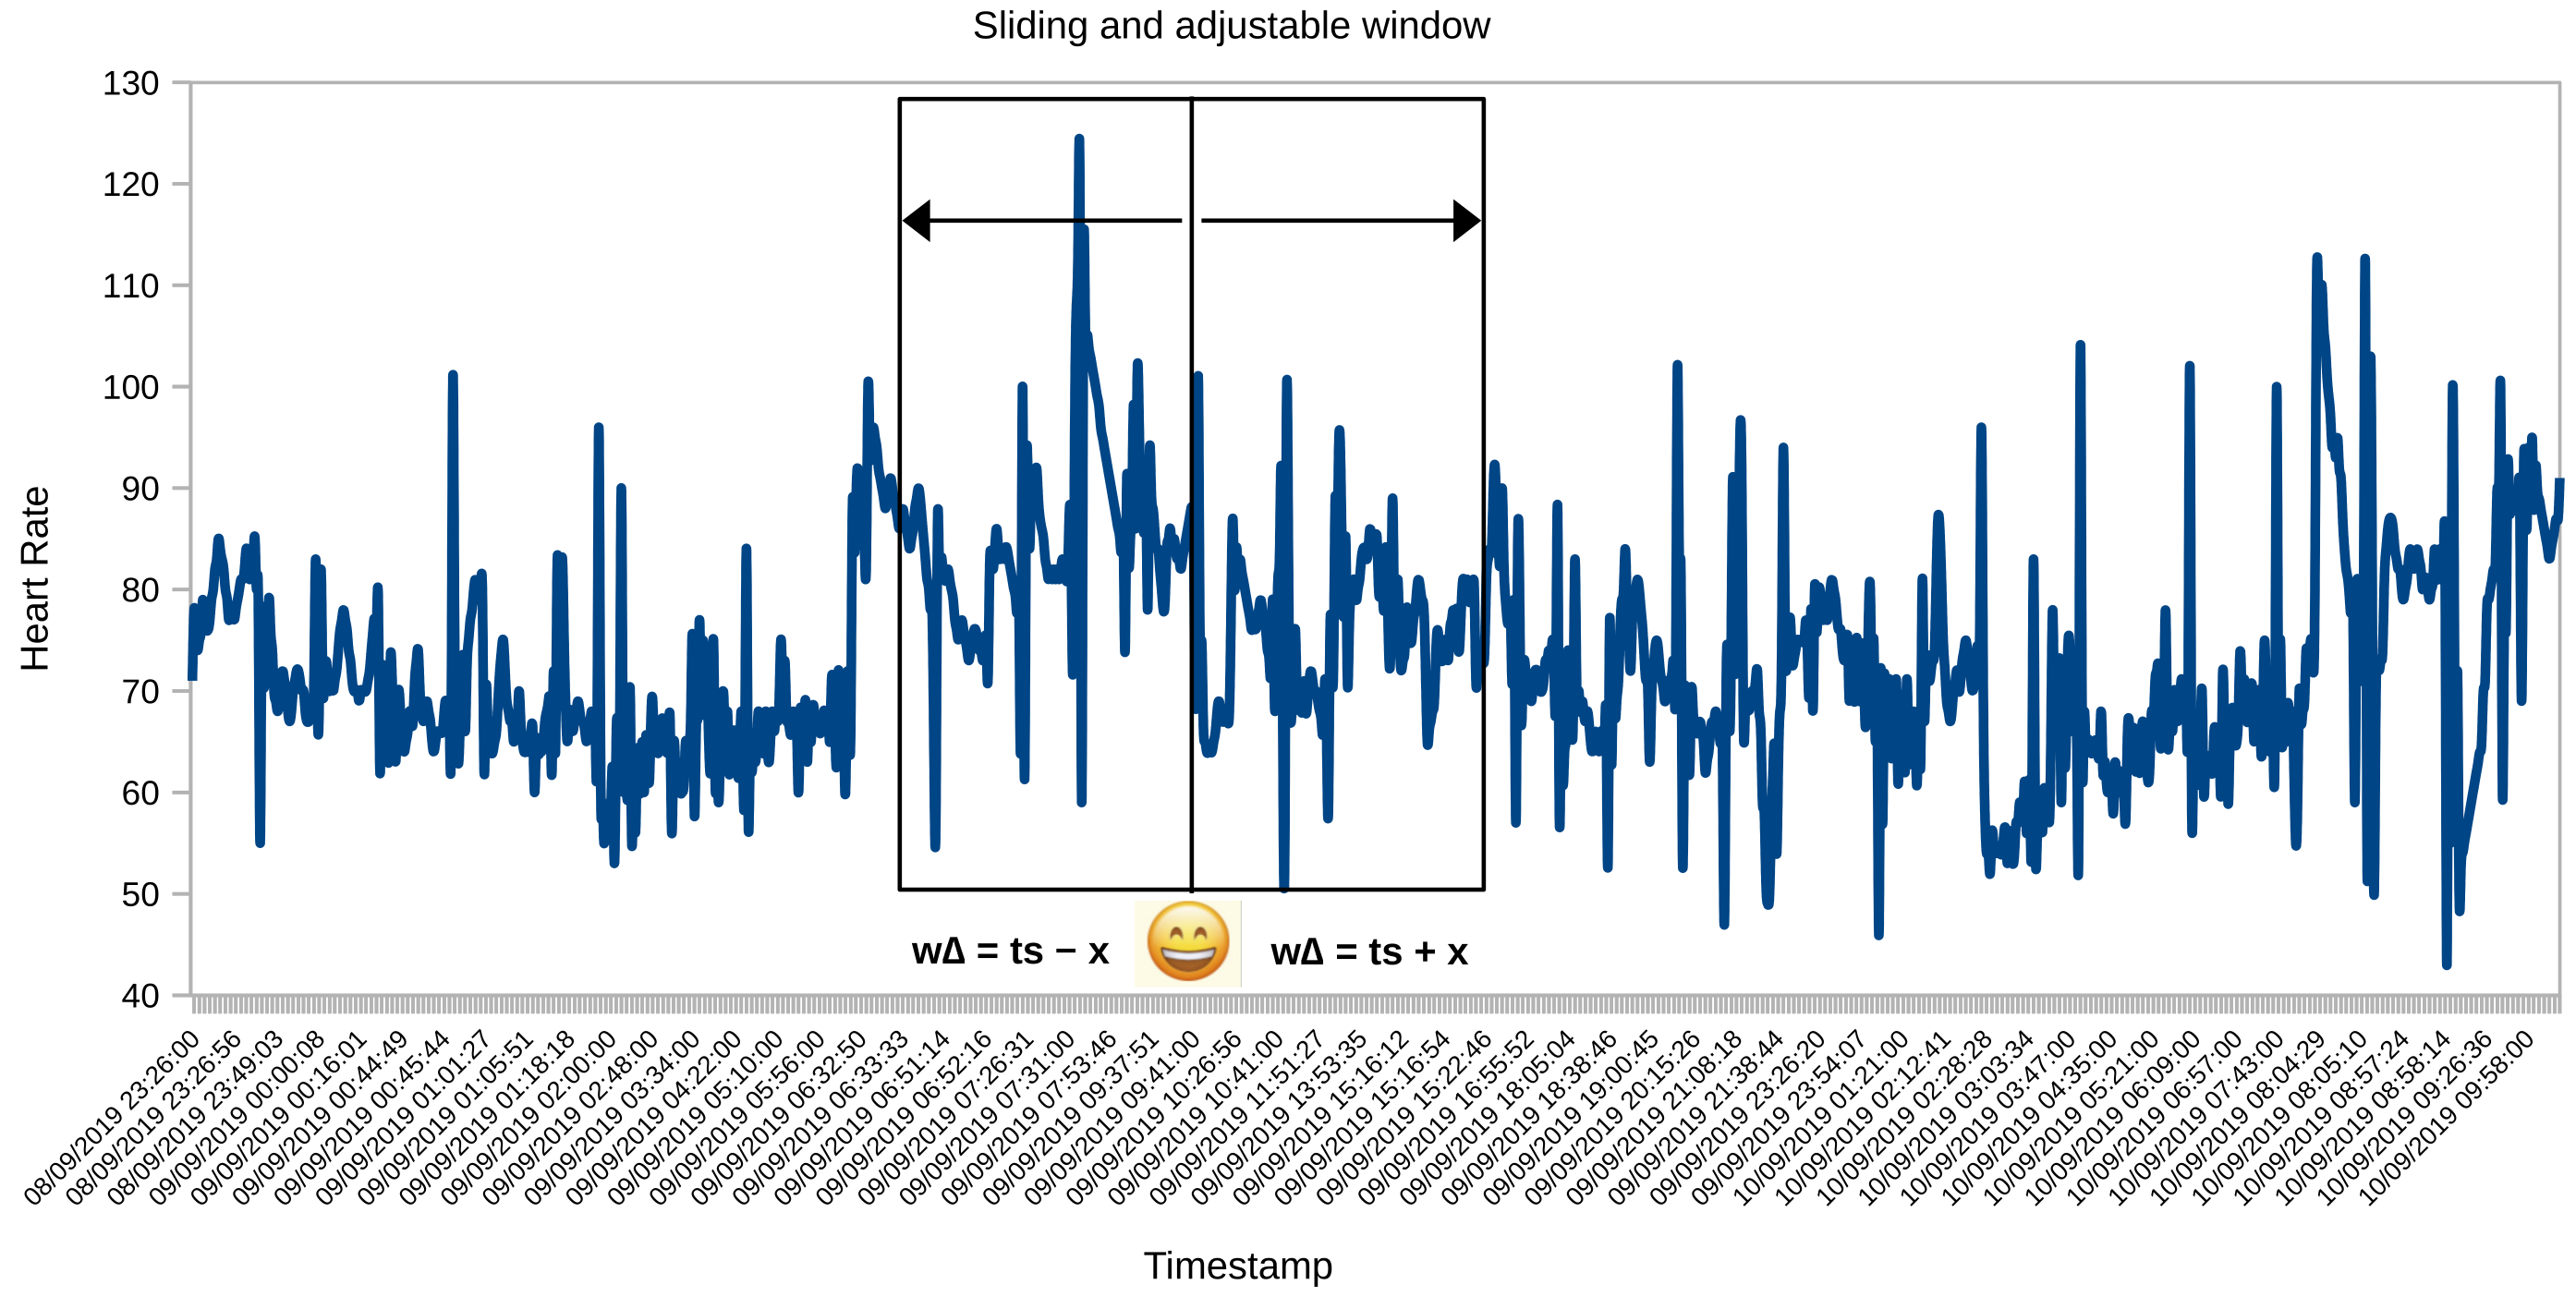
4.5. Sliding and Adjustable Window Algorithm
The preprocessing of the datasets was made with the synchronization algorithm called a Sliding and Adjustable Window. Because it uses the time series of each participant’s HR and emotional state, this algorithm is sliding because the timestamp window is located in the segment that contains data for both datasets. It is adjustable because the size of the timestamp window is configured depending on the behavior of the data (see
Figure 7). The Algorithm 1 loads the two MongoDB data collections (HR and emotion) to tag the emotion in each participant’s HR instances:
Initially, set up a loop to iteratively go through the HR instances dictionary of the participants.
Obtains the timestamp and HR measurement of each record. Defines a time variable () that controls the window size setting.
Establishes an iterative cycle through the dictionary of the experiment participants’ emotion, activity, and location.
Gets the HR and emotional data that correspond to the same participant.
If the emotion label is not found within the maximum window size (for example, 180 s), it loops through the collection of emotions and gets the tag that matches the timestamp of the HR instance. If the label cannot be found, the size of the window is increased.
Then, set the emotion tag on HR time series instances. In addition, it adds the activity data and geographical location in the HR dictionary.
Finally, build a new collection in MongoDB with the HR dataset labeled.
Hence, the method (see Algorithm 1) that we developed is adaptive and dynamic to the time series windows of the physiological and emotional datasets.
As a result of the preprocessing, a tagged data collection of 218,297 records (documents in JSON format) was generated. The data structure is made up of a document identifier (_id), a participant number (IMEI), the emotion timestamp (emotionts), the affective state (emotion), type of activity (activity), HR (hr), location (longitude and latitude) and HR timestamp (hrTimestamp).
4.6. Emotional Slicing Algorithm
The size of the segment parameterizes the Emotional Slicing (ES) algorithm (by default 30 HR instances), the time between instances (for example, 60 s), and the limit size of instances (for default 20). The algorithm loads the MongoDB HR collection, consolidates the labeled instance blocks, and generates the physiological dataset used in the affective detection module. This algorithm was created for detecting the duration of the emotion (See
Section 3.1).
Algorithm 2 has the following activities:
Loads the preprocessed collection into a list and gets the first HR instance.
Initializes a new physiological slice.
Add the values to the HR, timestamp, and emotion vectors.
Creates a list with the minimum and maximum HR values for each participant to normalize the data.
Browses the records of the HR collection. Each iteration verifies that the instance belongs to the same emotional slice of the participant and complies with the limit size of instances. It controls that when the activity is a movie and has the same emotion, it adds the instance to the data vectors. It checks the addition of new instances to other activities that meet the established parameters.
Then, creates the list of affective segments with the predominant emotion of the HR instances.
Furthermore, the algorithm uses the duplication time-series values technique to adjust the number of HR instances (for instance, a record of 20 HR instances repeats the initial sequence of the vector until it completes the default size of 30). Lastly, the new collection of 5247 ES is stored in MongoDB. The data structure of each participant (JSON format) handles a vector of timestamp and affective segment data (_Id, imei, instances number, slice duration, activity, emotion, longitude, and latitude), together with an HR vector normalized through the linear transformation function depicted in Equation (
1) [
19]. This method reduces the standard deviation in the data and suppresses the event of outlier values.
where:
x = measurement of a user’s heart rate;
= minimum measurement of all a user’s heart rates;
= maximum measurement of all a user’s heart rates;
4.7. DNN Models
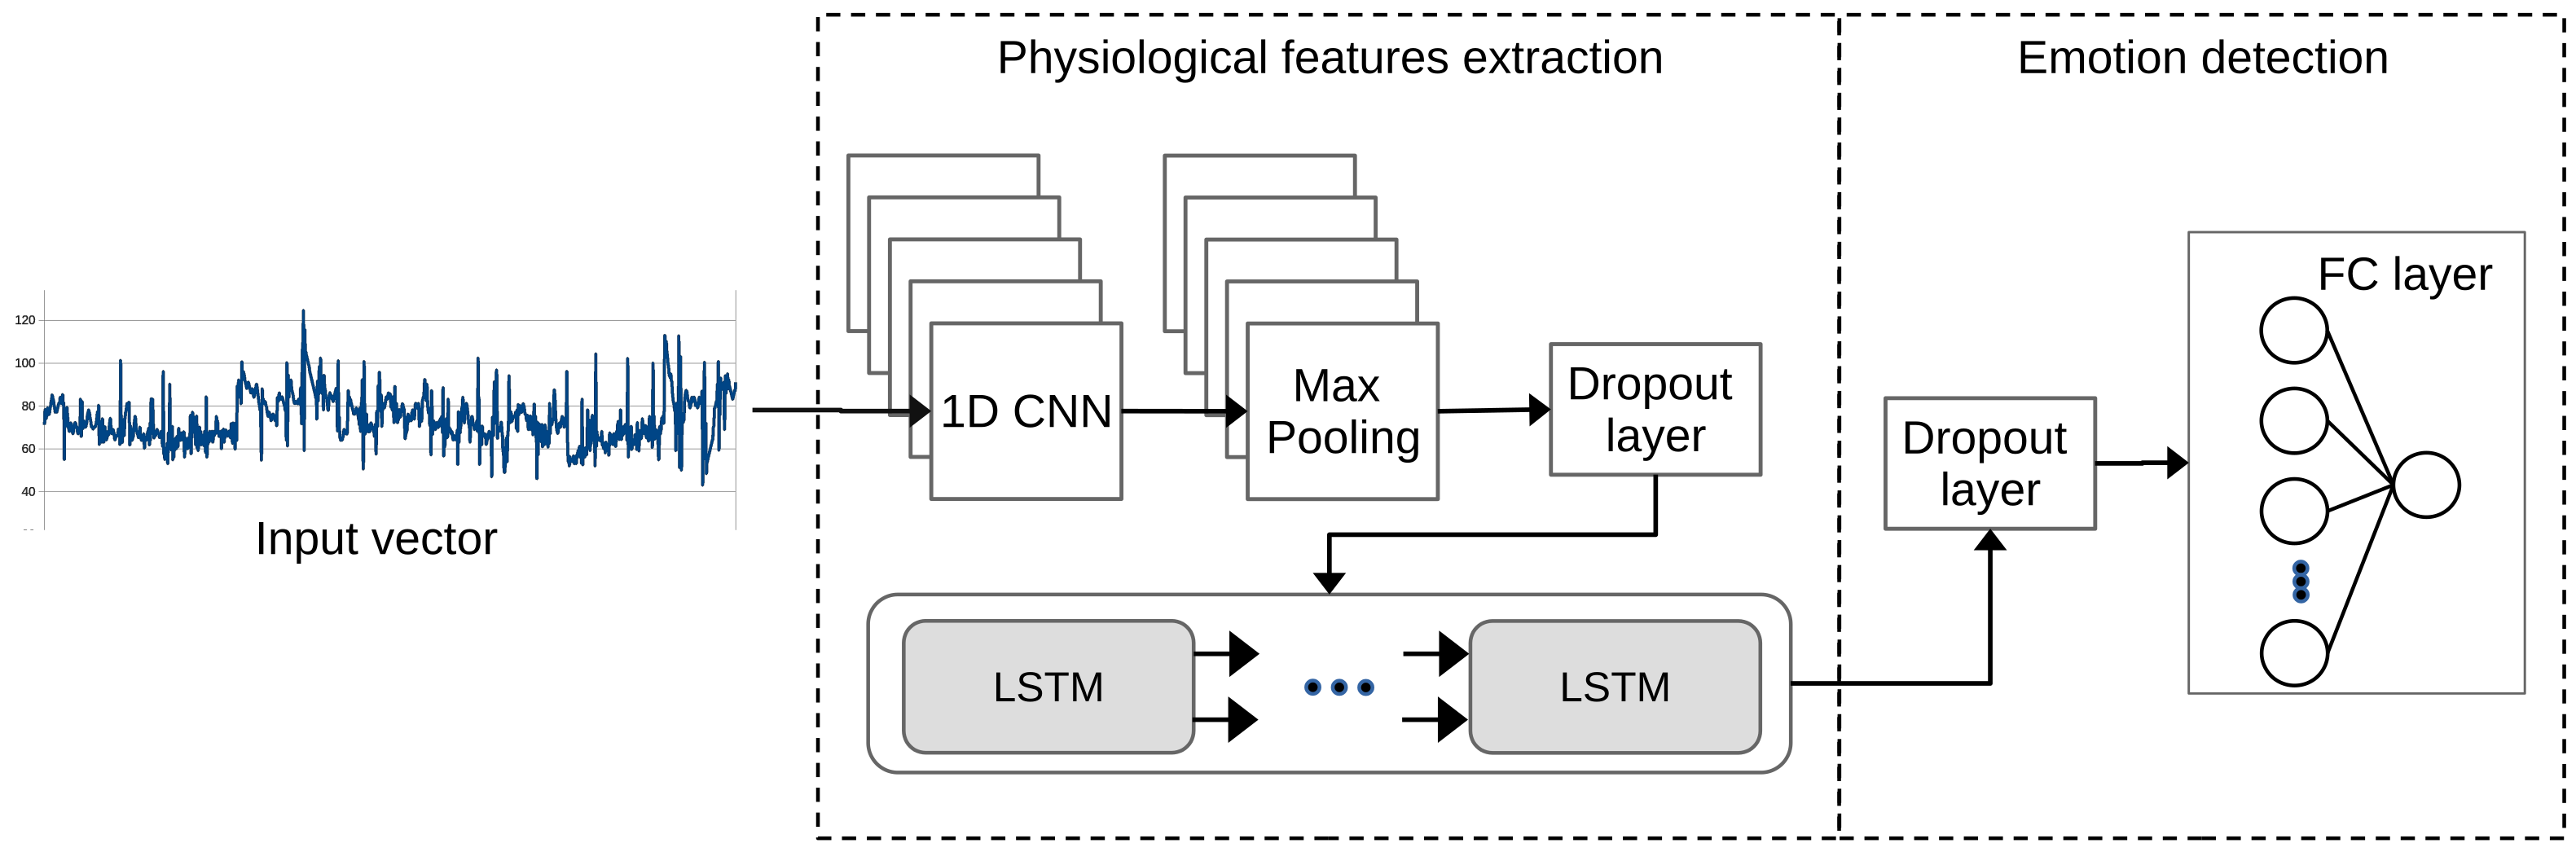
The ER component defines the DNN approaches for detecting affective states based on HR data (see
Figure 8) using the Deep Convolutional Neural Network (DCNN) model [
16]. This model was built by stacking four 1D CNN layers that reached emotional patterns of physiological signals and three Fully Connected (FC) Layers to predict emotion. Furthermore, two models based on 1D CNN and LSTM architectures [
17,
19] were defined. Initially, both models used a 1D-CNN to extract the emotion features related to the input vectors. The convolution has a kernel size of 10 and a filter of 128. The second MaxPooling layer reduces the dimensionality of the feature map and has a pool size of two. The first model uses a third flatten layer to convert the feature map into a one-dimensional vector. Then, the fourth FC layer that receives the learned features is connected.
On the other hand, in the second model (
Figure 8), after the connections of the 1D CNN and Maxpoling layers, a third dropout layer of 0.5 is added as an exclusion mask to the LSTM that can improve the generalizability. This fourth LSTM layer learns the order of the contextual dependencies of the local features entered. Then, in both models, the 0.5 dropouts fifth layer prevents overfitting during model training and transfers the learned features to the FC sixth layer. Besides, the Rectified Linear Unit (ReLU) activation function is used in the middle layers of the network. While in the output layer, the Softmax trigger function defines the predicted emotion of the multiclass classification.
4.8. Recommender Components
The CBF approach computes the similarity between all the pairs of hotels (see Equation (
2)) with the scalar product of categories of TE (binarized vector of TE), location (longitude and latitude), description (summary of services related to TE), and the hotel review tags (for instance exceptional, fantastic and outstanding). The CS metric determines the likeness between TE categories, and the Haversine distance establishes the closeness of locations. On the other hand, the fuzzy match metric [
57] compares the description of hotels, and the Python tool “difflib.SequenceMatcher” measures the similarity of the categorical rating of the reviews. As a result, a matrix correlates the similarity of the hotel ratings during the model training and estimates the prediction of the hotel rating for a user. Furthermore, the KNN algorithm derived from the AlgoBase class [
21] was used. Afterward, the split of the dataset, the evaluation of the recommendation algorithm’s performance is backed up in the evaluation framework proposed in [
22].
where:
= pair of hotels related to the users’ rating;
= binarized vector of hotels’ tourist experiences;
= the hotels’ score category string;
= the hotels’ services description string;
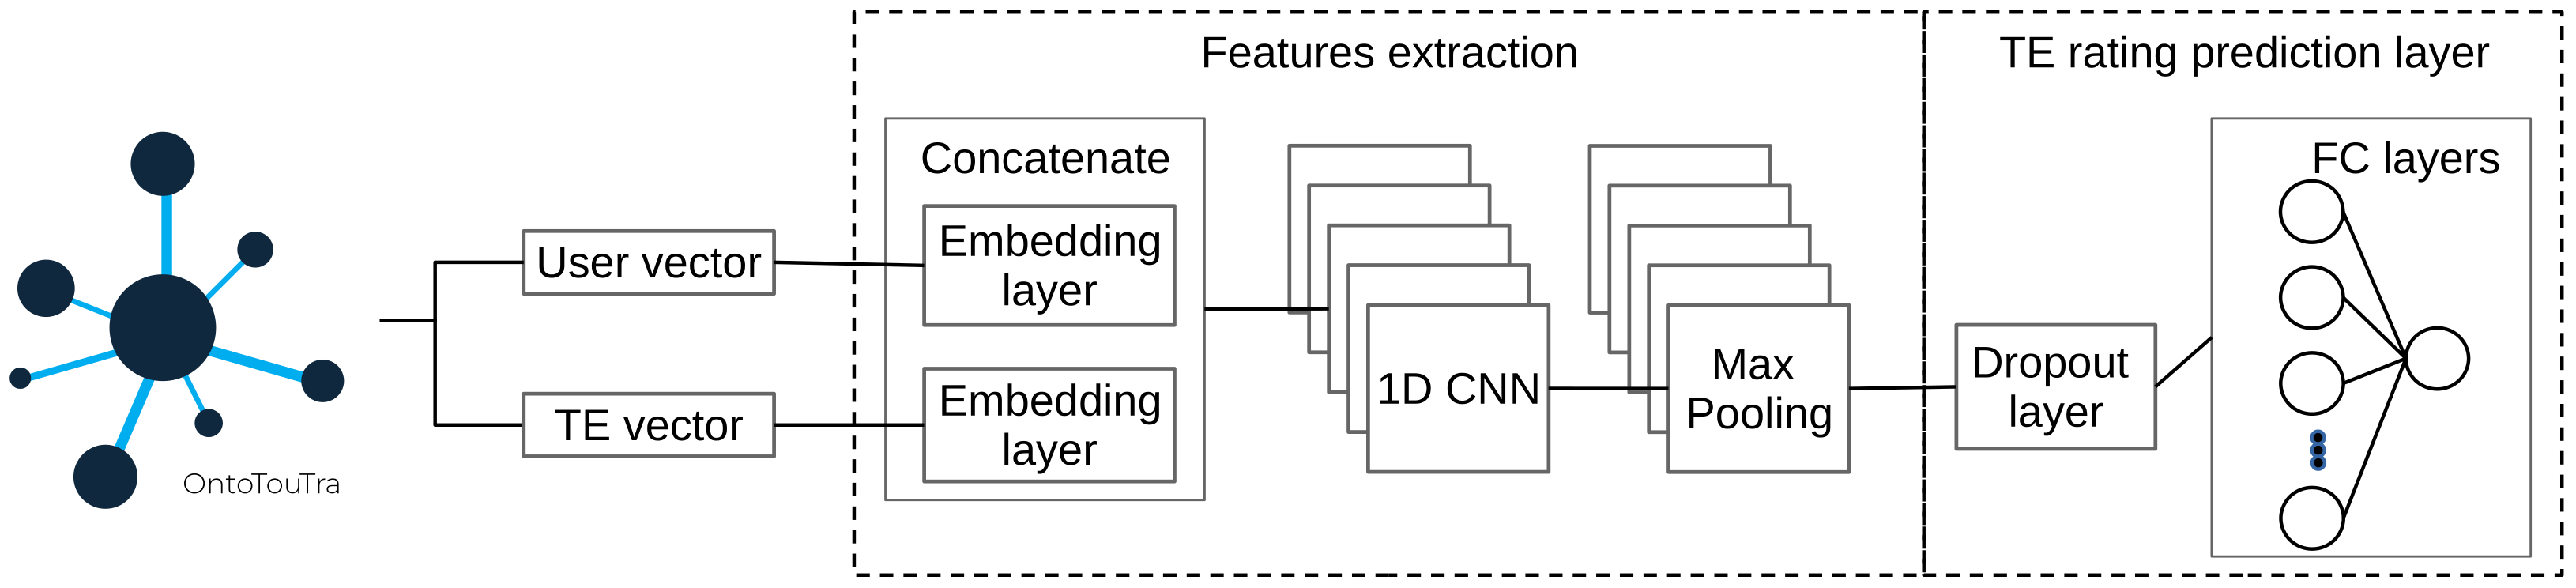
The CF-CNN model preprocesses the user and hotel identifiers of the rating dataset. Then, the 50-dimensional feature vectors to train and evaluate the algorithm [
23] were generated. Initially, the embedment layers transformed the input vectors into matrices and regularized the embeddings using the Gradient Descent (GD) technique [
19]. Furthermore, a concatenation layer decreased the dimensionality of the embedding layers. The developed model CF-CNN employed a 1D CNN layer to automatically extract the patterns from the concatenated vector and a Max-Pooling layer to reduce the convolution features map (see
Figure 9) [
9,
19]. Also, a dropout layer to regularize the model during training was added. The FC layers later compressed the extracted features and used a ReLu activation function to produce the predicted rating of the tourist destinations. In contrast to the CF-CNN approach, the embedding matrices-based CF approach (CF-Net) proposed in [
23] was implemented. A scalar product between the incrustations (users and hotels matrices) was computed, and, finally, the CF-Net model was trained to apply the GD through a sigmoid function.
The CBF model used the prediction method of KNN [
21,
22] for estimating the rating of an item based on the average similarity score of the hotels and the ratings registered by a user of the testing dataset.
Finally, the recommendation list was adjusted to 10 items, and the binary vector of TE was added. Also, depending on the predominance of the emotion, the similarity with the TE (cosine similarity in Equation (
2)) and the location (Haversine distance in Equation (
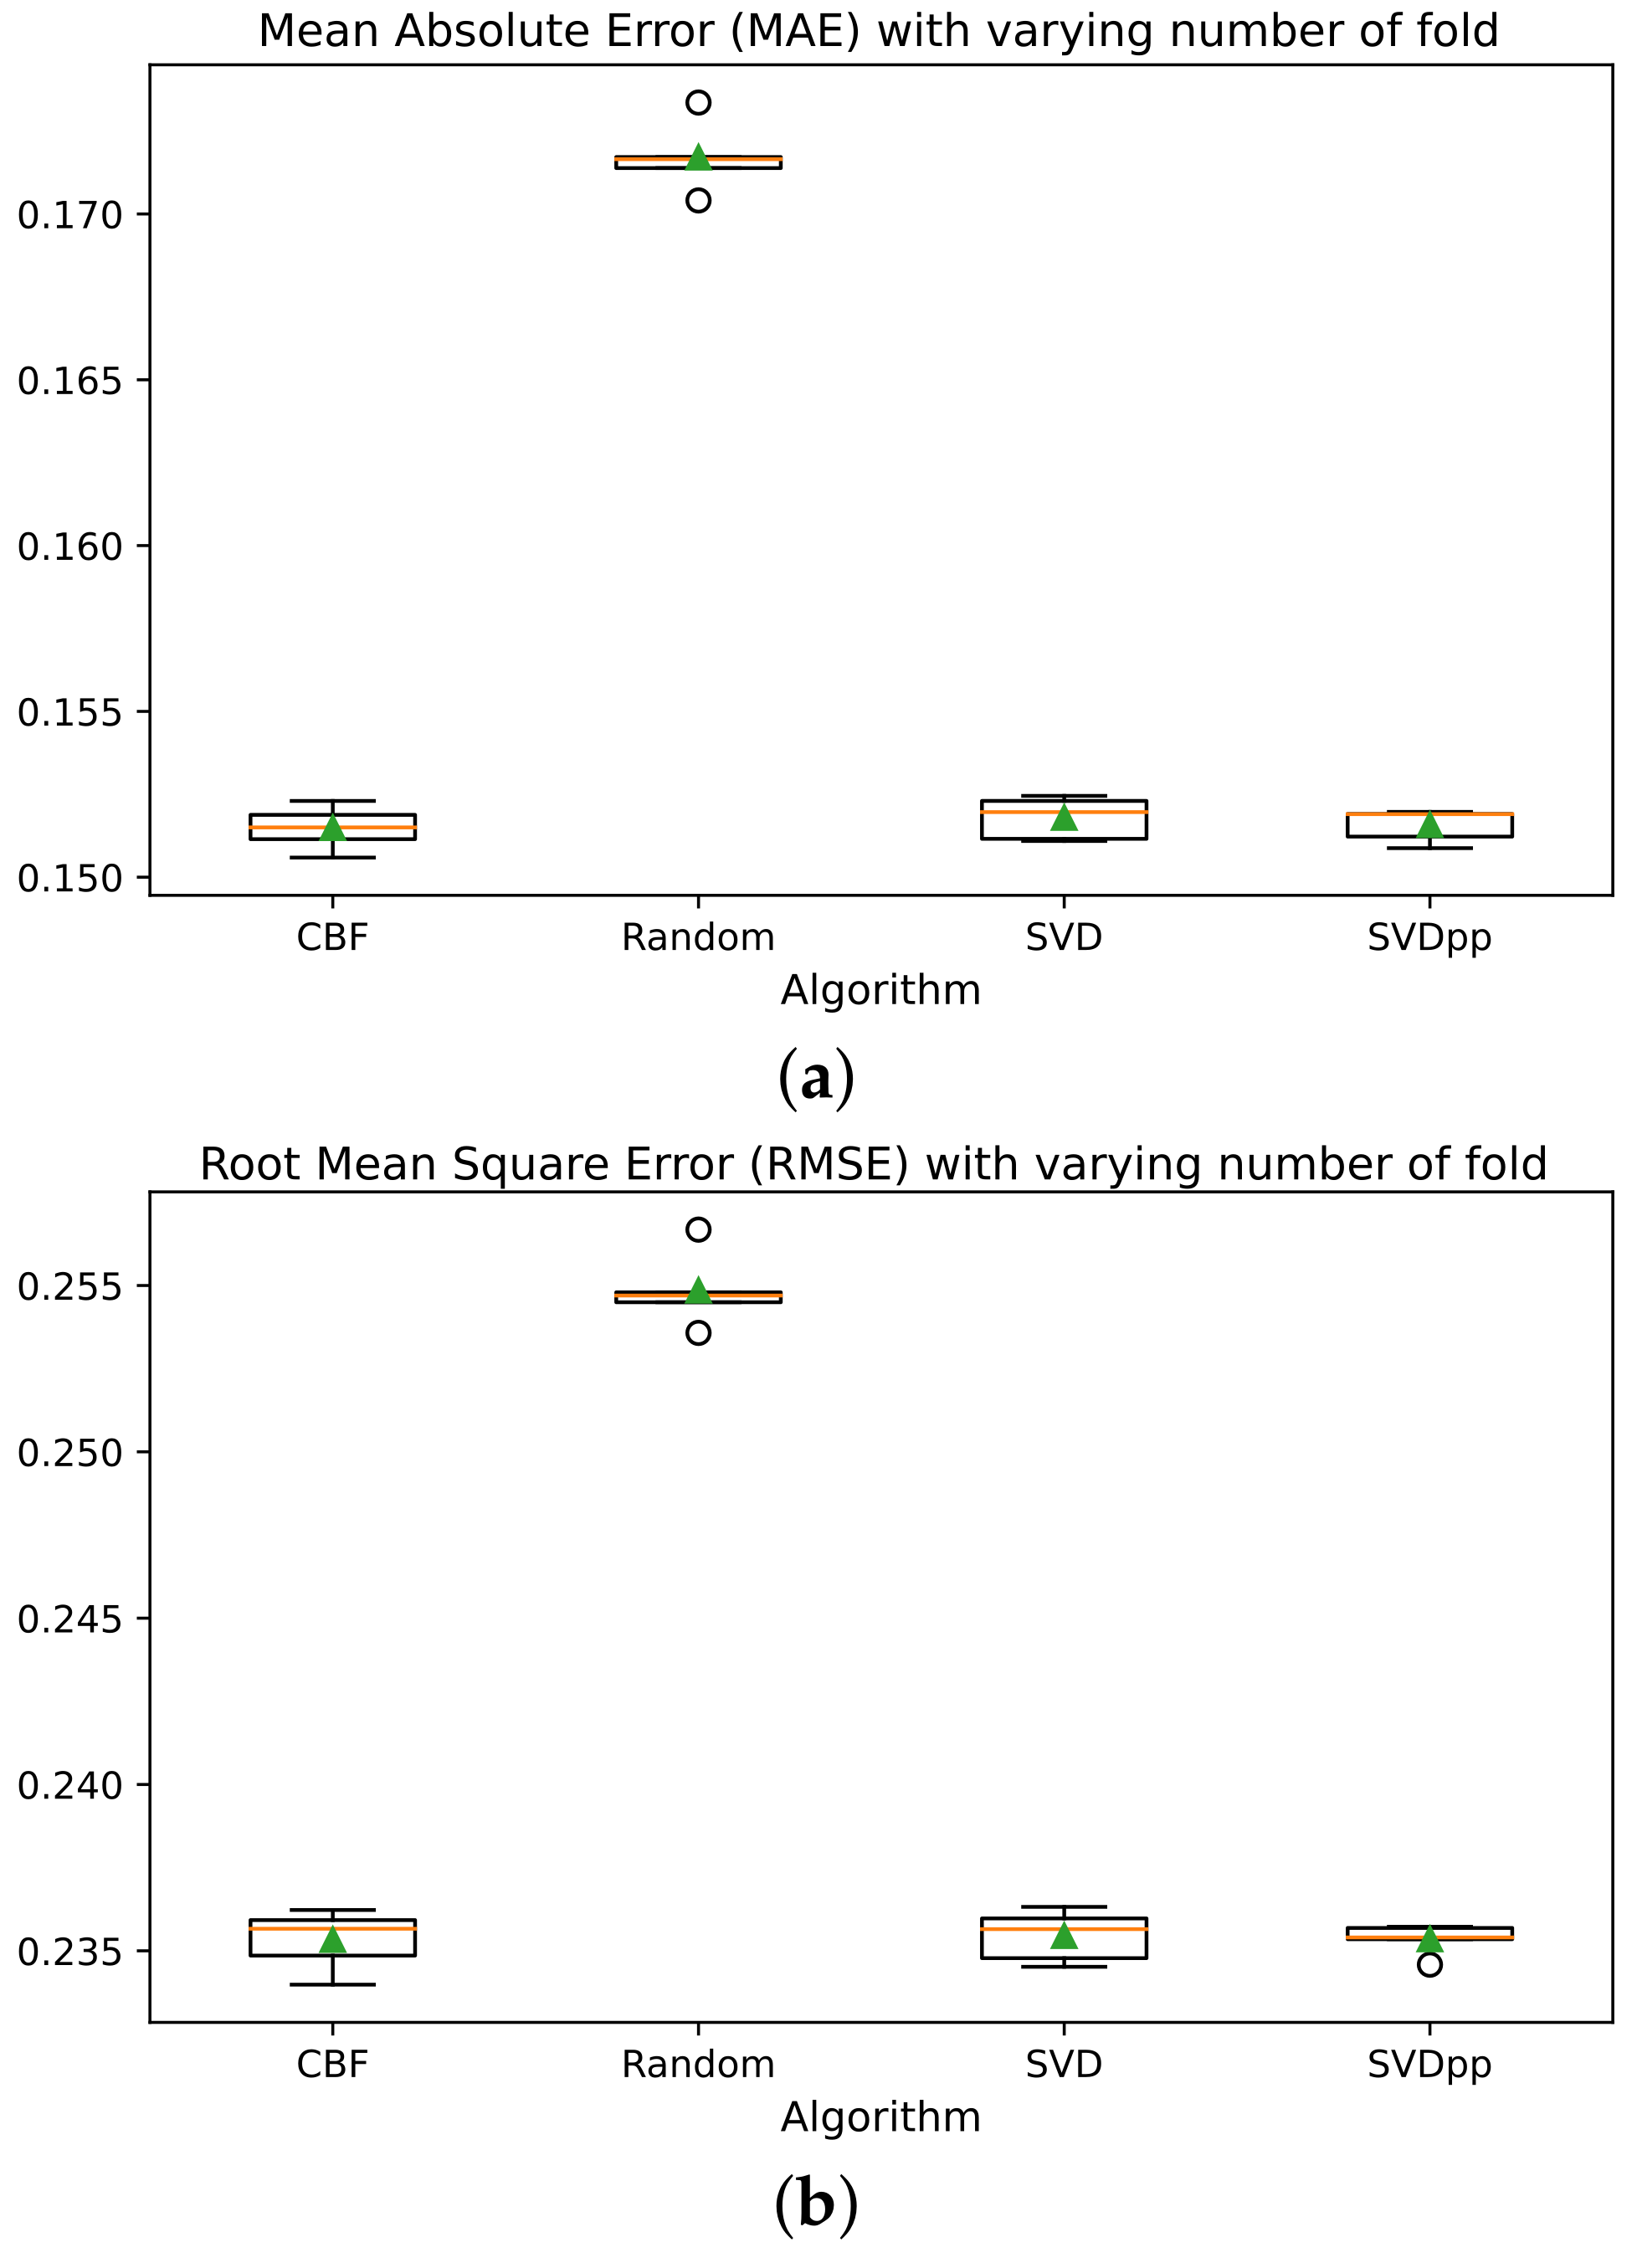
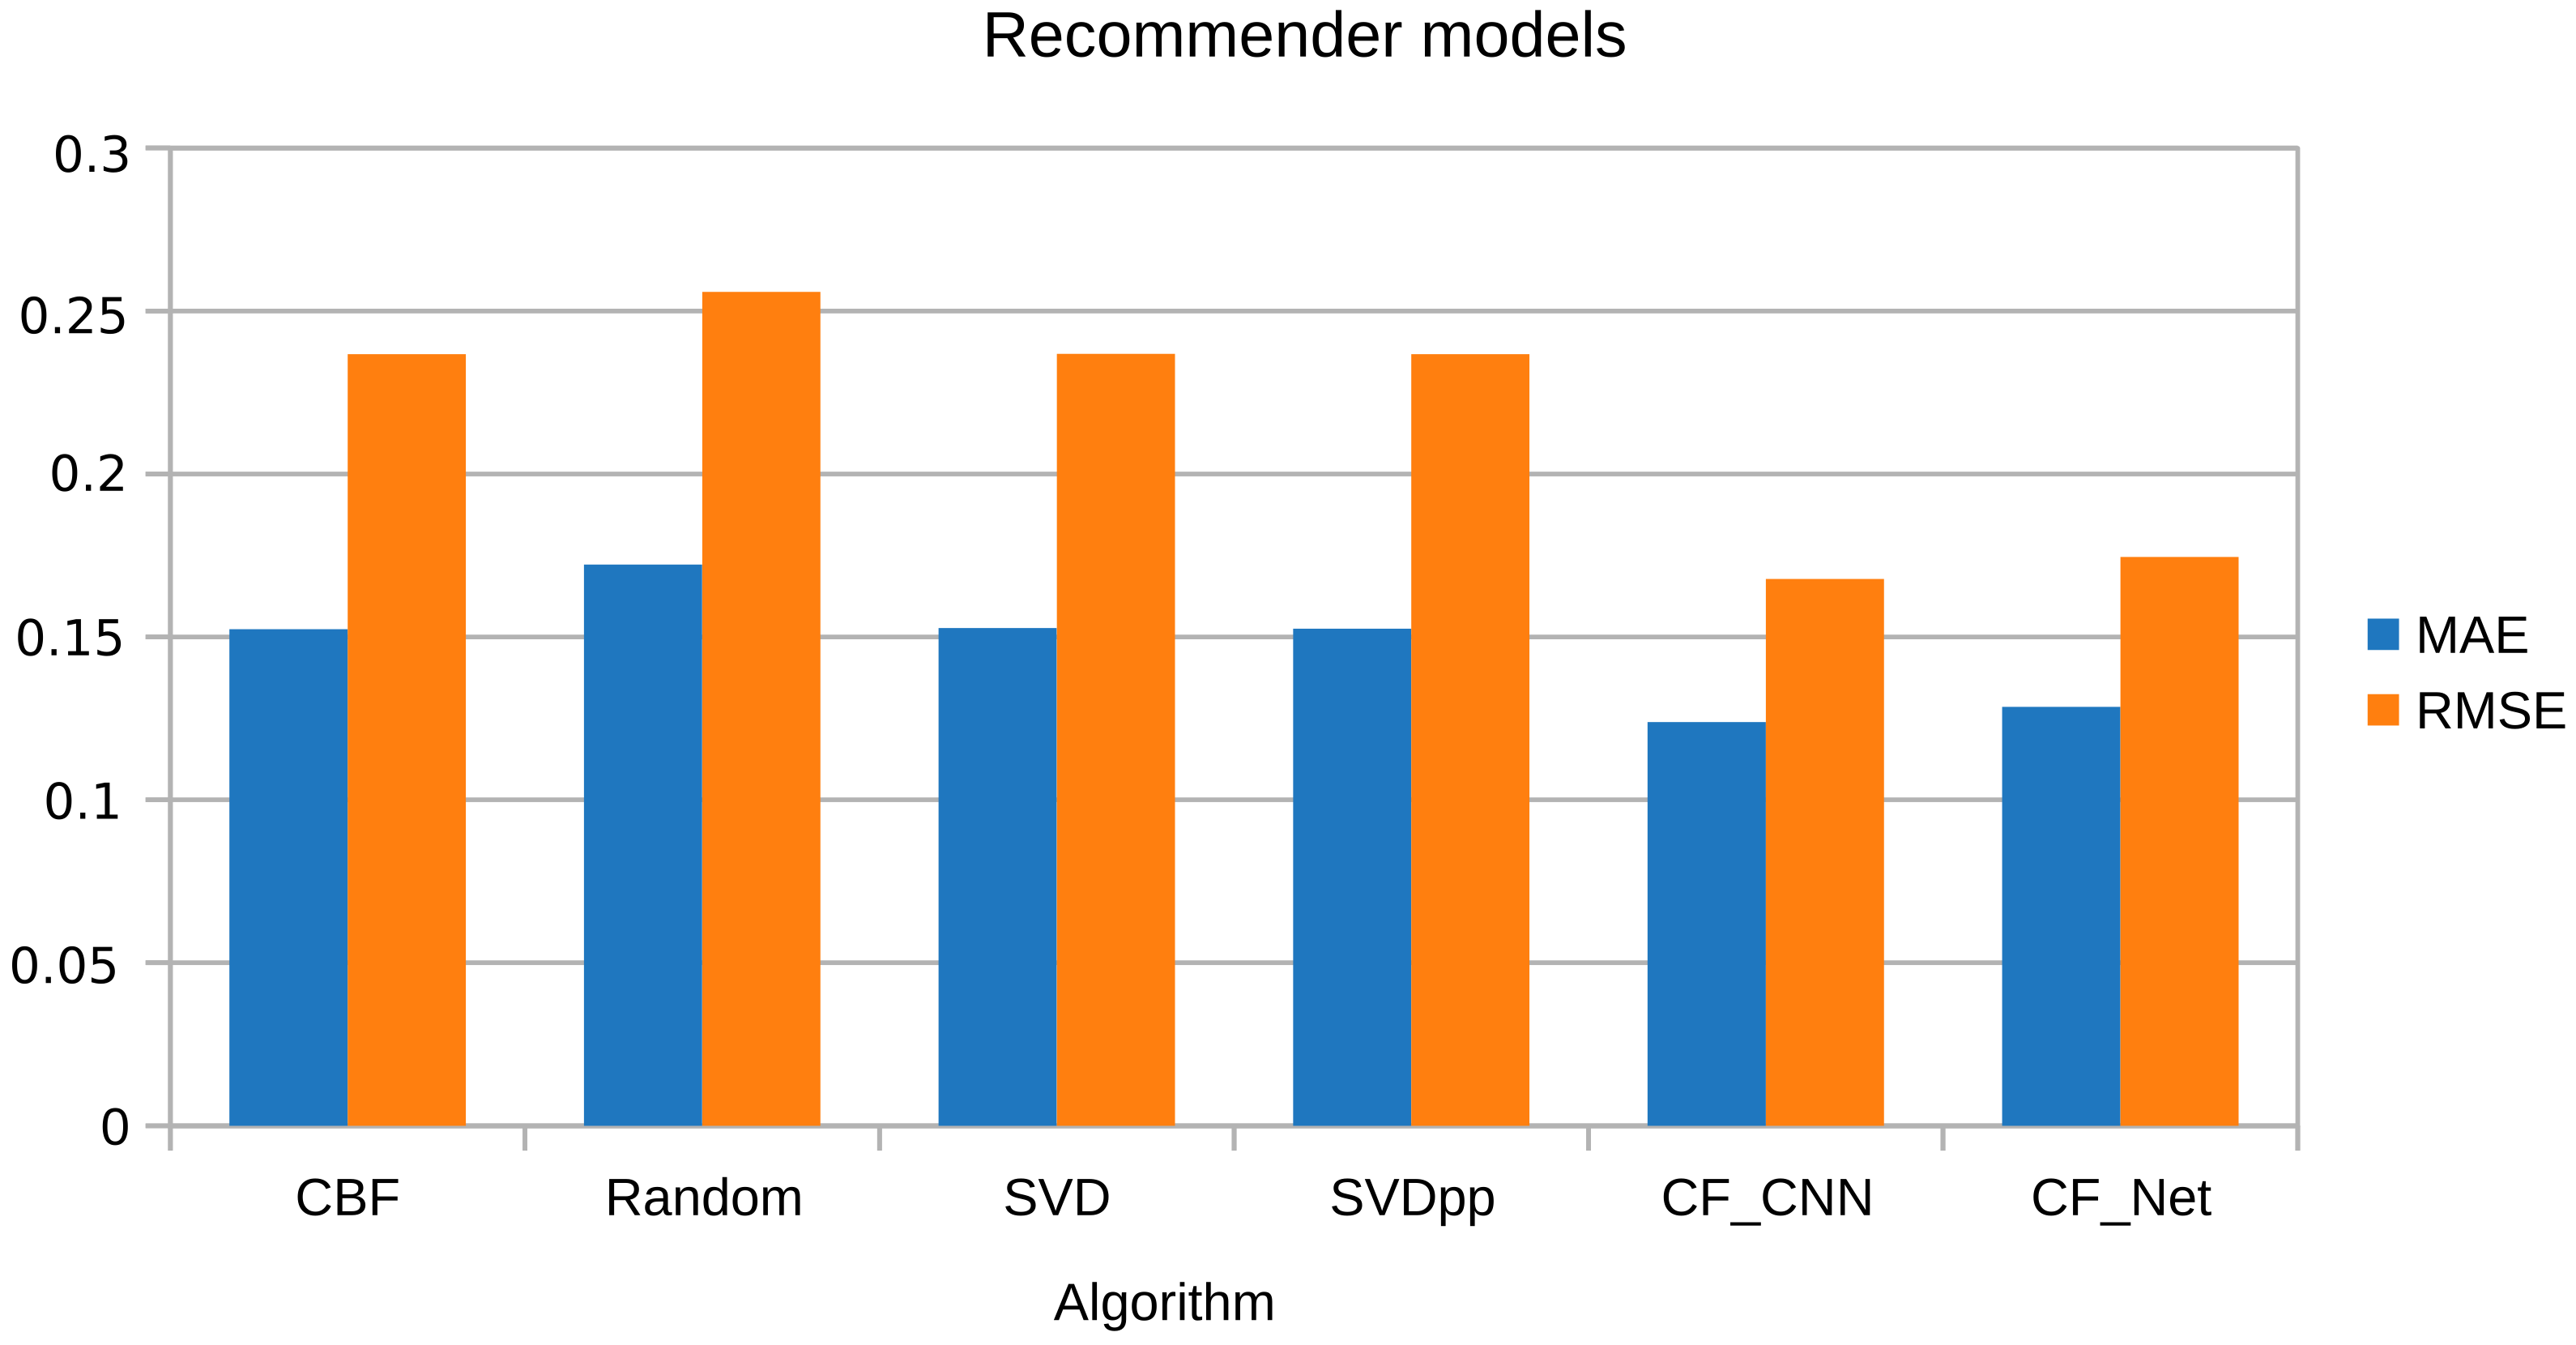
2)) of the hotels in the top-N list were calculated. The top-N list of tourist recommendations was ordered according to the geographic proximity of the person. Subsequently, the final top-N list of TE recommendations performed better in the proposed algorithms compared to the SVD, SVD++, and normalPredictor algorithms [
21].
6. Conclusions
The proposed architecture is a reference for developing recommendation systems based on users’ emotional states in different contexts. Furthermore, this model allows adding wearable devices with more accuracy physiological sensors [
11,
13,
31,
60]. However, when cheap wearable devices become more popular in the market, manufacturers will probably include more accuracy sensors for monitoring biosignals and physical activity [
28,
29,
34,
35,
36,
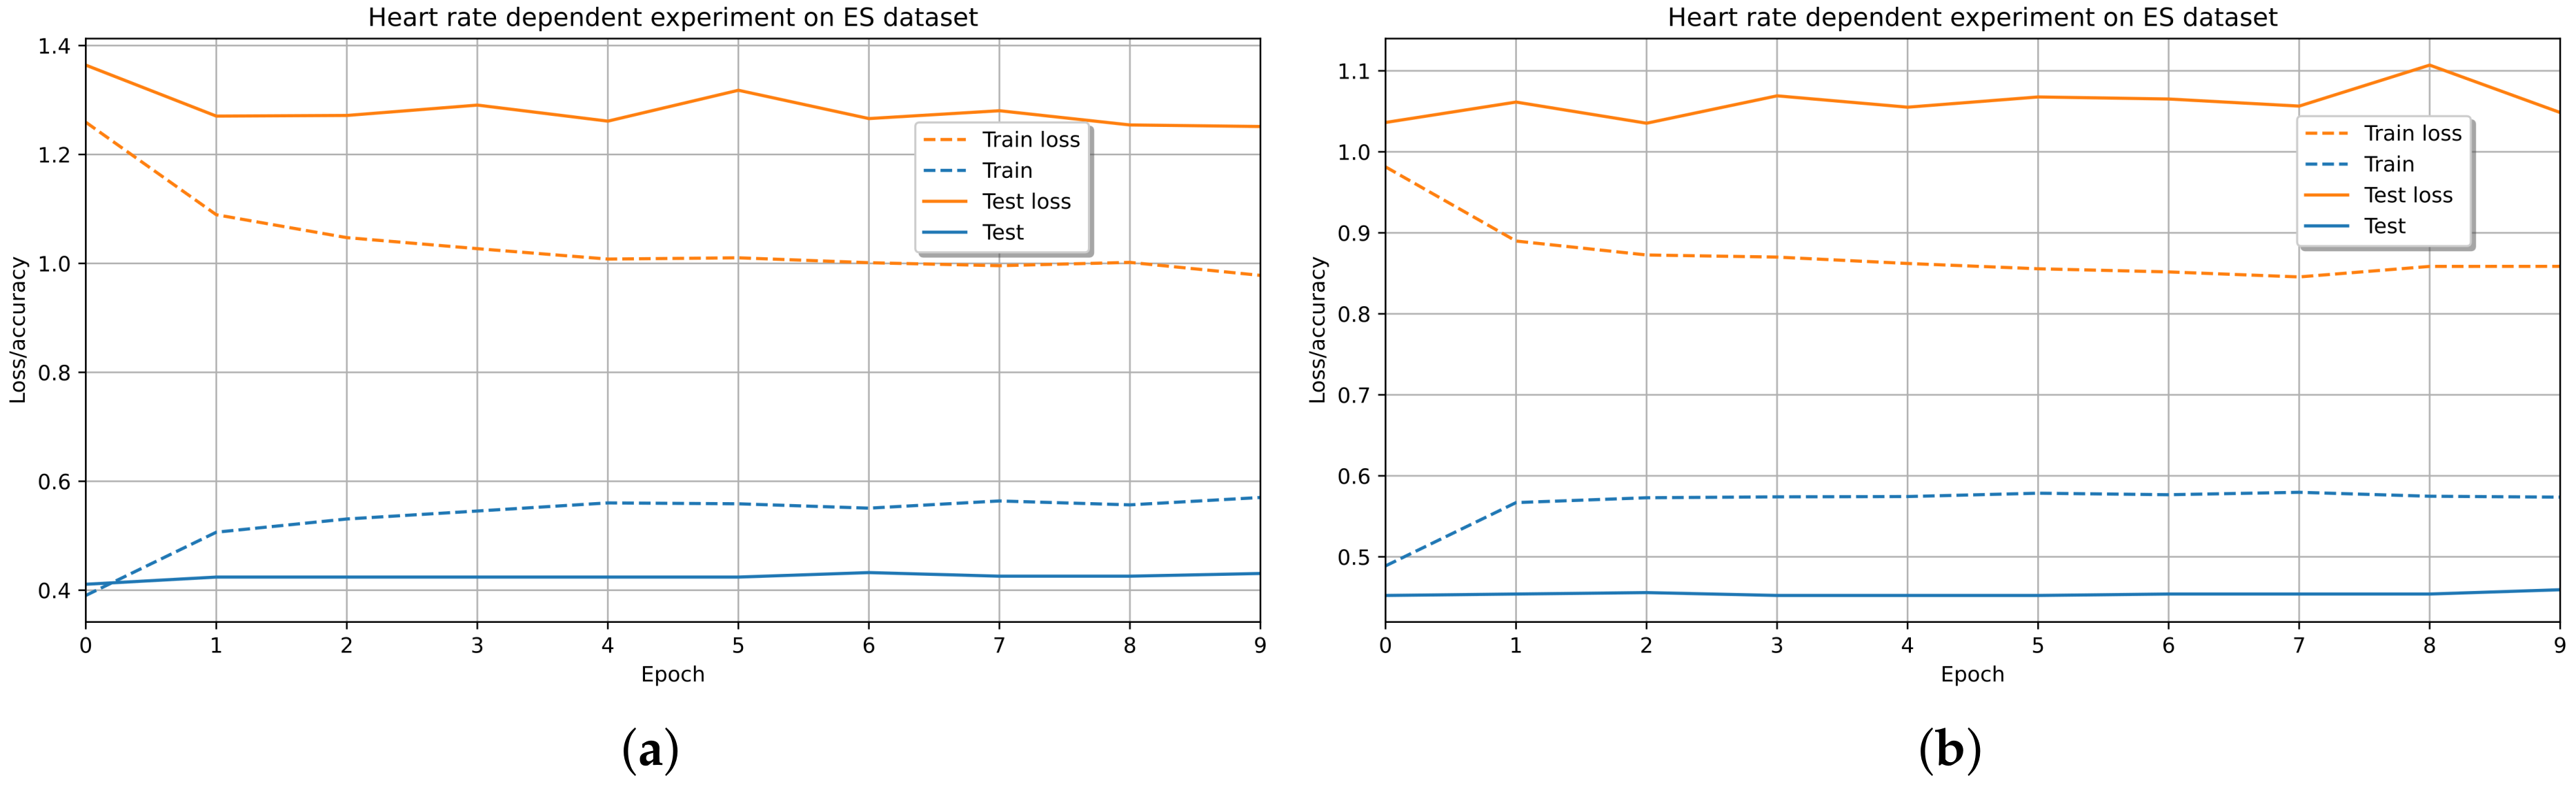
37]. For this research, we opted for massive and cheap devices that are probably the most used by people in their daily lives. The disadvantage of these devices is the low accuracy of measuring physiological signals that would be very sensitive in medical or specialized applications but are tolerable precisions for tourism. For this reason, an accuracy of 44% in the emotion detection is tolerable to maximize the user experience of these types of devices. Also, it’s important to take into account that this accuracy can be improved with new versions of the wearables used, as with a more robust ES dataset, through another experiment with a more significant number of participants and controlled elicitations, which serves as a cold start for the TERS. It could involve other physiological signals different from HR, such as, for instance, electrodermal activity and temperature.
Regarding the related work represented in
Table 2, the use of shallow ML classifiers with an accuracy of around 0.7 can be seen. Our experiment used the 1D CNN-LSTM hybrid classifier with an accuracy result of 0.44. This level of performance is tolerable due to the significant differences in the conditions of the design of the experiments (see
Table 7). However, the conditions of this study were planned to meet the requirements of the context, that is, anyone in their daily lives that uses a cheap wearable device. The emotion detection performance of this system is acceptable for recognition, generating an additional contextual factor to a recommender system to improve its accuracy. This contextual factor is emotion, which is a new contribution to recommender systems for the domain of tourism.
Regarding the analysis of RS-related works based on emotions, these works focused mainly on analyzing sentiments of reviews. Their MAE and RMSE results are very close to 1 (see
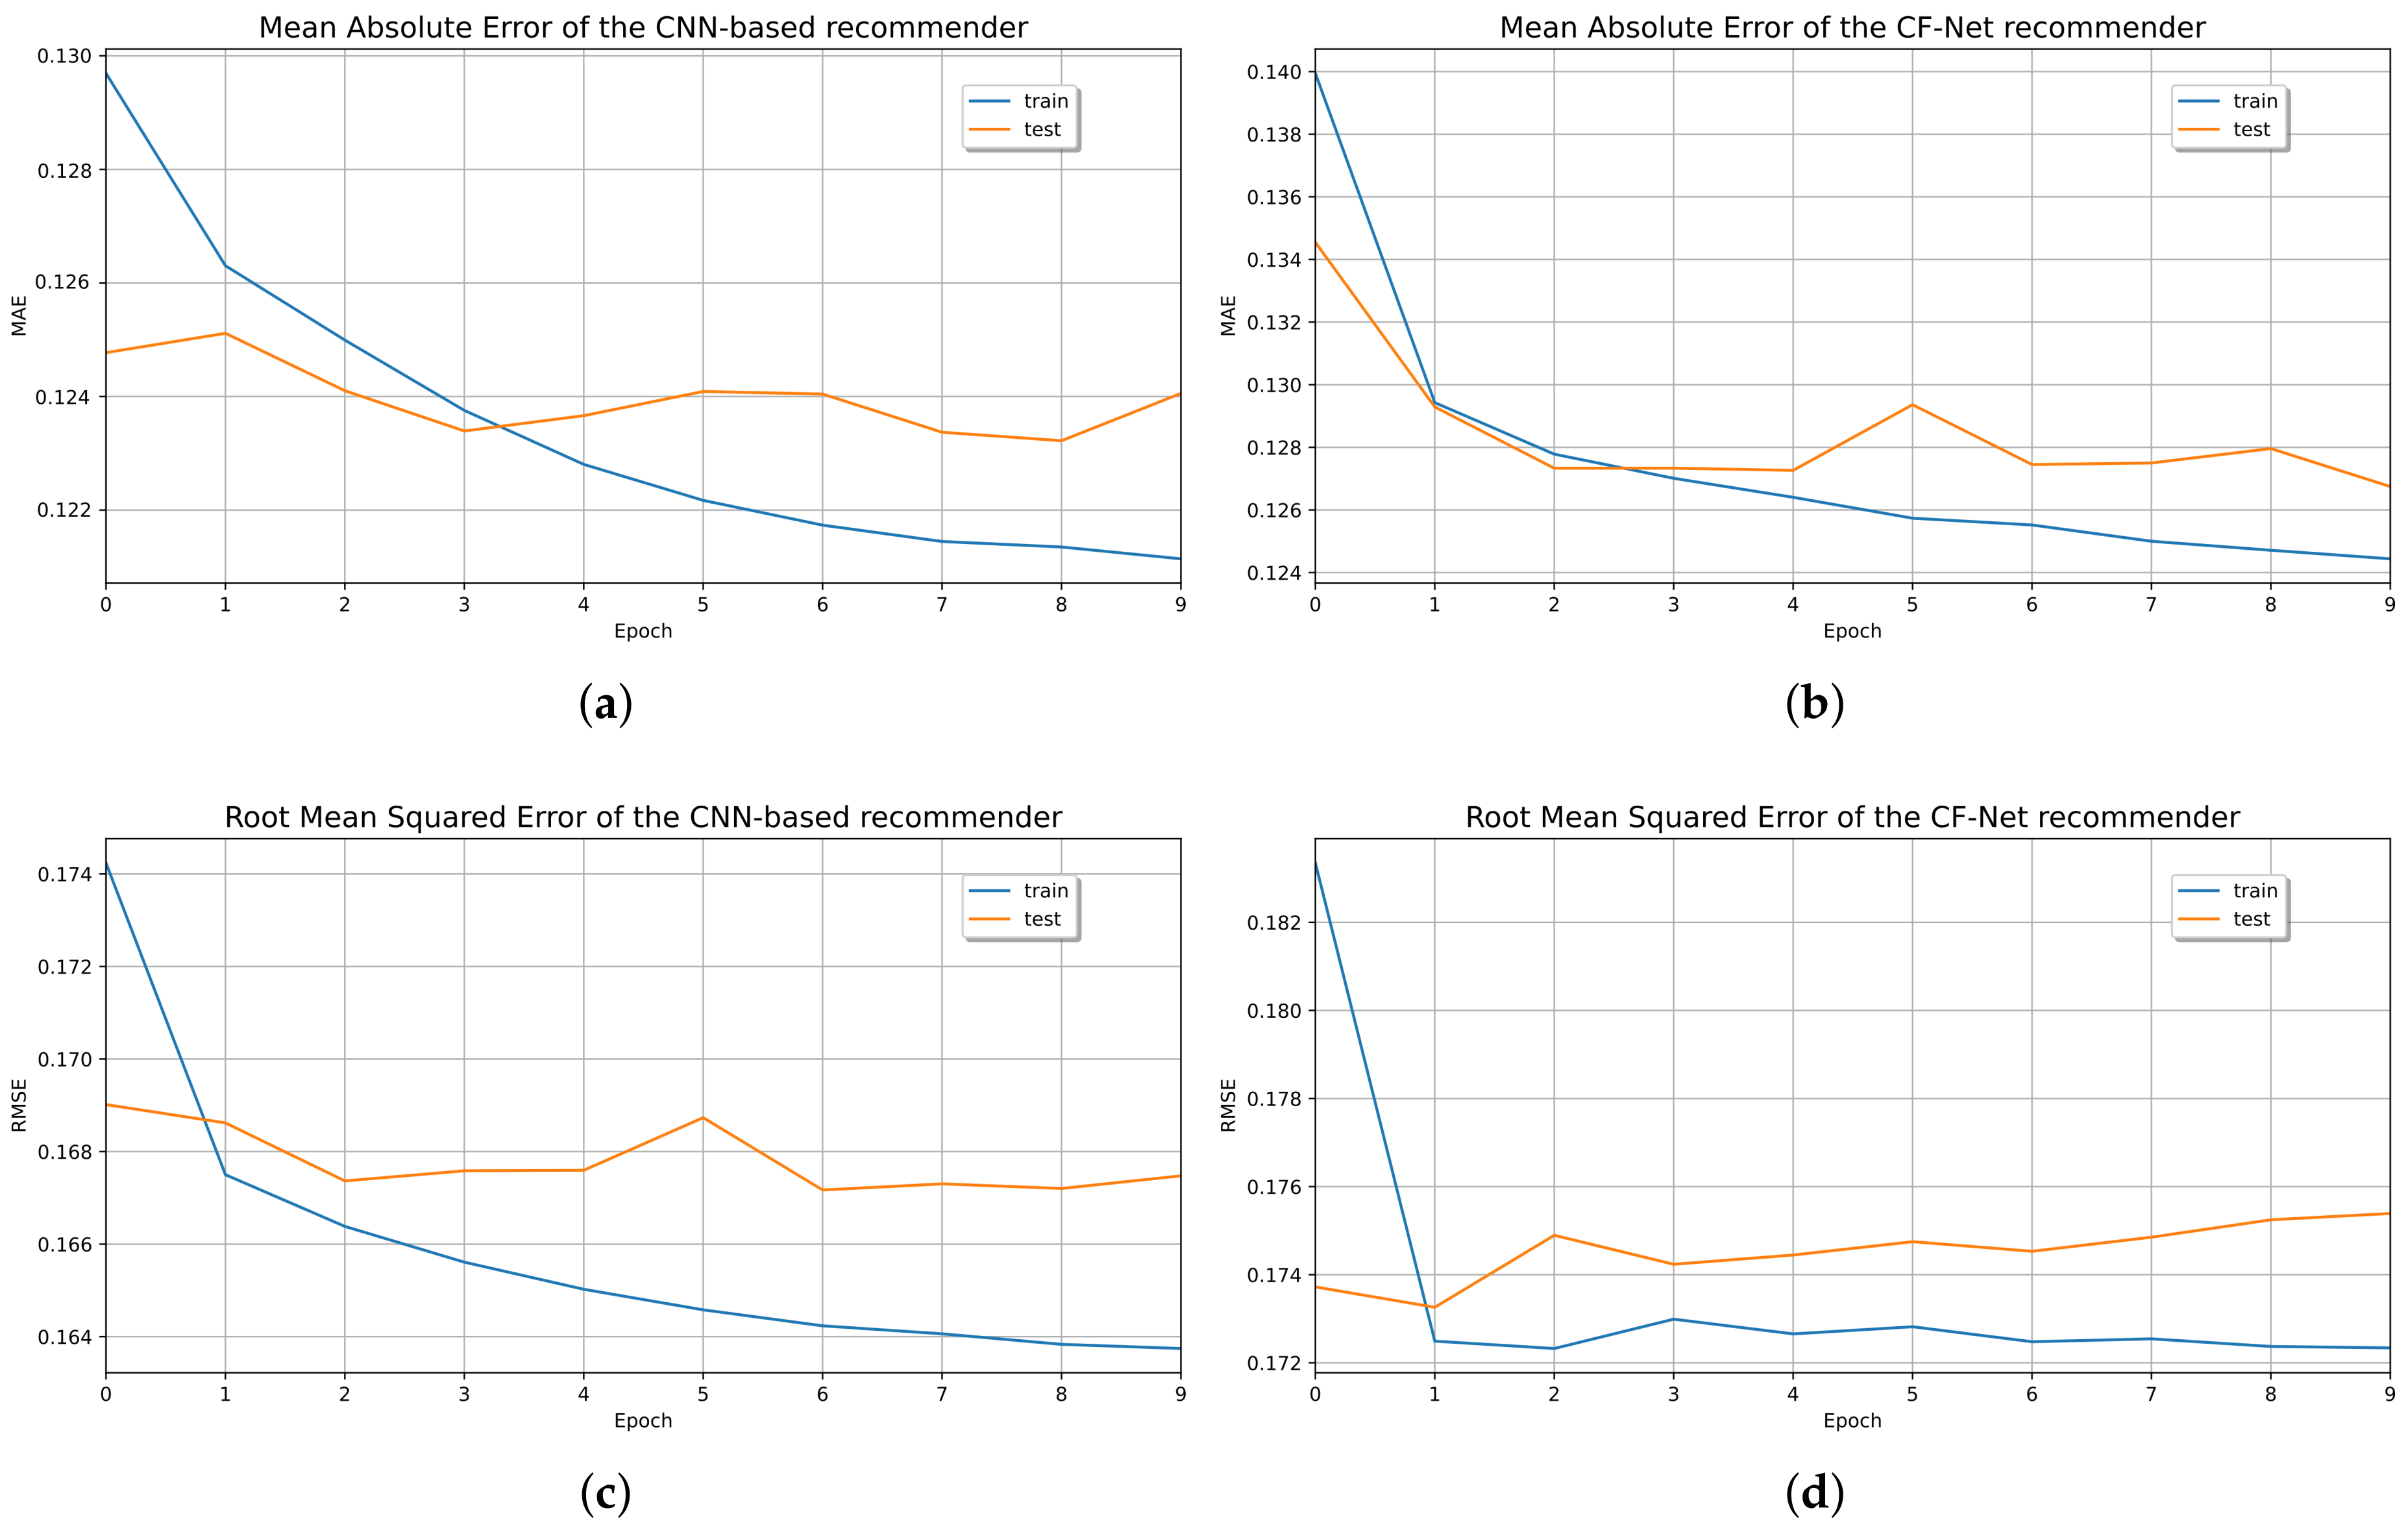
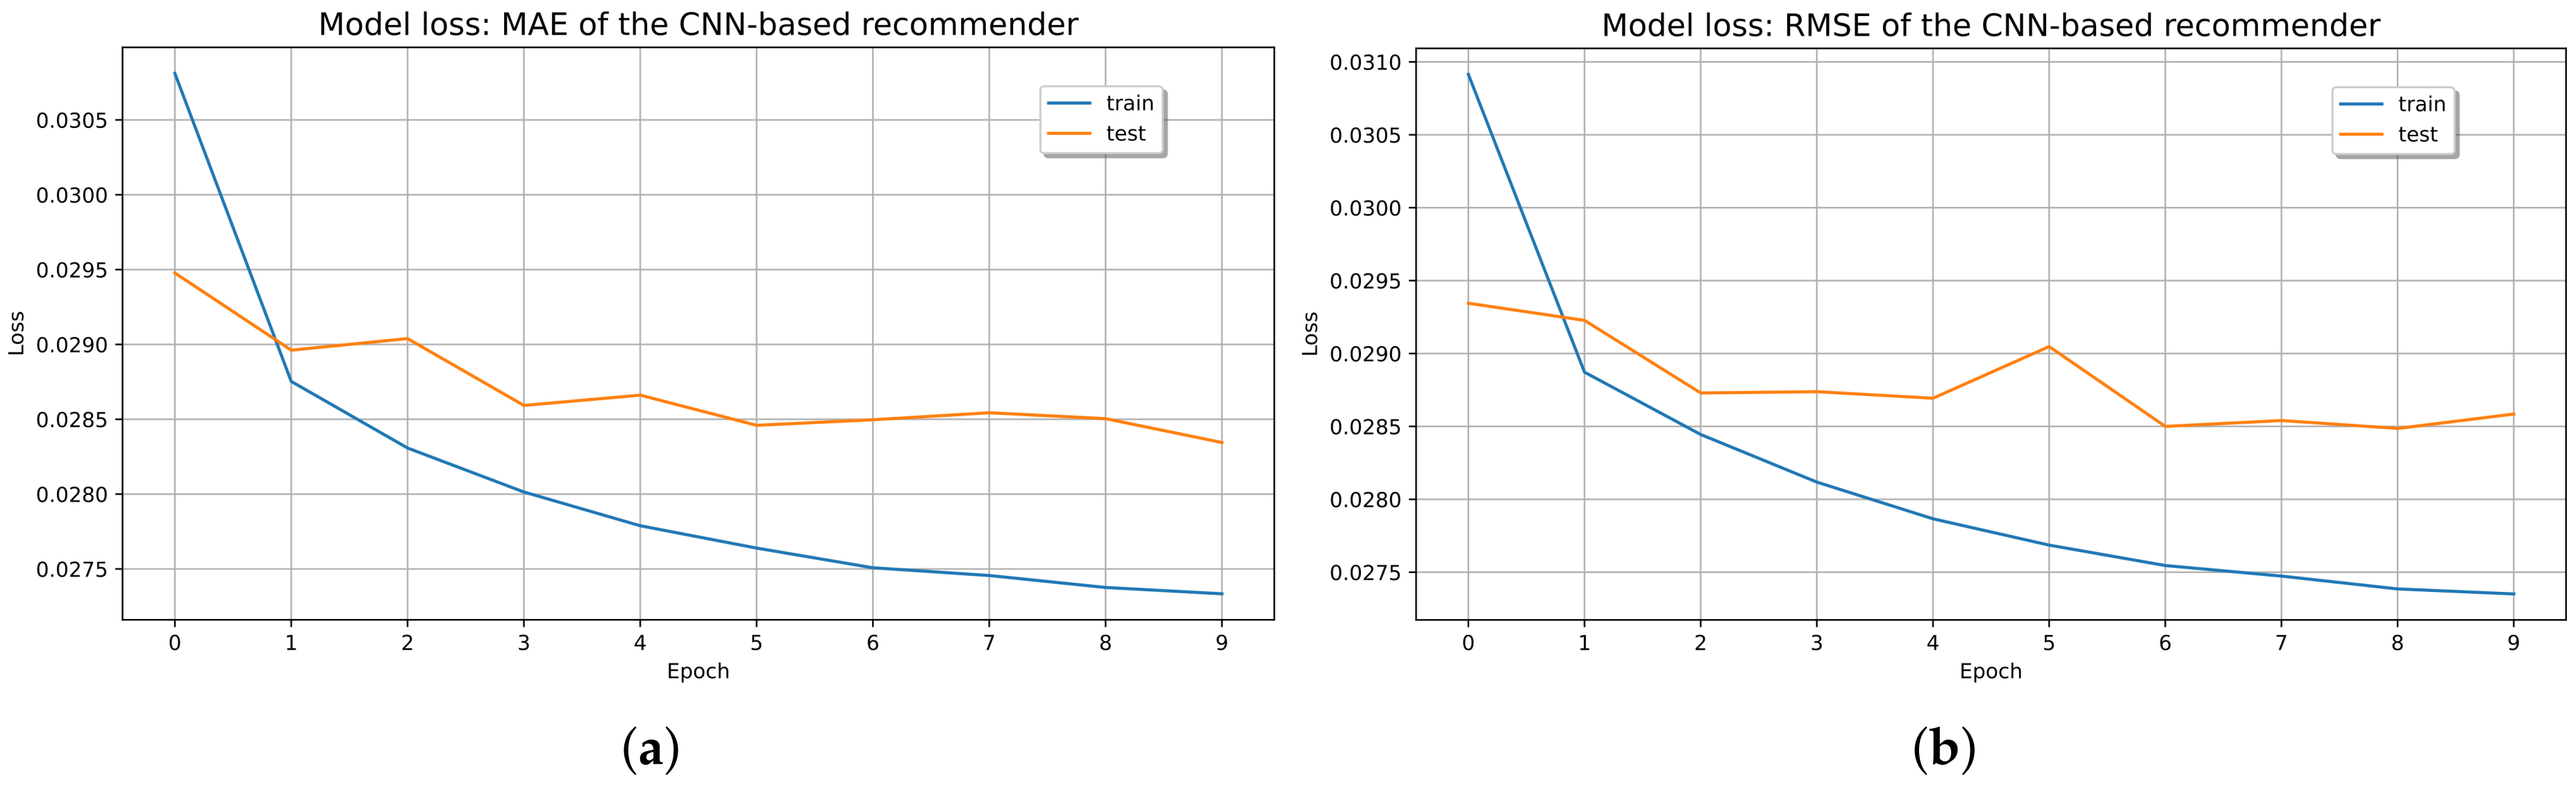
Table 3). On the contrary, in our study, the CF-CNN and CBF classifiers were used, the similarity between users was determined, and the context, preferences, and profile were taken into account. This way, optimal MAE and RMSE results were achieved compared to the other studies (see
Section 5.2).
Concerning MIC and following the comparison of results (see
Section 5.1.1), it is recommended to parameterize the number of sufficient physiological instances for each ES. In the experiment, better results were obtained with 30 instances of HR for each ES, with a distance between instances of five seconds.
It is necessary to deal with the imbalance of emotion classes in this ER system, which is logical since human behavior predominates in certain emotional types, although the contextual stimulus differs. For instance, a happy person tends to feel more frequent emotions from the happiness quadrant (HVHA). Then in the emotional register, an imbalance of classes is created for the other quadrants. For this reason, combined K-SMOTE and TL techniques were applied for balancing the minority emotional classes. It was also experimented with the elimination of the instances of a minority class, in this case, sadness (LVLA), to improve the performance of the classifier, although the performance improved (see
Table 4 and
Table 5). This procedure is not recommended because it biases the emotional behavior and this can lead to overfitting of the model.
The main contributions of this research were:
An algorithm that synchronizes the emotional labeling of a physiological time series in an adjustable and sliding window (see
Section 4.5).
An algorithm that creates emotional segments (see
Section 4.6) according to the process of an emotion formulated by Norman [
14].
The MEB app (see
Section 4.4) replaces the paper recording of the emotional spectrum that was done with SAM.
An emotional dataset, heart rate recording, and emotion recording were created from the data collection of the Xiaomi Mi Band wearable devices and the MEB app of 18 participants of the experiment (see
Section 3).
Source code for the implementation of the TERS-ER model (see
Section 4.8).
Future research would focus on merging multimodal physiological datasets to the TERS-ER architecture to optimize the affective detection of users. The system could incorporate contextual information on the environment and travel routes to increase user satisfaction.
Furthermore, this research is part of the second of five phases of a TE recommendation macro-project. Future areas of research would involve the following:
Definition of an emotion recognition model from a publicly available emotional dataset. In this case, the AMIGOS dataset was used [
16].
Definition of the model: This corresponds to the results of this paper, where we defined the TERS-ER architecture.
Consolidation of the ES dataset for the cold start: Replicating the experiment on a larger scale and in a controlled environment to consolidate a large ES dataset with better performance indicators in emotional detection from HR data.
TERS-ER production: users in the context of their daily life, months or weeks before planning their TE, use low-cost wearable devices (Xiaomi mi band) and the application (TE recommender) on their smartphone to collect in this period the HR data. Subsequently, the HR data collected from the user will be labeled with the emotions according to the ES dataset, and the remaining stages of the model are applied to make the respective recommendation.
Improvement of the TERS-ER: Defines the ability of the dataset to learn by itself from the new instances generated by the production environment, using advanced ML techniques such as, for instance, reinforcement learning or deep reinforcement learning [
19].


 ,
, 


