
Analysis of the Influence of the Breaking Radiation Magnetic Field of a 10 kV Intelligent Circuit Breaker on an Electronic Transformer


Abstract
:1. Introduction
2. Test Platform
2.1. Structure of Tested Intelligent Switch
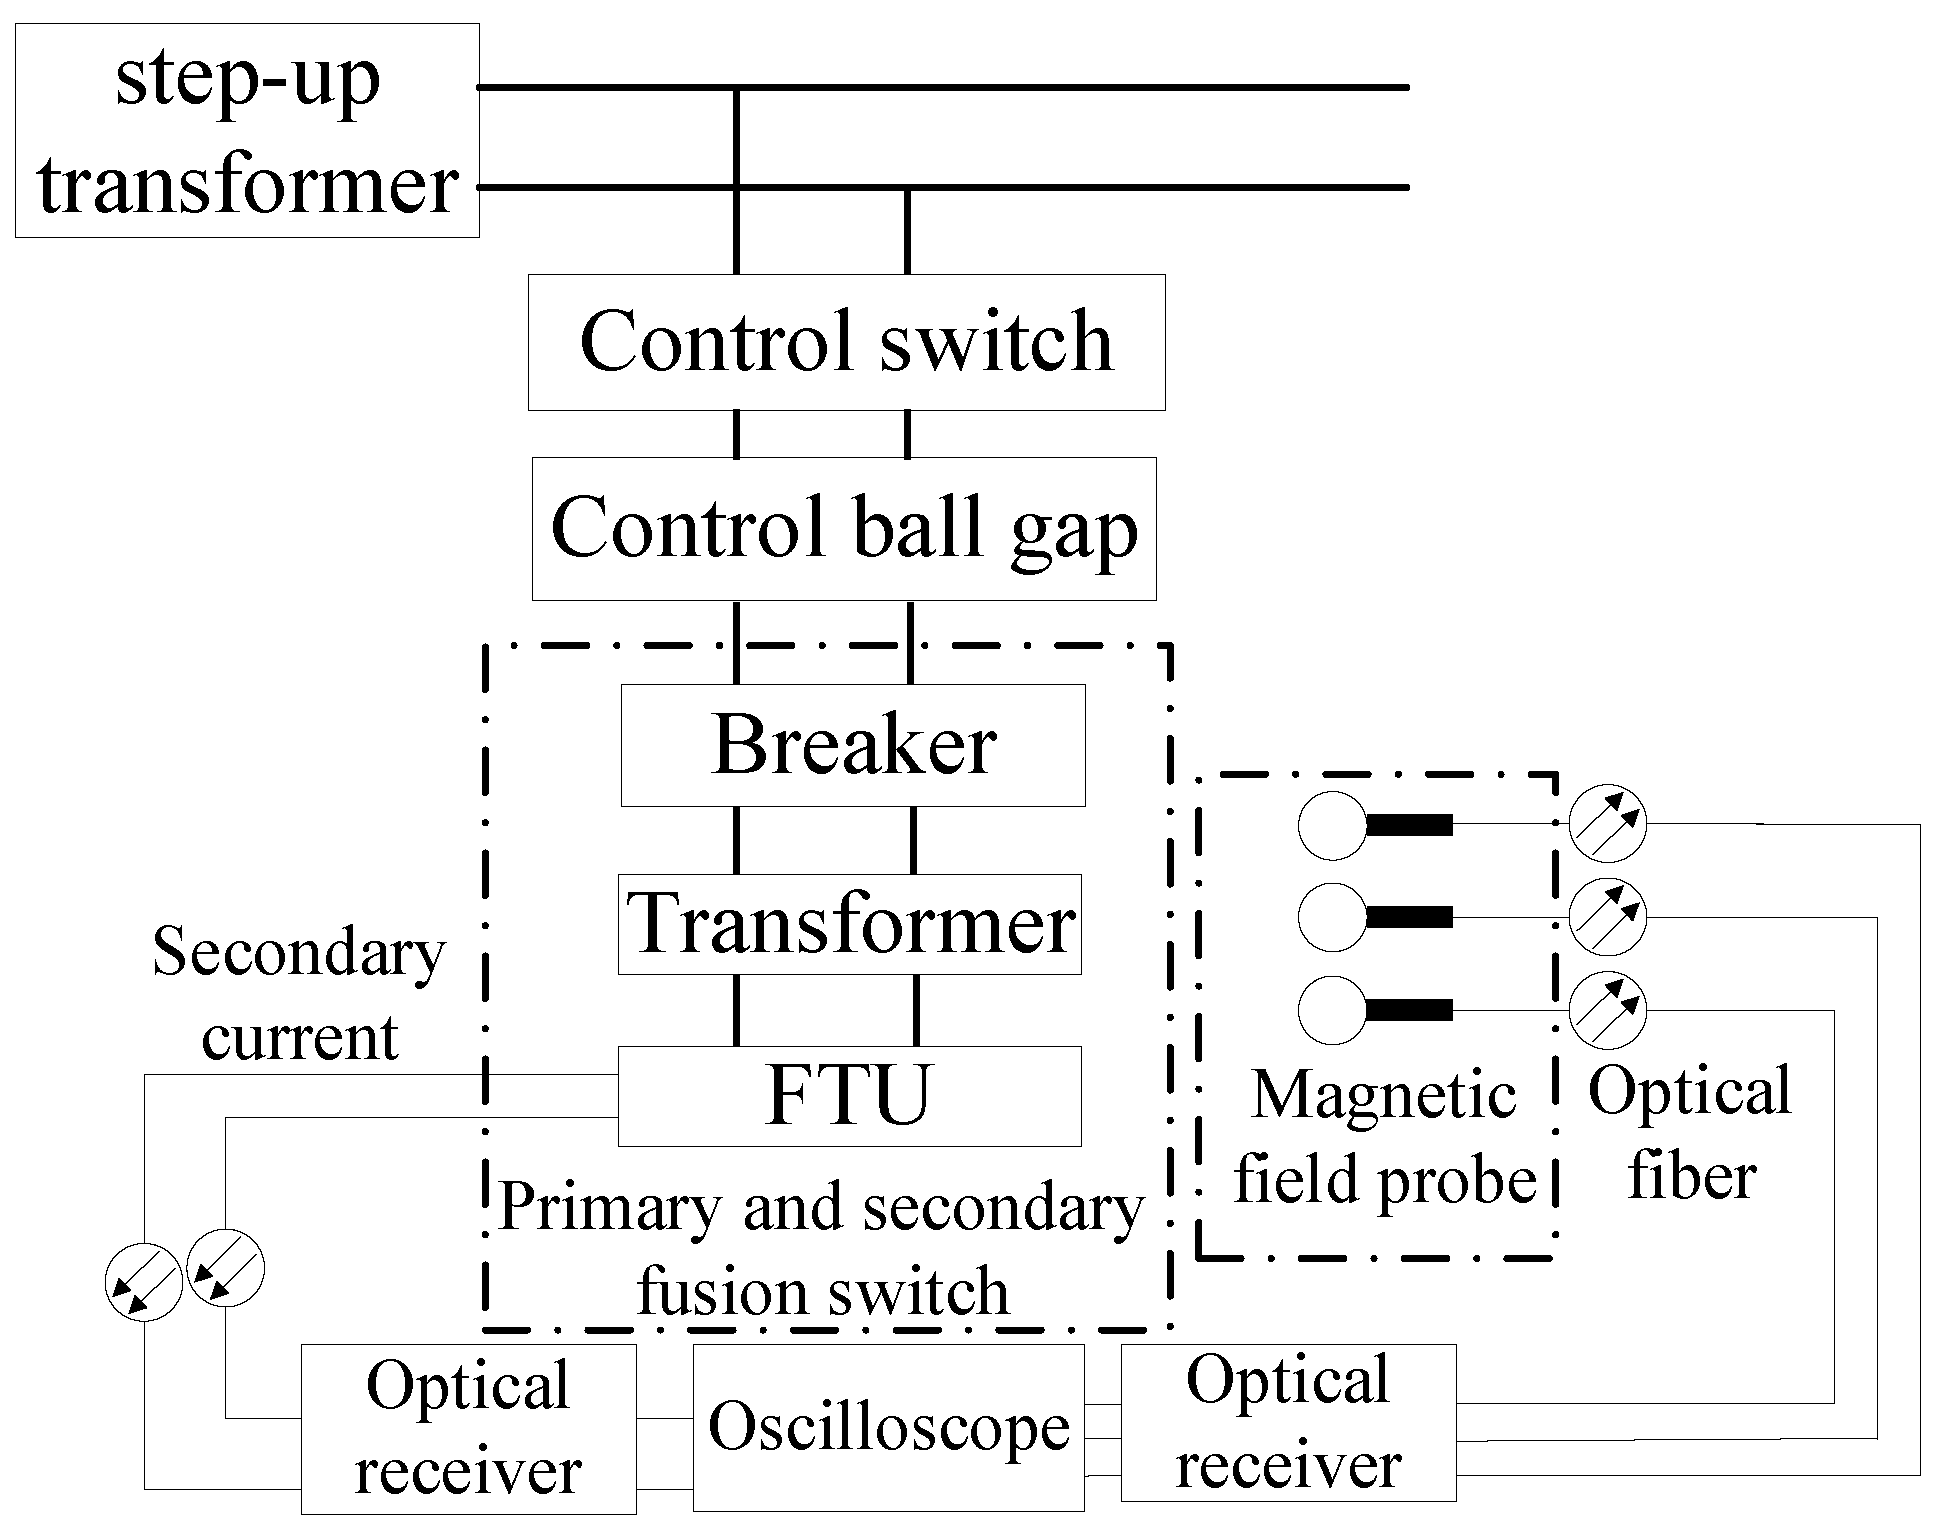
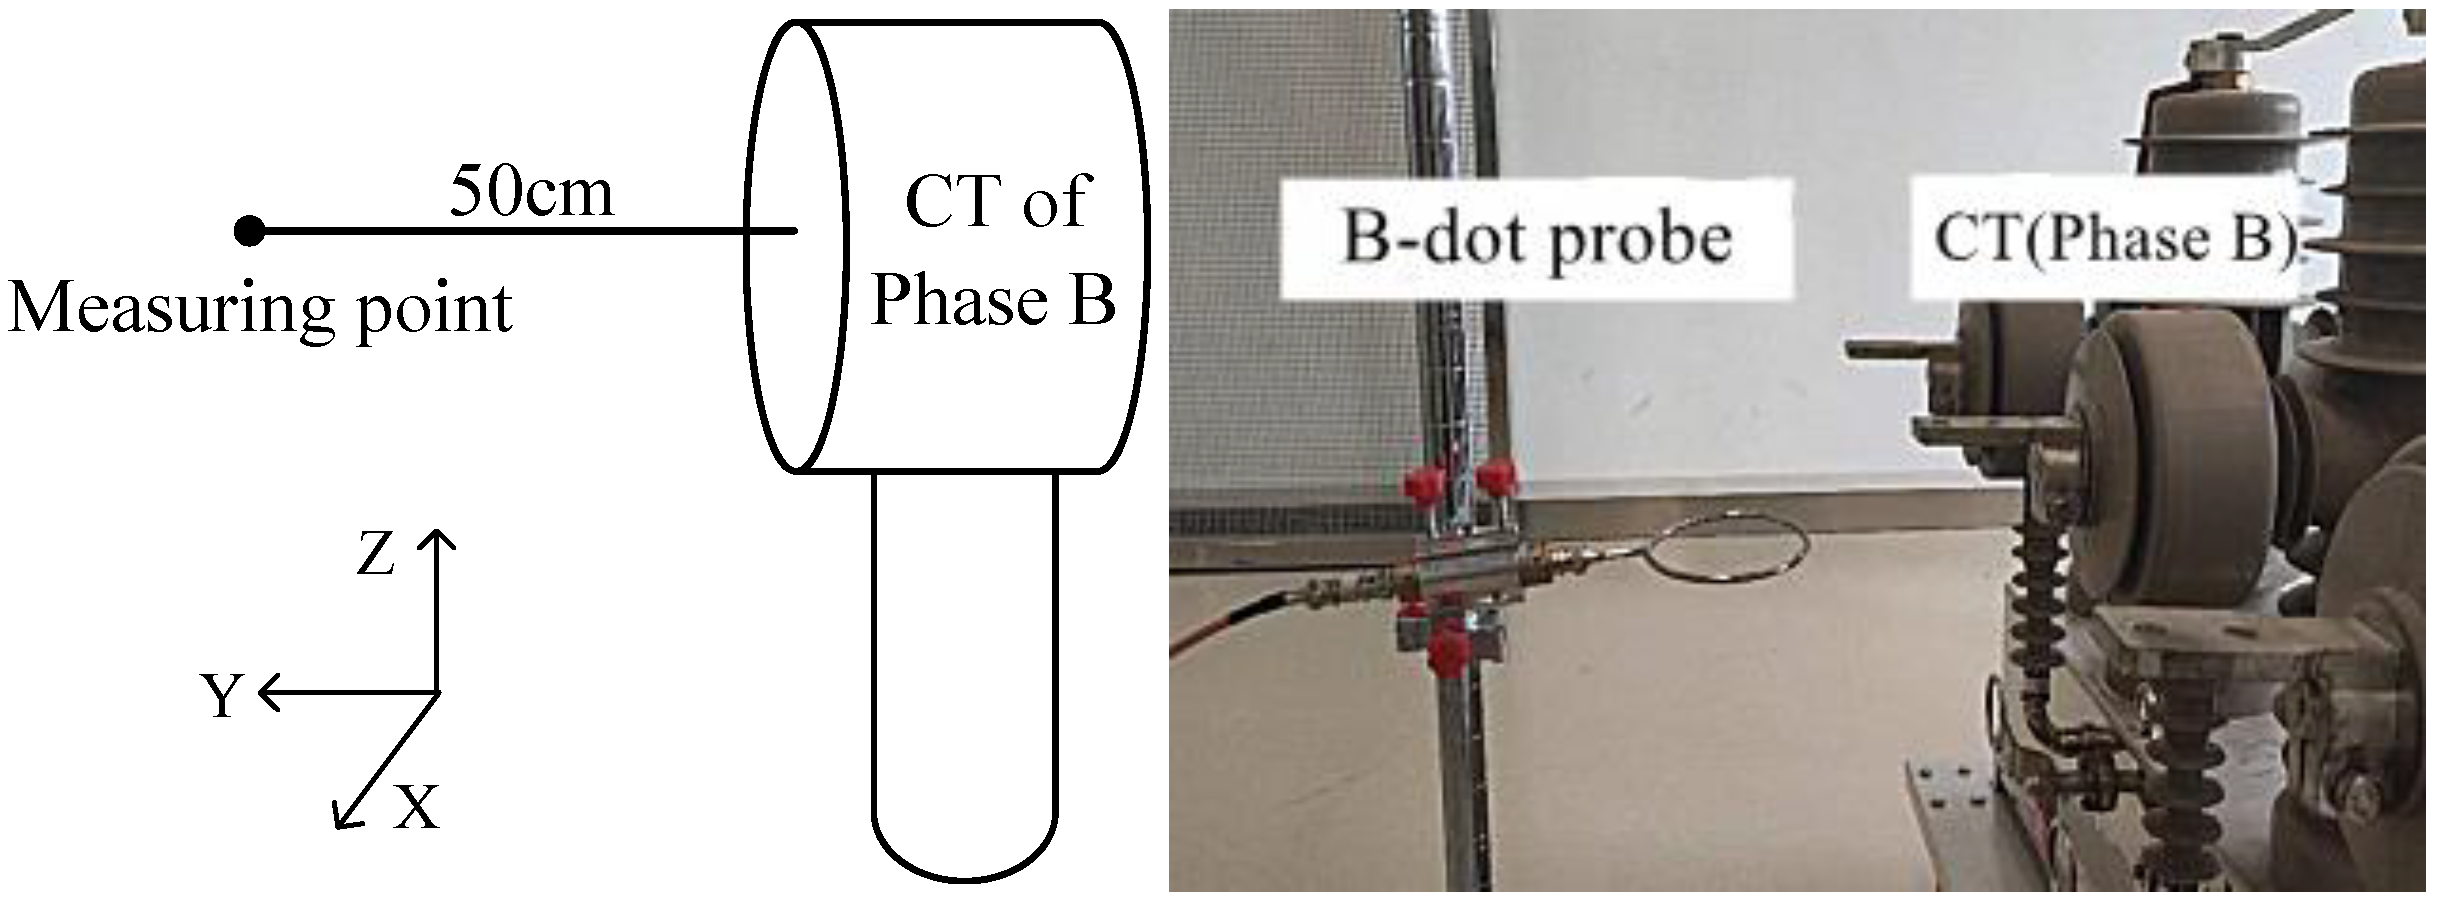
2.2. Test Principle and Method
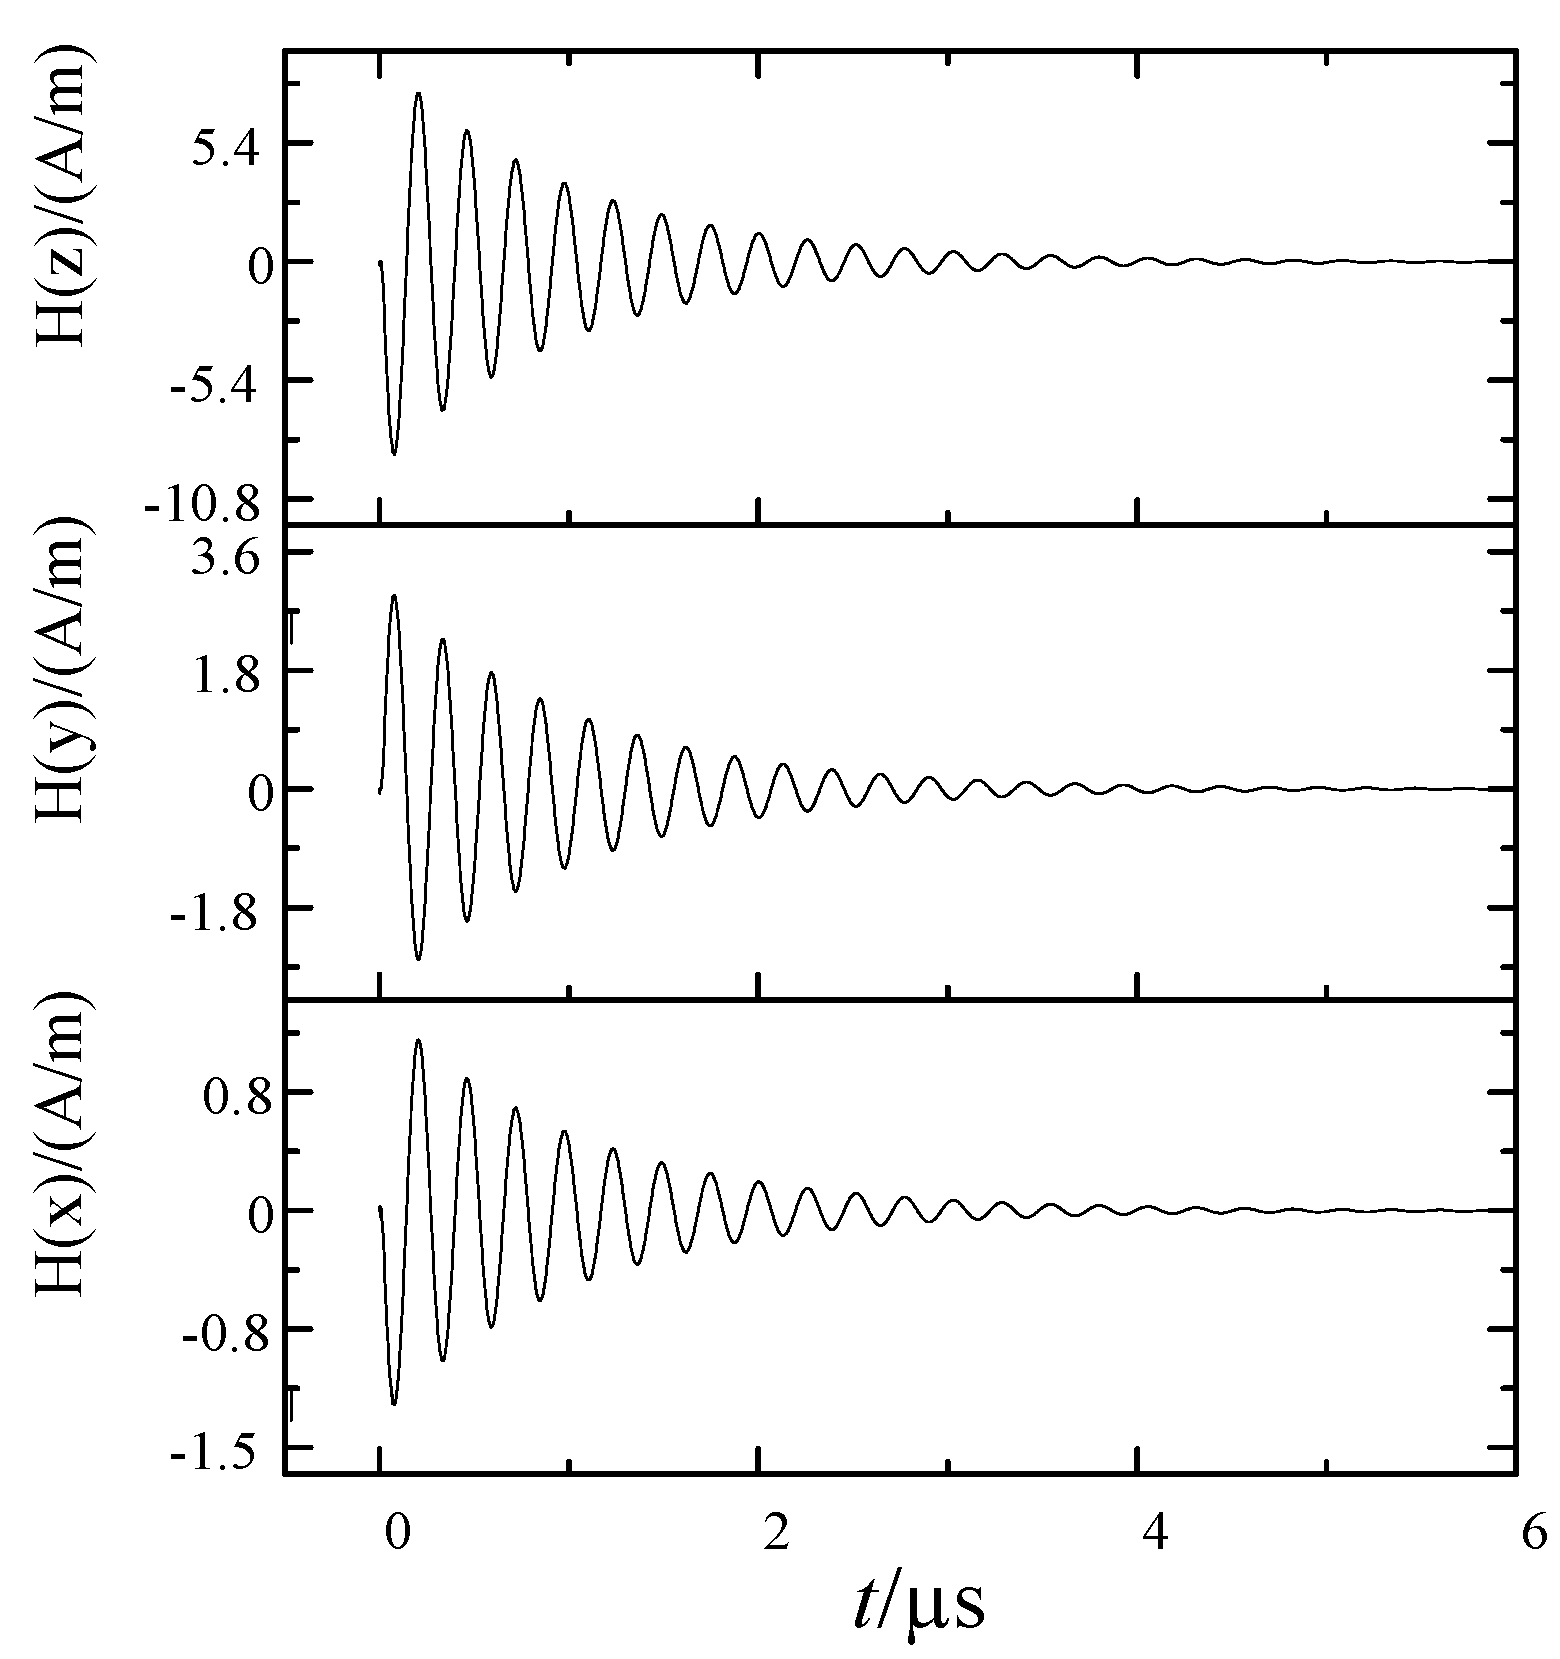
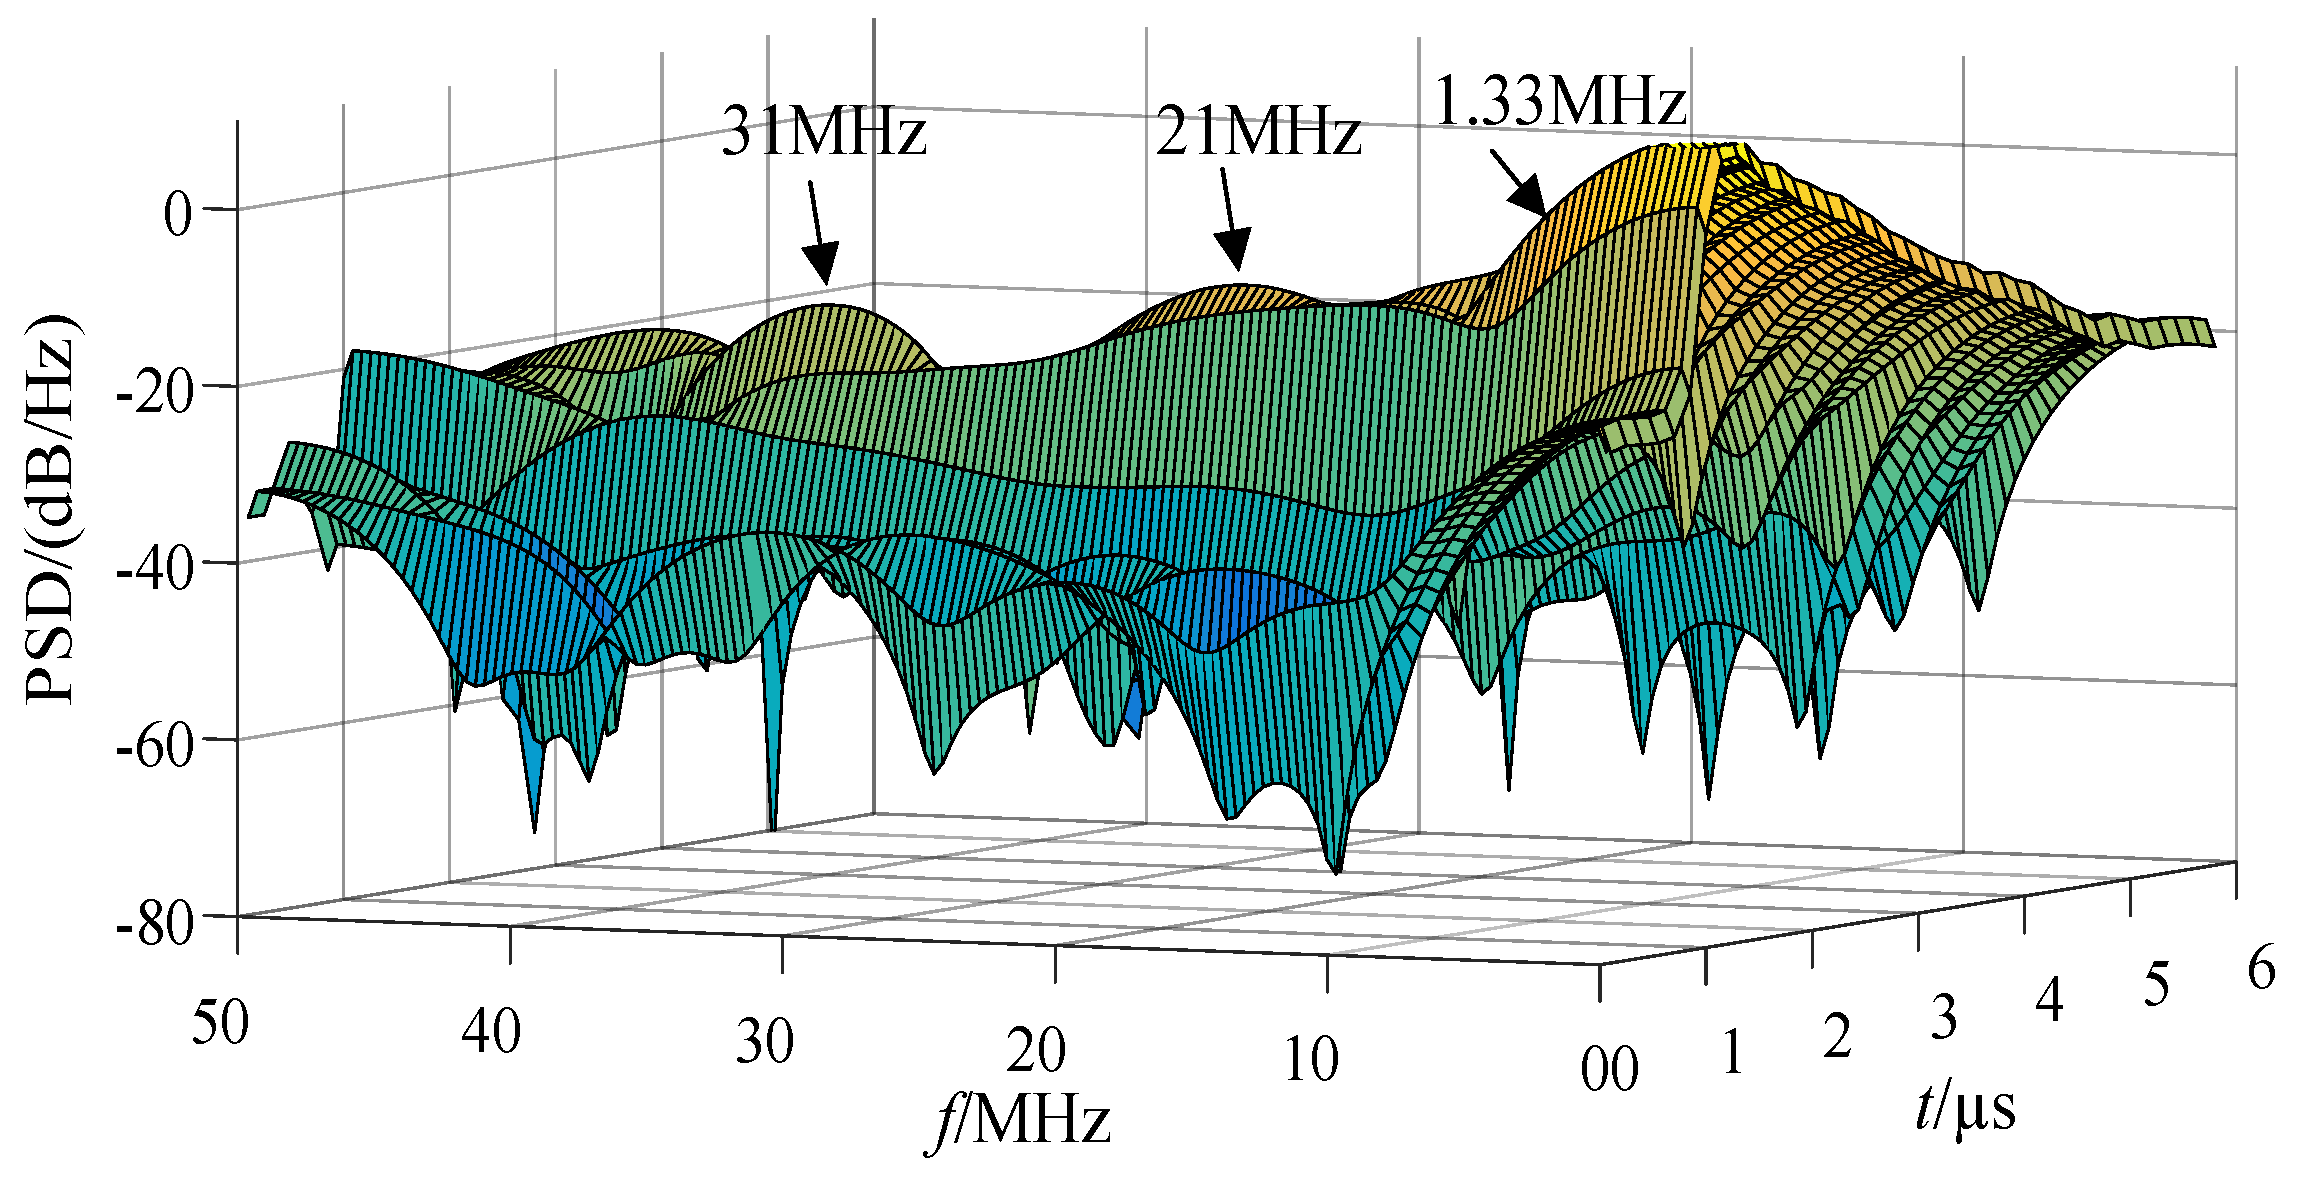
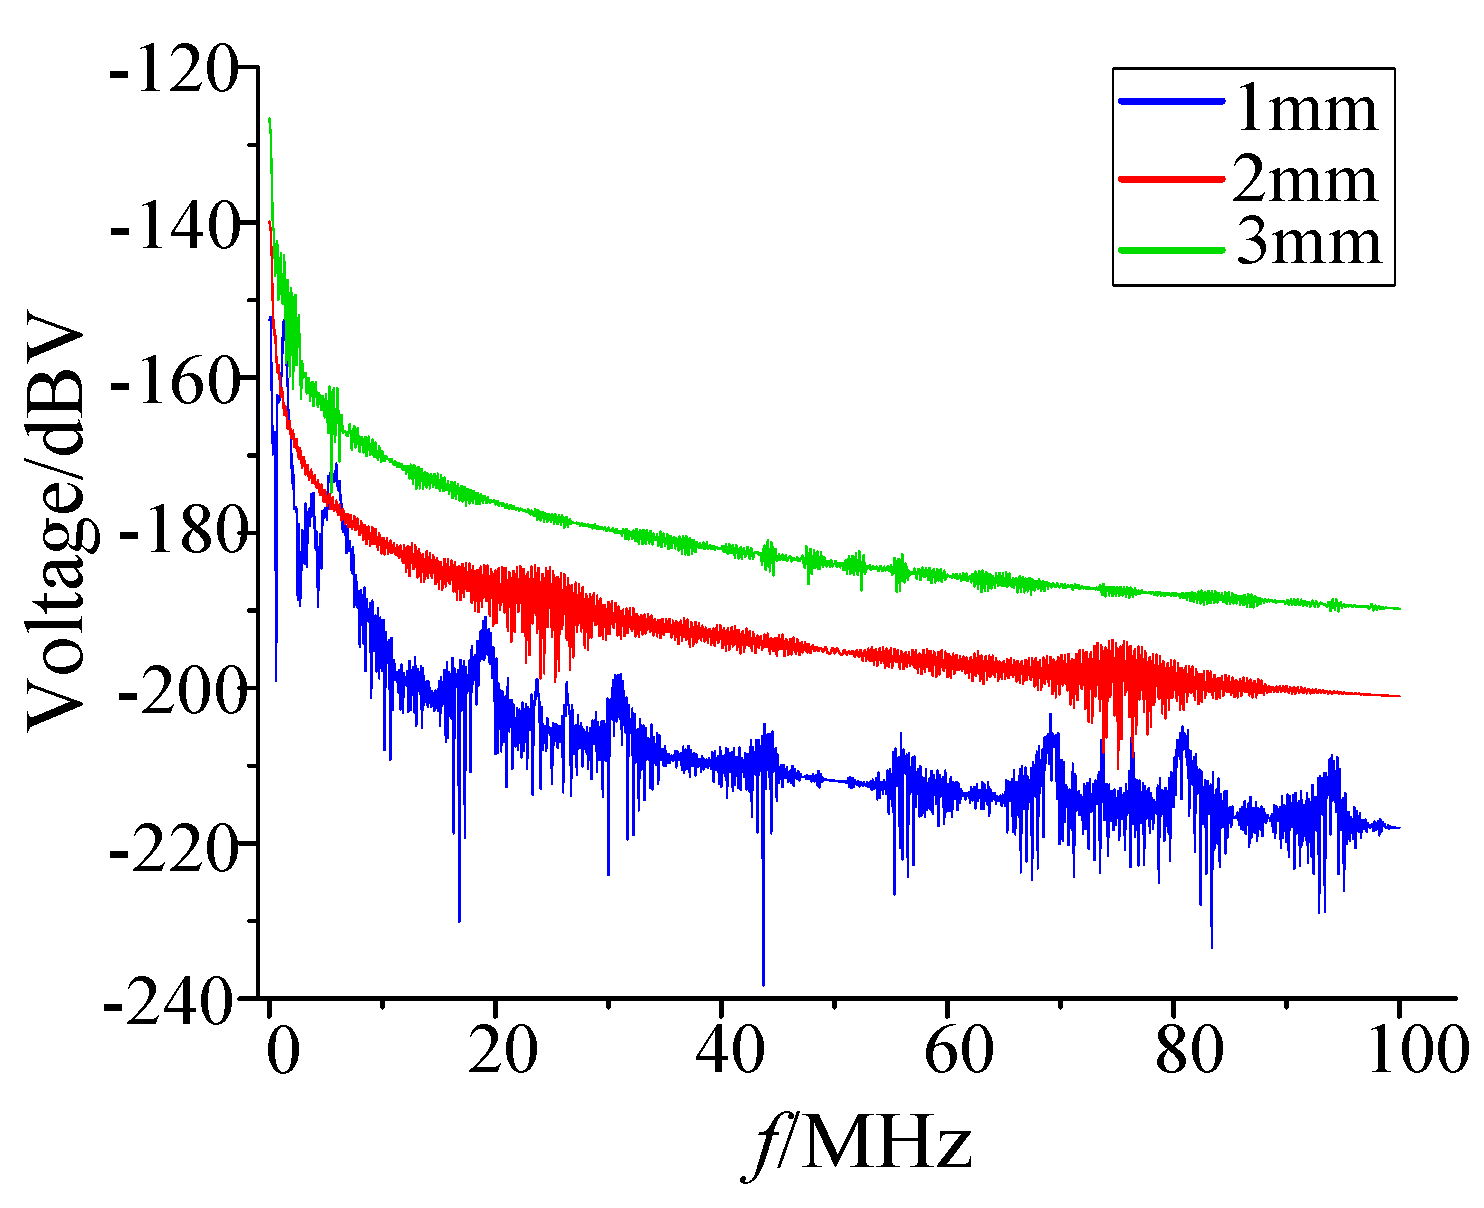
3. Analysis of Test Results
4. Electromagnetic Field Simulation and Result Comparison
4.1. Finite Integral Time Domain Method
4.2. Simulation Calculation of Radiated Magnetic Field
5. Analysis of Influence of Radiated Magnetic Field on Intelligent Unit
5.1. Shielding Effectiveness Analysis of Fedder Terminal Unit (FTU)
5.2. Differential Mode Interference Calculation of Combined Unit
6. Conclusions
- (1)
- It is feasible and effective to evaluate the anti strong electromagnetic disturbance ability of the electronic transformer in the primary and secondary integration switch by using the ball gap discharge simulation electromagnetic disturbance test;
- (2)
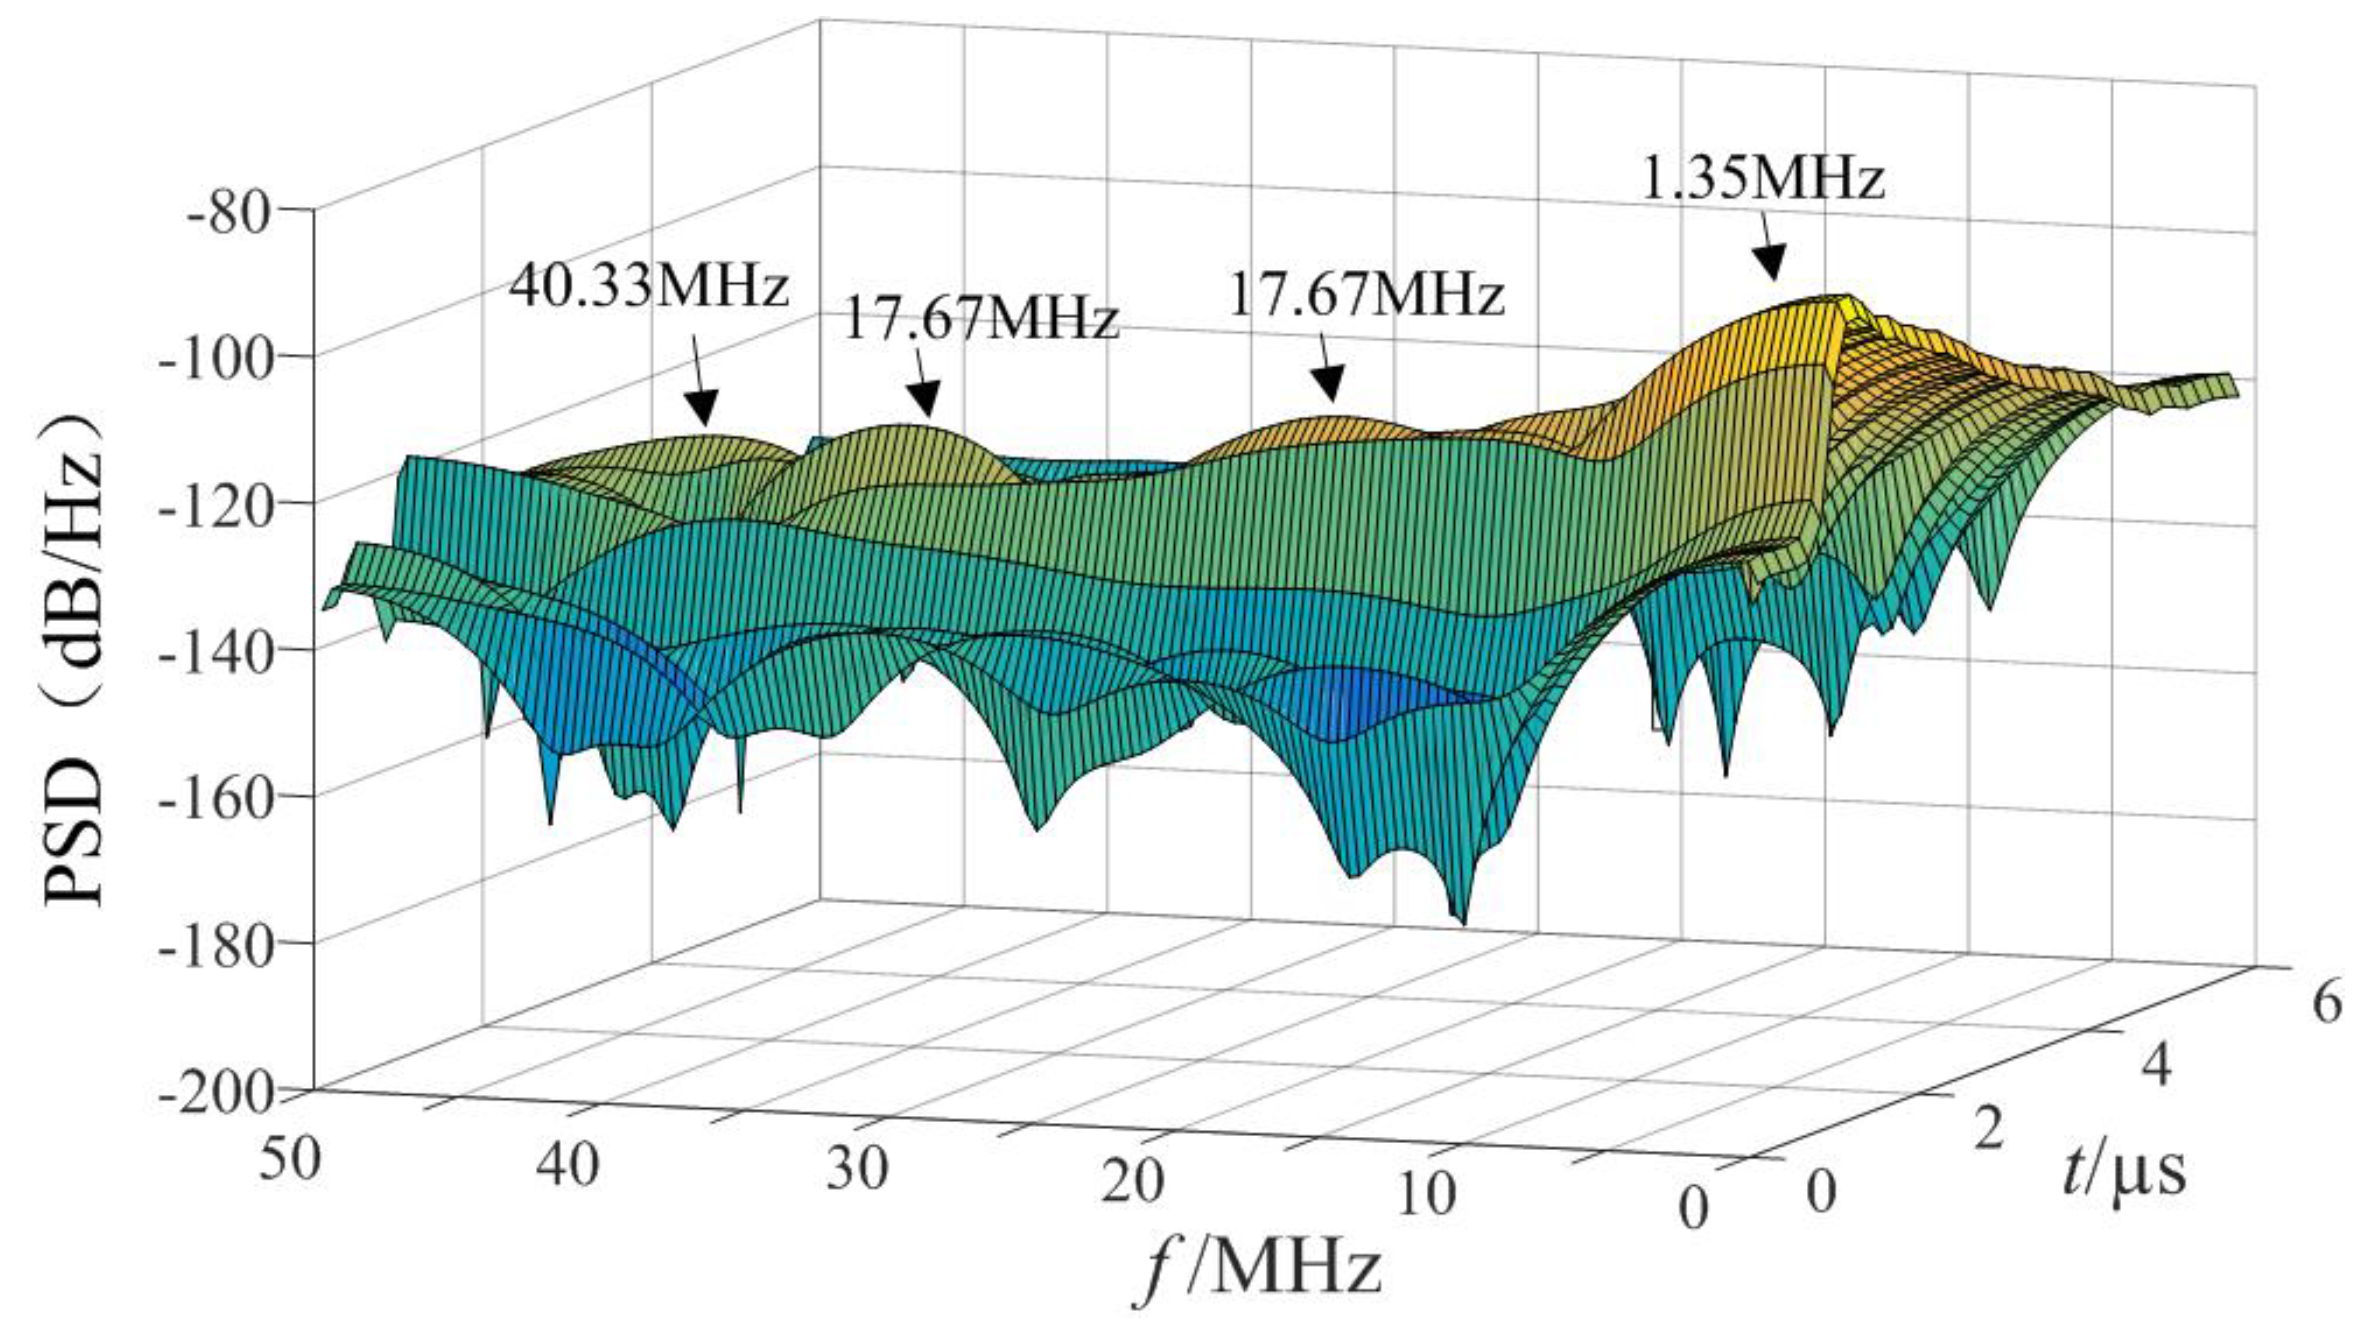
- The simulated electromagnetic disturbance test method can simulate the arc short-circuit fault in the distribution network system, which is equivalent and consistent with the actual working conditions on site. Under the action of strong electromagnetic disturbance, the magnetic field intensity near the electronic transformer exceeded the existing standard range, and the maximum magnetic field intensity could reach 50 A/m; in terms of frequency, high frequency components above 1 MHz were abundant. There were many high-frequency components above 30 MHz, and the source of these components is worthy of further research and exploration;
- (3)
- The shielding effectiveness of the protective body of the merging unit of the electronic transformer was analyzed. Its shielding effect had limitations, and the shielding effectiveness below 78 MHz was relatively weak; the space radiated magnetic field produced a differential mode voltage of up to 7.62 V on the power line of the merging unit. This interference is likely to lead to the measurement error of the electronic transformer, and the chip may be damaged under repeated similar interference.
Author Contributions
Funding
Institutional Review Board Statement
Informed Consent Statement
Data Availability Statement
Conflicts of Interest
References
- Mingotti, A.; Peretto, L.; Tinarelli, R. Toward the Standardization of Limits to Offset and Noise in Electronic Instrument Transformers. Sensors 2020, 20, 4061. [Google Scholar] [CrossRef] [PubMed]
- Pan, F.; Chen, R.; Xiao, Y.; Sun, W. Electronic Voltage and Current Transformers Testing Device. Sensors 2012, 12, 1042–1051. [Google Scholar] [CrossRef] [PubMed] [Green Version]
- Sen, L.S.; Ying, S.Z. AC voltage sensor for primary and secondary integration of 12 kV distribution pole switches. High Volt. Eng. 2019, 45, 2818–2826. (In Chinese) [Google Scholar]
- Tong, Y.; Zhang, Q.; Ye, G.; Guo, K.; Liu, B.; Hu, B. Electromagnetic compatibility performance analysis of electronic transformer. High Volt. Eng. 2013, 39, 2829–2835. [Google Scholar]
- Li, Z.H.; Yu, J.; Li, Z.X.; Xu, Y. Analysis on research status of electromagnetic compatibility of electronic transformer. High Volt. Appar. 2017, 53, 220–226. (In Chinese) [Google Scholar]
- Zhao, J.; Chen, W.; Bian, K.; Ni, Y.; Teng, Z.; Zhao, Y. Spatial magnetic field distribution characteristics of UHV Gil pipe gallery under short circuit fault condition. High Voltage Eng. 2021, 1–7. (In Chinese) [Google Scholar] [CrossRef]
- Zhou, Q.; Zhen, J.; Gan, X.; Li, Q.; He, J. Simulation study on influence of high frequency conducted interference on Intelligent pole mounted switch protection of distribution network. Power Capacit. React. Power Compens. 2020, 41, 164–170. (In Chinese) [Google Scholar]
- Liu, Y.; Ren, W.; Feng, J.; Hu, X. Research on electromagnetic compatibility test port model of smart high voltage equipment. In Proceedings of the 6th Asia-Pacific Conference on Environmental Electromagnetics (CEEM), Shanghai, China, 6–9 November 2012; pp. 381–383. [Google Scholar]
- Wu, H.; Jiao, C.; Cui, X.; Liu, X.; Ji, J. Transient Electromagnetic Disturbance Induced on the Ports of Intelligent Component of intelligent sensor Due to Switching Operations in 500 kV GIS Substations. IEEE Access 2017, 5, 5104–5112. [Google Scholar] [CrossRef]
- Cheng, L.; Yu, H.; Liu, Z.; Zhu, Y.; Chen, F.; Wang, Y.; Liu, X.; Zhang, C.; Gao, J.; Wang, W. Study on Electromagnetic Interference of Electronic Transformer under Operation of 330 kV GIS Disconnector. In Proceedings of the 2018 2nd IEEE Conference on Energy Internet and Energy System Integration (EI2), Beijing, China, 20–22 October 2018; pp. 1–4. [Google Scholar]
- Li, P.; Hunag, D.; Ruan, J.; Zhu, C.; Niu, X.; Pu, Z. Research on electromagnetic interference of post switch on secondary intelligent equipment. Trans. China Electrotech. Soc. 2015, 30, 27–37. (In Chinese) [Google Scholar]
- Li, P.; Hunag, D.; Ruan, J.; Niu, X.; Zhu, C. Electromagnetic interference of 10 kV switchgear on secondary intelligent equipment. Power Syst. Technol. 2015, 39, 110–117. (In Chinese) [Google Scholar]
- He, X.; Zhao, H.; Cheng, X.; Xu, M.; Zhu, J.; Ma, J. Influence of lightning impulse voltage on measurement accuracy of primary and secondary integration complete equipment for distribution. Electr. Power Autom. Equip. 2020, 40, 214–221, 214. (In Chinese) [Google Scholar]
- Fan, W.; Wu, Y.; Zhao, Y.; Guan, S.; Yu, Y.; Geng, Y. A simulation analysis method for distribution switch radiation field. High Volt. Appar. 2017, 53, 11–16. (In Chinese) [Google Scholar]
- Zhihong, X. Principle and Practical Technology of Electronic Transformer; China Electric Power Press: Beijing, China, 2018. [Google Scholar]
- Cheng, L.; Zhang, H.; Yi, T.; Xie, Y.; Feng, Y.; Liu, X. Insulation defect detection method of disconnector based on 3D electric field time-frequency analysis. High Volt. Eng. 2020, 46, 14. (In Chinese) [Google Scholar]
- Chen, W.; Li, Z.; Sun, G.; Dai, M.; Liu, W.; Li, C.; Wang, L.; Wang, H.; Chen, G.; Yao, T.; et al. Experimental study on ultra fast transient overvoltage characteristics in UHV gas insulated switchgear. Proc. CSEE 2011, 31, 38–47. (In Chinese) [Google Scholar]
- Azpúrua, M.A.; Pous, M.; Silva, F. Decomposition of Electromagnetic Interferences in the Time-Domain. IEEE Trans. Electromagn. Compat. 2016, 58, 385–392. [Google Scholar] [CrossRef]
- Mingotti, A.; Peretto, L.; Tinarelli, R. Effects of Multiple Influence Quantities on Rogowski-Coil-Type Current Transformers. IEEE Trans. Instrum. Meas. 2020, 69, 4827–4834. [Google Scholar] [CrossRef]
- Li, C.; Yu, Z.; Zeng, R.; Luo, B.; Chen, X.; He, J. Experimental study on shielding effectiveness of shielding body under impact electric field. High Volt. Eng. 2014, 40, 2849–2854. (In Chinese) [Google Scholar]
- GB/T 35732-2017 National Standards of the People’s Republic of China. Technical Specification for Intelligent Terminal of Distribution Automation, 2017.17-1423; National Standards Committee of the People’s Republic of China: Beijing, China, 2017. [Google Scholar]
- Li, P.; Huang, D.; Ruan, J.; Niu, X. EM Measurements between MV Switching Sources and Colocated Sensitive Circuit. IEEE Trans. Electromagn. Compat. 2015, 57, 513–521. [Google Scholar] [CrossRef]
- Pous, M.; Azpúrua, M.A.; Silva, F. Measurement and Evaluation Techniques to Estimate the Degradation Produced by the Radiated Transients Interference to the GSM System. IEEE Trans. Electromagn. Compat. 2015, 57, 1382–1390. [Google Scholar] [CrossRef] [Green Version]
- Zhao, J.; Chen, W.; Gao, F.; Zhang, J. Calculation and analysis of the influence of space magnetic field on intelligent components in transformer lightning impulse test. Proc. CSEE 2016, 36, 3981–3990. (In Chinese) [Google Scholar]
- IEC 870-2-1:1995. Telecontrol Equipment and Systems—Part 2: Working Conditions—Part 1: Power Supply and Electromagnetic Compatibility; IEC: Geneva, Switzerland, 1995. [Google Scholar]


| Distance of Ball Gap/mm | Average Breakdown Voltage/kV | Discharge Current Amplitude/A |
|---|---|---|
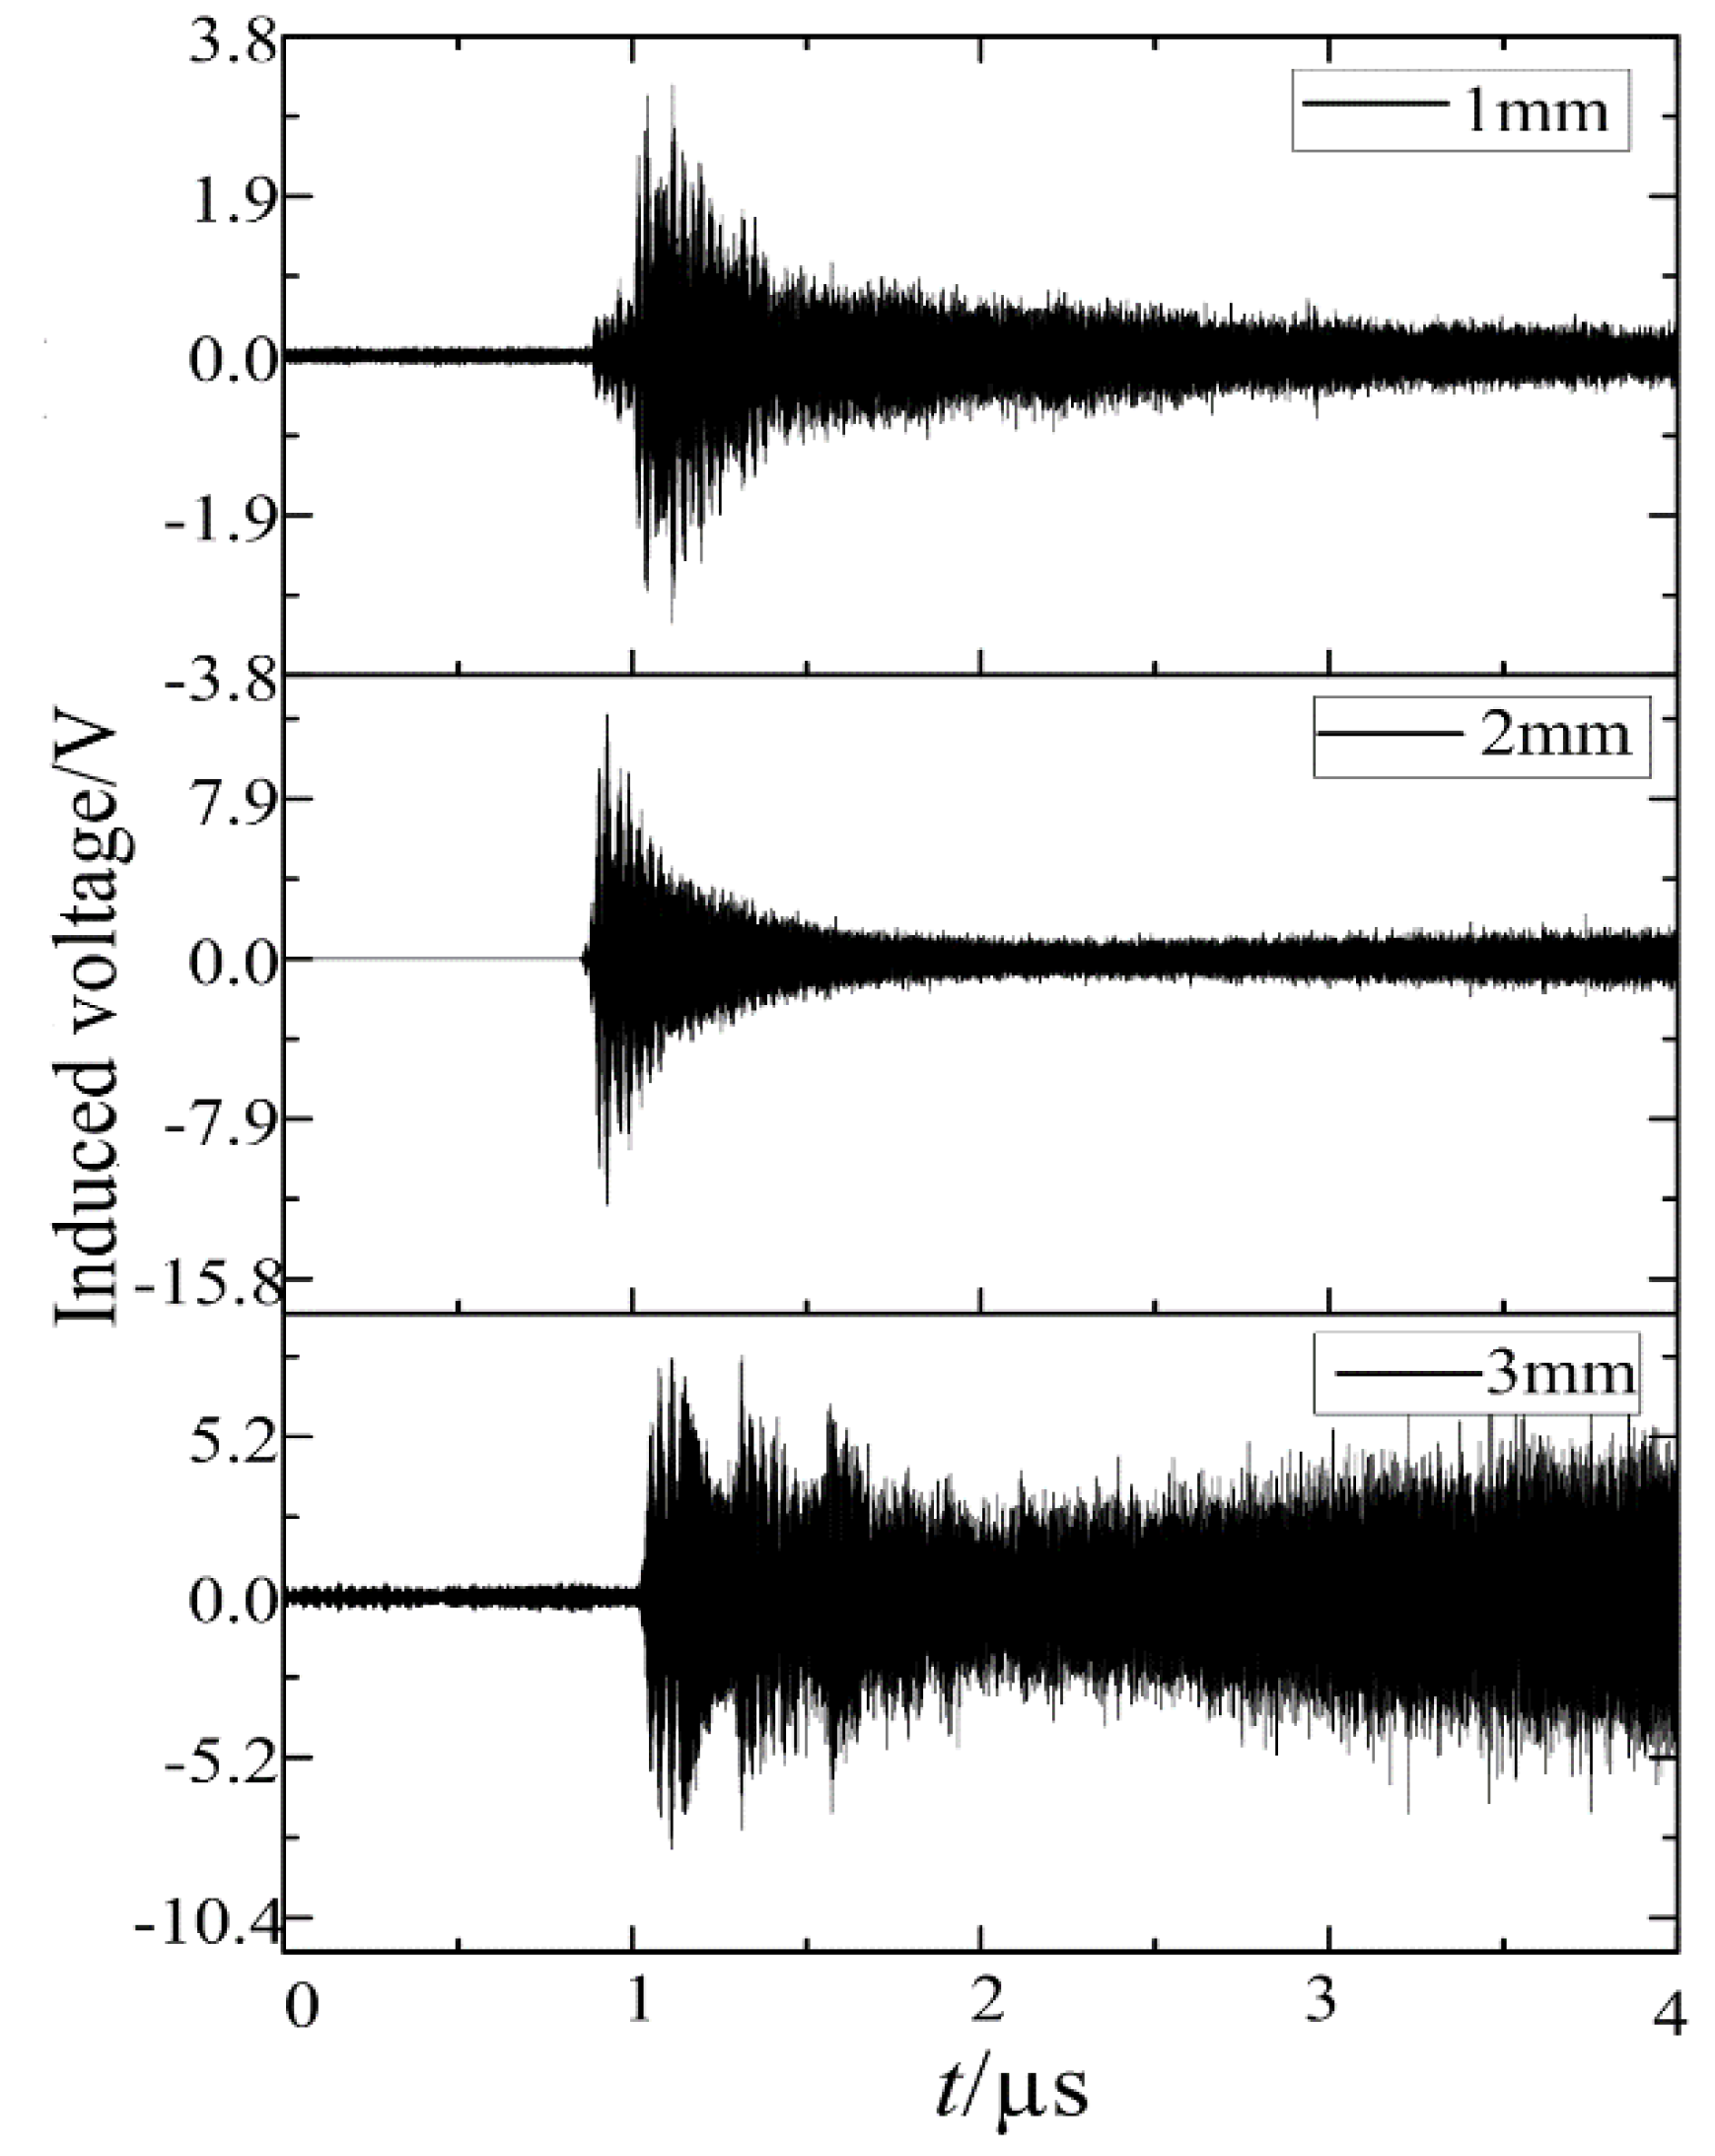
| 1 | 2.44 | 95–102 |
| 2 | 4.64 | 125–132 |
| 3 | 7.62 | 176–216 |
Publisher’s Note: MDPI stays neutral with regard to jurisdictional claims in published maps and institutional affiliations. |
© 2021 by the authors. Licensee MDPI, Basel, Switzerland. This article is an open access article distributed under the terms and conditions of the Creative Commons Attribution (CC BY) license (https://creativecommons.org/licenses/by/4.0/).
Share and Cite
Lu, W.; Duan, J.; Cheng, L.; Lu, J.; Du, X. Analysis of the Influence of the Breaking Radiation Magnetic Field of a 10 kV Intelligent Circuit Breaker on an Electronic Transformer. Sensors 2021, 21, 7800. https://doi.org/10.3390/s21237800
Lu W, Duan J, Cheng L, Lu J, Du X. Analysis of the Influence of the Breaking Radiation Magnetic Field of a 10 kV Intelligent Circuit Breaker on an Electronic Transformer. Sensors. 2021; 21(23):7800. https://doi.org/10.3390/s21237800
Chicago/Turabian StyleLu, Wenchao, Jiandong Duan, Lin Cheng, Jiangping Lu, and Xiaotong Du. 2021. "Analysis of the Influence of the Breaking Radiation Magnetic Field of a 10 kV Intelligent Circuit Breaker on an Electronic Transformer" Sensors 21, no. 23: 7800. https://doi.org/10.3390/s21237800
APA StyleLu, W., Duan, J., Cheng, L., Lu, J., & Du, X. (2021). Analysis of the Influence of the Breaking Radiation Magnetic Field of a 10 kV Intelligent Circuit Breaker on an Electronic Transformer. Sensors, 21(23), 7800. https://doi.org/10.3390/s21237800