
Assessing the Current Integration of Multiple Personalised Wearable Sensors for Environment and Health Monitoring


Abstract
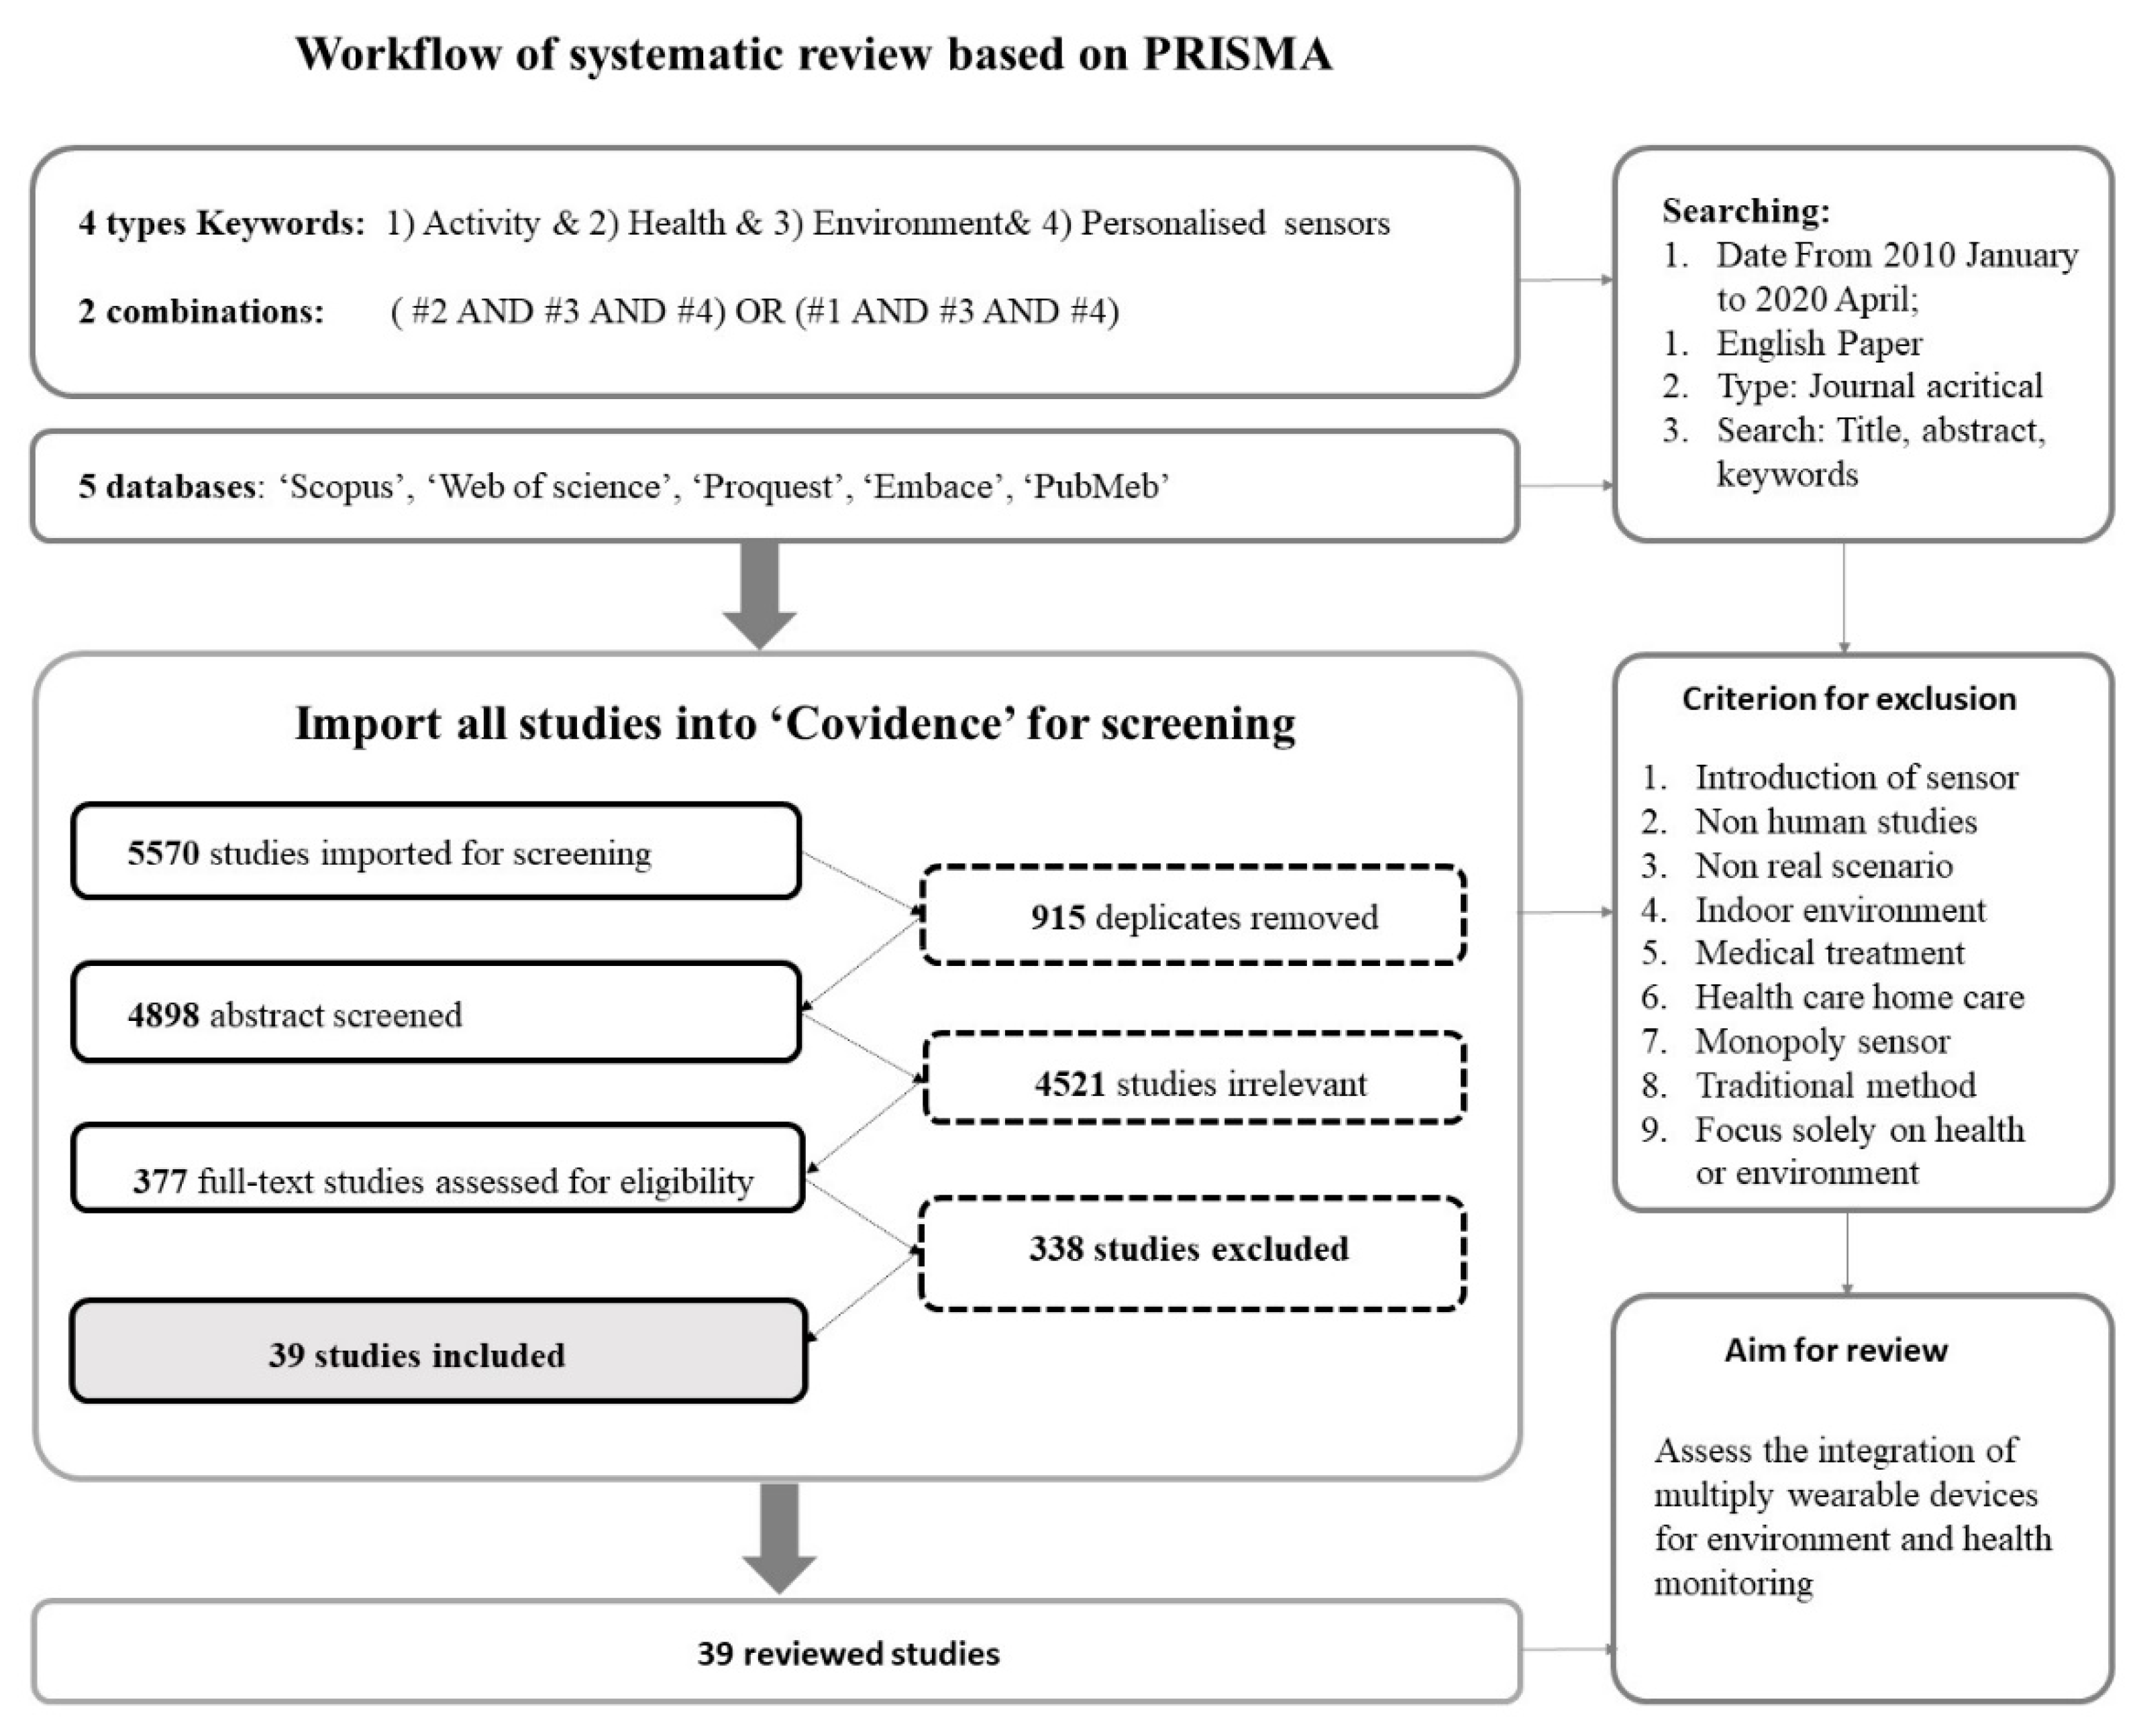
:1. Introduction
- Assess current applications integrating multiple sensors for health and outdoor environment monitoring,
- Examine the main challenges related to the integration, and
- Propose workable approaches to optimize the integration and improve the feasibility of integration for future studies.
2. Methods
2.1. Search Strategy
2.2. Selection Criteria
2.3. Data Extraction
2.4. Quality Assessment

| NO | RE | Temporal Resolution | Subject Area 1 | Location | Study Setting | Gender | Sample Size (Include) (Age Group) | Environment Type | Geo-Data | Contextual Data | Health |
|---|---|---|---|---|---|---|---|---|---|---|---|
| 1 | Benita, et al. [27] | 10 min | Social science, Environmental Science | Singapore | Pre-defined (700 m walking) | Female | 10 (aged 21–25) | Physical | Yes | Yes | Activity and Mental health |
| 2 | Benita and Tunçer [28] | 10 min | Environmental Science, Agricultural and Biological Sciences | Singapore | Pre-defined (700 m walking) | Female | 10 (aged 21–25) | Physical and Urban | Yes | Yes | Activity and Mental health |
| 3 | Birenboim, et al. [29] | 30 min | Social science, Earth and Planetary Sciences | Netherlands | Pre-defined (3 km walking) | Male | 15 (12) (average age of 21.8) | Urban | Yes | Yes | Mental health |
| 4 | Bohmer, et al. [30] | 7–10 days | Arts and humanities, Medicine, Neuroscience | Netherlands | Natural | Both | 82 (48) (average age of 62.3) | Physical | No | No | Activity |
| 5 | Boissy, et al. [31] | 14 days | Medicine | Canada | Natural | Both | 75 (54) (aged 55–85) | Urban | Yes | No | Activity |
| 6 | Bolliger, et al. [32] | 15 days | Environmental Science, Medicine | Belgium | Natural | Both | 5 (Adults) | Social | Yes | No | Mental health and Psychology |
| 7 | Borghi, et al. [33] | 14 days (repeat in two seasons) | Environmental Science, Medicine | Italy | Pre-defined (90 km home-to-work) | - | 1 (Adult) | Physical | Yes | No | Physical health |
| 8 | Burgi, et al. [34] | 7 days | Multidisciplinary | Switzerland | Natural | Both | 123 (119) (aged 11–14) | Urban | Yes | Yes | Activity |
| 9 | Butt, et al. [35] | 14 days | Medicine | USA | Natural | Both | 20 (11) (aged 24–35) | Social | No | No | Activity |
| 10 | Cerin, et al. [36] | 7 days | Medicine, Health Professions | USA | Natural | Both | 84 (73/66) (aged 3–5 children and their parents) | Urban | Yes | No | Activity |
| 11 | Chaix, et al. [37] | 7 days | Medicine, Health Professions | France | Natural | Both | 319 (285) (average age of 50.2) | Urban | Yes | No | Activity |
| 12 | Chrisinger and King [38] | 20–25 mins | Medicine, Computer Science | USA | Pre-defined (One walk route) | Both | 14 (Adults) | Social and urban | Yes | No | Mental health |
| 13 | Dessimond, et al. [39] | 6.5/8 days | Engineering, Medicine, Computer Science | France | Natural | - | 1 (Adult) | Physical | Yes | Yes | Activity |
| 14 | Do, et al. [40] | 7 days | Environmental Science, Engineering, Earth and Planetary Sciences | USA | Natural | Both | 18 (Adults) | Physical | Yes | Yes | Activity |
| 15 | Doherty and Oh [41] | 3 days | Medicine, Health Professions | Canada | Natural | Both | 40 (37) (aged 32–75) | Urban | Yes | No | Physical health and Activity |
| 16 | Donaire-Gonzalez, et al. [42] | 1 day (repeat in three seasons) | Environmental Science | Europe (Five cities) | Natural | Both | 158 (average age of 61) | Physical | Yes | Yes | Activity |
| 17 | Doryab, et al. [43] | 16 weeks | Medicine | USA | Natural | Both | 188 (160) (college student) | Social | Yes | No | Activity |
| 18 | El Aarbaoui and Chaix [44] | 7 days | Environmental Science, Medicine | France | Natural | Both | 78 (75) (aged 34–74) | Physical | Yes | No | Physical health and Activity |
| 19 | Engelniederhammer, et al. [45] | Around Midday | Social science | China | Pre-defined (walk route with 4 street paths) | Both | 30 (average age of 24.77) | Social | Yes | No | Mental health and Psychology |
| 20 | Huck, et al. [46] | days | Environmental Science, Medicine | UK | Natural (different routes) | Male | 1 | Physical | Yes | No | Physical health |
| 21 | Johnston, et al. [47] | 18 h | Environmental Science, Medicine | USA | Natural | Both | 18 (10) (aged 15–17) | Physical | Yes | No | Psychology |
| 22 | Kanjo, et al. [48] | 45 min | Computer Science | UK | Pre-defined (shopping route) | Female | 40 (average age of 28) | Physical | Yes | No | Mental health and Psychology |
| 23 | Kim, et al. [49] | Hours | Social science, Environmental Science | USA | Pre-defined (1.26 km walking route) | Both | 30 (average age of 24.2) | Urban | Yes | No | Physical health and Activity |
| 24 | Kou, et al. [50] | A weekday and a weekend day | Social science, environmental Science, Engineering | USA | Natural | Both | 46 (33) (18–65) | Physical | Yes | No | Activity |
| 25 | Laeremans, et al. [51] | 7 days (three times in different seasons) | Environmental Science | Europe (three cities) | Natural | Both | 122 (average age of 35) | Physical | No | No | Physical health and Activity |
| 26 | Ma, et al. [52] | A weekday and a weekend day | Environmental Science | China | Natural | Both | 177 (97) (aged 18–60) | Physical | Yes | No | Activity |
| 27 | Ma, et al. [53] | A weekday and a weekend day | Social science, Earth and Planetary Sciences | China | Natural | Both | 177 (112) (aged 18–60) | Physical | Yes | Yes | Activity |
| 28 | Millar, et al. [54] | Hours | Social science, Environmental Science | Netherlands | Pre-defined (18 km long between urban and rural) | Both | 12 (half aged 18–24, the remaining half were older 55) | Urban | Yes | Yes | Mental health |
| 29 | Novak, et al. [55] | 7 days | Engineering, Medicine, Computer Science | Slovenia | Natural | Both | 2 (Adult) | Physical | No | No | Physical health |
| 30 | Ojha, et al. [56] | Hours | Engineering, Computer Science | Switzerland | Pre-defined (1.3 km walking) | - | 30 (-) | Physical and Urban | Yes | Yes | Mental health |
| 31 | Rabinovitch, et al. [57] | 4 days (twice in two non-consecutive weeks) | Medicine | USA | Natural | - | 30 (schoolchildren average age of 10) | Physical | Yes | No | Physical health |
| 32 | Resch, et al. [58] | Hours | Environmental Science, Medicine | Europe (two cities) | Natural | Both | 56 (over 18) | Urban | Yes | No | Mental health and Psychology |
| 33 | Roe, et al. [59] | Unassisted walking for 15–20 min | Medicine | USA | Pre-defined (two routes: “green” and “gray”) | Both | 11 (aged 65) | Physical | Yes | No | Physical Activity and Mental health and Psychology |
| 34 | Runkle, et al. [60] | 5 days | Environmental Science | USA (three sites) | Natural | Both | 66 (35) (Average age around 38/39) | Physical | Yes | No | Physical health |
| 35 | Rybarczyk, et al. [61] | Hours | Social science, Engineering | Germany | Natural (within 1.1 km2) | Both | 28 (aged 20–70) | Urban | Yes | Yes | Physical health and Activity |
| 36 | Shoval, et al. [62] | 1 day | Social science | Israel | Natural | Both | 144 (68) (aged over 18) | Urban | Yes | No | Mental health and Psychology |
| 37 | Steinle, et al. [63] | days, Repeat in winter and summer | Environmental Science | Scotland | Natural | - | 17 (-) | Physical | Yes | Yes | Activity |
| 38 | West, et al. [64] | 14 days | Social science, Environmental Science | Kenya | Natural | Both | 6 (aged 18–55) | Physical | Yes | Yes | Psychology |
| 39 | Zhang, et al. [65] | A weekday and a weekend day | Medicine, Computer Science | China | Natural | Both | 156 (138) (aged over 18) | Physical and social | Yes | No | Psychology |
3. Results
3.1. Assessment of Current Application
3.2. Two Challenges for Integration
- Sensors and sampling: how to choose and integrate sensors reasonably and form a workable integration in fieldwork to solve the research questions effectively; and
- Data fusion and database: what are the techniques required to link up data and build up a high-quality database for the subsequent analysis.
3.3. Challenge 1: Sensors and Sampling
3.3.1. The Form of Integration
3.3.2. Number of Sensors
3.3.3. The Cost-Effectiveness of Sensors
3.4. Challenge 2: Data Fusion and Database
3.4.1. Data Logging
3.4.2. Pre-Processing
3.4.3. Unification
3.4.4. Data Aggregation
3.5. How to Improve the Integration
4. Discussion and Conclusions
4.1. Discussion
4.2. Strengths and Limitations of Our Review
4.3. Conclusions
Supplementary Materials
Author Contributions
Funding
Institutional Review Board Statement
Informed Consent Statement
Data Availability Statement
Conflicts of Interest
References
- Lazarus, R.S.; Cohen, J.B. Environmental Stress. In Human Behavior and Environment: Advances in Theory and Research; Altman, I., Wohlwill, J.F., Eds.; Springer: Boston, MA, USA, 1977; Volume 2, pp. 89–127. [Google Scholar]
- Ali, M.U.; Liu, G.; Yousaf, B.; Ullah, H.; Abbas, Q.; Munir, M.A.M. A systematic review on global pollution status of particulate matter-associated potential toxic elements and health perspectives in urban environment. Environ. Geochem. Health 2019, 41, 1131–1162. [Google Scholar] [CrossRef] [PubMed]
- Sygna, K.; Aasvang, G.M.; Aamodt, G.; Oftedal, B.; Krog, N.H. Road traffic noise, sleep and mental health. Environ. Res. 2014, 131, 17–24. [Google Scholar] [CrossRef] [PubMed]
- Lopez, R.P.; Hynes, H.P. Obesity, physical activity, and the urban environment: Public health research needs. Environ. Health 2006, 5, 25. [Google Scholar] [CrossRef] [PubMed] [Green Version]
- Swan, M. The Quantified Self: Fundamental Disruption in Big Data Science and Biological Discovery. Big Data 2013, 1, 85–99. [Google Scholar] [CrossRef] [PubMed]
- Tung, J.Y.; Rose, R.V.; Gammada, E.; Lam, I.; Roy, E.A.; Black, S.E.; Poupart, P. Measuring life space in older adults with mild-to-moderate Alzheimer’s disease using mobile phone GPS. Gerontology 2014, 60, 154–162. [Google Scholar] [CrossRef]
- MacKerron, G.; Mourato, S. Happiness is greater in natural environments. Glob. Environ. Chang. 2013, 23, 992–1000. [Google Scholar] [CrossRef] [Green Version]
- Li, X.; Dunn, J.; Salins, D.; Zhou, G.; Zhou, W.; Schussler-Fiorenza Rose, S.M.; Perelman, D.; Colbert, E.; Runge, R.; Rego, S.; et al. Digital Health: Tracking Physiomes and Activity Using Wearable Biosensors Reveals Useful Health-Related Information. PLoS Biol. 2017, 15, e2001402. [Google Scholar] [CrossRef] [PubMed]
- Ermes, M.; Parkka, J.; Mantyjarvi, J.; Korhonen, I. Detection of Daily Activities and Sports With Wearable Sensors in Controlled and Uncontrolled Conditions. IEEE Trans. Inf. Technol. Biomed. 2008, 12, 20–26. [Google Scholar] [CrossRef]
- Gorgul, E.; Zhang, L.; Günther, F.; Chen, C. Mapping Human Response to Street Experience. In Proceedings of the Adjunct Proceedings of the 2019 ACM International Joint Conference on Pervasive and Ubiquitous Computing and Proceedings of the 2019 ACM International Symposium on Wearable Computers, London, UK, 9–13 September 2019; pp. 69–72. [Google Scholar]
- Morawska, L.; Thai, P.K.; Liu, X.; Asumadu-Sakyi, A.; Ayoko, G.; Bartonova, A.; Bedini, A.; Chai, F.; Christensen, B.; Dunbabin, M.; et al. Applications of low-cost sensing technologies for air quality monitoring and exposure assessment: How far have they gone? Environ. Int. 2018, 116, 286–299. [Google Scholar] [CrossRef]
- Vlachokostas, C.; Achillas, C.; Michailidou, A.V.; Moussiopoulos, N. Measuring combined exposure to environmental pressures in urban areas: An air quality and noise pollution assessment approach. Environ. Int. 2012, 39, 8–18. [Google Scholar] [CrossRef]
- Hedendahl, L.K.; Carlberg, M.; Koppel, T.; Hardell, L. Measurements of Radiofrequency Radiation with a Body-Borne Exposimeter in Swedish Schools with Wi-Fi. Front. Public Health 2017, 5, 279. [Google Scholar] [CrossRef] [Green Version]
- Benita, F.; Bansal, G.; Tuncer, B. Public spaces and happiness: Evidence from a large-scale field experiment. Health Place 2019, 56, 9–18. [Google Scholar] [CrossRef]
- Mamun, M.A.A.; Yuce, M.R. Sensors and Systems for Wearable Environmental Monitoring Toward IoT-Enabled Applications: A Review. IEEE Sens. J. 2019, 19, 7771–7788. [Google Scholar] [CrossRef]
- Riazul Islam, S.M.; Daehan, K.; Humaun Kabir, M.; Hossain, M.; Kyung-Sup, K. The Internet of Things for Health Care: A Comprehensive Survey. IEEE Access 2015, 3, 678–708. [Google Scholar] [CrossRef]
- Windmiller, J.R.; Wang, J. Wearable Electrochemical Sensors and Biosensors: A Review. Electroanalysis 2013, 25, 29–46. [Google Scholar] [CrossRef]
- Qi, J.; Yang, P.; Min, G.; Amft, O.; Dong, F.; Xu, L. Advanced internet of things for personalised healthcare systems: A survey. Pervasive Mob. Comput. 2017, 41, 132–149. [Google Scholar] [CrossRef]
- EPHPP. Quality Assessment tool for Quantitative Studies. Effective Public Health Practice Project. 2010. Available online: http://www.ephpp.ca/index.html%5Cnhttp://www.ephpp.ca/PDF/QualityAssessmentTool_2010_2.pdf (accessed on 8 November 2021).
- Law, M.; Stewart, D.; Letts, L.; Pollock, N.; Bosch, J.; Westmorland, M. Guidelines for Critical Review of Qualitative Studies. 1998. Available online: https://tbzmed.ac.ir/Uploads/3/cms/user/File/10/Pezeshki_Ejtemaei/conferance/dav.pdf (accessed on 8 November 2021).
- Armijo-Olivo, S.; Stiles, C.R.; Hagen, N.A.; Biondo, P.D.; Cummings, G.G. Assessment of study quality for systematic reviews: A comparison of the Cochrane Collaboration Risk of Bias Tool and the Effective Public Health Practice Project Quality Assessment Tool: Methodological research. J. Eval. Clin. Pract. 2012, 18, 12–18. [Google Scholar] [CrossRef]
- Driessen, C.E.; Cameron, A.J.; Thornton, L.E.; Lai, S.K.; Barnett, L.M. Effect of changes to the school food environment on eating behaviours and/or body weight in children: A systematic review. Obes. Rev. 2014, 15, 968–982. [Google Scholar] [CrossRef]
- Van den Bogerd, N.; Coosje Dijkstra, S.; Koole, S.L.; Seidell, J.C.; de Vries, R.; Maas, J. Nature in the indoor and outdoor study environment and secondary and tertiary education students’ well-being, academic outcomes, and possible mediating pathways: A systematic review with recommendations for science and practice. Health Place 2020, 66, 102403. [Google Scholar] [CrossRef]
- Smith, M.; Hosking, J.; Woodward, A.; Witten, K.; MacMillan, A.; Field, A.; Baas, P.; Mackie, H. Systematic literature review of built environment effects on physical activity and active transport—An update and new findings on health equity. Int. J. Behav. Nutr. Phys. Act. 2017, 14, 158. [Google Scholar] [CrossRef]
- Wang, L.; Wen, C. The Relationship between the Neighborhood Built Environment and Active Transportation among Adults: A Systematic Literature Review. Urban Sci. 2017, 1, 29. [Google Scholar] [CrossRef] [Green Version]
- Won, J.; Lee, C.; Forjuoh, S.N.; Ory, M.G. Neighborhood safety factors associated with older adults’ health-related outcomes: A systematic literature review. Soc. Sci. Med. 2016, 165, 177–186. [Google Scholar] [CrossRef] [PubMed]
- Benita, F.; Bansal, G.; Virupaksha, D.; Scandola, F.; Tuncer, B. Body responses towards a morning walk in a tropical city. Landsc. Res. 2020, 45, 966–983. [Google Scholar] [CrossRef]
- Benita, F.; Tunçer, B. Exploring the effect of urban features and immediate environment on body responses. Urban For. Urban Green. 2019, 43, 126365. [Google Scholar] [CrossRef]
- Birenboim, A.; Dijst, M.; Scheepers, F.E.; Poelman, M.P.; Helbich, M. Wearables and Location Tracking Technologies for Mental-State Sensing in Outdoor Environments. Prof. Geogr. 2019, 71, 449–461. [Google Scholar] [CrossRef]
- Bohmer, M.N.; Valstar, M.J.; Aarts, M.P.J.; Bindels, P.J.E.; Oppewal, A.; van Someren, E.J.W.; Festen, D.A.M. Shedding light on light exposure in elderly with intellectual disabilities. J. Intellect. Disabil. Res. 2021, 65, 361–372. [Google Scholar] [CrossRef]
- Boissy, P.; Blamoutier, M.; Briere, S.; Duval, C. Quantification of Free-Living Community Mobility in Healthy Older Adults Using Wearable Sensors. Front. Public Health 2018, 6, 216. [Google Scholar] [CrossRef] [Green Version]
- Bolliger, L.; Lukan, J.; Lustrek, M.; De Bacquer, D.; Clays, E. Protocol of the STRess at Work (STRAW) Project: How to Disentangle Day-to-Day Occupational Stress among Academics Based on EMA, Physiological Data, and Smartphone Sensor and Usage Data. Int. J. Environ. Res. Public Health 2020, 17, 8835. [Google Scholar] [CrossRef]
- Borghi, F.; Spinazze, A.; Fanti, G.; Campagnolo, D.; Rovelli, S.; Keller, M.; Cattaneo, A.; Cavallo, D.M. Commuters’ Personal Exposure Assessment and Evaluation of Inhaled Dose to Different Atmospheric Pollutants. Int. J. Environ. Res. Public Health 2020, 17, 3357. [Google Scholar] [CrossRef] [PubMed]
- Burgi, R.; Tomatis, L.; Murer, K.; de Bruin, E.D. Localization of Physical Activity in Primary School Children Using Accelerometry and Global Positioning System. PLoS ONE 2015, 10, e0142223. [Google Scholar] [CrossRef] [Green Version]
- Butt, M.; Ouarda, T.B.; Quan, S.F.; Pentland, A.S.; Khayal, I. Technologically sensed social exposure related to slow-wave sleep in healthy adults. Sleep Breath 2015, 19, 255–261. [Google Scholar] [CrossRef] [PubMed]
- Cerin, E.; Baranowski, T.; Barnett, A.; Butte, N.; Hughes, S.; Lee, R.E.; Mendoza, J.A.; Thompson, D.; O’Connor, T.M. Places where preschoolers are (in)active: An observational study on Latino preschoolers and their parents using objective measures. Int. J. Behav. Nutr. Phys. Act. 2016, 13, 29. [Google Scholar] [CrossRef] [PubMed] [Green Version]
- Chaix, B.; Benmarhnia, T.; Kestens, Y.; Brondeel, R.; Perchoux, C.; Gerber, P.; Duncan, D.T. Combining sensor tracking with a GPS-based mobility survey to better measure physical activity in trips: Public transport generates walking. Int. J. Behav. Nutr. Phys. Act. 2019, 16, 84. [Google Scholar] [CrossRef] [PubMed]
- Chrisinger, B.W.; King, A.C. Stress experiences in neighborhood and social environments (SENSE): A pilot study to integrate the quantified self with citizen science to improve the built environment and health. Int. J. Health Geogr. 2018, 17, 17. [Google Scholar] [CrossRef] [PubMed] [Green Version]
- Dessimond, B.; Annesi-Maesano, I.; Pepin, J.L.; Srairi, S.; Pau, G. Academically Produced Air Pollution Sensors for Personal Exposure Assessment: The Canarin Project. Sensors 2021, 21, 1876. [Google Scholar] [CrossRef] [PubMed]
- Do, K.; Yu, H.; Velasquez, J.; Grell-Brisk, M.; Smith, H.; Ivey, C.E. A data-driven approach for characterizing community scale air pollution exposure disparities in inland Southern California. J. Aerosol Sci. 2021, 152. [Google Scholar] [CrossRef]
- Doherty, S.T.; Oh, P. A multi-sensor monitoring system of human physiology and daily activities. Telemed. J. E Health 2012, 18, 185–192. [Google Scholar] [CrossRef]
- Donaire-Gonzalez, D.; Valentin, A.; van Nunen, E.; Curto, A.; Rodriguez, A.; Fernandez-Nieto, M.; Naccarati, A.; Tarallo, S.; Tsai, M.Y.; Probst-Hensch, N.; et al. ExpoApp: An integrated system to assess multiple personal environmental exposures. Environ. Int. 2019, 126, 494–503. [Google Scholar] [CrossRef]
- Doryab, A.; Villalba, D.K.; Chikersal, P.; Dutcher, J.M.; Tumminia, M.; Liu, X.; Cohen, S.; Creswell, K.; Mankoff, J.; Creswell, J.D.; et al. Identifying Behavioral Phenotypes of Loneliness and Social Isolation with Passive Sensing: Statistical Analysis, Data Mining and Machine Learning of Smartphone and Fitbit Data. JMIR Mhealth Uhealth 2019, 7, e13209. [Google Scholar] [CrossRef] [Green Version]
- El Aarbaoui, T.; Chaix, B. The short-term association between exposure to noise and heart rate variability in daily locations and mobility contexts. J. Exp. Sci. Environ. Epidemiol. 2020, 30, 383–393. [Google Scholar] [CrossRef]
- Engelniederhammer, A.; Papastefanou, G.; Xiang, L. Crowding density in urban environment and its effects on emotional responding of pedestrians: Using wearable device technology with sensors capturing proximity and psychophysiological emotion responses while walking in the street. J. Hum. Behav. Soc. Environ. 2019, 29, 630–646. [Google Scholar] [CrossRef]
- Huck, J.J.; Whyatt, J.D.; Coulton, P.; Davison, B.; Gradinar, A. Combining physiological, environmental and locational sensors for citizen-oriented health applications. Environ. Monit. Assess. 2017, 189, 114. [Google Scholar] [CrossRef] [Green Version]
- Johnston, J.E.; Juarez, Z.; Navarro, S.; Hernandez, A.; Gutschow, W. Youth Engaged Participatory Air Monitoring: A ‘Day in the Life’ in Urban Environmental Justice Communities. Int. J. Environ. Res. Public Health 2019, 17, 93. [Google Scholar] [CrossRef] [PubMed] [Green Version]
- Kanjo, E.; Younis, E.M.G.; Sherkat, N. Towards unravelling the relationship between on-body, environmental and emotion data using sensor information fusion approach. Inf. Fusion 2018, 40, 18–31. [Google Scholar] [CrossRef]
- Kim, J.; Ahn, C.R.; Nam, Y. The influence of built environment features on crowdsourced physiological responses of pedestrians in neighborhoods. Comput. Environ. Urban Syst. 2019, 75, 161–169. [Google Scholar] [CrossRef]
- Kou, L.R.; Kwan, M.P.; Chai, Y.W. The effects of activity-related contexts on individual sound exposures: A time-geographic approach to soundscape studies. Environ. Plan. B-Urban Anal. City Sci. 2020, 48. [Google Scholar] [CrossRef]
- Laeremans, M.; Dons, E.; Avila-Palencia, I.; Carrasco-Turigas, G.; Orjuela, J.P.; Anaya, E.; Cole-Hunter, T.; de Nazelle, A.; Nieuwenhuijsen, M.; Standaert, A.; et al. Short-term effects of physical activity, air pollution and their interaction on the cardiovascular and respiratory system. Environ. Int. 2018, 117, 82–90. [Google Scholar] [CrossRef] [PubMed]
- Ma, J.; Li, C.J.; Kwan, M.P.; Kou, L.R.; Chai, Y.W. Assessing personal noise exposure and its relationship with mental health in Beijing based on individuals’ space-time behavior. Environ. Int. 2020, 139, 105737. [Google Scholar] [CrossRef]
- Ma, J.; Tao, Y.; Kwan, M.-P.; Chai, Y. Assessing Mobility-Based Real-Time Air Pollution Exposure in Space and Time Using Smart Sensors and GPS Trajectories in Beijing. Ann. Am. Assoc. Geogr. 2019, 110, 434–448. [Google Scholar] [CrossRef]
- Millar, G.C.; Mitas, O.; Boode, W.; Hoeke, L.; de Kruijf, J.; Petrasova, A.; Mitasova, H. Space-time analytics of human physiology for urban planning. Comput. Environ. Urban Syst. 2021, 85, 101554. [Google Scholar] [CrossRef]
- Novak, R.; Kocman, D.; Robinson, J.A.; Kanduc, T.; Sarigiannis, D.; Horvat, M. Comparing Airborne Particulate Matter Intake Dose Assessment Models Using Low-Cost Portable Sensor Data. Sensors 2020, 20, 1406. [Google Scholar] [CrossRef] [PubMed] [Green Version]
- Ojha, V.K.; Griego, D.; Kuliga, S.; Bielik, M.; Buš, P.; Schaeben, C.; Treyer, L.; Standfest, M.; Schneider, S.; König, R.; et al. Machine learning approaches to understand the influence of urban environments on human’s physiological response. Inf. Sci. 2019, 474, 154–169. [Google Scholar] [CrossRef]
- Rabinovitch, N.; Adams, C.D.; Strand, M.; Koehler, K.; Volckens, J. Within-microenvironment exposure to particulate matter and health effects in children with asthma: A pilot study utilizing real-time personal monitoring with GPS interface. Environ. Health 2016, 15, 96. [Google Scholar] [CrossRef] [Green Version]
- Resch, B.; Puetz, I.; Bluemke, M.; Kyriakou, K.; Miksch, J. An Interdisciplinary Mixed-Methods Approach to Analyzing Urban Spaces: The Case of Urban Walkability and Bikeability. Int. J. Environ. Res. Public Health 2020, 17, 6994. [Google Scholar] [CrossRef] [PubMed]
- Roe, J.; Mondschein, A.; Neale, C.; Barnes, L.; Boukhechba, M.; Lopez, S. The Urban Built Environment, Walking and Mental Health Outcomes Among Older Adults: A Pilot Study. Front. Public Health 2020, 8, 575946. [Google Scholar] [CrossRef]
- Runkle, J.D.; Cui, C.; Fuhrmann, C.; Stevens, S.; Del Pinal, J.; Sugg, M.M. Evaluation of wearable sensors for physiologic monitoring of individually experienced temperatures in outdoor workers in southeastern U.S. Environ. Int. 2019, 129, 229–238. [Google Scholar] [CrossRef]
- Rybarczyk, G.; Ozbil, A.; Andresen, E.; Hayes, Z. Physiological responses to urban design during bicycling: A naturalistic investigation. Transp. Res. Part F Traffic Psychol. Behav. 2020, 68, 79–93. [Google Scholar] [CrossRef]
- Shoval, N.; Schvimer, Y.; Tamir, M. Tracking technologies and urban analysis: Adding the emotional dimension. Cities 2018, 72, 34–42. [Google Scholar] [CrossRef]
- Steinle, S.; Reis, S.; Sabel, C.E.; Semple, S.; Twigg, M.M.; Braban, C.F.; Leeson, S.R.; Heal, M.R.; Harrison, D.; Lin, C.; et al. Personal exposure monitoring of PM2.5 in indoor and outdoor microenvironments. Sci. Total Environ. 2015, 508, 383–394. [Google Scholar] [CrossRef] [Green Version]
- West, S.E.; Büker, P.; Ashmore, M.; Njoroge, G.; Welden, N.; Muhoza, C.; Osano, P.; Makau, J.; Njoroge, P.; Apondo, W. Particulate matter pollution in an informal settlement in Nairobi: Using citizen science to make the invisible visible. Appl. Geogr. 2020, 114. [Google Scholar] [CrossRef]
- Zhang, X.; Zhou, S.H.; Kwan, M.P.; Su, L.L.; Lu, J.W. Geographic Ecological Momentary Assessment (GEMA) of environmental noise annoyance: The influence of activity context and the daily acoustic environment. Int. J. Health Geogr. 2020, 19, 50. [Google Scholar] [CrossRef] [PubMed]
- St Fleur, R.G.; St George, S.M.; Leite, R.; Kobayashi, M.; Agosto, Y.; Jake-Schoffman, D.E. Use of Fitbit Devices in Physical Activity Intervention Studies Across the Life Course: Narrative Review. JMIR Mhealth Uhealth 2021, 9, e23411. [Google Scholar] [CrossRef] [PubMed]
- Vich, G.; Marquet, O.; Miralles-Guasch, C. Green exposure of walking routes and residential areas using smartphone tracking data and GIS in a Mediterranean city. Urban For. Urban Green. 2019, 40, 275–285. [Google Scholar] [CrossRef]
- De Nazelle, A.; Seto, E.; Donaire-Gonzalez, D.; Mendez, M.; Matamala, J.; Nieuwenhuijsen, M.J.; Jerrett, M. Improving estimates of air pollution exposure through ubiquitous sensing technologies. Environ. Pollut. 2013, 176, 92–99. [Google Scholar] [CrossRef] [PubMed] [Green Version]
- Baig, M.M.; GholamHosseini, H.; Moqeem, A.A.; Mirza, F.; Linden, M. A Systematic Review of Wearable Patient Monitoring Systems—Current Challenges and Opportunities for Clinical Adoption. J. Med. Syst. 2017, 41, 115. [Google Scholar] [CrossRef]
| Study Characteristics | No. | % |
|---|---|---|
| Publication year | ||
| 2010–2015 | 1 | 2.6% |
| 2015–2020 | 22 | 56.4% |
| 2020–2021 April | 16 | 41.0% |
| Temporal resolution | ||
| Level 1 (Minutes/Hours within a day) | 13 | 33.3% |
| Level 2 (Days/Weeks) | 21 | 53.8% |
| Level 3 (Months and Seasons) | 5 | 12.8% |
| Subject area | ||
| Social science | 9 | 23.1% |
| Environmental science | 18 | 46.2% |
| Engineering | 6 | 15.4% |
| Arts and humanities | 1 | 2.6% |
| Medicine | 19 | 48.7% |
| Computer Science | 6 | 15.4% |
| Multidisciplinary | 1 | 2.6% |
| Earth and Planetary Sciences | 3 | 7.7% |
| Neuroscience | 1 | 2.6% |
| Health Professions | 3 | 7.7% |
| Agricultural and Biological Sciences | 1 | 2.6% |
| Region of study | ||
| Asia | 6 | 15.4% |
| Europe | 18 | 46.2% |
| North America | 13 | 33.3% |
| Other | 2 | 5.1% |
| Locations | ||
| Single area/city | 35 | 89.7% |
| Two or more areas/cities | 4 | 10.3% |
| Study setting | ||
| Natural settings | 28 | 71.8% |
| Pre-defined settings | 11 | 28.2% |
| Gender | ||
| Both male and female | 29 | 74.4% |
| Female only | 3 | 7.7% |
| Male only | 2 | 5.1% |
| Not mentioned | 5 | 12.8% |
| Sample size | ||
| <10 | 6 | 15.4% |
| 10–49 | 18 | 46.2% |
| 50–100 | 6 | 15.4% |
| >100 | 9 | 23.1% |
| Domains of environment | ||
| Social environment (such as crowdedness, sociality) | 4 | 10.3% |
| Urban environment (such as built environment, traffic) | 11 | 28.2% |
| Physical environment (such as noise, air, wind, light) | 20 | 51.3% |
| Physical and urban environment | 2 | 5.1% |
| Social and urban environment | 1 | 2.6% |
| Physical and social environment | 1 | 2.6% |
| Geo-location data | ||
| Yes | 35 | 89.7% |
| No | 4 | 10.3% |
| Other contextual data | ||
| Yes | 13 | 33.3% |
| No | 26 | 66.7% |
| Domains of health | ||
| Human activity (such as, physical activity, sleep) | 14 | 35.9% |
| Physical health (such as, health condition, disease) | 5 | 12.8% |
| Mental health (such as, stress) | 4 | 10.3% |
| Psychology | 3 | 7.7% |
| Human activity and Mental health | 2 | 5.1% |
| Human activity and physical health | 5 | 12.8% |
| Human activity and psychology | 0 | 0.0% |
| Mental health and psychology | 5 | 12.8% |
| Mental health and physical health and psychology | 1 | 2.6% |
| Reference | Integrate Sensors | Integrate Data from Sensors | |||||||||
|---|---|---|---|---|---|---|---|---|---|---|---|
| RE | Q 1 | N 2 | Environment Sensor | GPS | Activity | Health Tracker | Data Logging | Pre-Processing | Data Fusion | Aggregation | |
| 1 | Benita, et al. [27] | M | 3 | (1) Kestrel 5400 : temperature, relative humidity, wind and atmospheric pressure (one reading every 2 s); (2) Phone: Noise (10 readings per second). | (2) Phone-based GPS and speed (one reading every 4 or 5 s) | - | (3) Empatica 4 (four readings per second) | Sensors | (a) Filter the noise; (b) Extract feature by Ledalab software 3. | A moving average to smooth data (f = 1 Hz) | Over spatial units (stress hotspot) |
| 2 | Benita and Tunçer [28] | M | 3 | (1) Kestrel 5400 : temperature, relative humidity, wind and atmospheric pressure (f = 0.5 Hz); (2) Phone: Noise Noise (f = 10 Hz). | (2) Phone-based GPS and speed (f = 0.2 Hz) | - | (3) Empatica 4 (f = 4 Hz) | Sensors | (a) Filter the noise; (b) Extract feature by Ledalab software. | A moving average to smooth data (f = 1 Hz) | Over spatial units (stress hotspot) |
| 3 | Birenboim, et al. [29] | M | 3 (App) | - | (1) GPS receiver (f = 1 Hz) | - | (2) Microsoft Band (f = 1 Hz); (3) Empatica 4 (f = 4 Hz). | Sensors/Phone App | (a) Extract feature by Ledalab Software; (b) Use t-test to detect significant differences between “neutral” and “stressful”. | Reduction (f = 1 Hz) | Over spatial units (Average per walking segment) |
| 4 | Bohmer, et al. [30] | H | 2 | (1) Light sensor (measured in 1-min epochs) | - | (2) Accelerometer (sum activity counts for 1-min epochs) | - | Sensors | (a) Transform lux to log lux; (b) Only include timeframe with <25% missing data; (c) Actant –Activity Analysis Toolbox to calculate the bedtimes; (d) Filter by thresholds of 50 min >1000 lux. | Average illuminance (log lux) per minute | Over Time (Average per timeframe) |
| 5 | Boissy, et al. [31] | H | 2 | - | (1) GPS receiver (-) | (2) Accelerometer (-) | - | Sensors | (a) Filter accelerometer data by low-pass filter at 5 Hz and high-pass filter at 1 Hz; (b) Use algorithm to detect step and remove noise; (c) Filter GPS points with lower presion. | Time interpolation; (Open-source software 4 to format data coming from the different sensors). | Over spatial units (clusters and transit detected by a rolling window). |
| 6 | Bolliger, et al. [32] | L | 2 (App) | (1) Phone: Light sensor, temperature sensor and voice sensor. | (1) Phone based GPS | - | (2) Empatica 4 (f = 4 Hz) (App based ecological momentary assessment). | Sensors | - | - | - |
| 7 | Borghi, et al. [33] | L | 4 | (1) DiSCmini: UFP exposure levels; (2) A PM2.5 concentration monitor; (3) CairClip NO2; (All sensors: an acquisition rate equal to 60 s). | (4) Sensor-based GPS (Suunto 9) | - | (4) Heart rate monitor: Suunto 9 | Sensors | Correct the particulate matter (PM) data by a correction factor; Exclude zero and unreliable data. | Average values over time | Over Time (season) |
| 8 | Burgi, et al. [34] | M | 2 | - | (1) GPS receiver (at 10 s intervals) | (2) Accelerometer (-) | - | Sensors | Manually reviewed | Software (Actilife 6.5.2, Actigraph, Pensacola, FL, USA) | Over spatial units (based on the activity settings) and Individuals (by gender). |
| 9 | Butt, et al. [35] | M | 2 (App) | (1) A software platform on phone: (actual time a person spent interacting and the number of people with whom there were interactions). | - | - | (2) Wireless system (sleep, eye movement) | Sensors (Digital card); | (a) Calculate the median value of paramters; (b) Normalize value of social exposure between 0 and 1; (c) Performe Spearman’srank correlations to understand data. | - | Over Individuals (Wilcoxon sign-ranked test and 2D k-means clustering). |
| 10 | Cerin, et al. [36] | H | 2 | - | (1) GPS receiver (30 s epochs) | (2) Accelerometer (15 s epochs) | - | Sensors | (a) Remove periods of 30+ minutes of zero accelerometer counts; (b) Extract valid Accelerometer data (≥480 min of activity data/day); (c) Classify into sedentary time and MVPA 5 by cut points; (d) Use a web application (PALMS) 6 to clean and filter accelerometer and GPS data. | Reduction (Average accelerometer counts per 30 s) | Over spatial units (Average based on specific Locations with 50 m buffer/100 m buffer) and over individuals (average by gender and weight status). |
| 11 | Chaix, et al. [37] | M | 2+1 7 | - | (1) GPS receiver (one point every 5 s) | (2) Accelerometer (-) (Phone mobility Survey in a web mapping application) | - | Sensors | (a) Use Web application (TripBuilder) to process GPS data; (b) Removed incorrect trips manually; (c) Use software (ActiLife 6.11.9) to process accelerometer data. | - | Over spatial units (calculate the percentage of the walk distance in main travel modes and test the differences by KruskalWallis test). |
| 12 | Chrisinger and King [38] | M | 2 (App) | - | (1) Phone-based GPS in App | (Audio and image from phone App) | (2) Empatica 4 (f = 4 Hz) | Sensors | (a) Normalize the Electrodermal activity (EDA) from E4 by subtracting the minimum; (b) center (subtracting the mean) and scaled (dividing by the standard deviation of the centered data) the EDA data; (c) Use an algorithm to remove the noise from EDA data. | - | Over spatial units (set 5-m grid cells along the walk path to use Getis-Ord Gi* local statistic and kernel density to detect cluster). |
| 13 | Dessimond, et al. [39] | L | 2 | (1) Canarin (Air pollution) | (2) Tablet-based GPS | - | - | Remote server/ Sensor | - | - | Over spatial units (based on specific Locations) and over time (hour). |
| 14 | Do, et al. [40] | L | 3 | (1) PM monitor for Air pollution (15 s sampling rate); (2) Temperature logger. | (3) GPS receiver (5 s sampling rate) and a Wi-Fi hotspot | - | - | Cloud server/ Sensors (If Wi-Fi connectivity was unavailable) | (a) Assigned all missing PM measurements as “−9999”; (b) Clean GPS data by the distance between two points; e.g., assign distance > 50 as “NaN”; (c) Co-locate the PM data with air monitoring site to adjust the data. | Time interpolation (from 15 s to 5 s) | Over Time and spatial units |
| 15 | Doherty and Oh [41] | M | 3+1 (App) | - | (1) GPS receiver (every 1 s) | (2) Accelerometer from Electrocardiogram | (2) Electrocardiogram (25 measurements per second); (3) Glucose monitoring (every 10 s). | Phone App and remote server | (a) A rule-based algorithm to detect human activity from GPS data; (b) Average glucose readings every 5-min. | A Web-based retrospective data analysis software. | - |
| 16 | Donaire-Gonzalez, et al. [42] | M | 5+1 (App) | (1) Black carbon monitor MicroAeth; (2)UFP monitor DiSCmini; (every 1 s). | (3)Phone-based GPS in App; (4) GPS 8 receiver (every 10 s). | (3) Phone-based Acceleromer in App; (5) Accelerometer (every 10 s). | - | Phone App and cloud server | Phone App used to process the data by algorithm. | Phone App (every 10 s) | - |
| 17 | Doryab, et al. [43] | H | 2 (App) | (1) Phone App to record social activity (1 sample per 10 min). | (1) Phone-based GPS in App | - | (2) A Fitbit Flex (sleep at 1 sample per min, and steps at 1 sample per 5 min). | Sensor and server | (a) Develope a feature extraction component (FEC) to extract features; (b) Handle Missing Values, e.g., removed a participant if 20% data were missing. | - | Over time (all day, night, morning, afternoon, weekdays and weekend). |
| 18 | El Aarbaoui and Chaix [44] | H | 4 | (1) Personal Dosimeter (every second) | (2) GPS receiver | (3) Accelerometer (5 s epochs) | (4) BioPatch BHM 3 | Sensors | - | Over 5-min and 1-min windows with the coefficient of variation. | Over spatial units (based on different contexts). |
| 19 | Engelniederhammer, et al. [45] | M | 3 | (1) Infrared motion sensor (f = 10 Hz) | (2) GPS receiver | - | (3) A wristband developed by Bodymonitor (EDA data with f = 10 Hz). | The Infrared data was transmitted to wristband and stored in sensor | (a) A classification algorithm to detect emotion based on EDA data; (b) Reduced the data to binary information and use the logit model to deal with them. | - | - |
| 20 | Huck, et al. [46] | L | 3+1 (App) | (1) NO2 sensor (f = 1 Hz) | (2) Phone based GPS (f = 1 Hz) | - | (3) Airflow Sensor (f = 1 Hz) | Phone App | Phone App | Phone App | Over spatial units |
| 21 | Johnston, et al. [47] | L | 2+1 (App) | (1) PM2.5 monitor (every second); (2)Phone:Temperature, humidity. | (2) Phone-based GPS (every second) | - | - | Phone App | Phone App | Phone App | Over spatial units and time (hour) and individuals. |
| 22 | Kanjo, et al. [48] | H | 2+1 (App) | (1) Phone: Noise sensor; (2) Microsoft band: Air pressure and Light. | (1) Phone-based GPS | - | (2) Microsoft band (App-based self-report) | Phone App | (a) The first and the last 30 s were cut; (b) Remove abnormal ones by lagged Poincare plots. | Phone App | - |
| 23 | Kim, et al. [49] | M | 3 (App) | - | (1) Phone-based GPS in App | (2) Accelerometer | (3) Empatica 4 (f = 4 Hz) | Sensors | (a) Use Butterworth low-pass filter with a cut-off frequency of 4 Hz to remove noise from accelerometer data; (b) Use time interpolation to unify the frequency of GPS data (f = 1 Hz). | Average value over subsegment (61 in total) | - |
| 24 | Kou, et al. [50] | M | 2 | (1) Sound sensor: sound level (minute-by-minute). | (2) Phone-based GPS (at a resolution of 1 m or 3 s) | - | - | Sensors | Classify activity time into day, evening and night; Classify activity companion into “alone” and “with others”; Classify activity type into “work and study”, “personal affairs”, “housework”, “shopping” and “recreation”. | - | Over time (use a logarithmic function to aggregate the fluctuating sound levels over a period of time). |
| 25 | Laeremans, et al. [51] | H | 2 | (1) MicroAeth: expsoure to black carbon (on a five-minute basis). | - | (2) Accelerometer from SenseWear | (2) SenseWear armband (on a one-minute basis). | Sensors | (a) Use SenseWear professional software to extract feature; (b) Choose bouts of at least 10 consecutive minutes with an intensity ≥3 METs 9; (c) Raw black carbon (BC) data were smoothened with the Optimized Noise-reduction Algorithm (ONA) 10. | - | Over individuals (amount, percentage, mean and standard deviation). |
| 26 | Ma, et al. [52] | H | 2 | (1) Sound Meters: Noise level (1 min). | (2) Phone-based GPS | - | - | Sensors | (a) Classify the activities into categories; (b) Use a-weighted equivalent sound pressure level to estimate the average noise exposure. | - | Over time and spatial units (Average the parameters based on the time and duration for each category of activity or travel mode on a weekday and weekend day). |
| 27 | Ma, et al. [53] | M | 2 | (1) Portable Air monitor (1 s) | (2) Phone-based GPS (1 s) | - | - | Sensors | - | - | Over spatial units and individuals (sum of the per second exposure for each person). |
| 28 | Millar, et al. [54] | M | 3 (App) | (1) Camera (participants’ view) | (2) Phone-based GPS From App (f = 1 Hz) | (head activity from camera) | (2) (Empatica 4 (f = 4 Hz) | Sensors | (a) Use weighted moving average with a 60-s moving window to compute smoothed speed from GPS App; (b) Weights were re-normalized and they summed to 1; (c) Extract Skin conductance responses(SCRs) from EDA by Ledalab; (d) Use a moving window of 20 s to identify deviations of SCR; (e) Standardized the SCR to reduce differences between participants. | Time interpolation (f = 4 Hz) | Over spatial units and time (a web-based mapping system to visualize high-resolution spatiotemporal data). |
| 29 | Novak, et al. [55] | M | 2 | (1) PM measuring unit (1 min) A reference instrument: GRIMM 11 | - | - | (2) Smart Activity tracker: Garmin Vivosmart 3 (in minute) | Sensors | - | - | Over time (5-min averages). |
| 30 | Ojha, et al. [56] | M | 3 | (1) Sensor backpack monitoring Sound and dust (f = 0.4 Hz), Temperature, illuminance (f = 1 Hz). | (2) GPS receiver (f = 1 Hz) | - | (3) Empatica 4 (f = 4 Hz) | Sensors | (a) Remove unusable EDA data; (b) Filter EDA data to remove artifacts; (c) Smooth data by Stationary Wavelet Transform; (d)Time window marking; (e) Extract Skin conductance responses(SCRs) from EDA by Ledalab; (f) Data labeling: “normal” and “aroused”. | Apply Time interpolation (f = 1 Hz) to environment data, and keep health data at original frequency (f = 4 Hz). | Over individuals (the mean physiological response across all participants and normalized between 0 and 1). |
| 31 | Rabinovitch, et al. [57] | M | 3 | (1) Aerosol, nephelometer: fine PM concentrations; (2) Temperature sensor (10 s intervals). | (3) GPS receiver (10 s intervals) | - | (An electronic monitor of school-time albuterol use: total number) | Sensors | (a) Use an algorithm to classify the types of microenvironment; (b) Use a normalization factor to correct measurement. | - | Over time (both mean and 1-min maximum) and spatial units (based on contexts). |
| 32 | Resch, et al. [58] | M | 4+1 (App) | (1) GoPro camera (First-person video camera). | (2) Phone-based GPS | - | (3) Empatica 4, Zephyr, (4) Bioharness (ECG, HRV). (eDiary App) | Sensors/Phone App | (a) Filter data by a low-pass filter (f = 0.5 Hz) and a high-pass filter (f = 0.05 Hz); (b) Use a rule-based algorithm to detect pattern of stress. | - | Over spatial units (aggregated to raster cells and use Getis–Ord Gi hotspot analysis). |
| 33 | Roe, et al. [59] | M | 4 (App) | (1) Noise sensors, (2) Air monitor. | (3) GPS from App (f = 1/60 Hz) (Phone App) | (3) Accelerometer from App (f = 60 Hz) | (3) Huawei watch (Photoplethysmogram with f = 100 Hz). | Sensors (noise and air monitor) and phone App(smart watch) | t-test to determine any significant difference between parameters. | - | - |
| 34 | Runkle, et al. [60] | H | 2 | (1) Temperature sensor (5-min) | (2) GPS from Garmin smartwatch | (2) Garmin smartwatch (1-min) | Sensors | (a) Categorize temperature data into “extreme heat” and “moderate heat”; (b) Caculate the average of maximum heart rate over a 5-min interval. | Reduction (5-min) | - | |
| 35 | Rybarczyk, et al. [61] | M | 3 (App) | (1) GoPro Hero (images about road) | (2) Tablet-based GPS from App | (3) Accelerometer from Garmin | (3) Garmin VívoSmart (1-s) | Sensors | (a) Removed GPS errors and missing data in GIS manaully and by the “remove duplicate” records tool in ArcGIS; (b) Normalize physiological data by using inverse distance weighting (IDW) in ArcGIS to create a smoothed raster surface. | Interpolation (spatially joined the interpolated values to track point layer to produce a completed and normalized database). | Over spatial units (Average based on spatial configuration of the environment). |
| 36 | Shoval, et al. [62] | M | 2+1 (App) | - | (1) Phone-based GPS from App (1 min) | - | (2) Empatica4 (f = 16 Hz) and phone (Phone App based location-triggered and time-triggered surveys). | Sensors and phone | Calculate z-scores for each measurement to normalize Skin Conductance Level (SCL). | Frequency Reduction (mean SCL z-scores over 1 min) | Over individuals and spatial units (based on 20 m× 20 m cellular network). |
| 37 | Steinle, et al. [63] | L | 2 | (1) Dylos 1700 for measuring PM concentrations (1 min) | (2) GPS receiver (every 10 s) | - | - | Sensors | (a) Classify Microenvironment into six types | Match data by the Feature Manipulation Engine software (Safe software Inc., 2014) at every full minute. | Over time (hours) and spatial units (Microenvironment types) and individuals. |
| 38 | West, et al. [64] | L | 2 | (1) Dylos 1700 | (2) GPS receiver (every 10 s) | - | - | Sensors | - | Average in timeframes (1 min) | Over time (each 30 min period) and spatial units (based on each 50 m grid square) and individuals. |
| 39 | Zhang, et al. [65] | H | 4 (App) | (1) Noise sensors (one-minute intervals); (2) Air sensors (1 s) connected a Phone App; (3) A mobile signal detection device. | (4) Phone-based GPS (f =1 Hz) | - | - | Sensors and Phone App | Use A-weighted equivalent sound pressure level to calculate the sound exposure. | - | Over time (Average value of A sound level for a certain period of time). |
| Preparation | |
| Recruitment of participants | |
| Fieldwork design | |
| Time-series measurement | |
| Multiple sensor selection | |
| Objective |
|
| Choose sensors | These should be considered:
|
| Test the accuracy of sensors | |
| Data collection | |
| User’s operation | Decrease human factors:
|
| Avoid | Decrease non-human factors include environmental noises and technical noises: |
| Data load |
|
| Data integration | |
| Data processing | Clean the noise and unwanted signals: |
| Normalization |
|
| Frequency unification | Pair the frequency: |
| Aggregation | Aggregate data for statistics and visualization |
| New development | Develop an integrated system (e.g., smartphone, web-platform, software) to automatically process sensor data, store and visualize due to its portability and accessibility [41,42]. |
Publisher’s Note: MDPI stays neutral with regard to jurisdictional claims in published maps and institutional affiliations. |
© 2021 by the authors. Licensee MDPI, Basel, Switzerland. This article is an open access article distributed under the terms and conditions of the Creative Commons Attribution (CC BY) license (https://creativecommons.org/licenses/by/4.0/).
Share and Cite
Zhang, Z.; Amegbor, P.M.; Sabel, C.E. Assessing the Current Integration of Multiple Personalised Wearable Sensors for Environment and Health Monitoring. Sensors 2021, 21, 7693. https://doi.org/10.3390/s21227693
Zhang Z, Amegbor PM, Sabel CE. Assessing the Current Integration of Multiple Personalised Wearable Sensors for Environment and Health Monitoring. Sensors. 2021; 21(22):7693. https://doi.org/10.3390/s21227693
Chicago/Turabian StyleZhang, Zhaoxi, Prince Michael Amegbor, and Clive Eric Sabel. 2021. "Assessing the Current Integration of Multiple Personalised Wearable Sensors for Environment and Health Monitoring" Sensors 21, no. 22: 7693. https://doi.org/10.3390/s21227693
APA StyleZhang, Z., Amegbor, P. M., & Sabel, C. E. (2021). Assessing the Current Integration of Multiple Personalised Wearable Sensors for Environment and Health Monitoring. Sensors, 21(22), 7693. https://doi.org/10.3390/s21227693