
Locomotion Mode Transition Prediction Based on Gait-Event Identification Using Wearable Sensors and Multilayer Perceptrons


Abstract
:1. Introduction
2. Methods
2.1. Participants
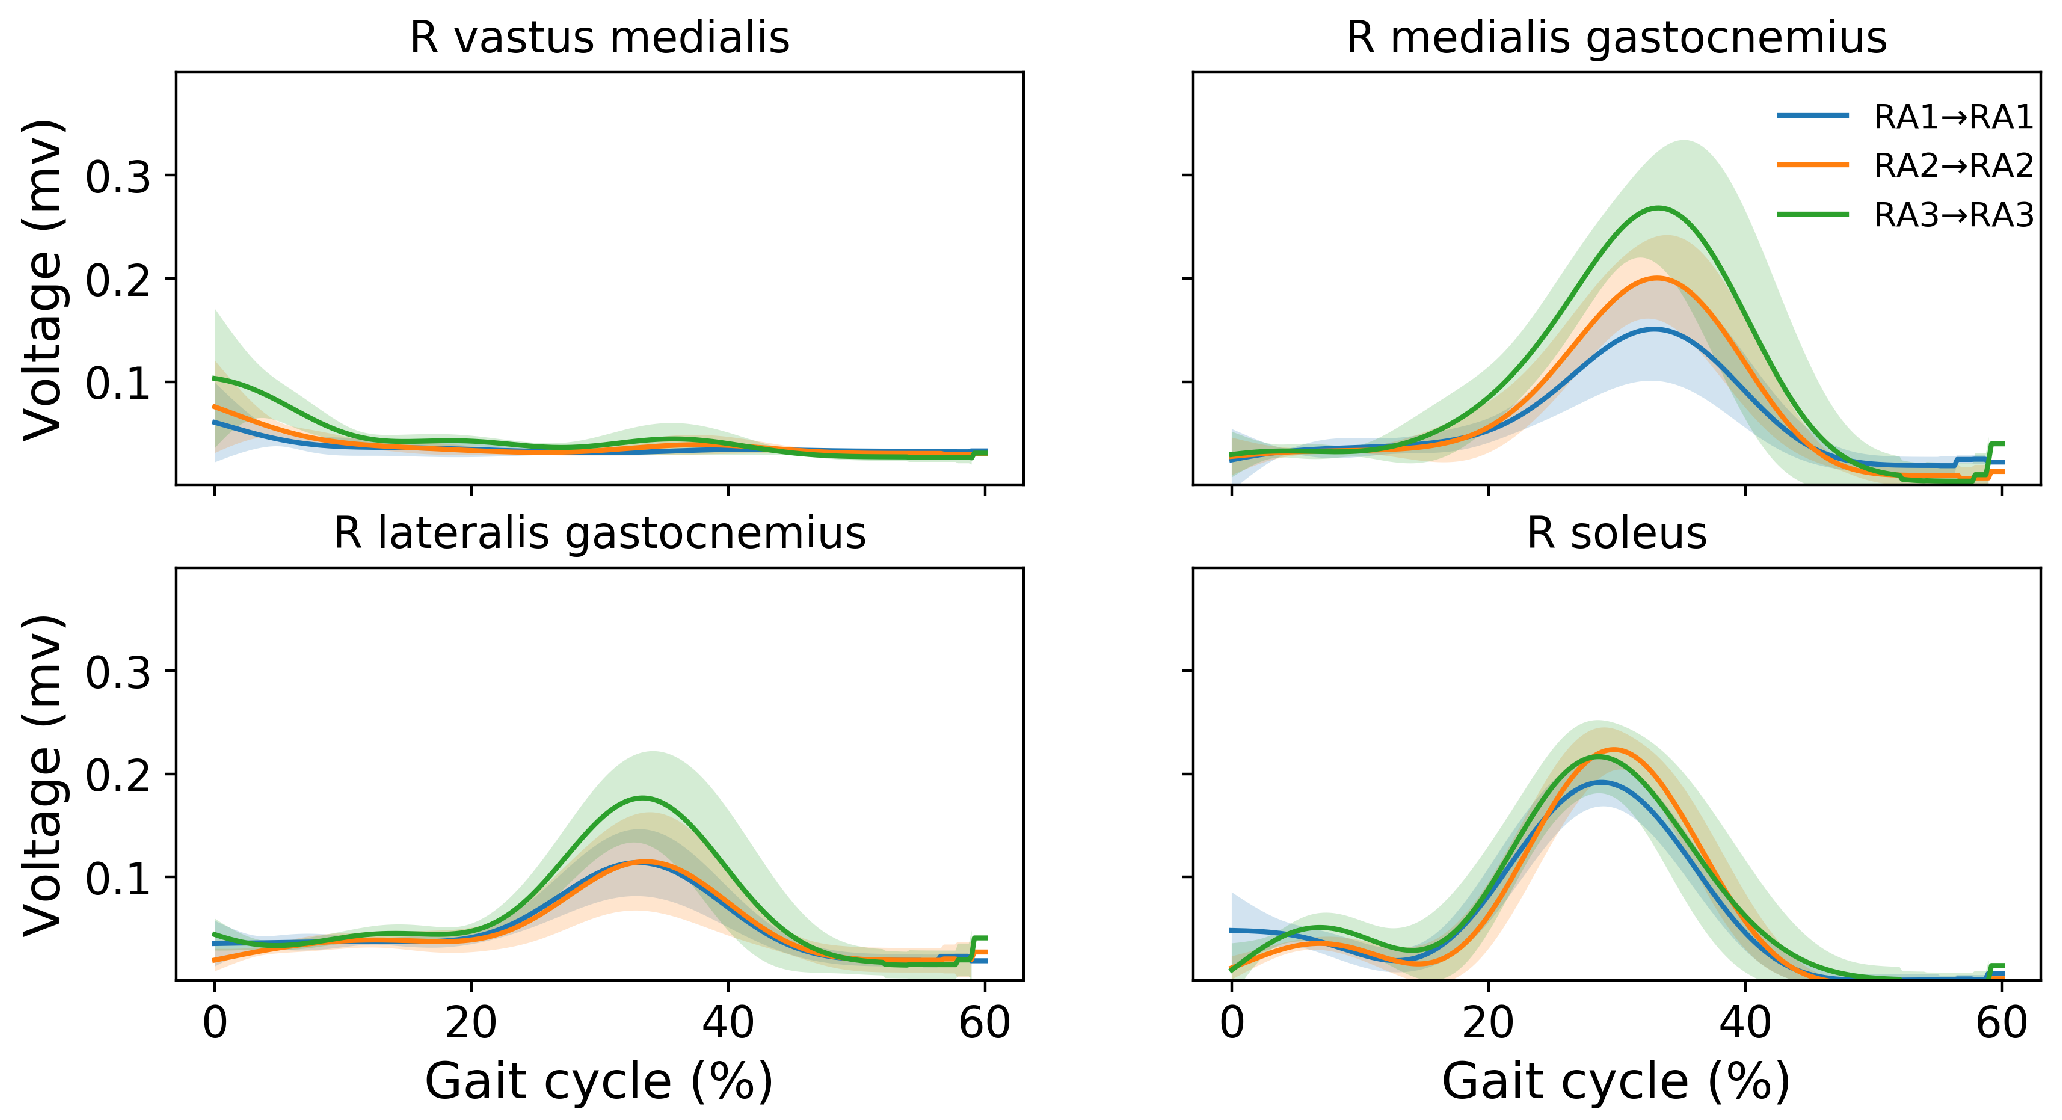
2.2. Experimental Protocol and Data Collection
2.3. Data Processing
2.4. Multilayer Perceptron (MLP)
2.5. Performance Evaluation
3. Results
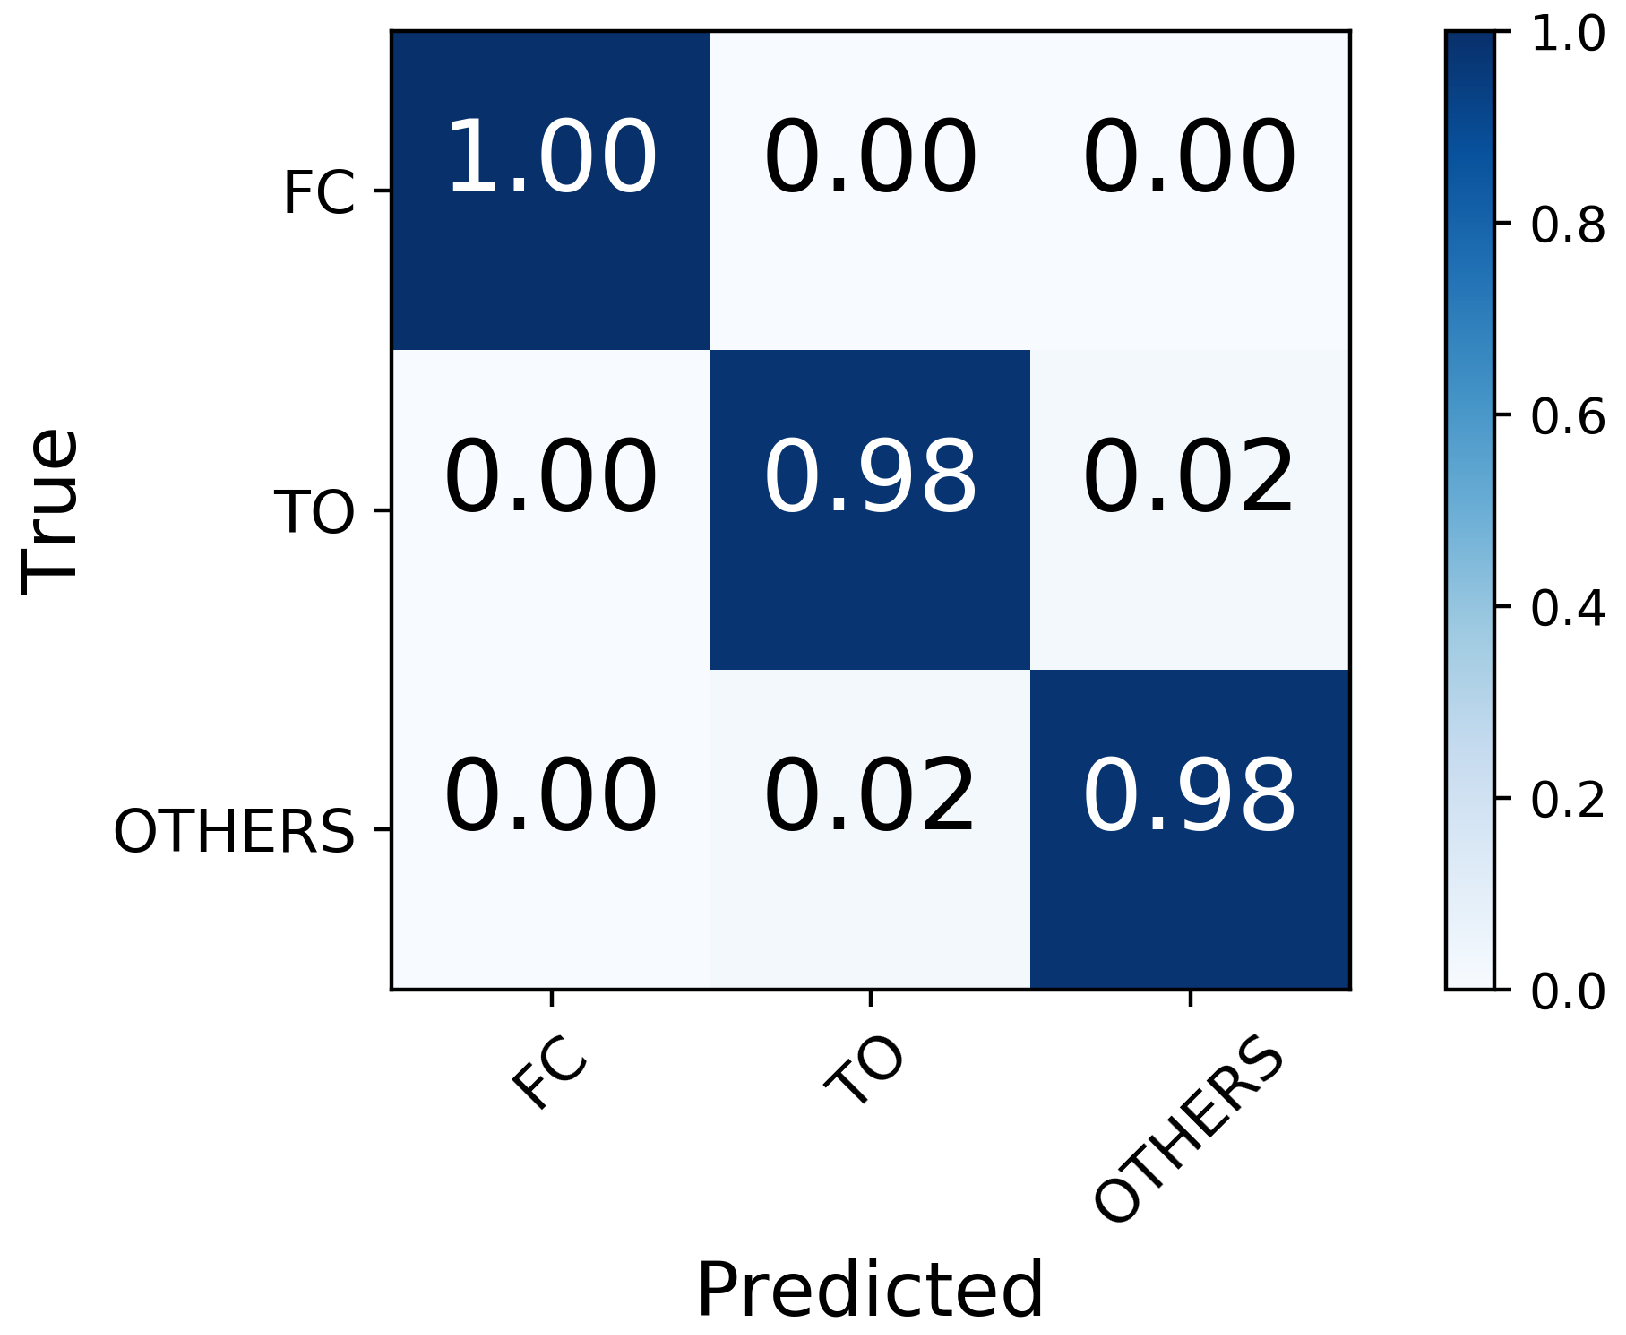
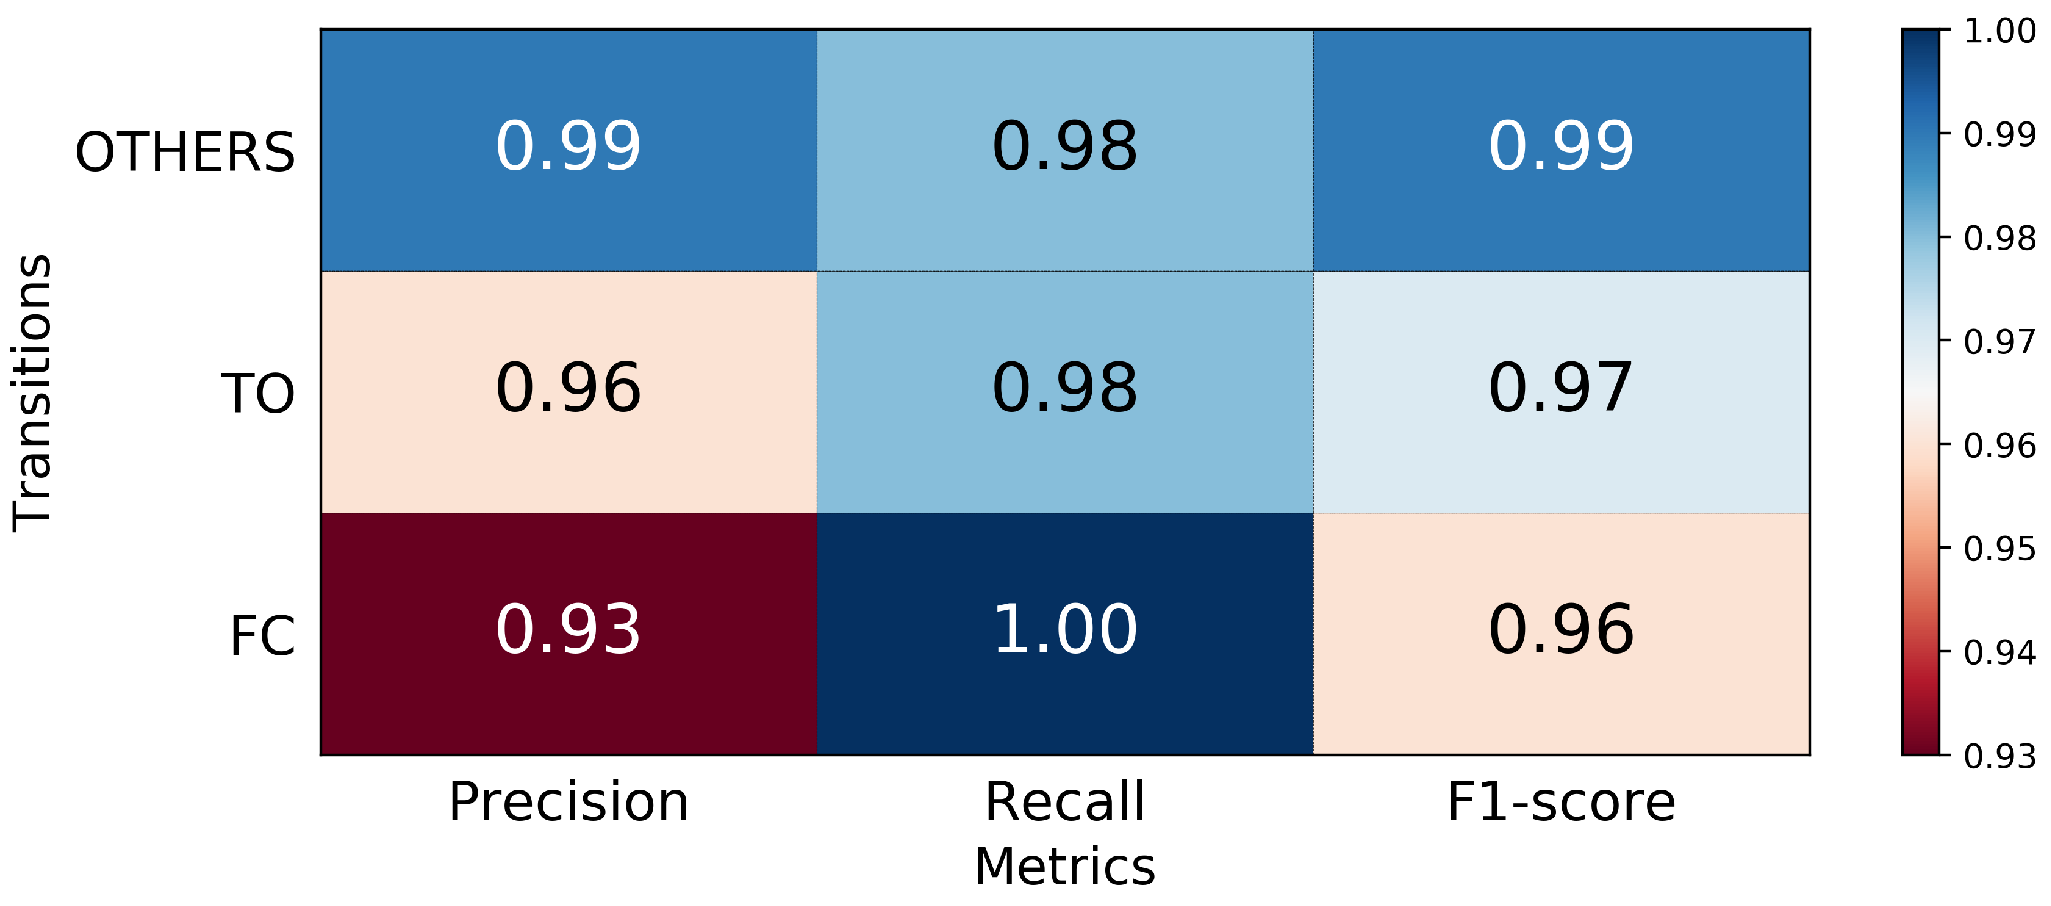
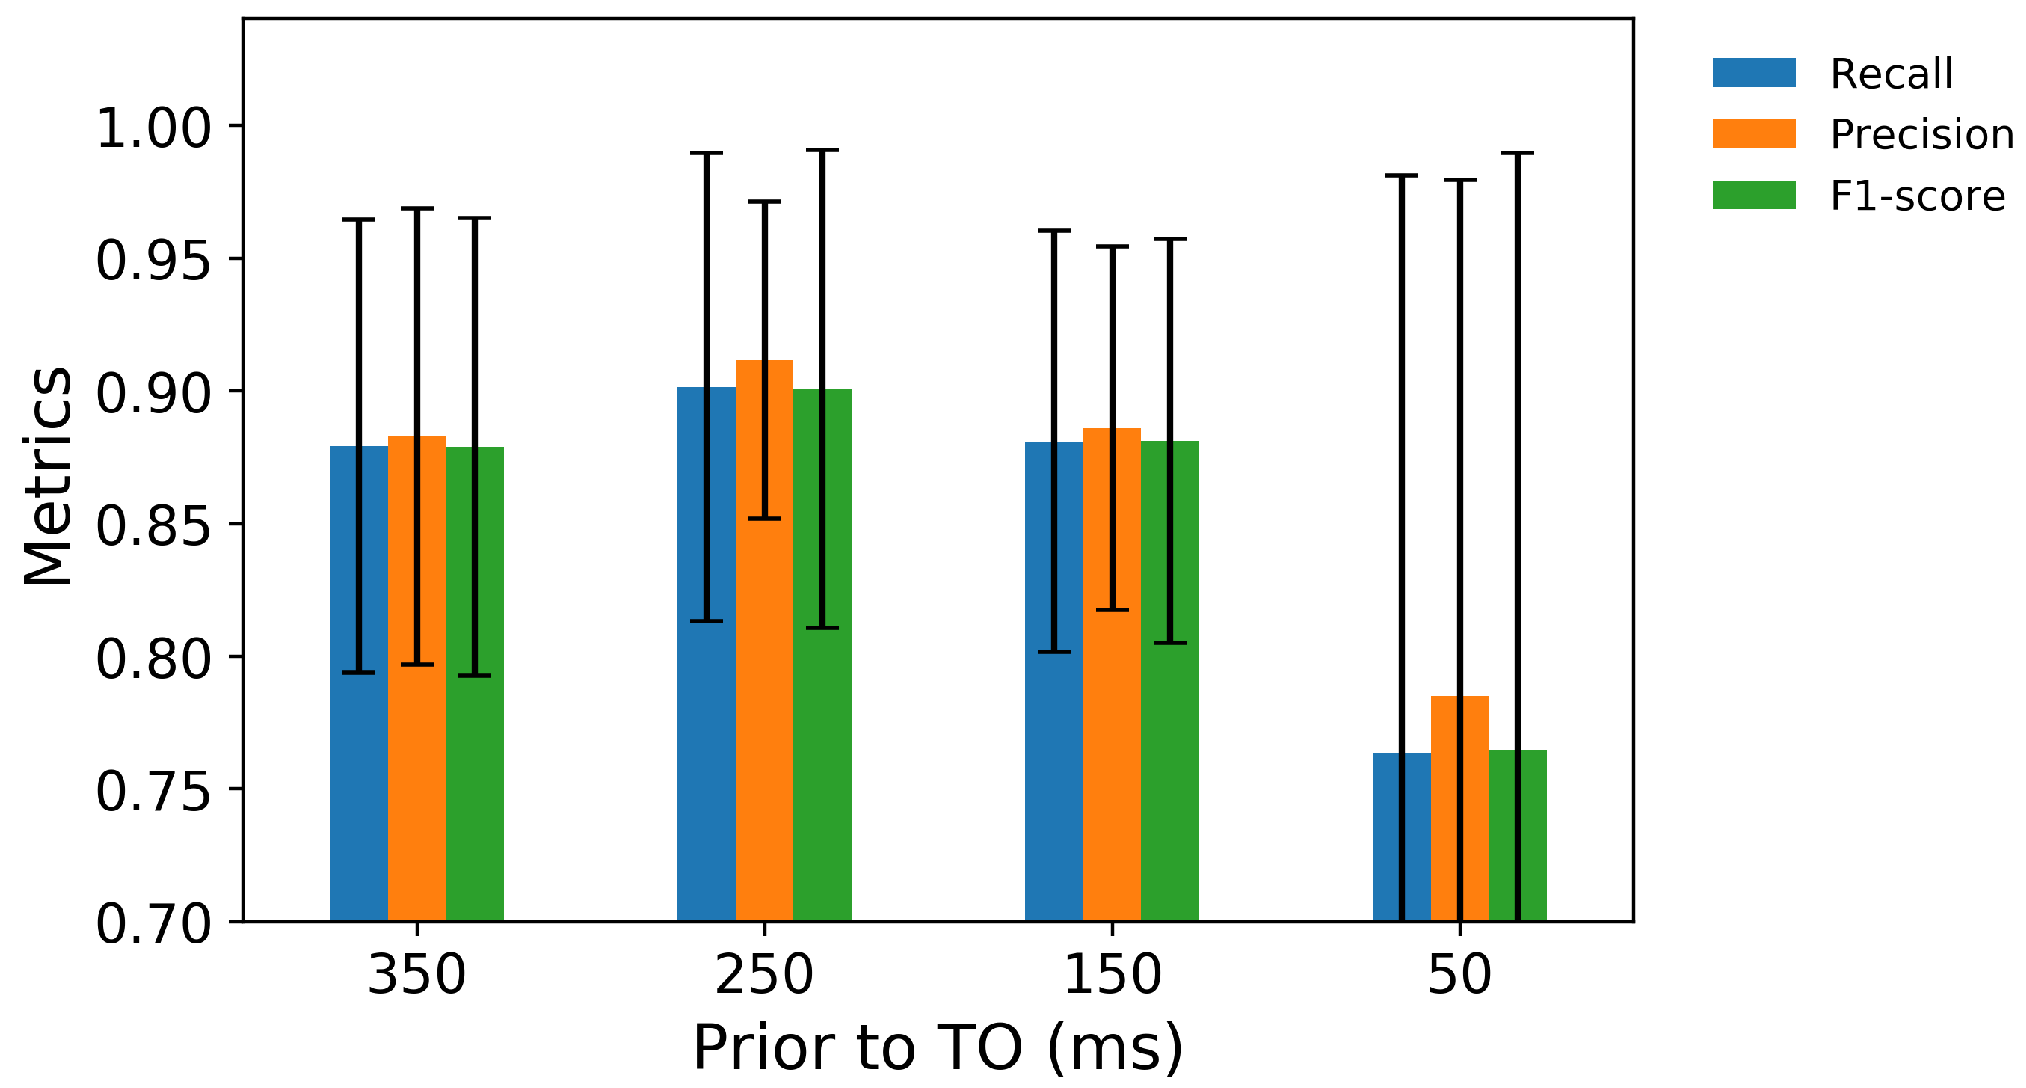
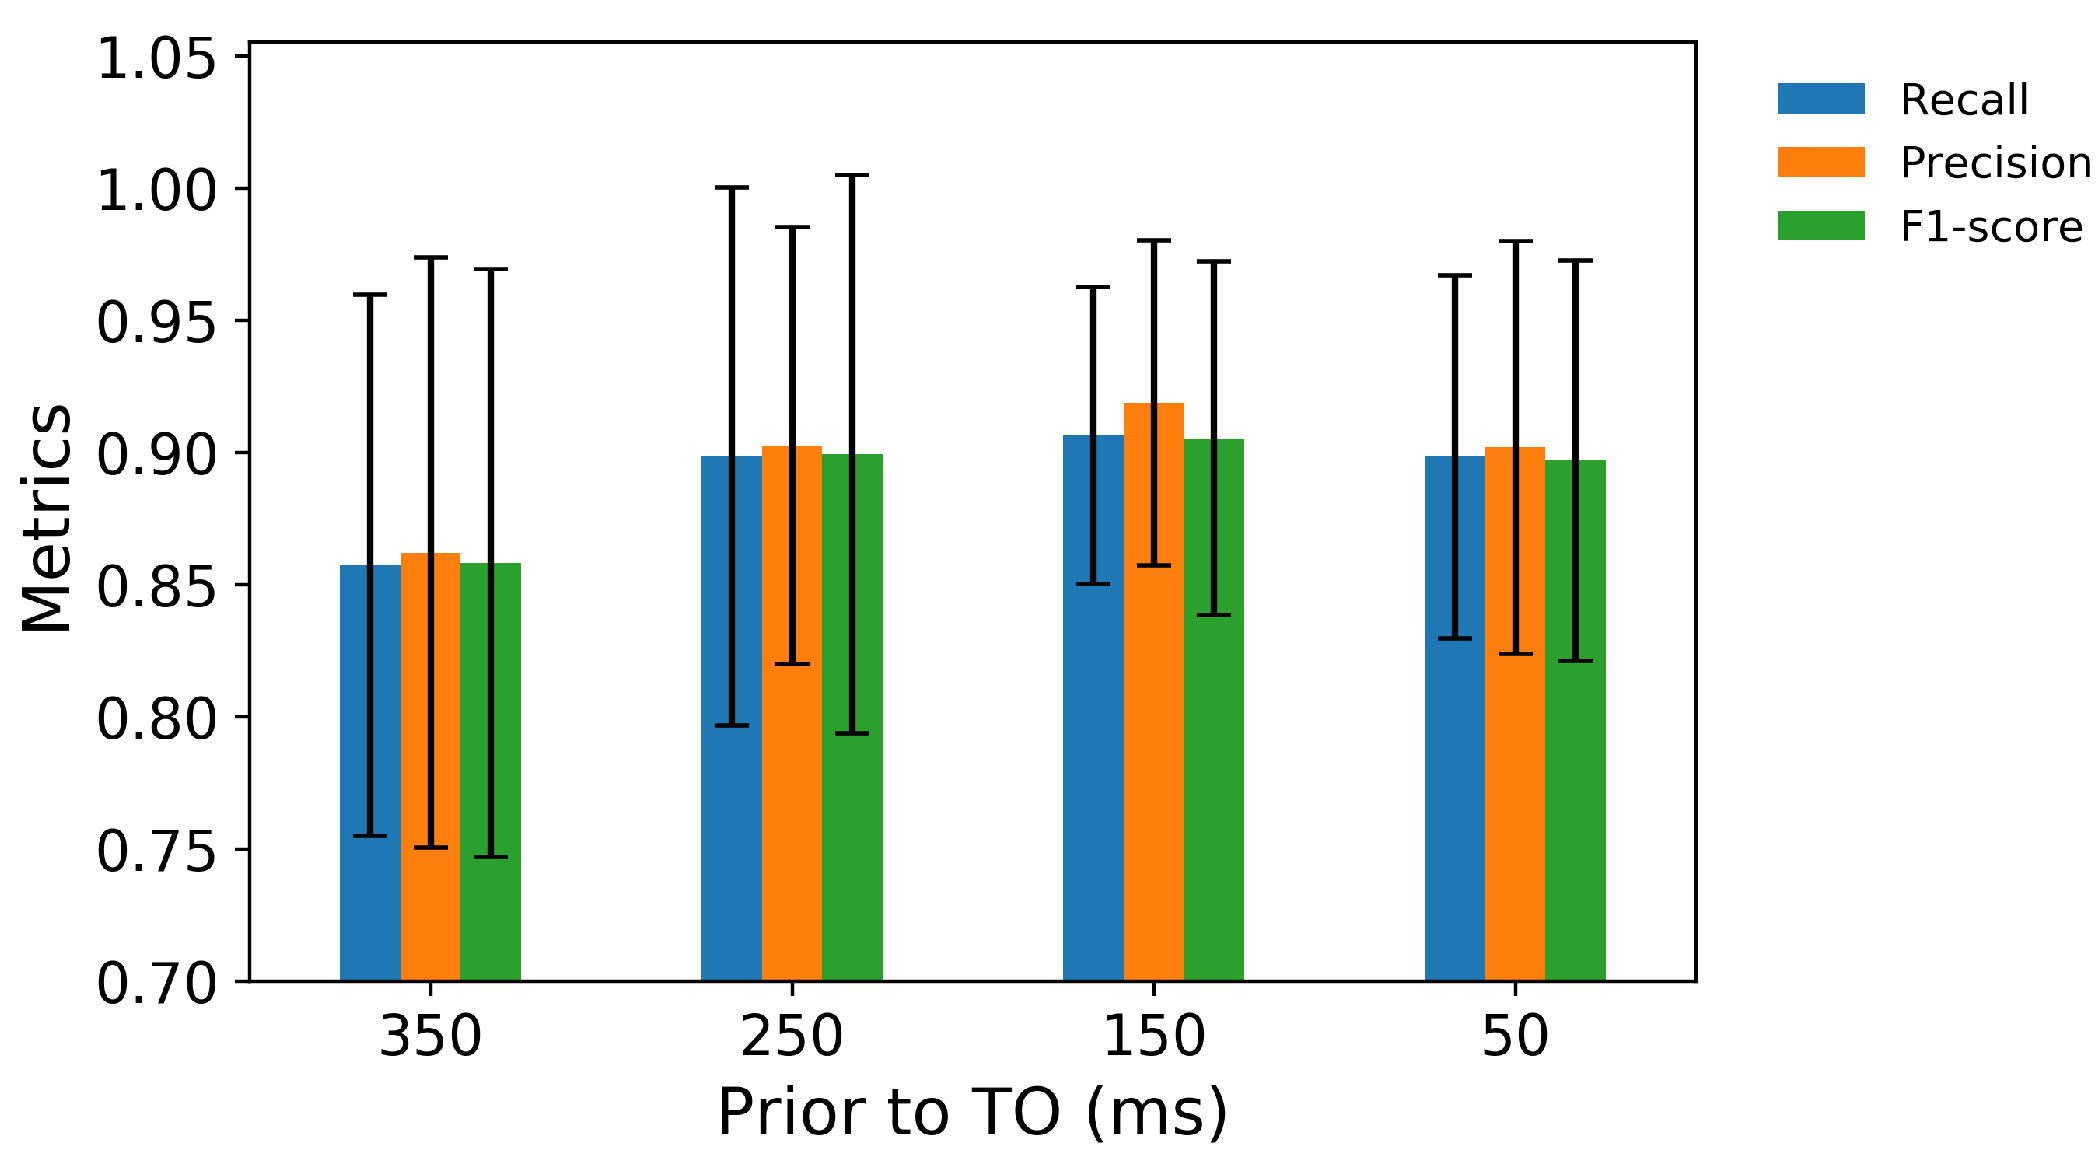
3.1. Performance in FC and TO Identification
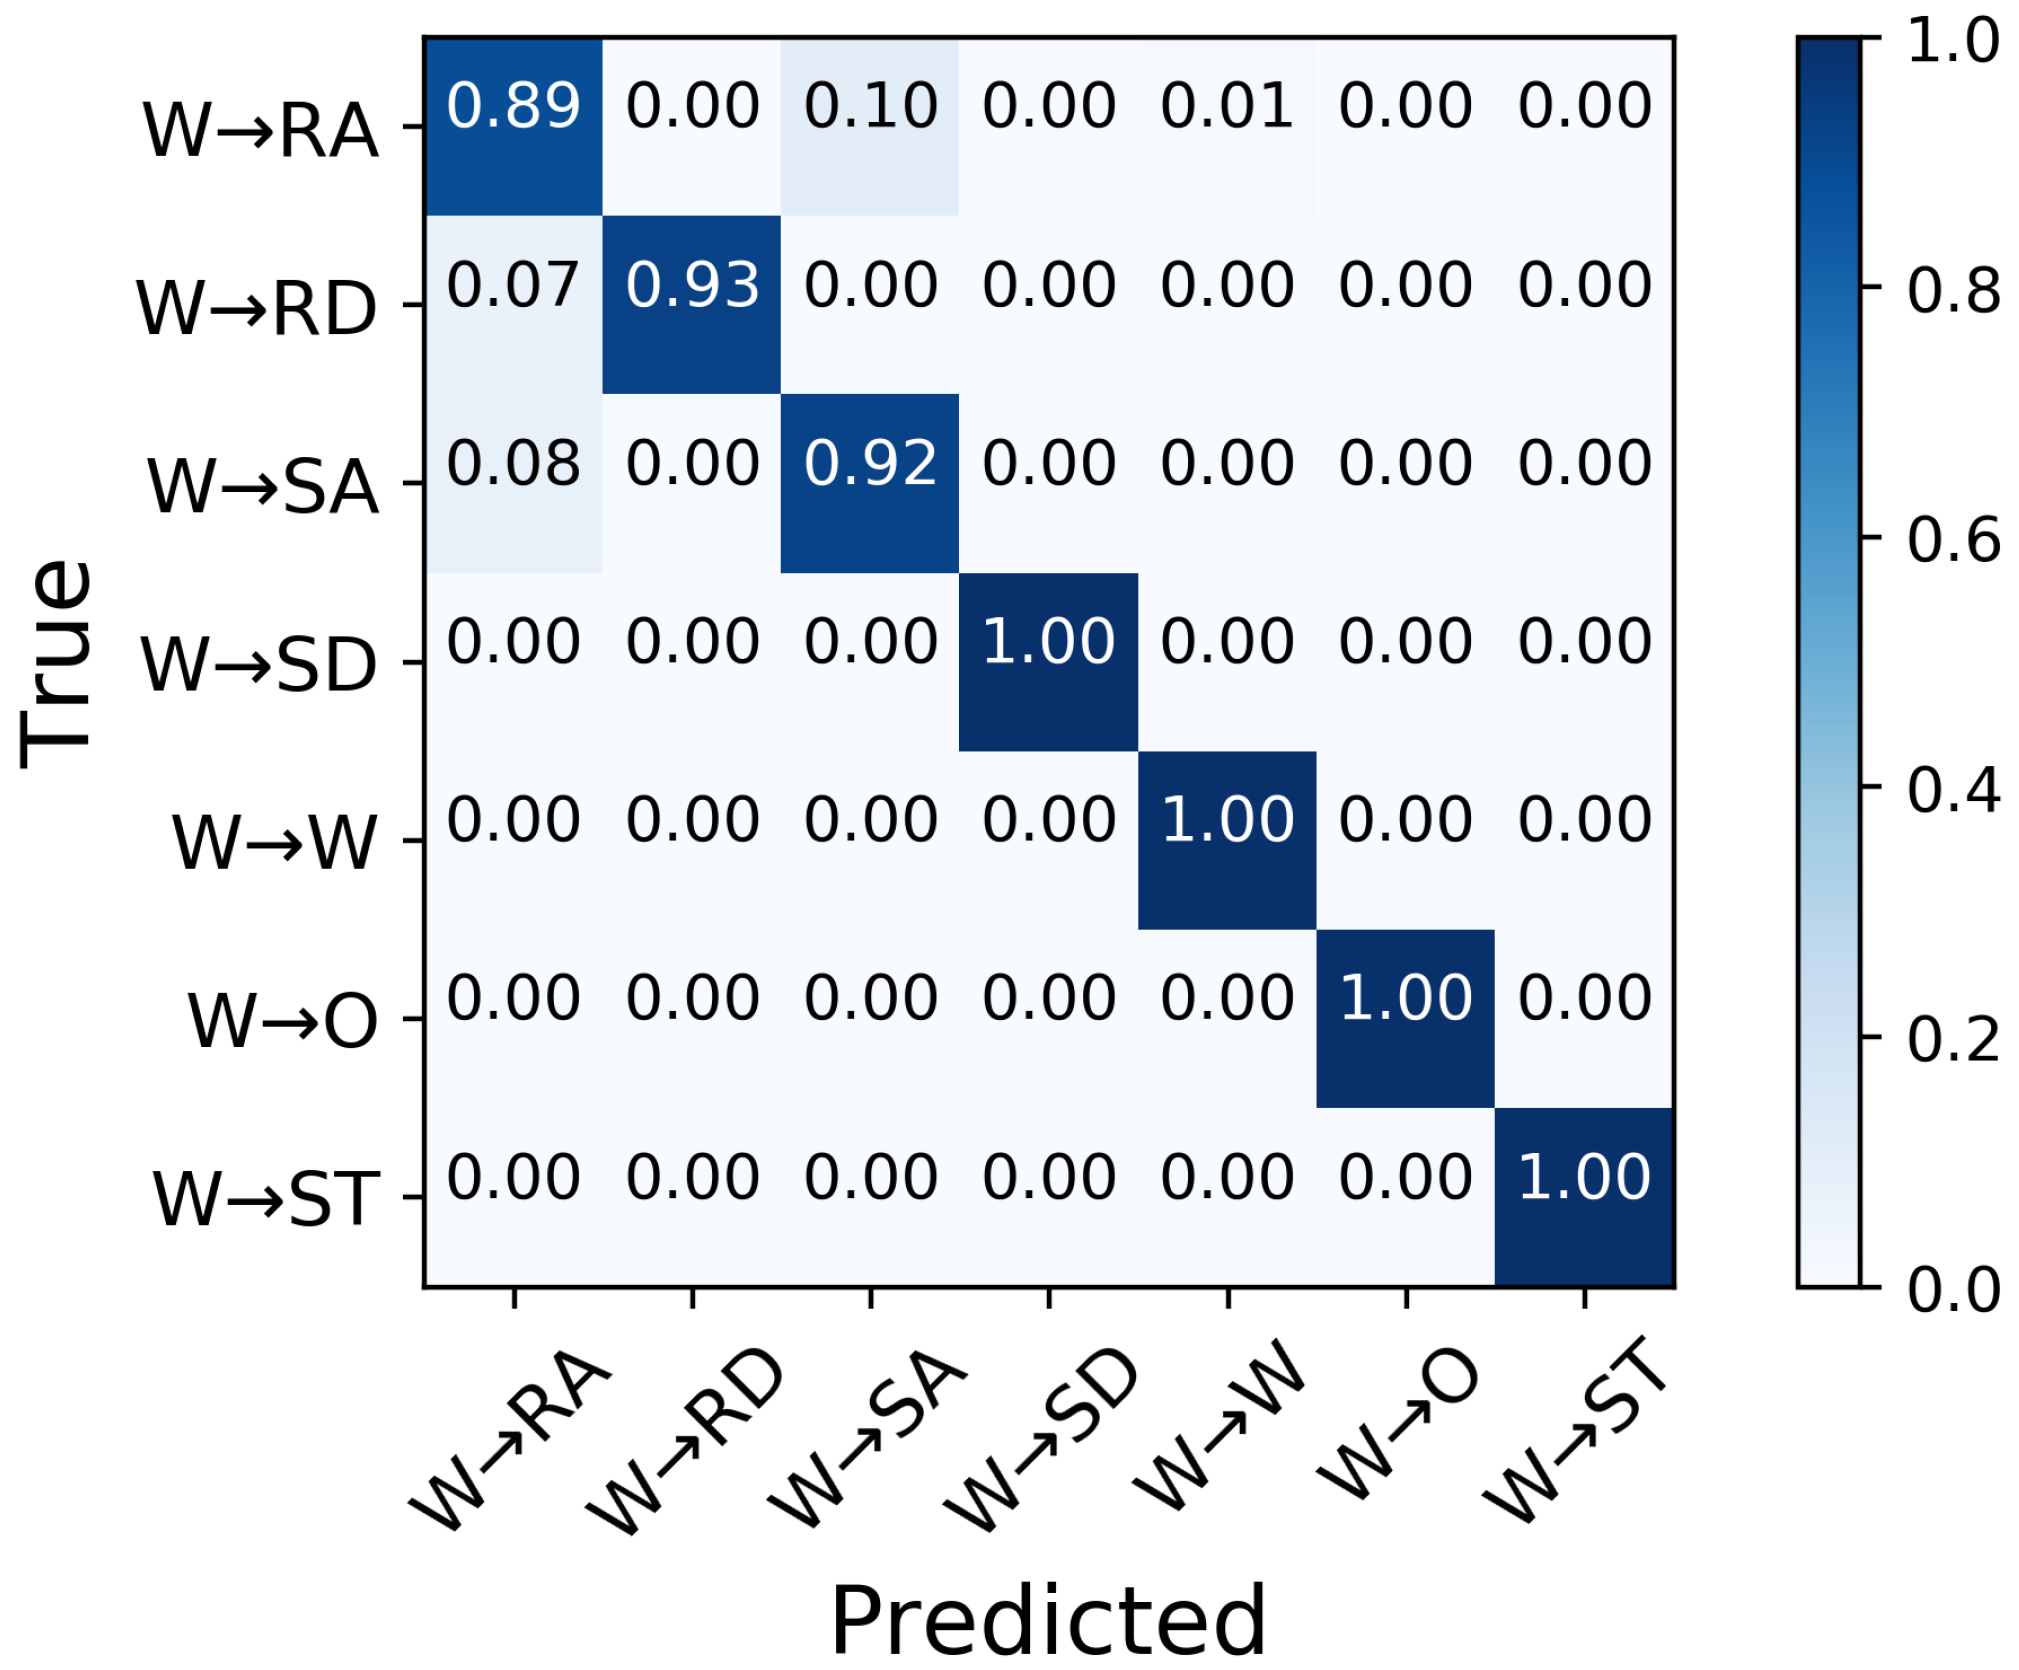
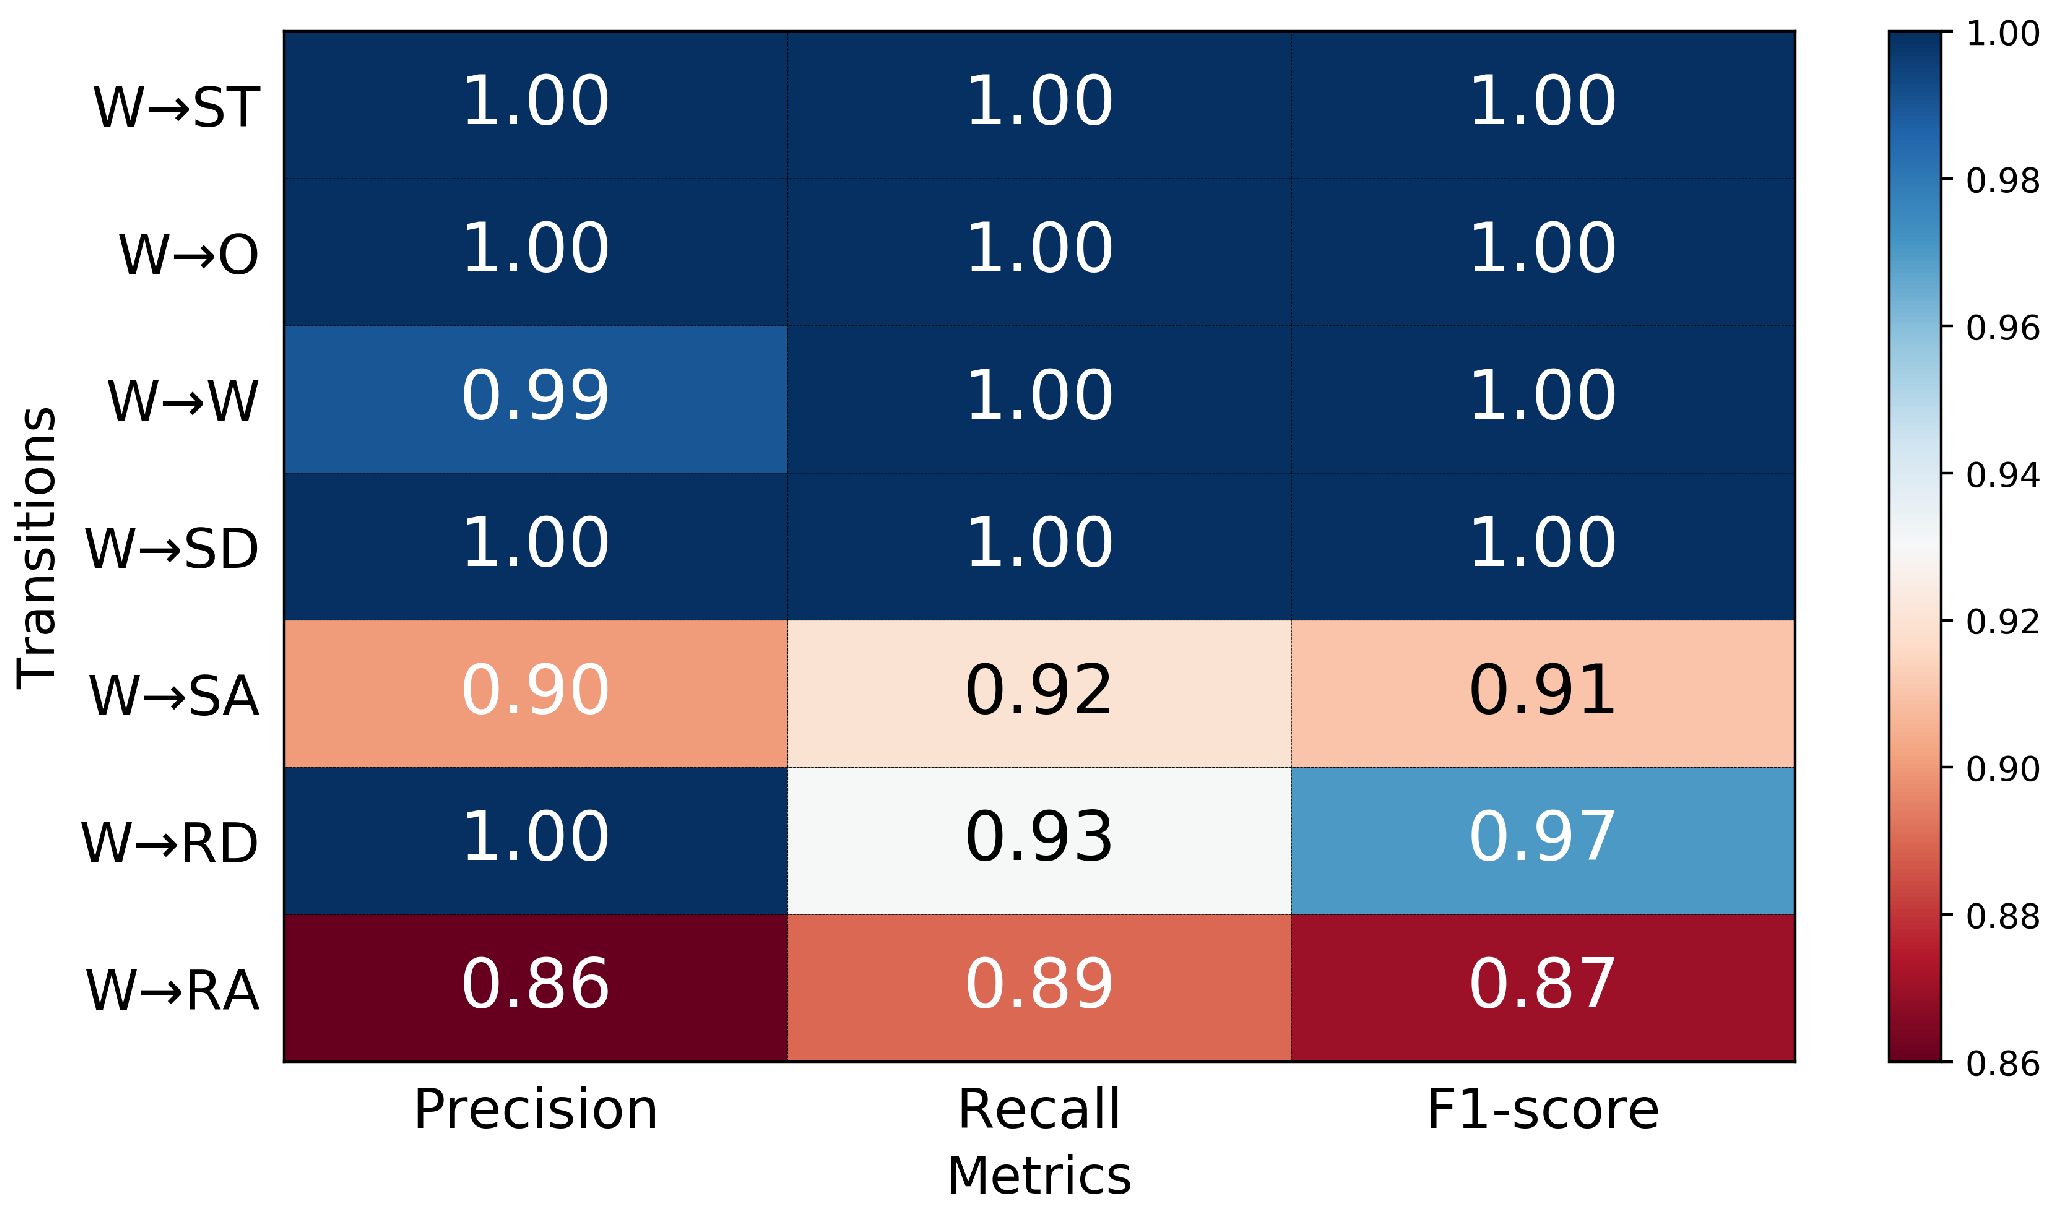
3.2. Performance in Predicting Transitions from Walking
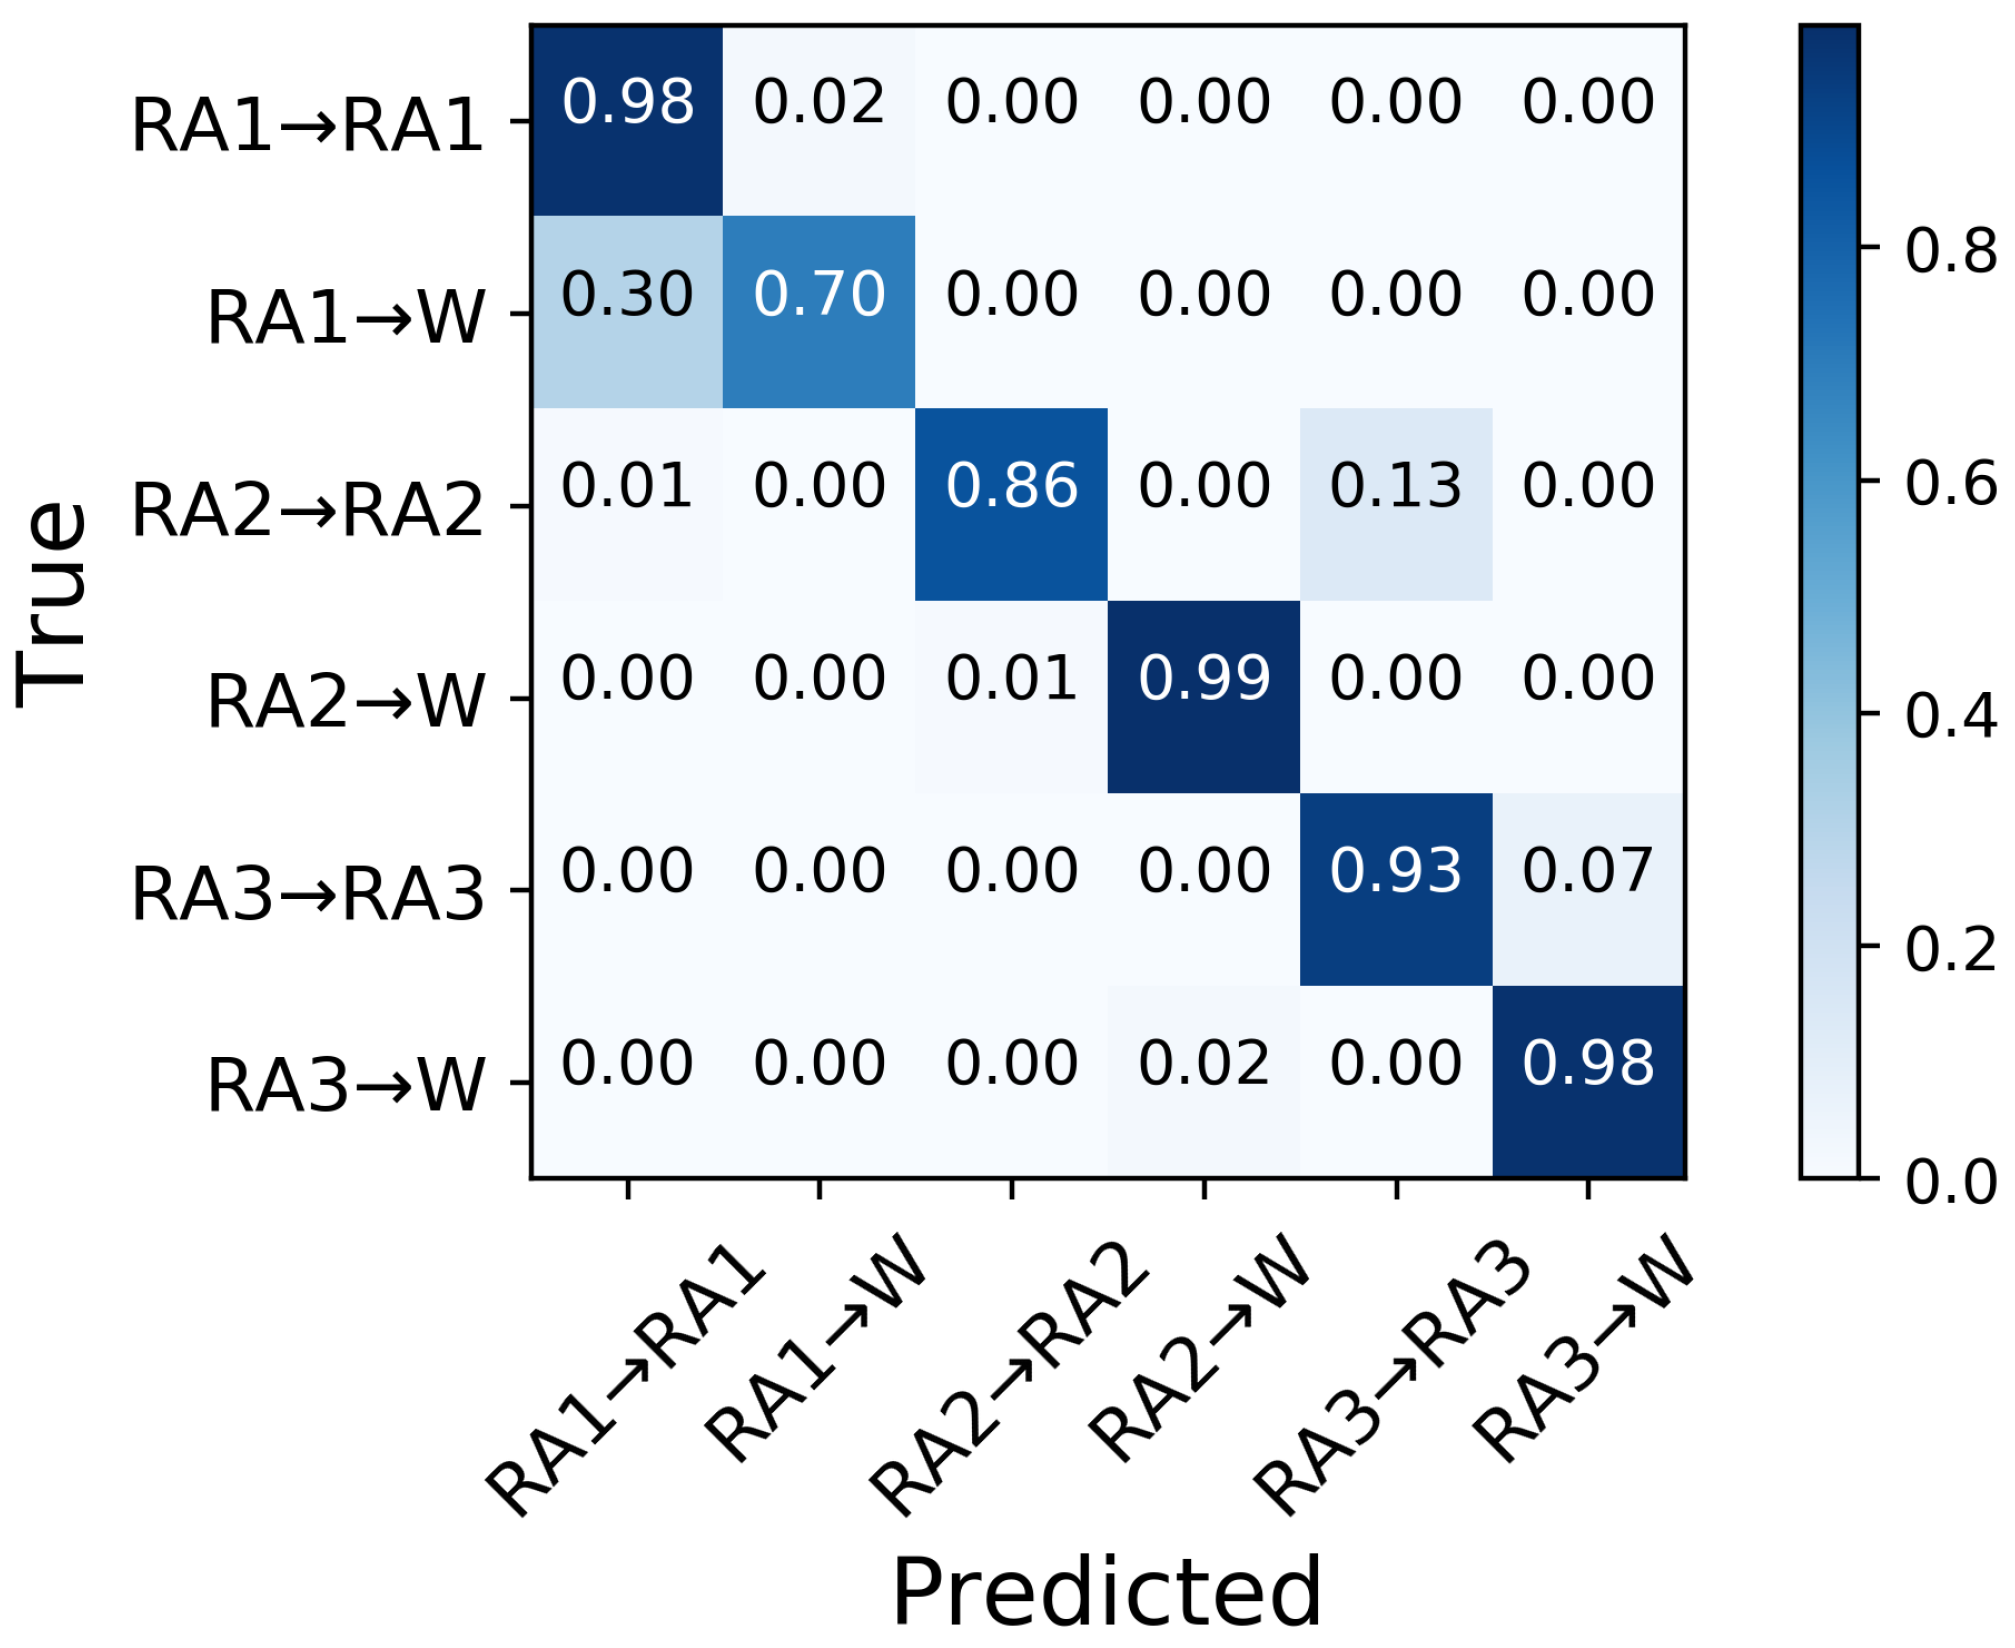
3.3. Performance in Predicting Transitions from Ramp Ascent
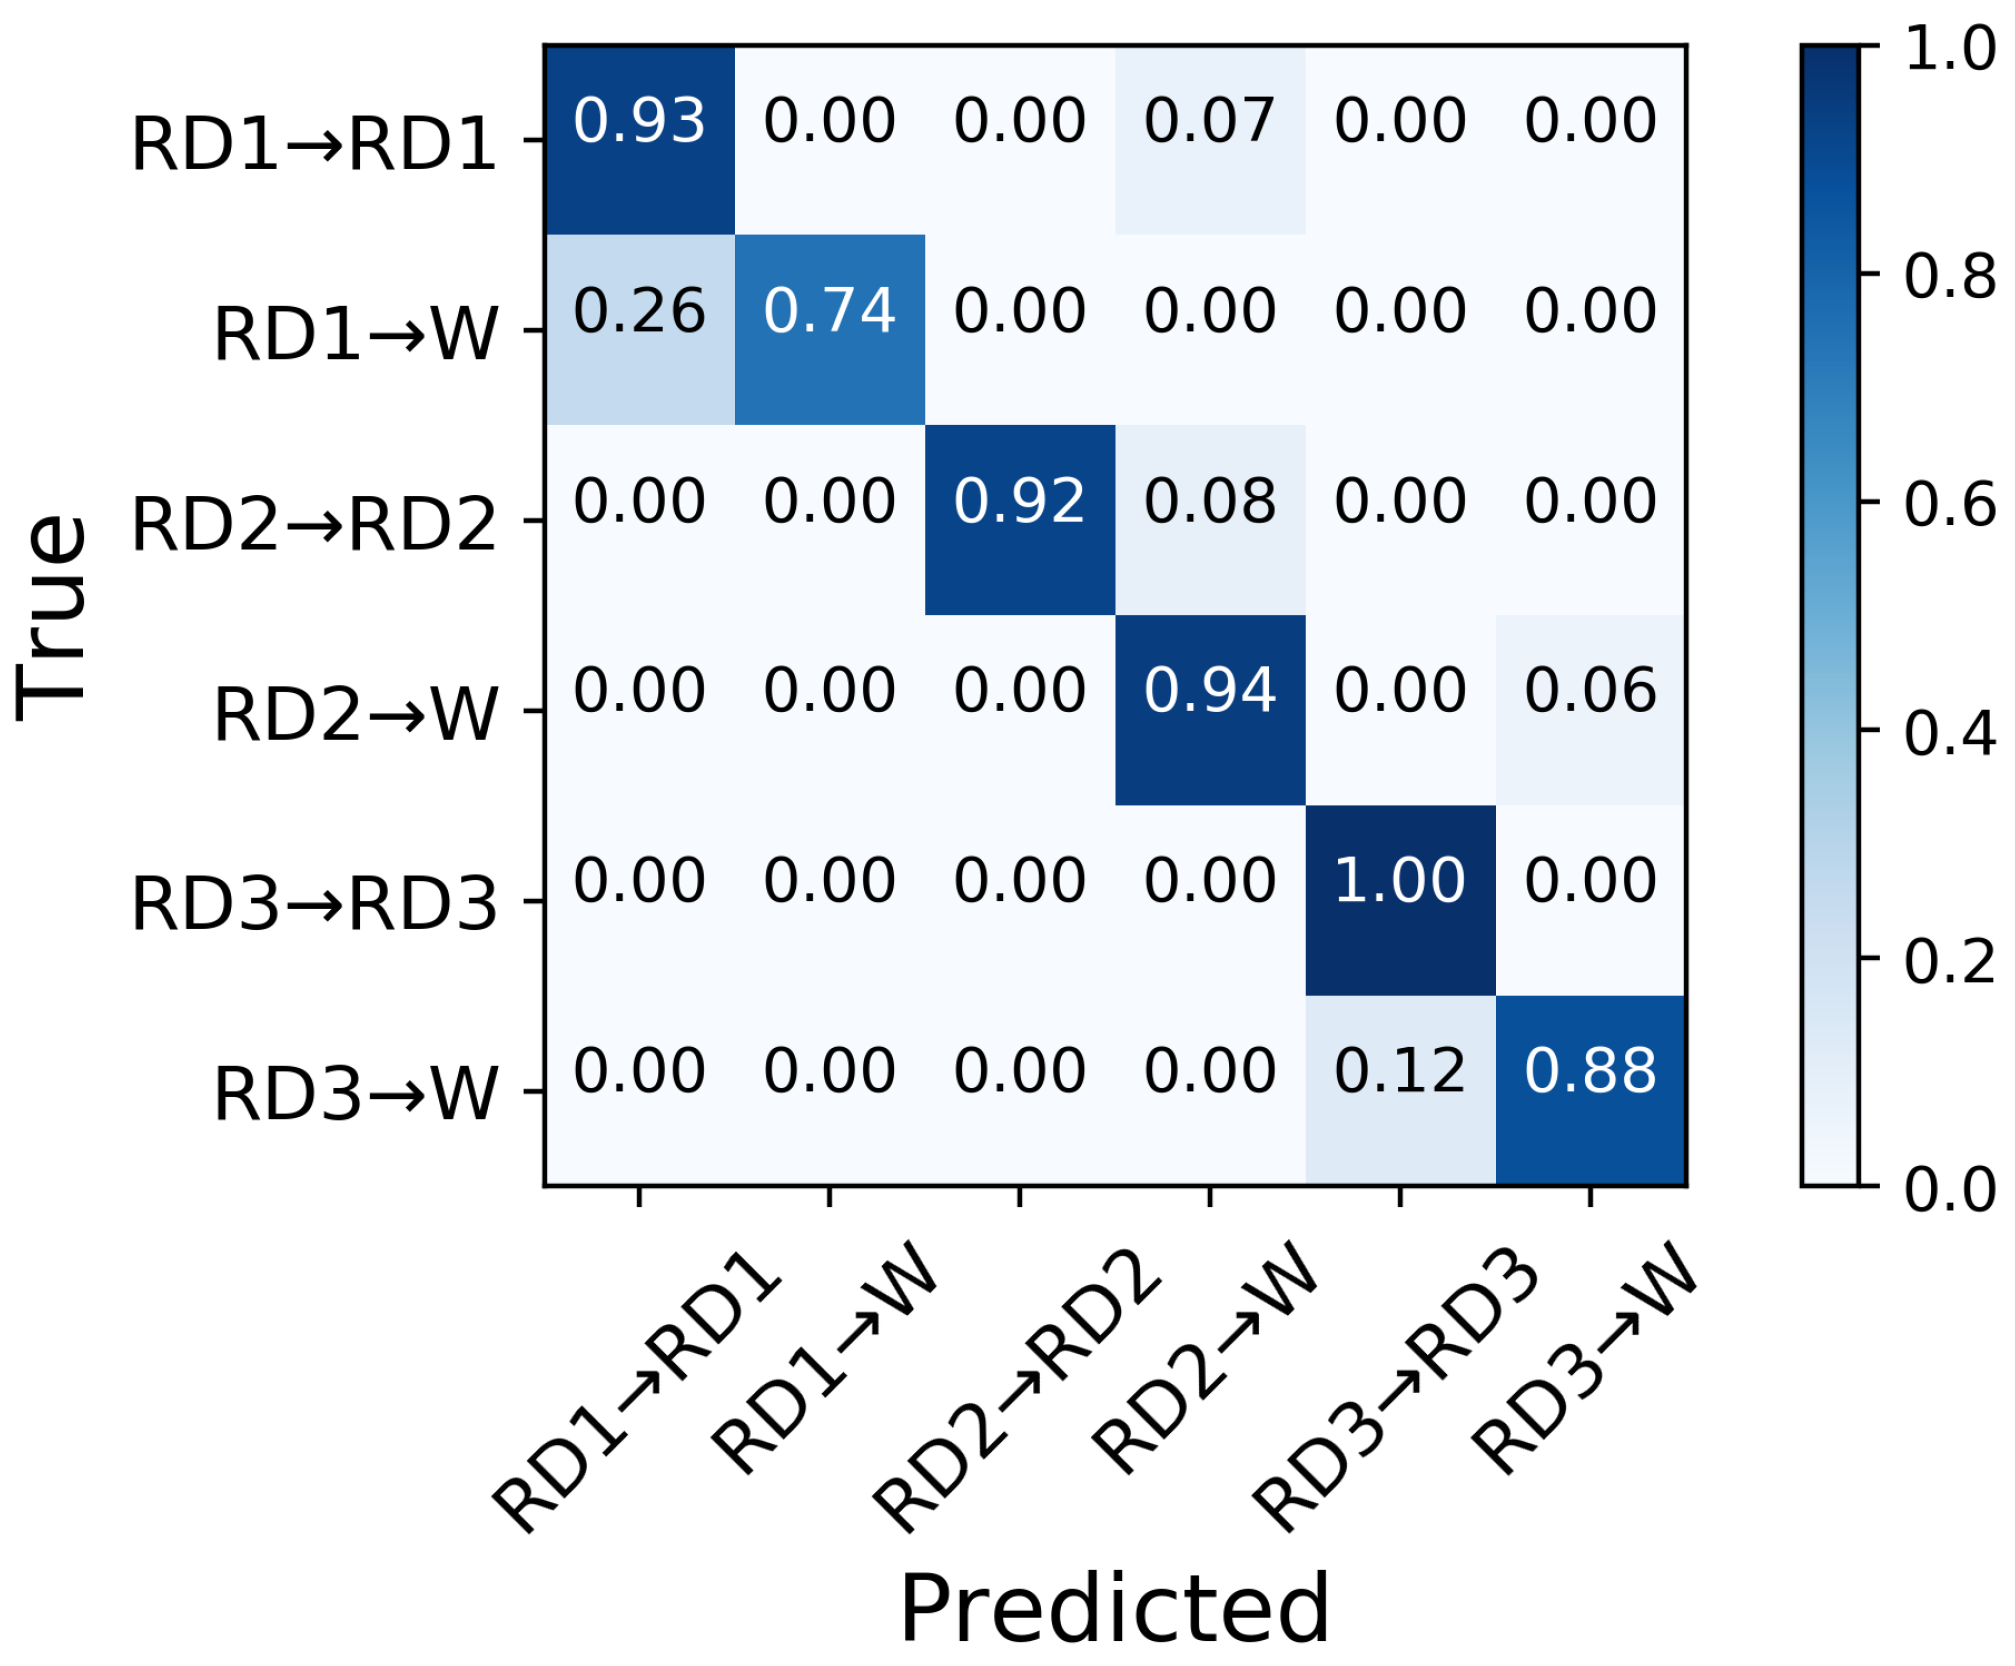
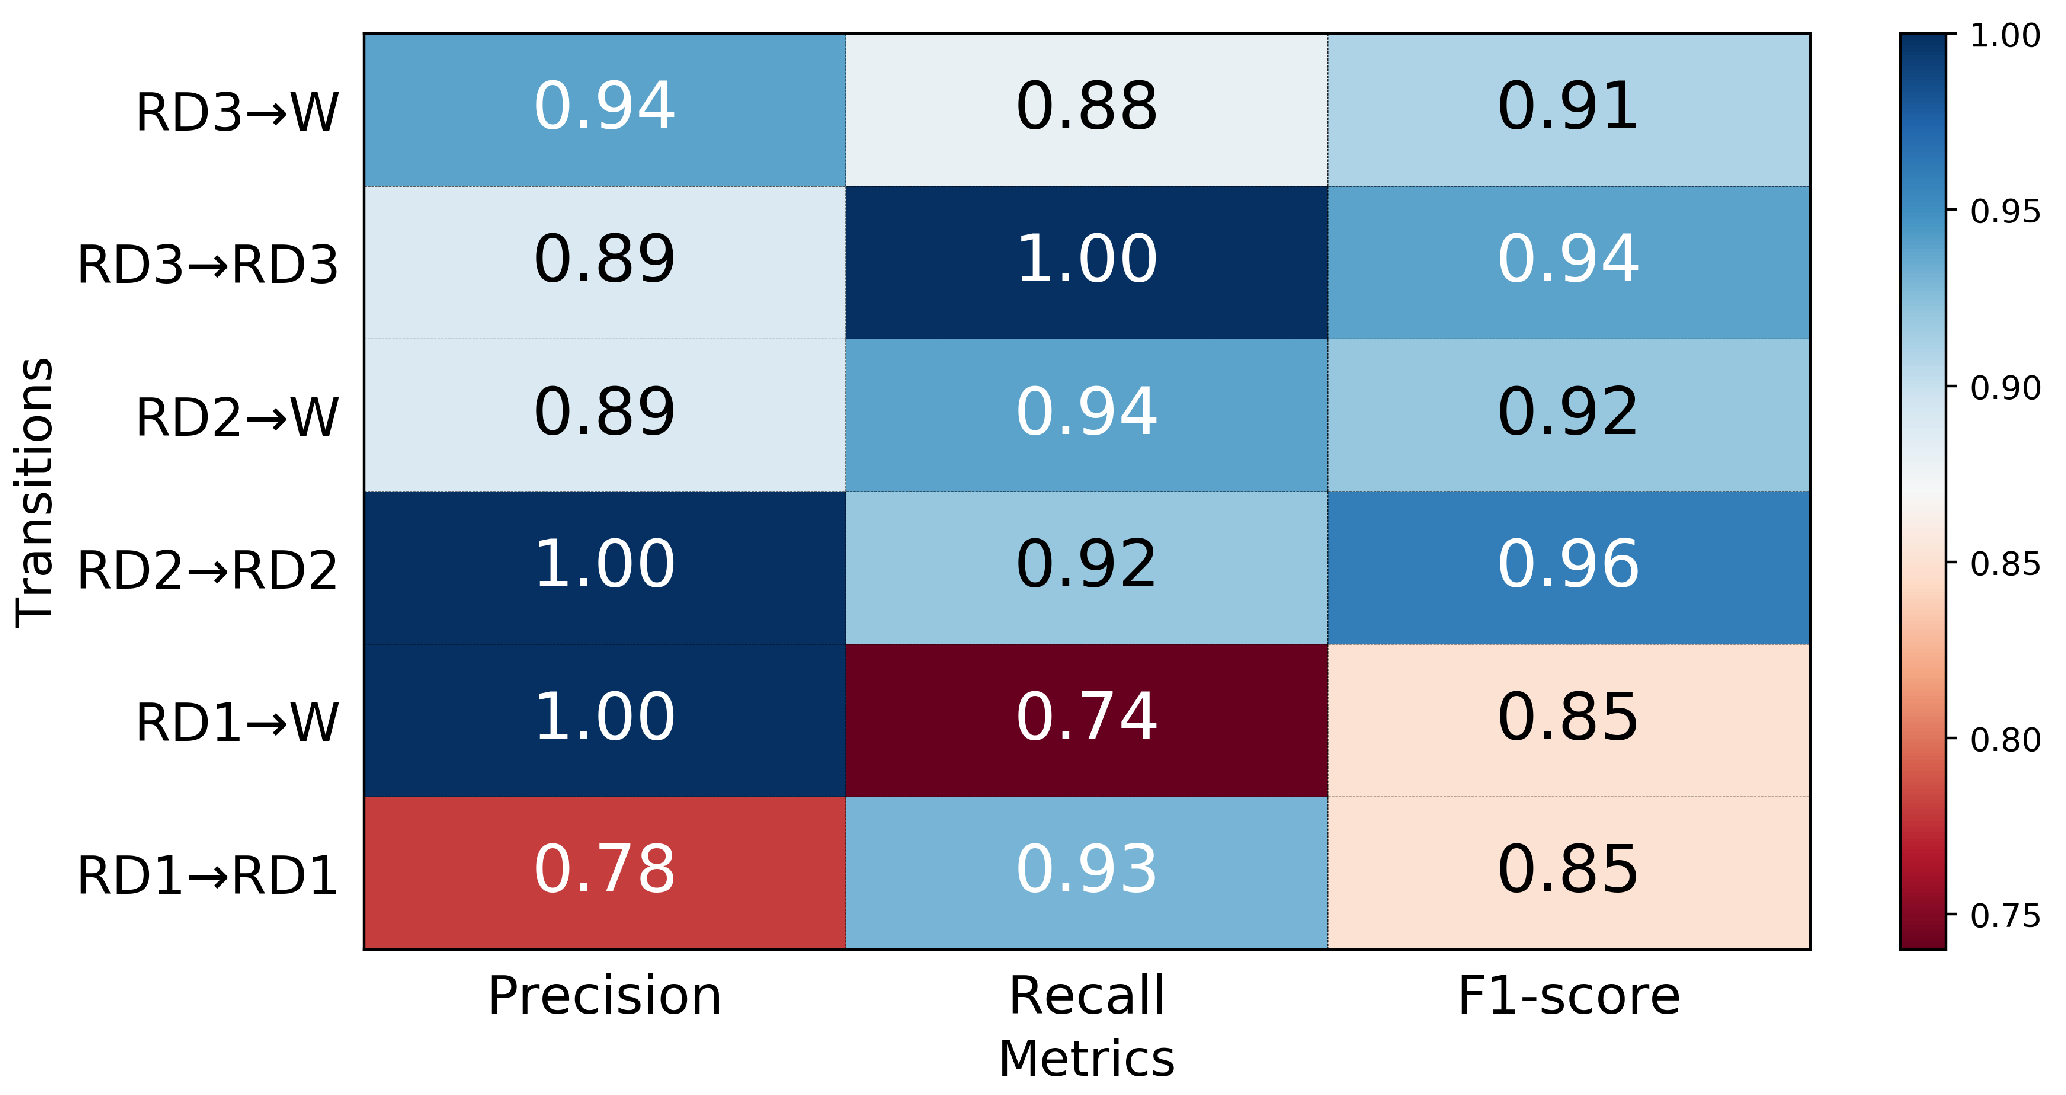
3.4. Performance in Predicting Transitions from Ramp Descent
4. Discussion
5. Conclusions
Author Contributions
Funding
Institutional Review Board Statement
Informed Consent Statement
Data Availability Statement
Conflicts of Interest
Abbreviations
| MLP | Multilayer perceptron |
| IMU | Inertial measurement unit |
| EMG | Electromyograph |
| W | Walking |
| RA | Ramp ascent |
| RD | Ramp descent |
| SA | Stair ascent |
| SD | Stair descent |
| O | Obstacle |
| FC | Foot contact |
| TO | Toe off |
Appendix A
References
- Au, S.; Berniker, M.; Herr, H. Powered ankle-foot prosthesis to assist level-ground and stair-descent gaits. Neural Netw. 2008, 21, 654–666. [Google Scholar] [CrossRef] [PubMed]
- Jackson, R.W.; Collins, S.H. An experimental comparison of the relative benefits of work and torque assistance in ankle exoskeletons. J. Appl. Physiol. 2015, 119, 541–557. [Google Scholar] [CrossRef] [Green Version]
- Herr, H.M.; Grabowski, A.M. Bionic ankle–foot prosthesis normalizes walking gait for persons with leg amputation. Proc. R. Soc. B Biol. Sci. 2012, 279, 457–464. [Google Scholar] [CrossRef] [Green Version]
- Fite, K.; Mitchell, J.; Sup, F.; Goldfarb, M. Design and control of an electrically powered knee prosthesis. In Proceedings of the 2007 IEEE 10th International Conference on Rehabilitation Robotics, Noordwijk, The Netherlands, 13–15 June 2007; pp. 902–905. [Google Scholar]
- Martinez-Villalpando, E.C.; Herr, H. Agonist-antagonist active knee prosthesis: A preliminary study in level-ground walking. J. Rehabil. Res. Dev. 2009, 46, 361–373. [Google Scholar] [CrossRef]
- Rouse, E.J.; Mooney, L.M.; Herr, H.M. Clutchable series-elastic actuator: Implications for prosthetic knee design. Int. J. Rob. Res. 2014, 33, 1611–1625. [Google Scholar] [CrossRef]
- Hoover, C.D.; Fulk, G.D.; Fite, K.B. The design and initial experimental validation of an active myoelectric transfemoral prosthesis. J. Med. Devices 2012, 6, 011005. [Google Scholar] [CrossRef]
- Simon, A.M.; Ingraham, K.A.; Fey, N.P.; Finucane, S.B.; Lipschutz, R.D.; Young, A.J.; Hargrove, L.J. Configuring a powered knee and ankle prosthesis for transfemoral amputees within five specific ambulation modes. PLoS ONE 2014, 9, e99387. [Google Scholar] [CrossRef]
- Ledoux, E.D.; Goldfarb, M. Control and evaluation of a powered transfemoral prosthesis for stair ascent. IEEE Trans. Neural Syst. Rehabil. Eng. 2017, 25, 917–924. [Google Scholar] [CrossRef]
- Sup, F.; Varol, H.A.; Mitchell, J.; Withrow, T.; Goldfarb, M. Design and control of an active electrical knee and ankle prosthesis. In Proceedings of the 2008 2nd IEEE RAS & EMBS International Conference on Biomedical Robotics and Biomechatronics, Scottsdale, AZ, USA, 19–22 October 2008; pp. 523–528. [Google Scholar]
- Bai, O.; Rathi, V.; Lin, P.; Huang, D.; Battapady, H.; Fei, D.Y.; Schneider, L.; Houdayer, E.; Chen, X.; Hallett, M. Prediction of human voluntary movement before it occurs. Clin. Neurophysiol. 2011, 122, 364–372. [Google Scholar] [CrossRef] [PubMed] [Green Version]
- Young, A.; Kuiken, T.; Hargrove, L. Analysis of using EMG and mechanical sensors to enhance intent recognition in powered lower limb prostheses. J. Neural Eng. 2014, 11, 056021. [Google Scholar] [CrossRef] [PubMed]
- Spanias, J.A.; Perreault, E.J.; Hargrove, L.J. Detection of and compensation for EMG disturbances for powered lower limb prosthesis control. IEEE Trans. Neural Syst. Rehabil. Eng. 2015, 24, 226–234. [Google Scholar] [CrossRef] [PubMed]
- Huang, H.; Kuiken, T.A.; Lipschutz, R.D. A Strategy for Identifying Locomotion Modes Using Surface Electromyography. IEEE. Trans. Biomed. Eng. 2009, 56, 65–73. [Google Scholar] [CrossRef] [PubMed] [Green Version]
- King, R.C.; Villeneuve, E.; White, R.J.; Sherratt, R.S.; Holderbaum, W.; Harwin, W.S. Application of data fusion techniques and technologies for wearable health monitoring. Med. Eng. Phys. 2017, 42, 1–12. [Google Scholar] [CrossRef]
- Kyeong, S.; Shin, W.; Kim, J. Predicting Walking Intentions using sEMG and Mechanical sensors for various environment. In Proceedings of the 2018 40th Annual International Conference of the IEEE Engineering in Medicine and Biology Society (EMBC), Honolulu, HI, USA, 18–21 July 2018; Volume 2018, pp. 4414–4417. [Google Scholar]
- Joshi, D.; Hahn, M.E. Terrain and direction classification of locomotion transitions using neuromuscular and mechanical input. Ann. Biomed. Eng. 2016, 44, 1275–1284. [Google Scholar] [CrossRef] [PubMed]
- Ai, Q.; Zhang, Y.; Qi, W.; Liu, Q.; Chen, K. Research on lower limb motion recognition based on fusion of sEMG and accelerometer signals. Symmetry 2017, 9, 147. [Google Scholar] [CrossRef]
- Wang, W.; Chen, B.; Xia, P.; Hu, J.; Peng, Y. Sensor Fusion for Myoelectric Control Based on Deep Learning with Recurrent Convolutional Neural Networks. Artif. Organs. 2018, 42 9, E272–E282. [Google Scholar] [CrossRef]
- Mahoney, J.M.; Rhudy, M.B. Methodology and validation for identifying gait type using machine learning on IMU data. J. Med. Eng. Technol. 2019, 43, 25–32. [Google Scholar] [CrossRef]
- Huang, H.; Zhang, F.; Hargrove, L.J.; Dou, Z.; Rogers, D.R.; Englehart, K.B. Continuous Locomotion-Mode Identification for Prosthetic Legs Based on Neuromuscular–Mechanical Fusion. IEEE Trans. Biomed. Eng. 2011, 58, 2867–2875. [Google Scholar] [CrossRef] [PubMed] [Green Version]
- Liu, Y.X.; Wang, R.; Gutierrez-Farewik, E.M. A Muscle Synergy-Inspired Method of Detecting Human Movement Intentions Based on Wearable Sensor Fusion. IEEE Trans. Neural Syst. Rehabil. Eng. 2021, 29, 1089–1098. [Google Scholar] [CrossRef]
- Camargo, J.; Flanagan, W.; Csomay-Shanklin, N.; Kanwar, B.; Young, A. A machine learning strategy for locomotion classification and parameter estimation using fusion of wearable sensors. IEEE Trans. Biomed. Eng. 2021, 68, 1569–1578. [Google Scholar] [CrossRef]
- Liu, M.; Wang, D.; Huang, H. Development of an environment-aware locomotion mode recognition system for powered lower limb prostheses. IEEE Trans. Neural Syst. Rehabil. Eng. 2015, 24, 434–443. [Google Scholar] [CrossRef] [PubMed]
- Sherratt, F.; Plummer, A.; Iravani, P. Understanding LSTM network behaviour of IMU-based locomotion mode recognition for applications in prostheses and wearables. Sensors 2021, 21, 1264. [Google Scholar] [CrossRef] [PubMed]
- Gao, F.; Liu, G.; Liang, F.; Liao, W.H. IMU-Based locomotion mode identification for transtibial prostheses, orthoses, and exoskeletons. IEEE Trans. Neural Syst. Rehabil. Eng. 2020, 28, 1334–1343. [Google Scholar] [CrossRef] [PubMed]
- Vu, H.T.T.; Dong, D.; Cao, H.L.; Verstraten, T.; Lefeber, D.; Vanderborght, B.; Geeroms, J. A Review of Gait Phase Detection Algorithms for Lower Limb Prostheses. Sensors 2020, 20, 3972. [Google Scholar] [CrossRef] [PubMed]
- Maqbool, H.F.; Husman, M.A.B.; Awad, M.I.; Abouhossein, A.; Iqbal, N.; Dehghani-Sanij, A.A. A real-time gait event detection for lower limb prosthesis control and evaluation. IEEE Trans. Neural Syst. Rehabil. Eng. 2016, 25, 1500–1509. [Google Scholar] [CrossRef] [PubMed]
- Rueterbories, J.; Spaich, E.G.; Andersen, O.K. Gait event detection for use in FES rehabilitation by radial and tangential foot accelerations. Med. Eng. Phys. 2014, 36, 502–508. [Google Scholar] [CrossRef]
- Takeda, R.; Tadano, S.; Natorigawa, A.; Todoh, M.; Yoshinari, S. Gait posture estimation using wearable acceleration and gyro sensors. J. Biomech. 2009, 42, 2486–2494. [Google Scholar] [CrossRef] [Green Version]
- Seel, T.; Raisch, J.; Schauer, T. IMU-based joint angle measurement for gait analysis. Sensors 2014, 14, 6891–6909. [Google Scholar] [CrossRef] [Green Version]
- Reenalda, J.; Maartens, E.; Homan, L.; Buurke, J.J. Continuous three dimensional analysis of running mechanics during a marathon by means of inertial magnetic measurement units to objectify changes in running mechanics. J. Biomech. 2016, 49, 3362–3367. [Google Scholar] [CrossRef]
- Attal, F.; Amirat, Y.; Chibani, A.; Mohammed, S. Automatic recognition of gait phases using a multiple-regression hidden Markov model. IEEE/ASME Trans. Mechatronics 2018, 23, 1597–1607. [Google Scholar] [CrossRef]
- Vu, H.T.T.; Gomez, F.; Cherelle, P.; Lefeber, D.; Nowé, A.; Vanderborght, B. ED-FNN: A new deep learning algorithm to detect percentage of the gait cycle for powered prostheses. Sensors 2018, 18, 2389. [Google Scholar] [CrossRef] [Green Version]
- Ledoux, E.D. Inertial sensing for gait event detection and transfemoral prosthesis control strategy. IEEE Trans. Biomed. Eng. 2018, 65, 2704–2712. [Google Scholar] [CrossRef] [PubMed]
- Su, B.; Smith, C.; Gutierrez Farewik, E. Gait phase recognition using deep convolutional neural network with inertial measurement units. Biosensors 2020, 10, 109. [Google Scholar] [CrossRef]
- Hermens, H.J.; Freriks, B.; Merletti, R.; Stegeman, D.; Blok, J.; Rau, G.; Disselhorst-Klug, C.; Hägg, G. European recommendations for surface electromyography. Roessingh Res. Develop. 1999, 8, 13–54. [Google Scholar]
- Buchanan, T.S.; Lloyd, D.G.; Manal, K.; Besier, T.F. Neuromusculoskeletal modeling: Estimation of muscle forces and joint moments and movements from measurements of neural command. J. Appl. Biomech. 2004, 20, 367–395. [Google Scholar] [CrossRef] [PubMed] [Green Version]
- Wakeling, J.M.; Rozitis, A.I. Spectral properties of myoelectric signals from different motor units in the leg extensor muscles. J. Exp. Biol. 2004, 207, 2519–2528. [Google Scholar] [CrossRef] [PubMed] [Green Version]
- Taborri, J.; Palermo, E.; Rossi, S.; Cappa, P. Gait partitioning methods: A systematic review. Sensors 2016, 16, 66. [Google Scholar] [CrossRef] [PubMed] [Green Version]
- Young, A.J.; Simon, A.M.; Hargrove, L.J. A training method for locomotion mode prediction using powered lower limb prostheses. IEEE Trans. Neural Syst. Rehabil. Eng. 2013, 22, 671–677. [Google Scholar] [CrossRef]
- Bohannon, R.W.; Andrews, A.W. Normal walking speed: A descriptive meta-analysis. Physiotherapy 2011, 97, 182–189. [Google Scholar] [CrossRef] [PubMed]
- Murray, M.P.; Drought, A.B.; Kory, R.C. Walking patterns of normal men. J. Bone Jt. Surg. 1964, 46, 335–360. [Google Scholar] [CrossRef]
- Afzal, T.; Iqbal, K.; White, G.; Wright, A.B. A method for locomotion mode identification using muscle synergies. IEEE Trans. Neural Syst. Rehabil. Eng. 2016, 25, 608–617. [Google Scholar] [CrossRef] [PubMed]


| Gait Event | Mean | Std | Min | 25% | 50% | 75% | Max |
|---|---|---|---|---|---|---|---|
| FC (ms) | 2.5 | 24.2 | −40.0 | −10.0 | 0.0 | 2.5 | 100.0 |
| TO (ms) | −5.3 | 19.1 | −70.0 | −10.0 | 0.0 | 0.0 | 30.0 |
Publisher’s Note: MDPI stays neutral with regard to jurisdictional claims in published maps and institutional affiliations. |
© 2021 by the authors. Licensee MDPI, Basel, Switzerland. This article is an open access article distributed under the terms and conditions of the Creative Commons Attribution (CC BY) license (https://creativecommons.org/licenses/by/4.0/).
Share and Cite
Su, B.; Liu, Y.-X.; Gutierrez-Farewik, E.M. Locomotion Mode Transition Prediction Based on Gait-Event Identification Using Wearable Sensors and Multilayer Perceptrons. Sensors 2021, 21, 7473. https://doi.org/10.3390/s21227473
Su B, Liu Y-X, Gutierrez-Farewik EM. Locomotion Mode Transition Prediction Based on Gait-Event Identification Using Wearable Sensors and Multilayer Perceptrons. Sensors. 2021; 21(22):7473. https://doi.org/10.3390/s21227473
Chicago/Turabian StyleSu, Binbin, Yi-Xing Liu, and Elena M. Gutierrez-Farewik. 2021. "Locomotion Mode Transition Prediction Based on Gait-Event Identification Using Wearable Sensors and Multilayer Perceptrons" Sensors 21, no. 22: 7473. https://doi.org/10.3390/s21227473
APA StyleSu, B., Liu, Y.-X., & Gutierrez-Farewik, E. M. (2021). Locomotion Mode Transition Prediction Based on Gait-Event Identification Using Wearable Sensors and Multilayer Perceptrons. Sensors, 21(22), 7473. https://doi.org/10.3390/s21227473