
Performance of Mobile LiDAR in Real Road Driving Conditions


Abstract
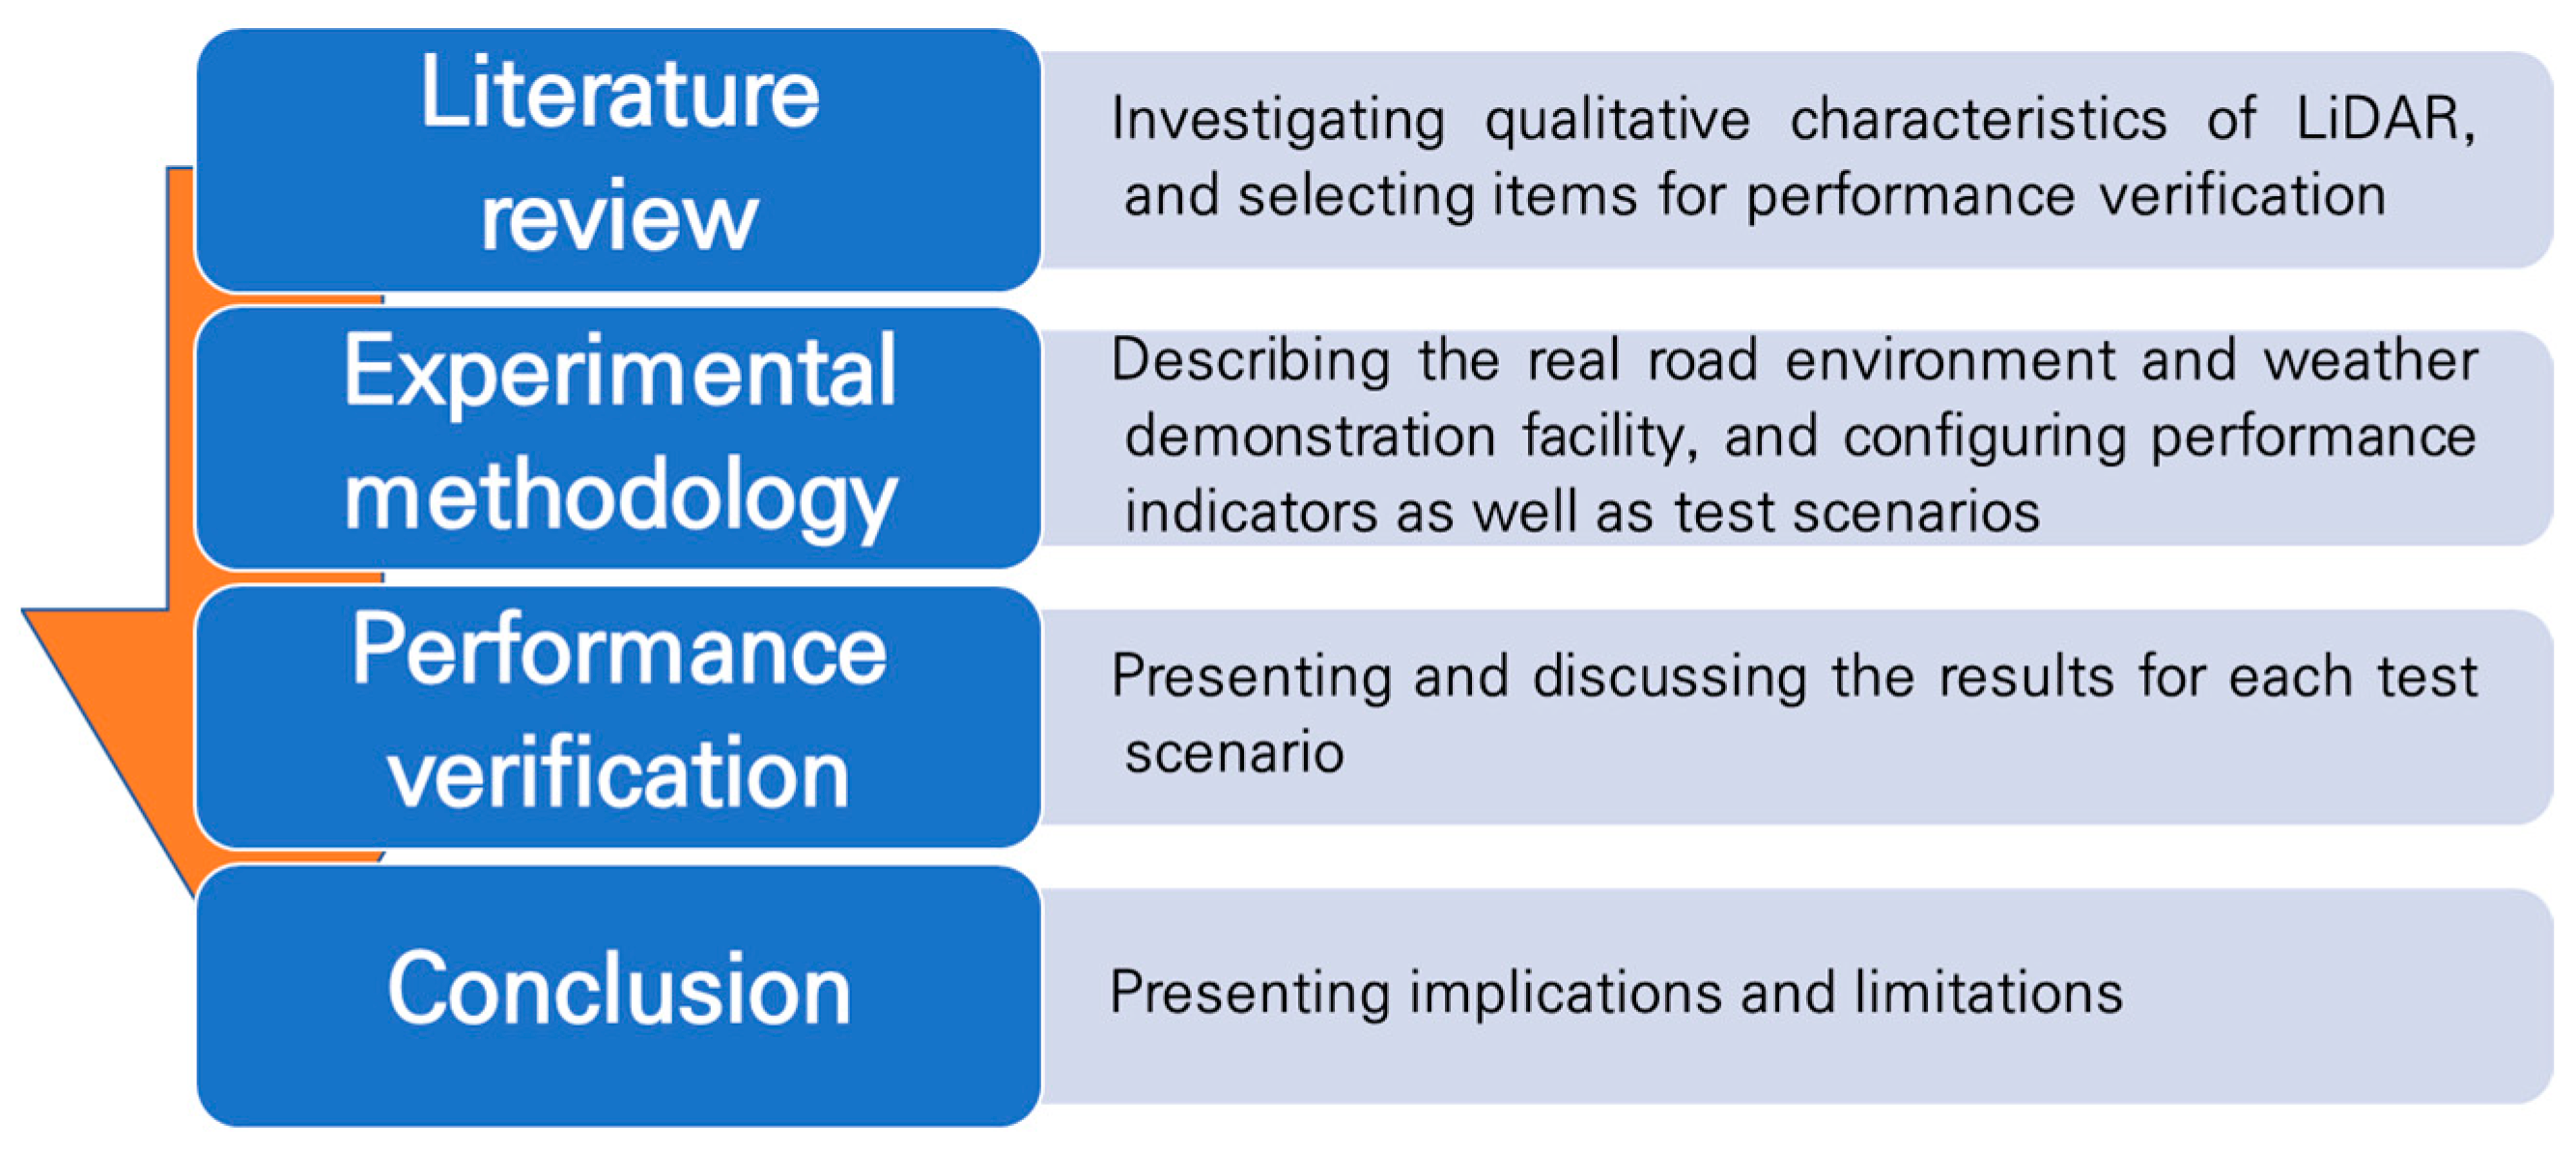
:1. Introduction
2. Literature Review
3. Methodology of Testing
3.1. Purpose of the Test, Items for Performance Verification, and Performance Indicators
3.1.1. Purpose of the Test and Items for Performance Verification
3.1.2. Performance Indicators for LiDAR
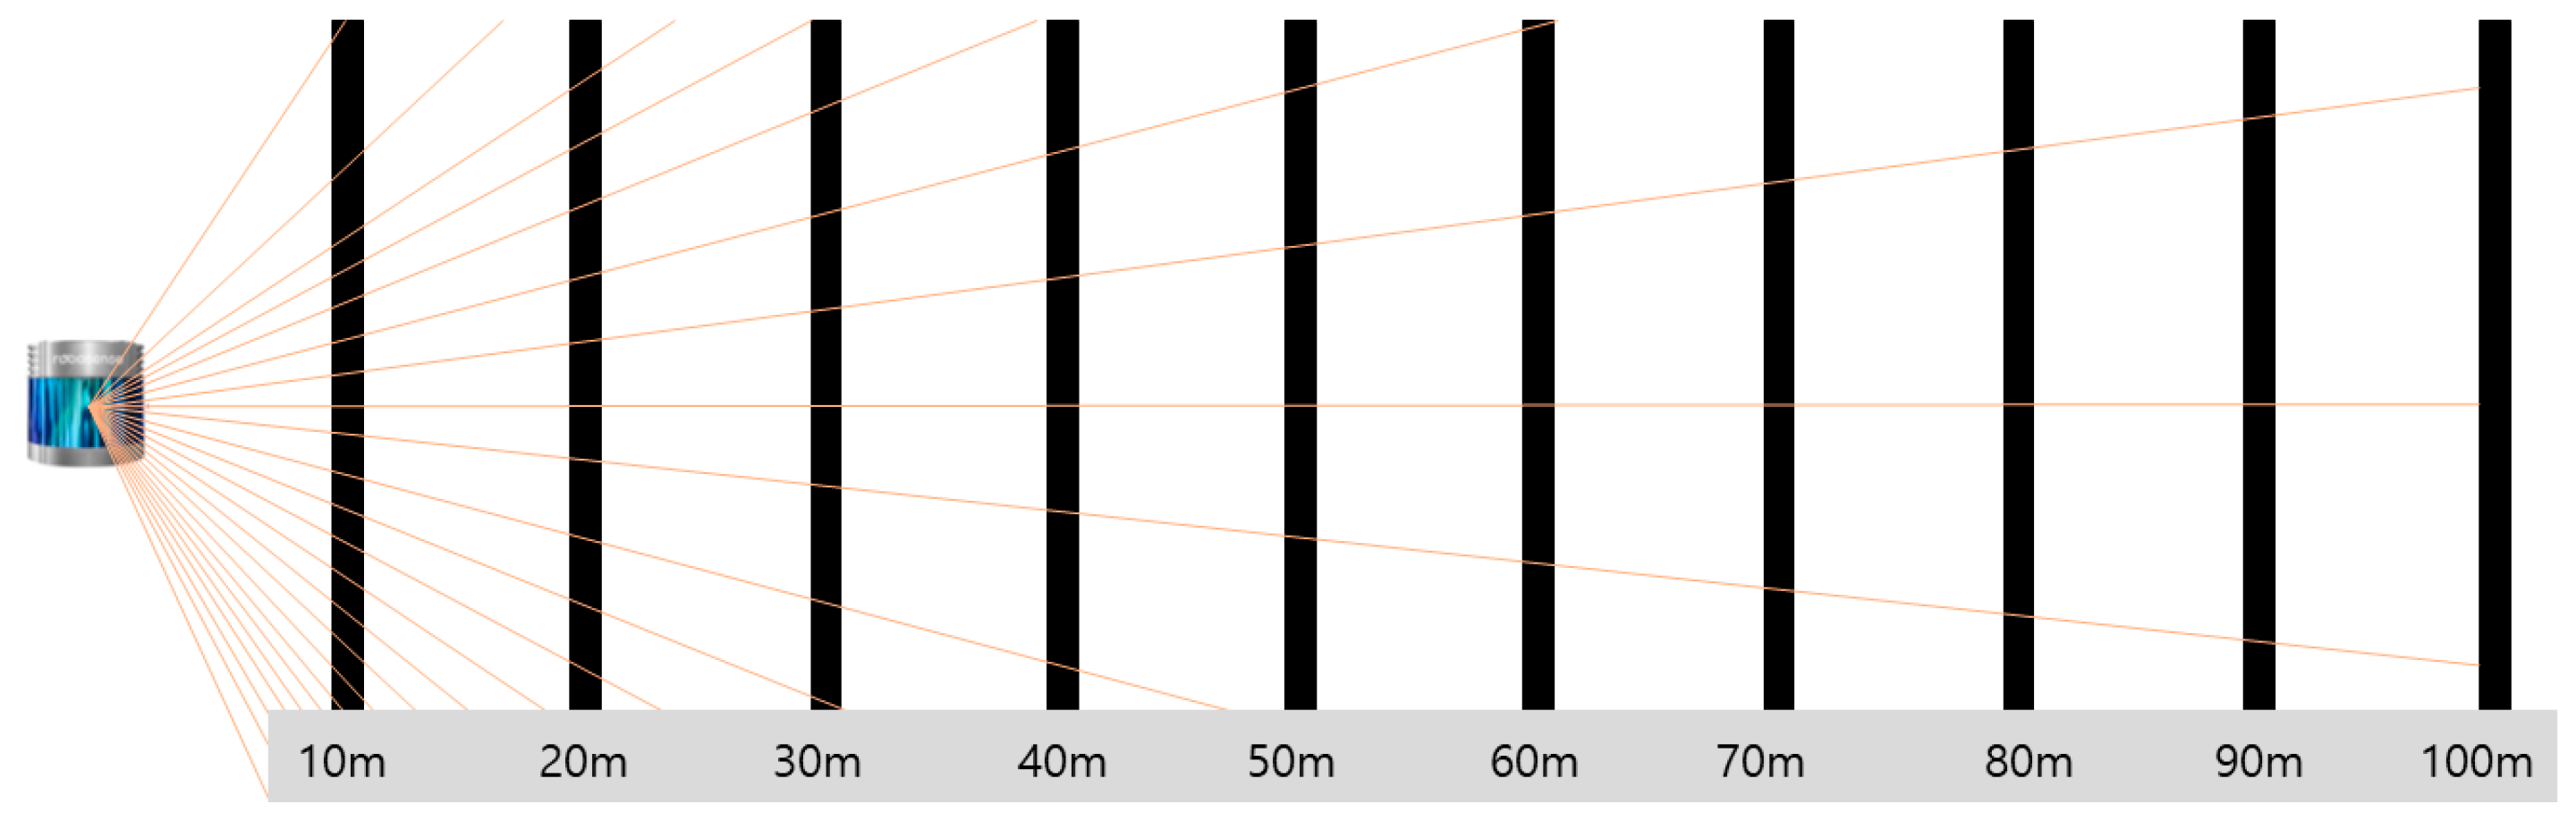
3.1.3. Performance Indicator Verification Method
3.2. Configuration of the Test Environment and Test Scenarios
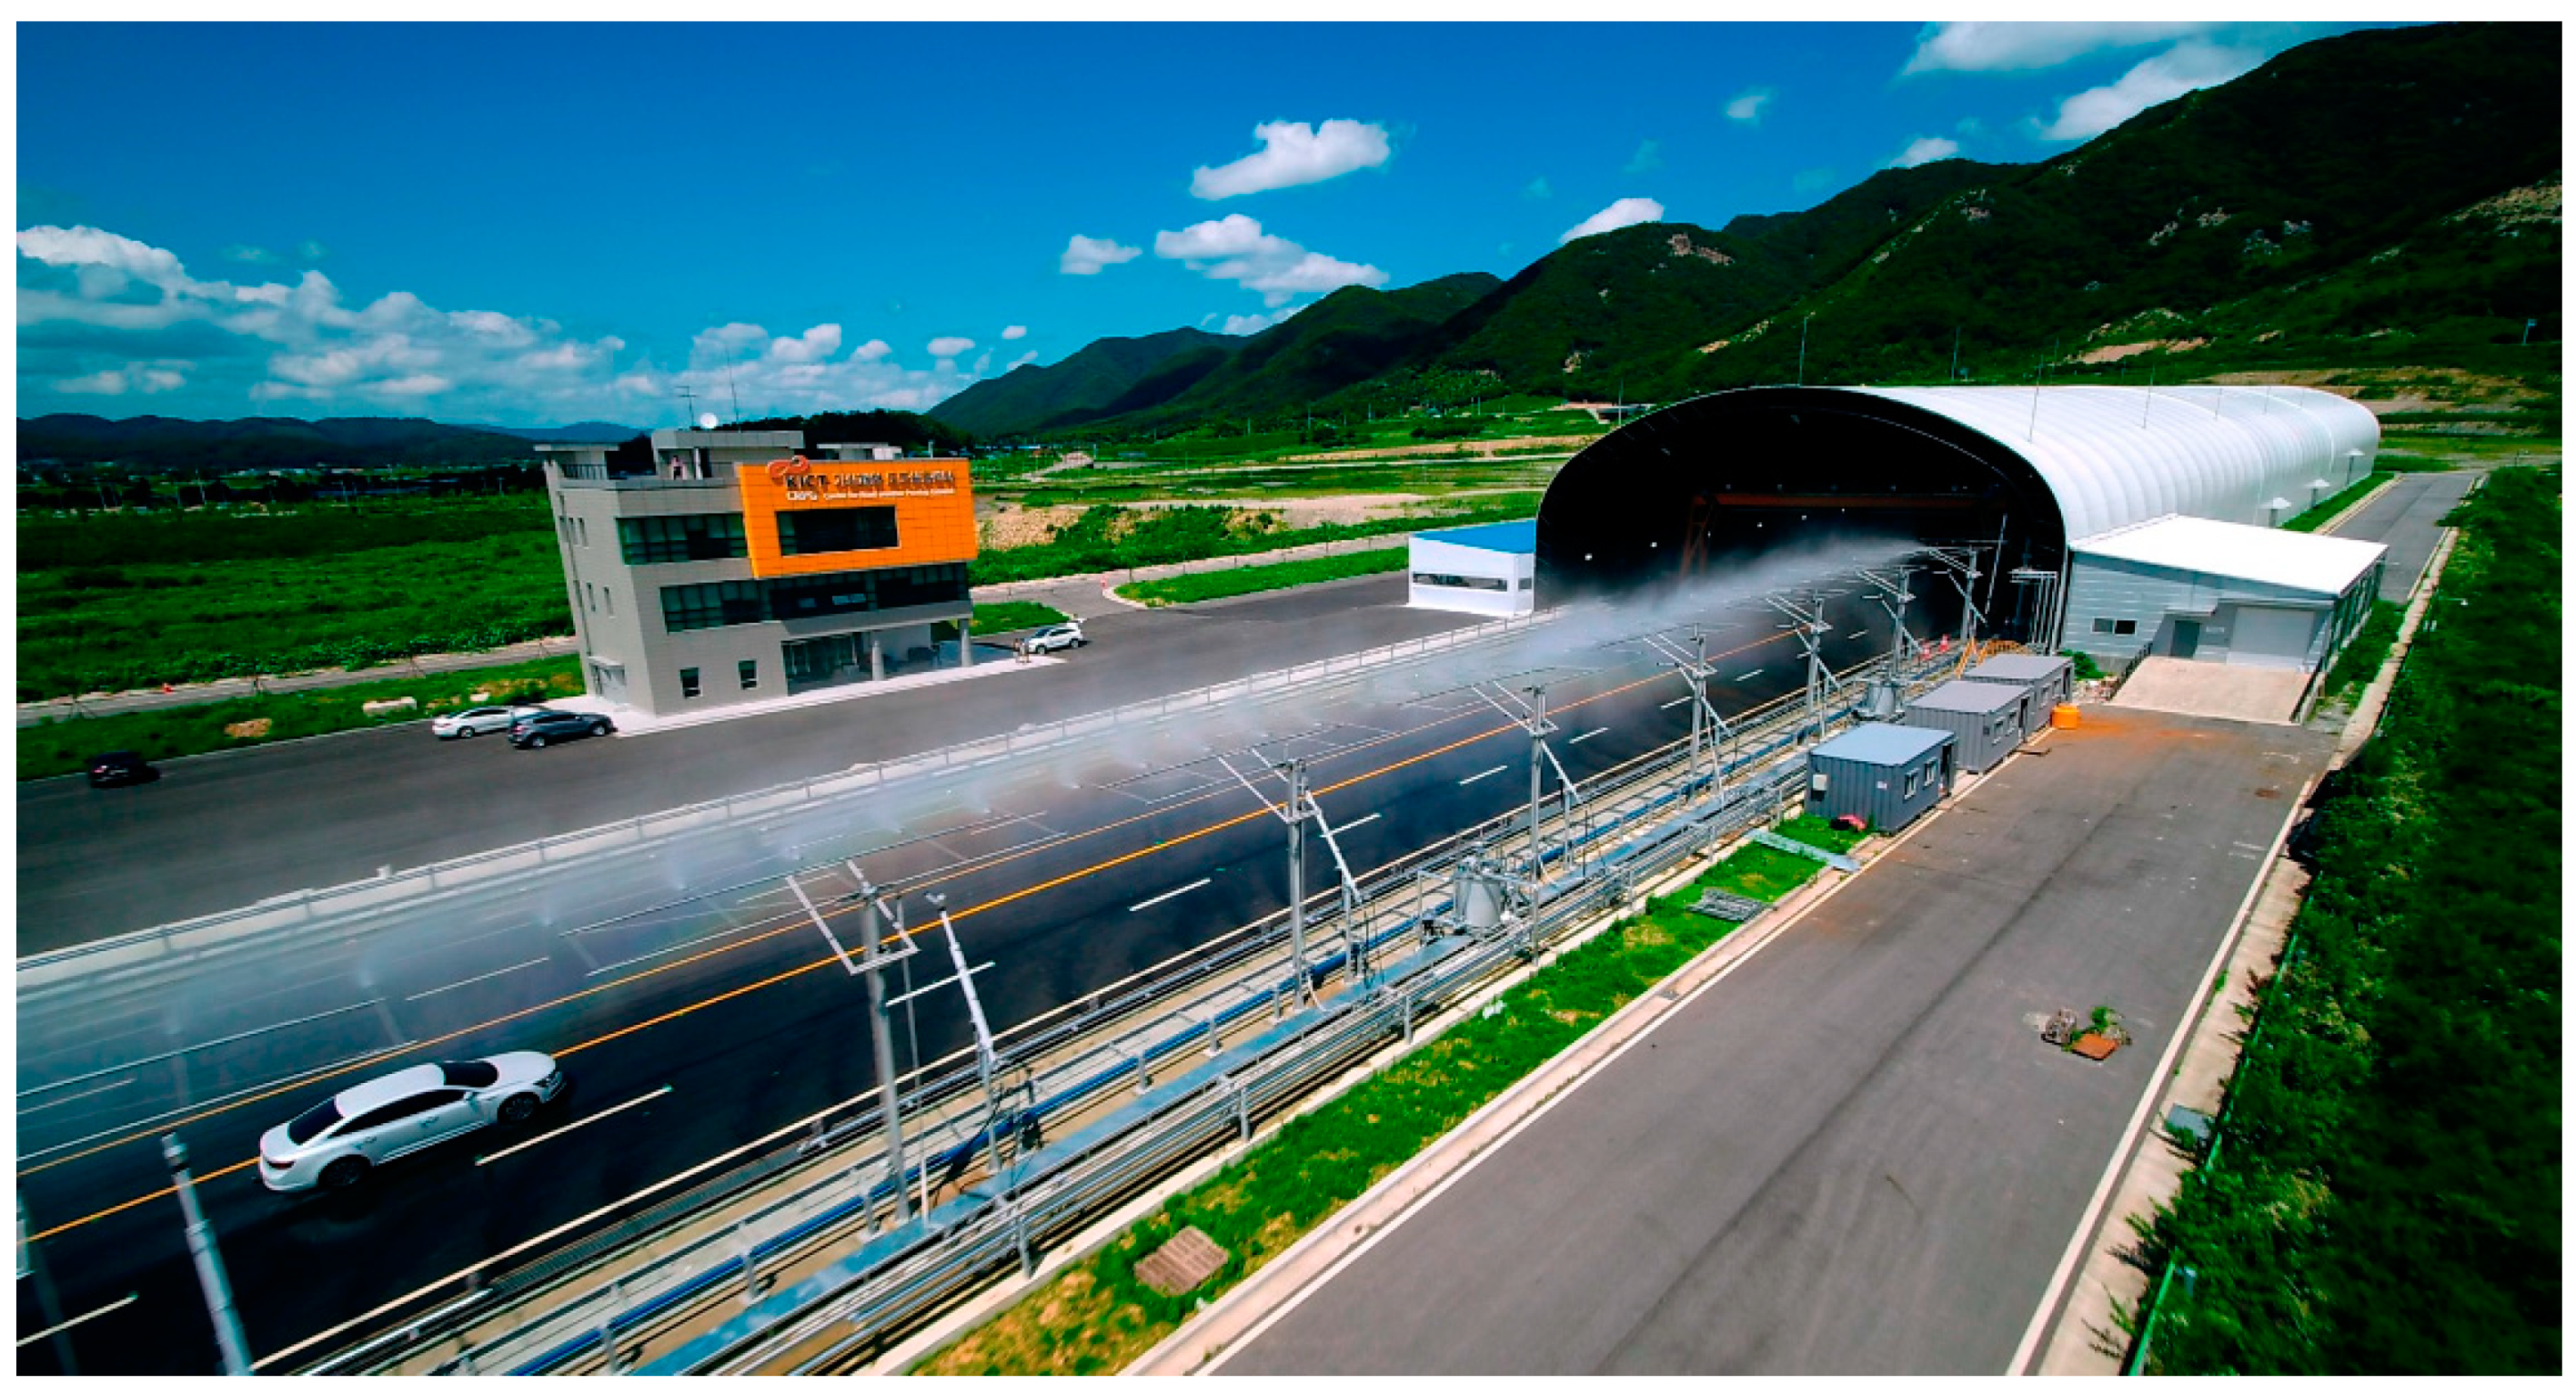
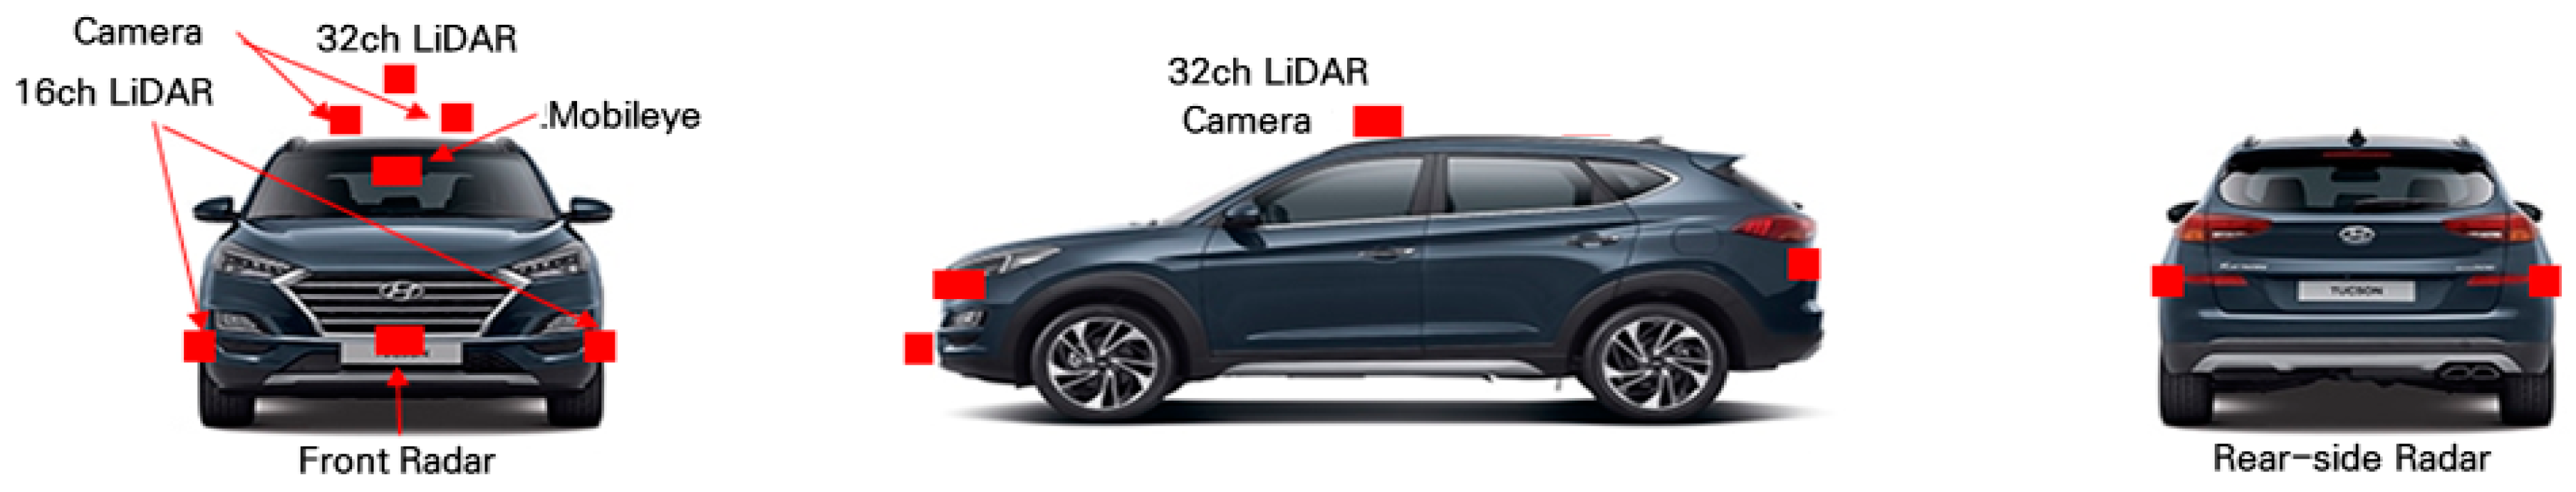
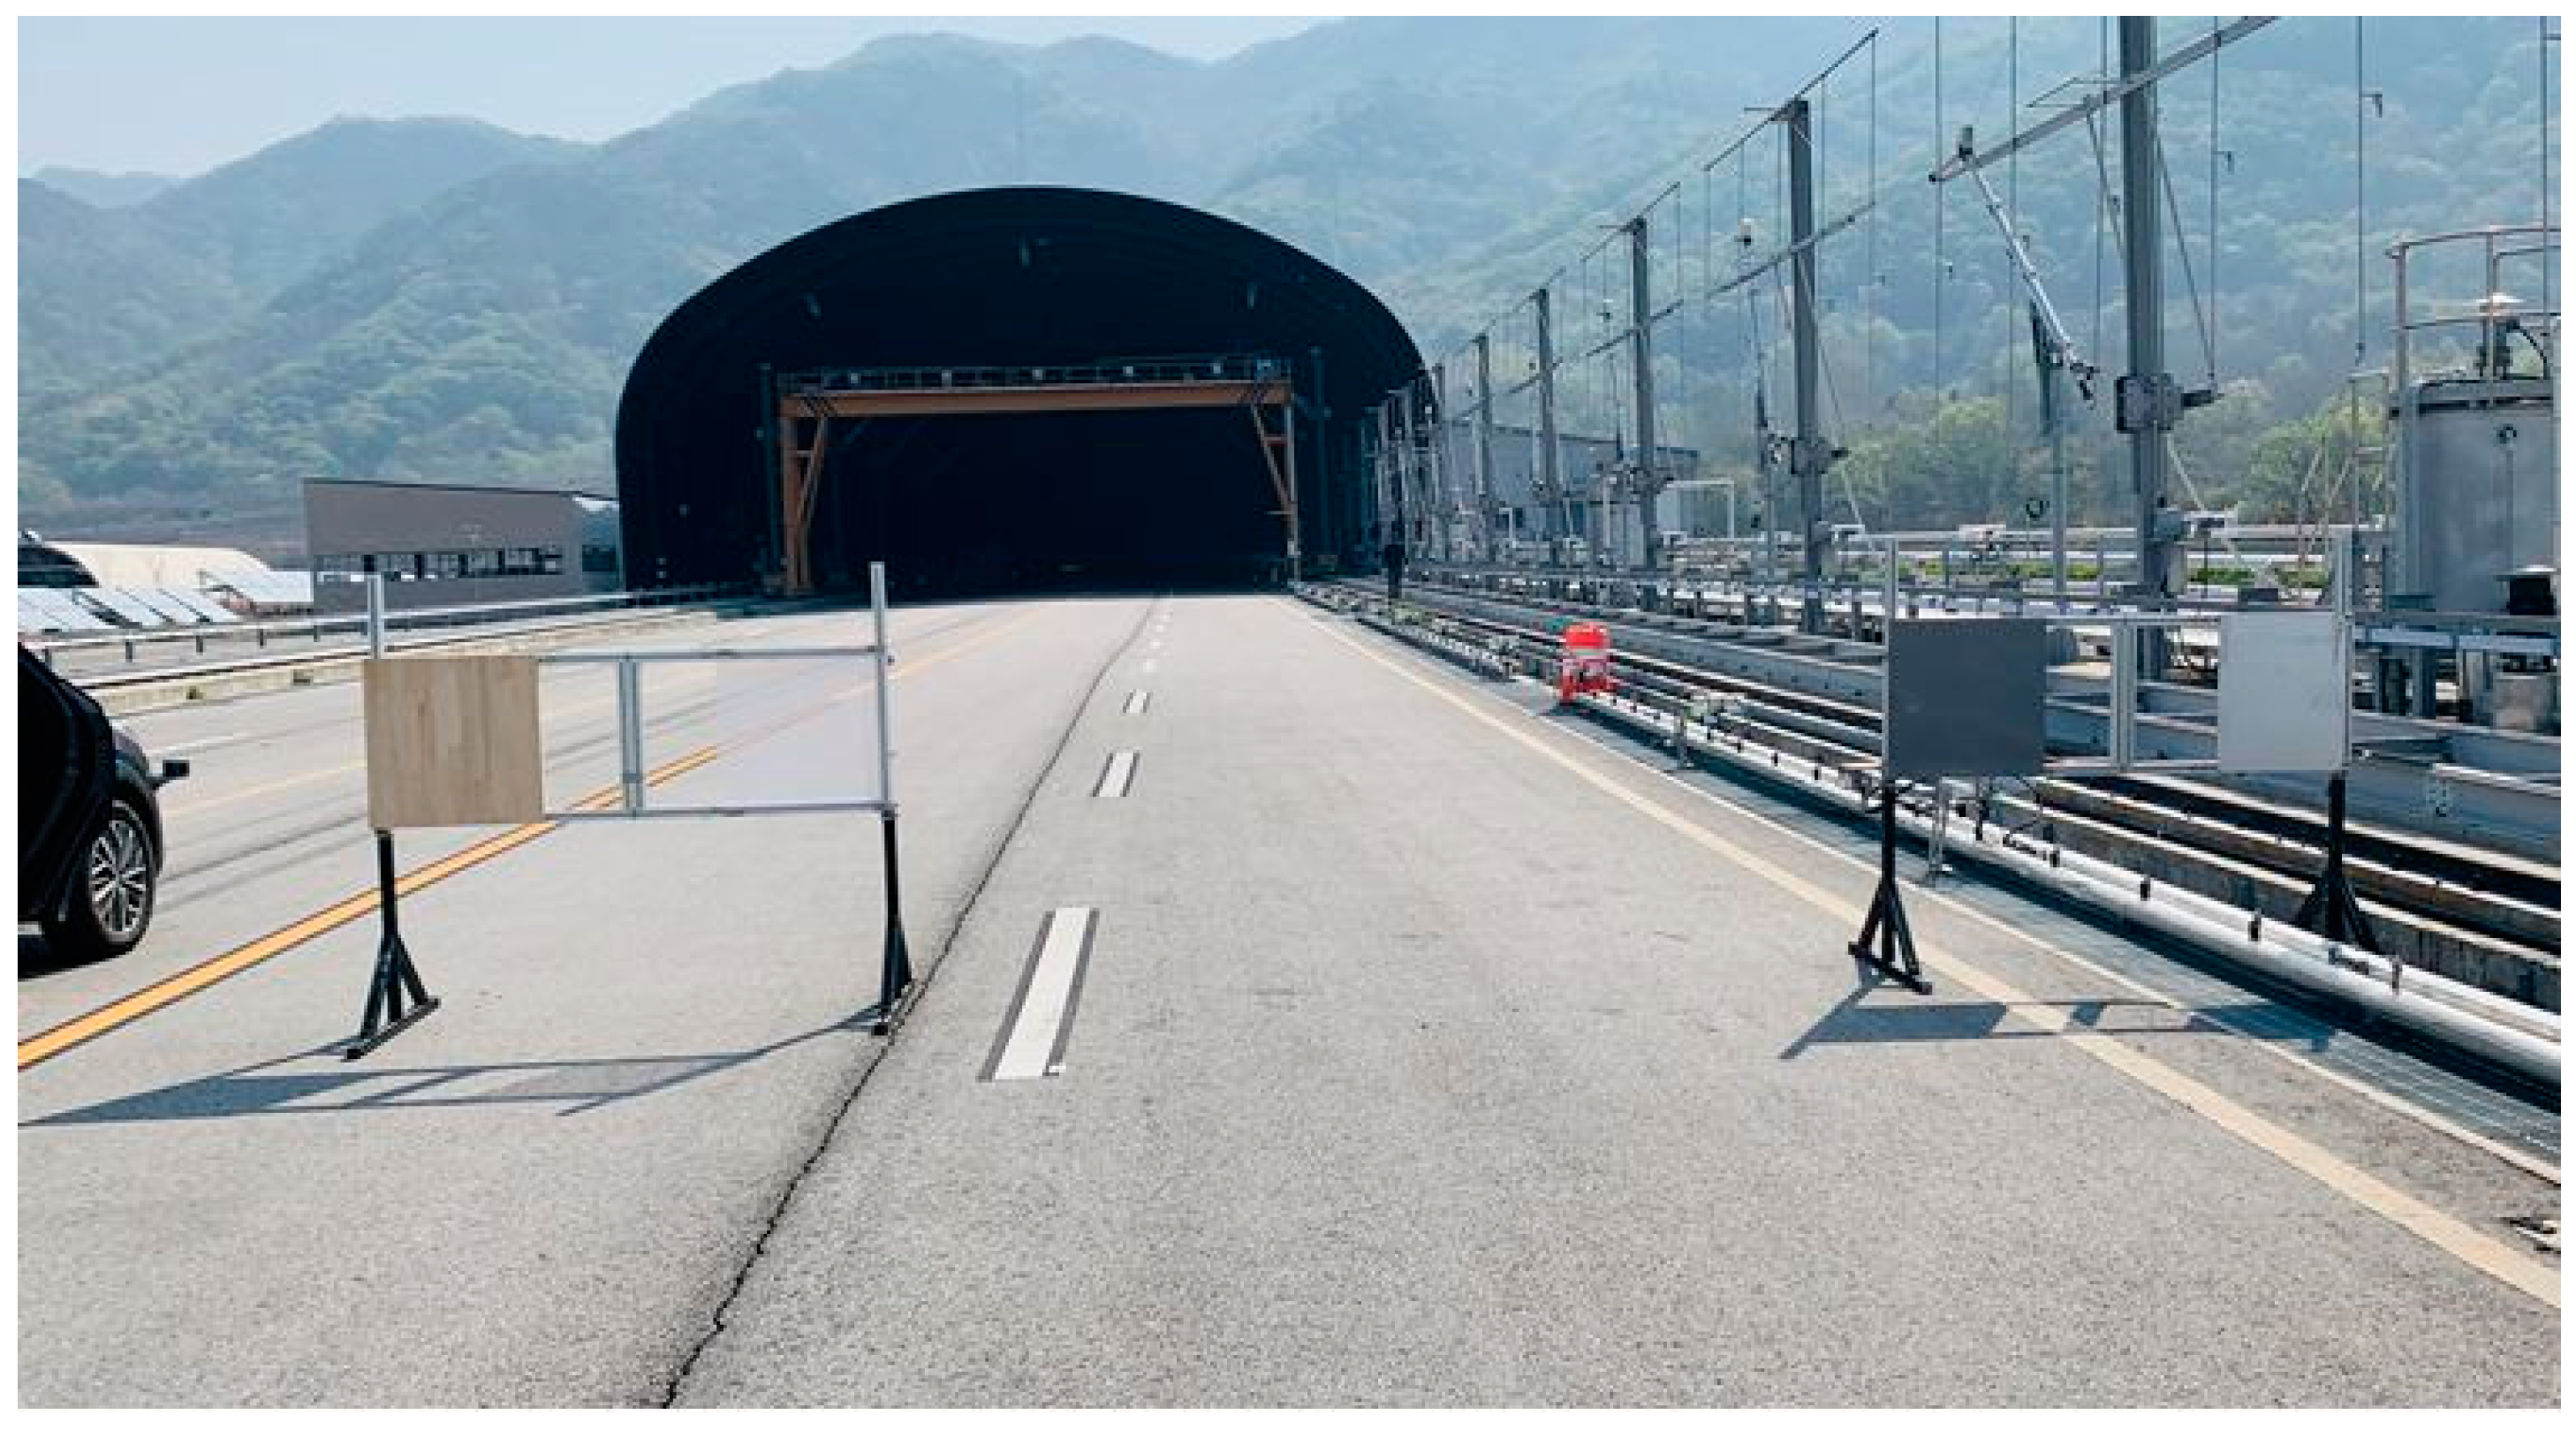
3.2.1. Configuration of Test Environment
3.2.2. Test Scenarios
4. Results and Discussion
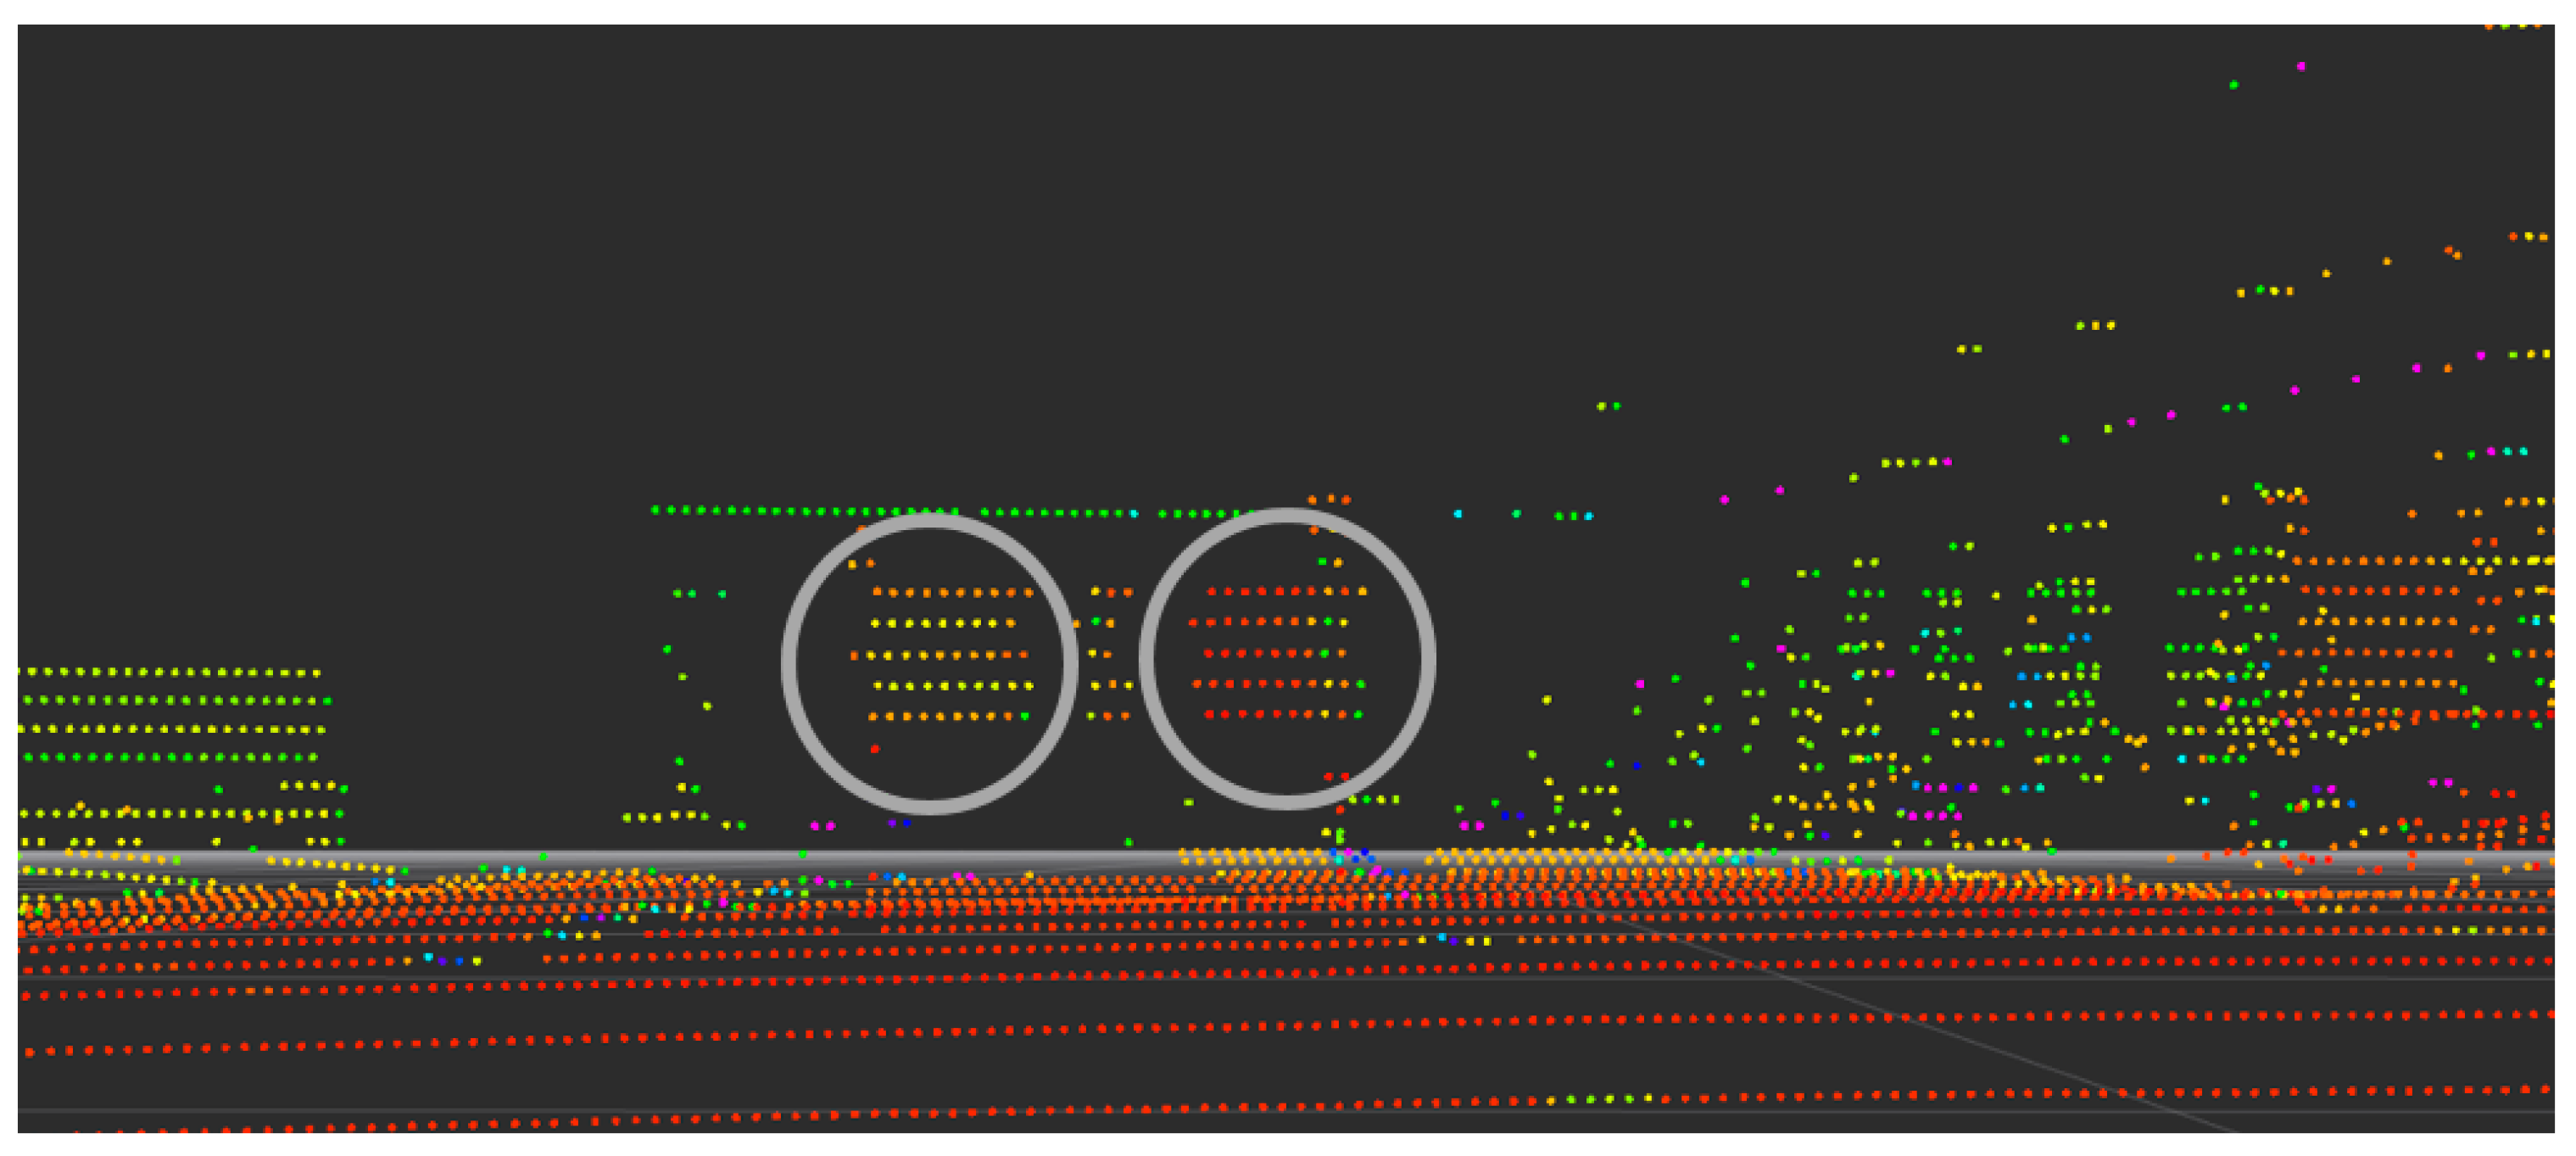
4.1. Performance Index and NPCs
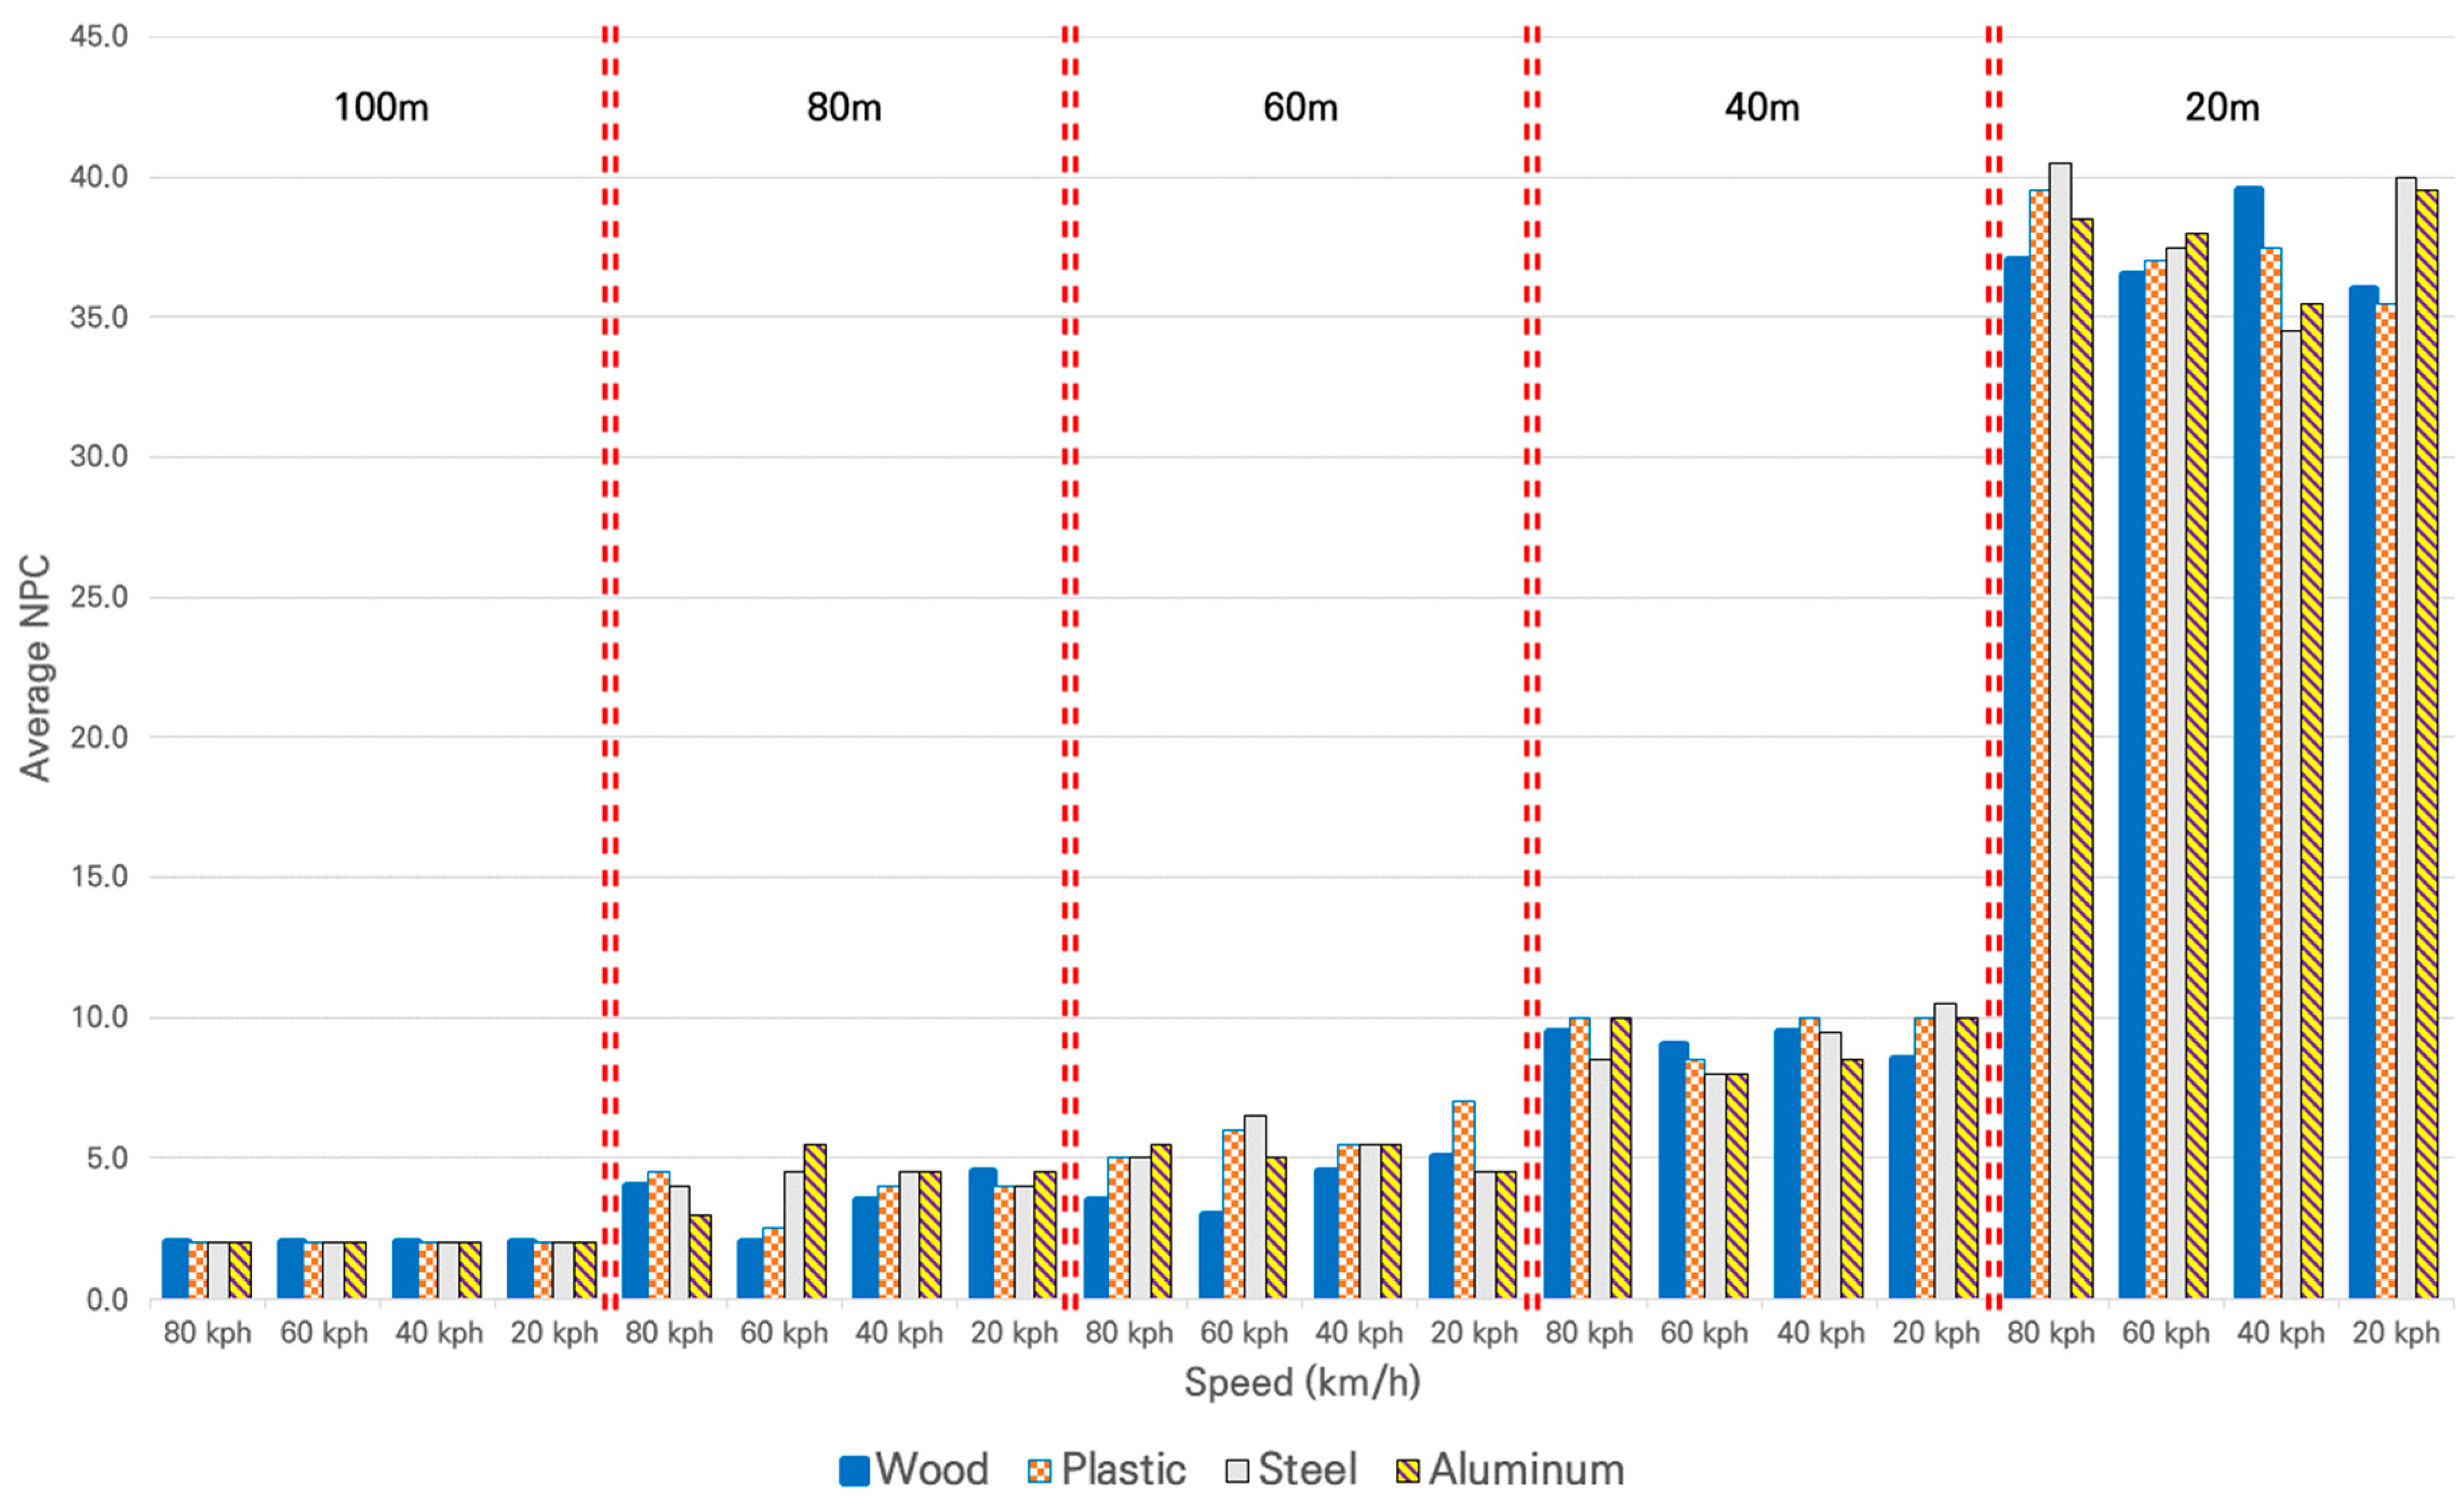
4.1.1. Sunny Day
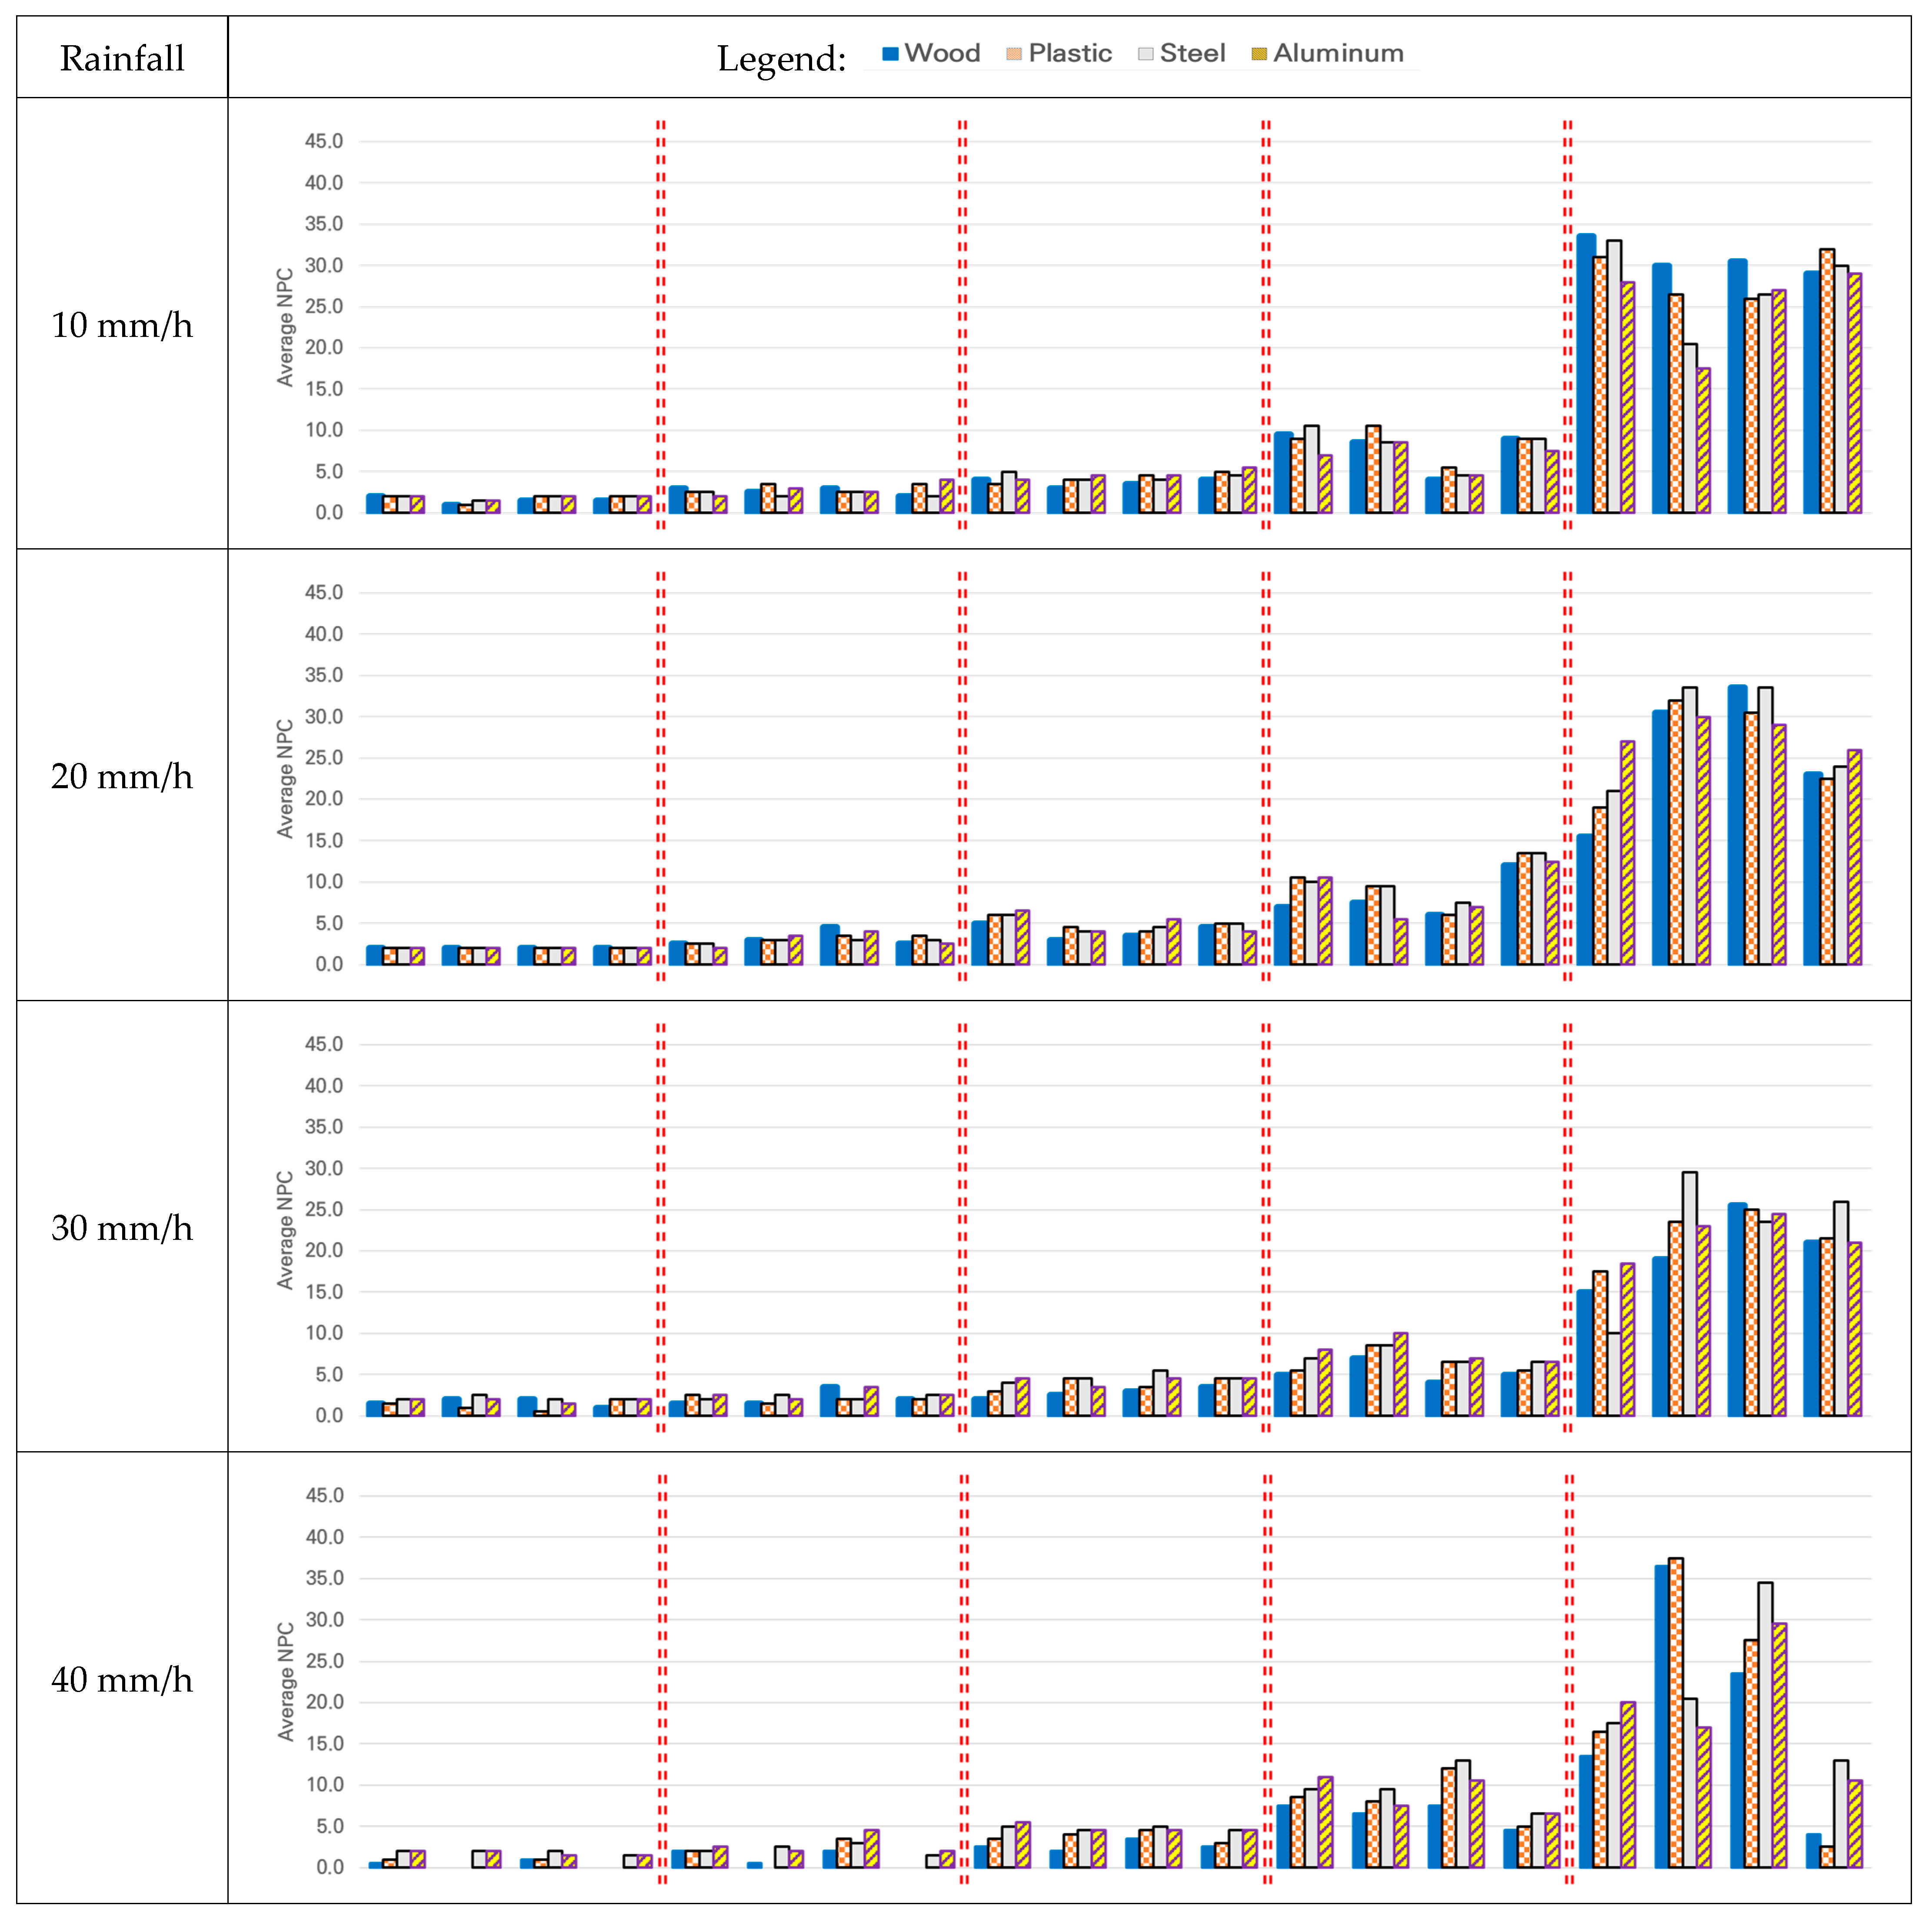
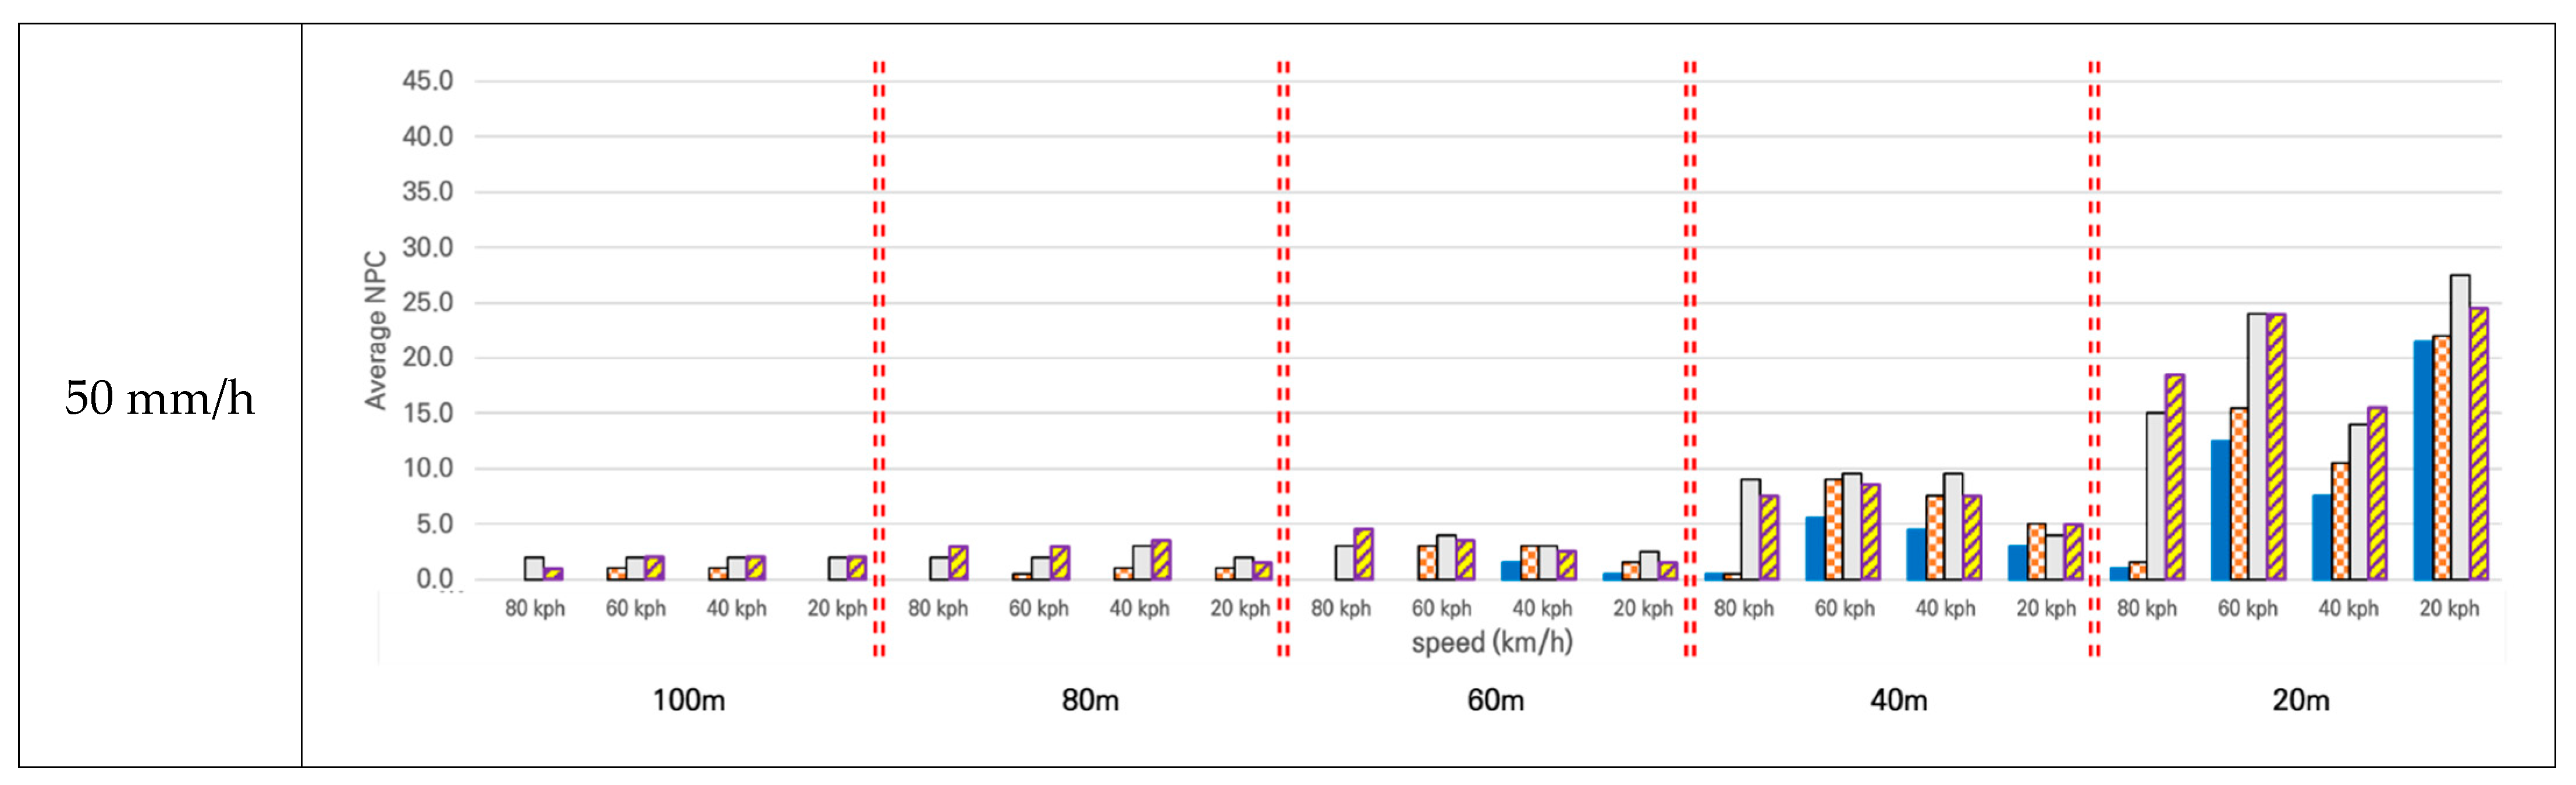
4.1.2. Rainy Day
4.2. Performance Indicator: Intensity
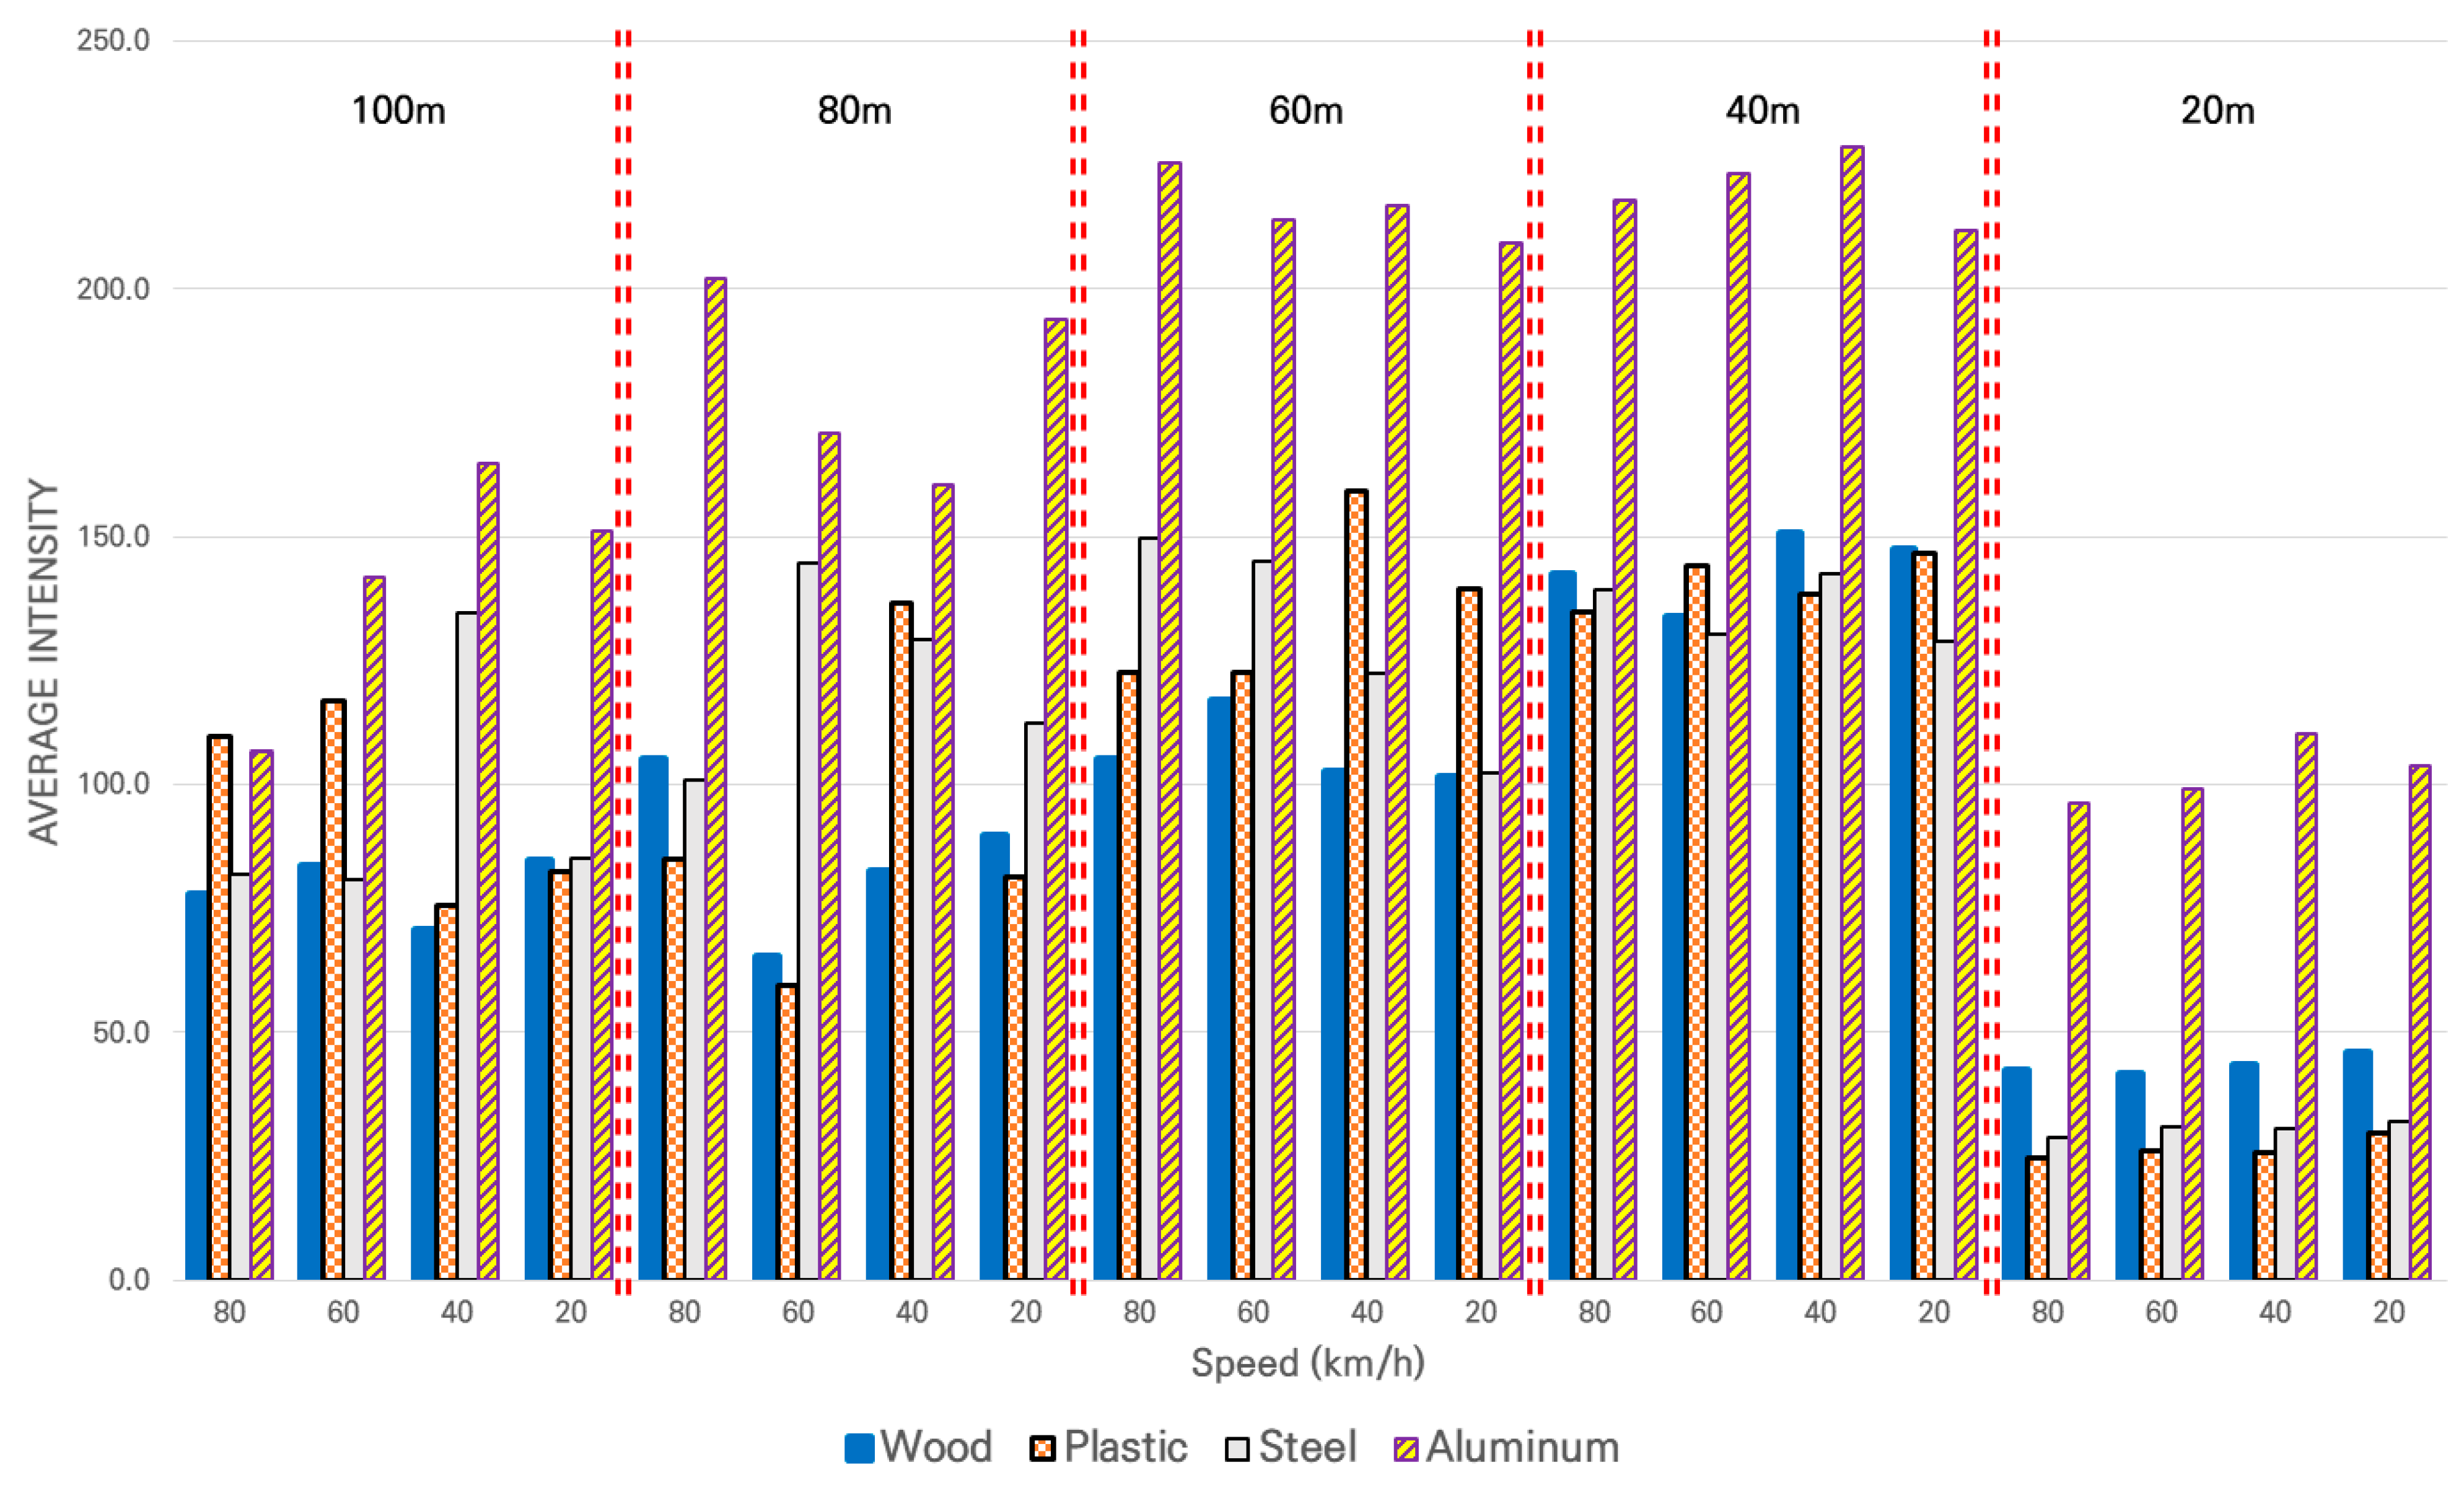
4.2.1. Sunny Day
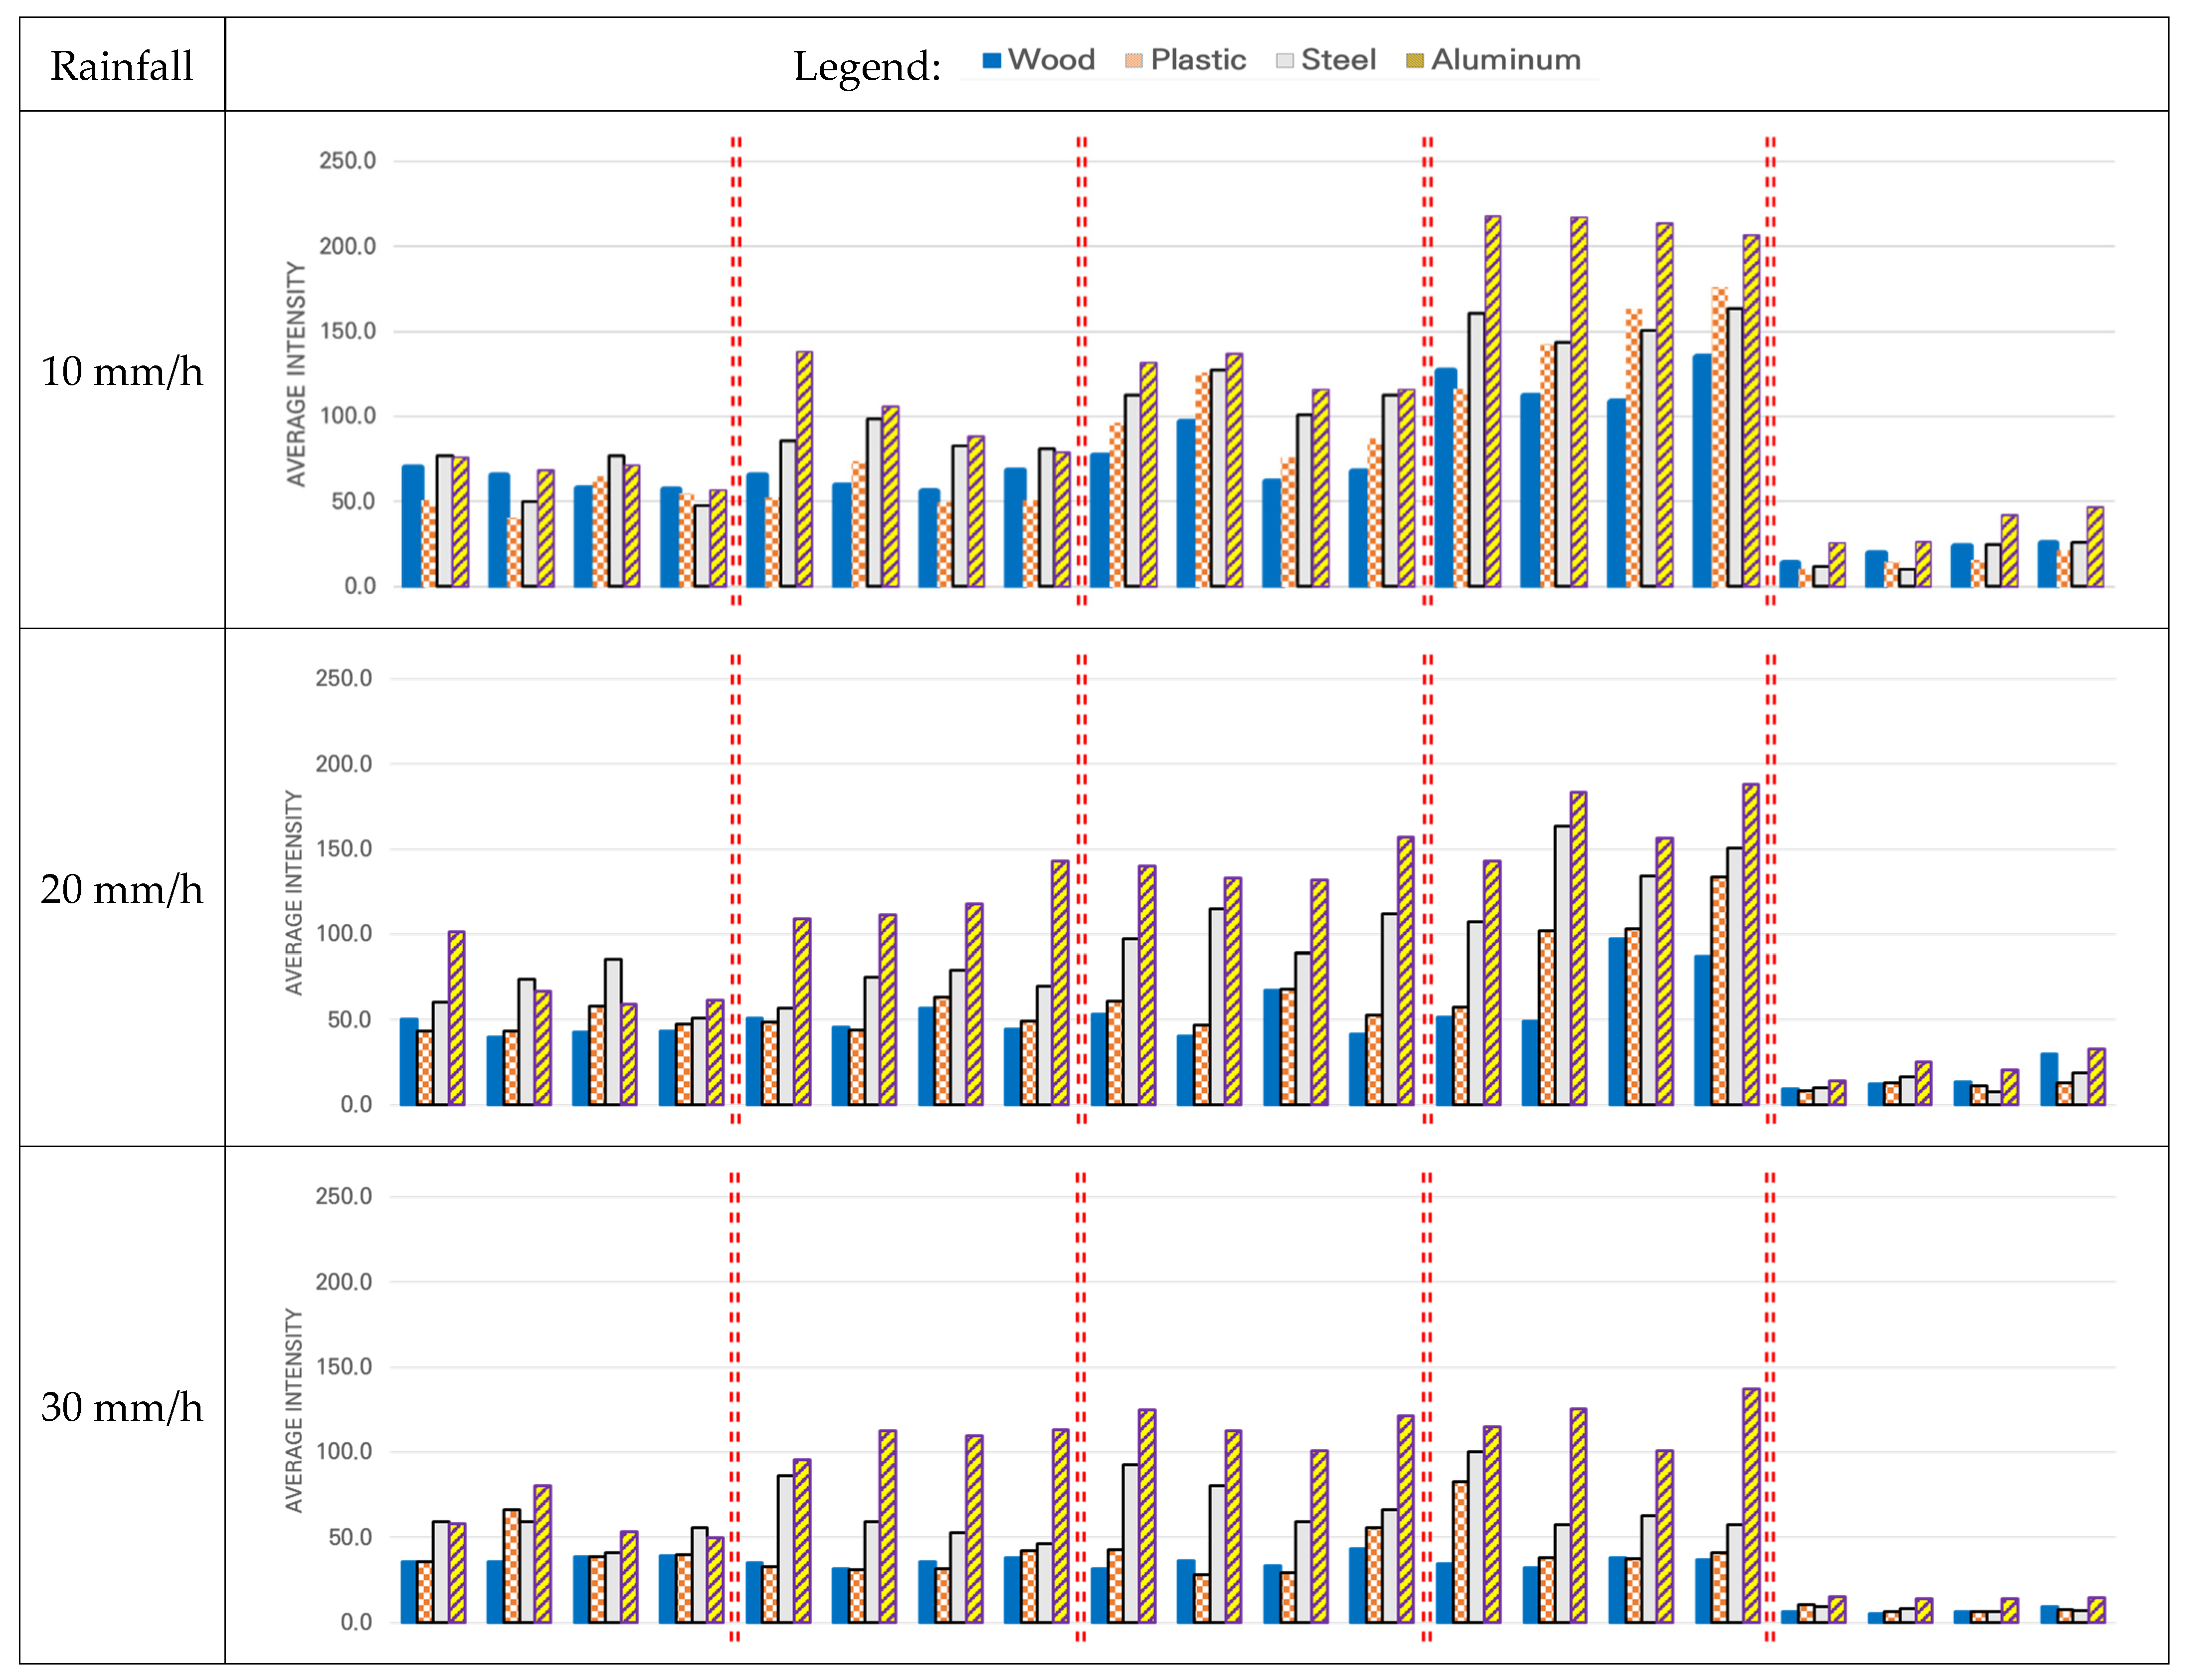
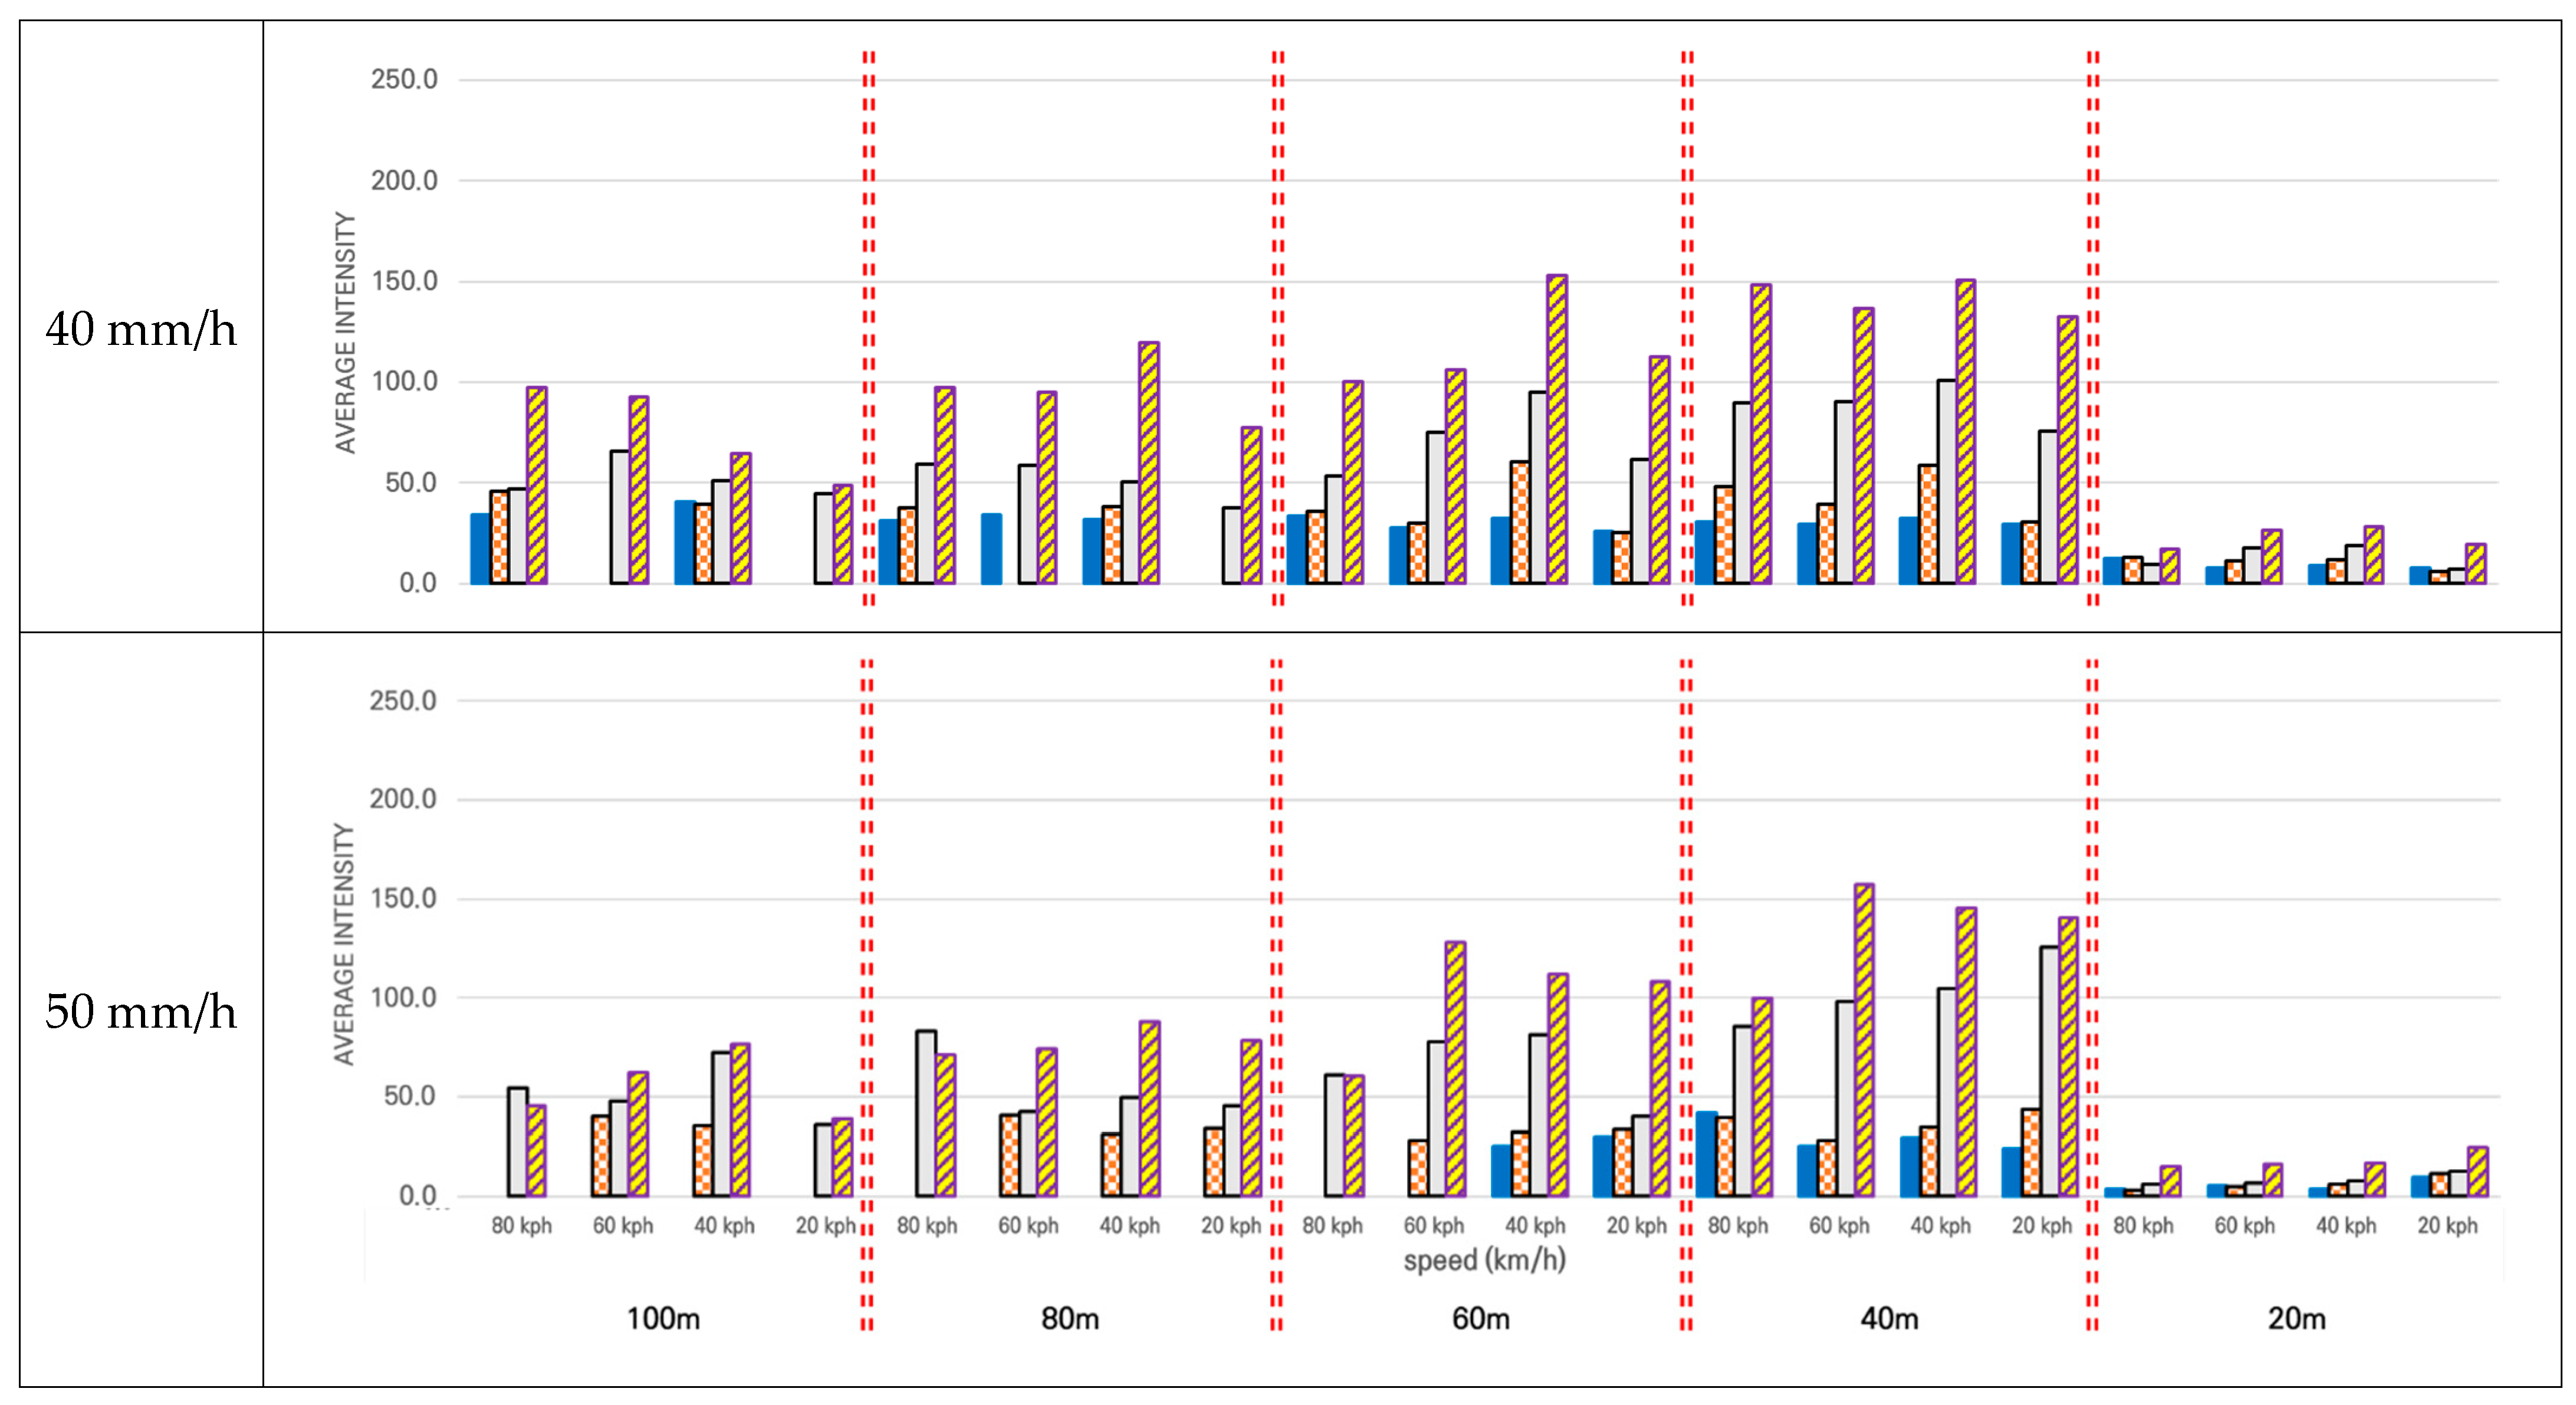
4.2.2. Rainy Day
4.3. Overall Conclusions
5. Conclusions
Author Contributions
Funding
Institutional Review Board Statement
Informed Consent Statement
Data Availability Statement
Conflicts of Interest
References
- IRS Global. Future Mobility (Flying Car and Autonomous Vehicle); Information Research Service Global: Incheon, Korea, 2020. [Google Scholar]
- Korea Institute Construction and Technology. Improved Road Infrastructures to Strengthen Driving Safety of Automated Driving Car 2nd Report; KICT: Goyang, Korea, 2021. [Google Scholar]
- Mirae Asset Global Investments, LiDAR vs. Camera Only–What Is the Best Sensor Suite Combination for Full Autonomous Driving? Available online: https://www.am.miraeasset.com.hk/insight/lidar-vs-camera-only-what-is-the-best-sensor-suite-combination-for-full-autonomous-driving/ (accessed on 6 June 2021).
- Tang, L.; Shi, Y.; He, Q.; Sadek, A.W.; Qiao, C. Performance Test of Autonomous Vehicle Lidar Sensors Under Different Weather Conditions. Transp. Res. Rec. 2020, 2674, 319–329. [Google Scholar] [CrossRef]
- Li, Y.; Ibanez-Guzman, J. LiDAR for Autonomous Driving: The principles, challenges, and trends for automotive lidar and perception systems. IEEE Signal. Process. Mag. 2020, 37, 50–61. [Google Scholar] [CrossRef]
- Lee, I.S.; Lee, J.O. Performance evaluation of Terrestrial Laser Scanner over Calibration Baseline. J. Kor. Soc. Survey. Geodesy. Photogramm. Cartograph. 2010, 28, 329–336. [Google Scholar]
- Goodin, C.; Carruth, D.; Doude, M.; Hudson, C. Predicting the Influence of Rain on LiDAR in ADAS. Electronics 2019, 8, 89. [Google Scholar] [CrossRef] [Green Version]
- Beraldin, J.; Blais, F. Laser Scanning technology. In Airborn and Terrestrial Laser Scanning; Vosselman, G., Mass, H., Eds.; Whittles Publishing: Caithness, Scotland, 2010; pp. 1–42. [Google Scholar]
- Jeon, H.; Kim, J. Analysis on Handicaps of Automated Vehicle and Their Causes using IPA and FG. J. Kor. Inst. Intell. Transport. Syst. 2021, 20, 34–46. [Google Scholar] [CrossRef]
- Guan, H.; Li, J.; Cao, S.; Yu, Y. Use of mobile LiDAR in Road information inventory: A review. Int. J. Image Data Fusion 2016, 7, 219–242. [Google Scholar] [CrossRef]
- Iavarone, A. Feature: Terrestrial LiDAR goes mobile, Professional Surveyor Magazine; 2007. Available online: https://archives.profsurv.com/magazine/article.aspx?i=1988 (accessed on 4 October 2020).
- Kim, H.; Liu, B.; Myung, H. Road-Feature Extraction using Point Cloud and 3D LiDAR Sensor for Vehicle Localization. In Proceedings of the 14th International Conference on Ubiquitous Robots and Ambient Intelligence (URAI), Maison Glad Jeju, Jeju, Korea, 28 June–1 July 2017. [Google Scholar]
- Li, X.; Yang, B.; Xie, X.; Li, D.; Xu, L. Influence of Waveform Characteristics on LiDAR Ranging Accuracy and Precision. Sensors 2018, 18, 1156. [Google Scholar] [CrossRef] [PubMed] [Green Version]
- McManamon, P.F. Field Guide to Lidar; SPIE Press: Bellingham, WA, USA, 2015. [Google Scholar]
- Chen, C.; Fragonara, L.Z.; Tsourdos, A. RoIFusion: 3D Object Detection from LiDAR and Vision. IEEE Access 2021, 9, 51710–51721. [Google Scholar] [CrossRef]
- Dannheim, C.; Icking, C.; Mäder, M.; Sallis, P. Weather Detection in Vehicles by means of Camera and LiDAR systems. In Proceedings of the Sixth International Conference on Computational Intelligence, Communication Systems and Networks 2014, Tetova, Macedonia, 27–29 May 2014. [Google Scholar] [CrossRef]
- Yeong, D.J.; Velasco-Hernandez, G.; Barry, J.; Walsh, J. Sensor and Sensor Fusion Technology in Autonomous Vehicles: A Review. Sensors 2021, 21, 2140. [Google Scholar] [CrossRef] [PubMed]
- Goberville, N.; El-Yabroudi, M.; Omwanas, M.; Rojas, J.; Meyer, R.; Asher, Z.; Abdel-Qader, I. Analysis of LiDAR and camera data in real world weather conditions for autonomous vehicle operations. SAE Int. J. Advanc. Curr. Prac. Mobil. 2020, 2, 2428–2434. [Google Scholar]
- Bloomberg Businessweek, Self-Driving Cars Can Handle Neither Rain nor Sleet nor Snow. Available online: https://www.bloomberg.com/news/articles/2018-09-17/self-driving-cars-still-can-t-handle-bad-weather. (accessed on 23 June 2021).
- Kutila, M.; Pyykönen, P.; Ritter, W.; Sawade, O.; Schäufele, B. Automotive LIDAR Sensor Development Scenarios for Harsh Weather Conditions. In Proceedings of the 2016 IEEE 19th International Conference on Intelligent Transportation Systems (ITSC), Rio de Janeiro, Brazil, 1–4 November 2016; IEEE: New York, NY, USA, 2016; pp. 265–270. [Google Scholar]
- Heinzler, R.; Schindler, P.; Seekircher, J.; Ritter, W.; Stork, W. Weather influence and classification with automotive LIDAR sensors. In Proceedings of the 2019 IEEE Intelligent Vehicles Symposium (IV), Paris, France, 9–12 June 2019; pp. 1527–1534. [Google Scholar]
- Rivero, J.R.V.; Gerbich, T.; Teiluf, V.; Buschardt, B.; Chen, J. Weather classification using an automotive LIDAR sensor based on detections on asphalt and atmosphere. Sensors 2020, 20, 4306. [Google Scholar] [CrossRef] [PubMed]
- Roh, C.G.; Im, I. A review on Handcap Sections and Situations to Improve Driving Safety of Automated Vehicles. Sustainability 2020, 12, 5509. [Google Scholar] [CrossRef]
- Roh, B.; Min, J.H.; Lee, G.H. Understanding Statistics; Bum Moon Sa: Seoul, Korea, 2004. [Google Scholar]
- Roh, C.G.; Kim, J.; Im, I. Analysis of impact of rain conditions on ADAS. Sensors 2020, 20, 6720. [Google Scholar] [CrossRef] [PubMed]
- YTN News Weather Center. How Much Damage Is Caused by Precipitation Per Hour? Available online: https://www.ytn.co.kr/_ln/0108_201607051237366868 (accessed on 18 July 2021).

| Changes of Environment on the Road | Performance Indicator | Theoretically Expected Results |
|---|---|---|
| Distance to the object target from vehicle (LiDAR) | NPCs | As the distance decreases, the NPCs gradually increase and then are maintained at a certain level. |
| Intensity | As the distance increases, the intensity gradually increases. | |
| Materials of the object target | NPCs | The NPCs are always maintained at a specific value. |
| Intensity | The intensity is maintained at a specific value. | |
| Driving speed of vehicle (LiDAR) | NPCs | The NPCs are always maintained at a specific value regardless of any change in speed. |
| Intensity | The intensity is always maintained at a specific value regardless of any change in speed. | |
| Rainfalls | NPCs | The NPCs decrease as rainfall increases. |
| Intensity | The intensity decreases as rainfall increases. | |
| Colors of the object target | NPCs | The NPCs decrease as the color of the target becomes more achromatic. |
| Intensity | The intensity decreases as the color of the target becomes more achromatic. |
| Sensor | Time of Flight Distance Measurement 32 Channels Measurement Range: 40 cm to 200 m (on 20% reflectivity target) Accuracy: ±3 cm Field of View: (Vertical) −25° to approximately +15°/(Horizontal) 360° Angular Resolution: (Vertical) at least 0.33°/(Horizontal) 0.1° to 0.4° Rotation Speed: 300/600/1200 rpm |
| Laser | Class 1 Wavelength: 905 nm Full Beam Divergence Horizontal: 7.4 mrad, Vertical: 1.4 mrad |
| Output | Data Rate: approximately 600,000 points/second 100 Mbps Ethernet UDP packet include: Distance, Rotation Angle/Azimuth, Calibrated Reflectivity, Synchronized Timestamp (Resolution: 1 μs) |
| Element | Item | Scenarios by Item | |||||
|---|---|---|---|---|---|---|---|
| Environmental Factor | Speed (Km/h) | 80 | 60 | 40 | 20 | ||
| Distance (m) | 100 | 80 | 60 | 40 | 20 | ||
| Rainfall (mm/h) | 0 (Sunny Day) | 10 | 20 | 30 | 40 | 50 | |
| Target Factor | Material | Wood | Plastic | Steel | Aluminum | ||
| Hypothesis | Distance | Sunny Day |
|---|---|---|
| Hypothesis 1 | 100 m | Could not be analyzed |
| 80 m | Accepted | |
| 60 m | Accepted | |
| 40 m | Accepted | |
| 20 m | Accepted | |
| Hypothesis 2 | 100 m | Could not be analyzed |
| 80 m | Accepted | |
| 60 m | Accepted | |
| 40 m | Accepted | |
| 20 m | Accepted |
| Rainfall (mm/h) | Classification | Expressions |
|---|---|---|
| 10 mm | Moderate Rain | The sound of raindrops falling on the roof of the vehicle is heard. |
| 20 mm | Heavy Rain | Strong sound of rain. It becomes difficult to secure visibility without using the wipers. |
| 30 mm | Heavy rainfall causes fields or sewers to start overflowing, with a high risk of rain damage. It is difficult to secure forward visibility even when the wiper is operated at normal speed. | |
| 40 mm | With the pouring rain at the level of heavy rainfall warning, it is difficult to secure forward visibility even when operating the wipers at its highest speed. | |
| 50 mm | Violent Rain | The vehicle should be driven at low speed even with wipers being operated at highest speed. |
| Hypothesis | Distance | Rainfall 10 mm/h | Rainfall 20 mm/h | Rainfall 30 mm/h | Rainfall 40 mm/h | Rainfall 50 mm/h |
|---|---|---|---|---|---|---|
| Hypothesis 1 | 100 m | Rejected | Accepted * | Accepted | Rejected | Rejected |
| 80 m | Accepted | Accepted | Accepted | Rejected | Rejected | |
| 60 m | Accepted | Accepted | Rejected | Rejected | Rejected | |
| 40 m | Accepted | Accepted | Rejected | Rejected | Rejected | |
| 20 m | Accepted | Accepted | Accepted | Accepted | Rejected | |
| Hypothesis 2 | 100 m | Rejected | Accepted * | Accepted | Accepted | Accepted |
| 80 m | Accepted | Rejected | Accepted | Rejected | Accepted | |
| 60 m | Accepted | Rejected | Accepted | Accepted | Accepted | |
| 40 m | Rejected | Rejected | Rejected | Rejected | Rejected | |
| 20 m | Rejected | Rejected | Rejected | Rejected | Rejected |
| Hypothesis | Distance | Analysis Result |
|---|---|---|
| Hypothesis 1 | 100 m | Rejected |
| 80 m | Rejected | |
| 60 m | Rejected | |
| 40 m | Rejected | |
| 20 m | Rejected | |
| Hypothesis 2 | 100 m | Accepted |
| 80 m | Accepted | |
| 60 m | Accepted | |
| 40 m | Accepted | |
| 20 m | Accepted |
| Hypothesis | Distance | 10 mm/h | 20 mm/h | 30 mm/h | 40 mm/h | 50 mm/h |
|---|---|---|---|---|---|---|
| Hypothesis 1 | 100 m | Rejected | Rejected | Rejected | - | - |
| 80 m | Rejected | Rejected | Rejected | - | - | |
| 60 m | Rejected | Rejected | Rejected | Rejected | - | |
| 40 m | Rejected | Rejected | Rejected | Rejected | Rejected | |
| 20 m | Rejected | Rejected | Rejected | Rejected | Rejected | |
| Hypothesis 2 | 100 m | Accepted | Accepted | Accepted | - | - |
| 80 m | Accepted | Accepted | Accepted | - | - | |
| 60 m | Rejected | Accepted | Accepted | Rejected | - | |
| 40 m | Rejected | Rejected | Accepted | Rejected | Accepted | |
| 20 m | Rejected | Rejected | Accepted | Accepted | Rejected |
| Changes of Environment on the Road | Performance Indicator | Theoretically Expected Results | Real Road Environment Analysis Results |
|---|---|---|---|
| Distance to the object target from vehicle (LiDAR) | NPC | As the distance decreases, the NPC gradually increases and then is maintained at a certain value. | Same as left |
| Intensity | As the distance decreases, the intensity gradually increases. | Same as left (however, decreases at close range) | |
| Materials of the object target | NPC | The NPC is maintained at a specific value according to target material. | NPC is measured uniformly regardless of the target material. However, in more than 40 mm/h of rain, the measured value depends on the material. |
| Intensity | The intensity is maintained at a specific value according to target material. | Same as left | |
| Driving speed of vehicle (LiDAR) | NPC | The NPC is always maintained at a specific value regardless of any change in speed. | Same as left |
| Intensity | The intensity is always maintained at a specific value regardless of any change in speed. | Same as left | |
| Rainfalls | NPC | NPC decreases as rainfall increases. | Same as left However, data loss begins to occur from 40 mm/h rainfall. |
| Intensity | The intensity decreases as rainfall increases. | Same as left However, data loss begins to occur from 40 mm/h rainfall. |
Publisher’s Note: MDPI stays neutral with regard to jurisdictional claims in published maps and institutional affiliations. |
© 2021 by the authors. Licensee MDPI, Basel, Switzerland. This article is an open access article distributed under the terms and conditions of the Creative Commons Attribution (CC BY) license (https://creativecommons.org/licenses/by/4.0/).
Share and Cite
Kim, J.; Park, B.-j.; Roh, C.-g.; Kim, Y. Performance of Mobile LiDAR in Real Road Driving Conditions. Sensors 2021, 21, 7461. https://doi.org/10.3390/s21227461
Kim J, Park B-j, Roh C-g, Kim Y. Performance of Mobile LiDAR in Real Road Driving Conditions. Sensors. 2021; 21(22):7461. https://doi.org/10.3390/s21227461
Chicago/Turabian StyleKim, Jisoo, Bum-jin Park, Chang-gyun Roh, and Youngmin Kim. 2021. "Performance of Mobile LiDAR in Real Road Driving Conditions" Sensors 21, no. 22: 7461. https://doi.org/10.3390/s21227461
APA StyleKim, J., Park, B.-j., Roh, C.-g., & Kim, Y. (2021). Performance of Mobile LiDAR in Real Road Driving Conditions. Sensors, 21(22), 7461. https://doi.org/10.3390/s21227461