
Optical OFDM Error Floor Estimation by Means of OTDR Enhanced by Front-End Optical Preamplifier


Abstract
:1. Introduction
2. Analysis
2.1. OFDM BER Floor Model
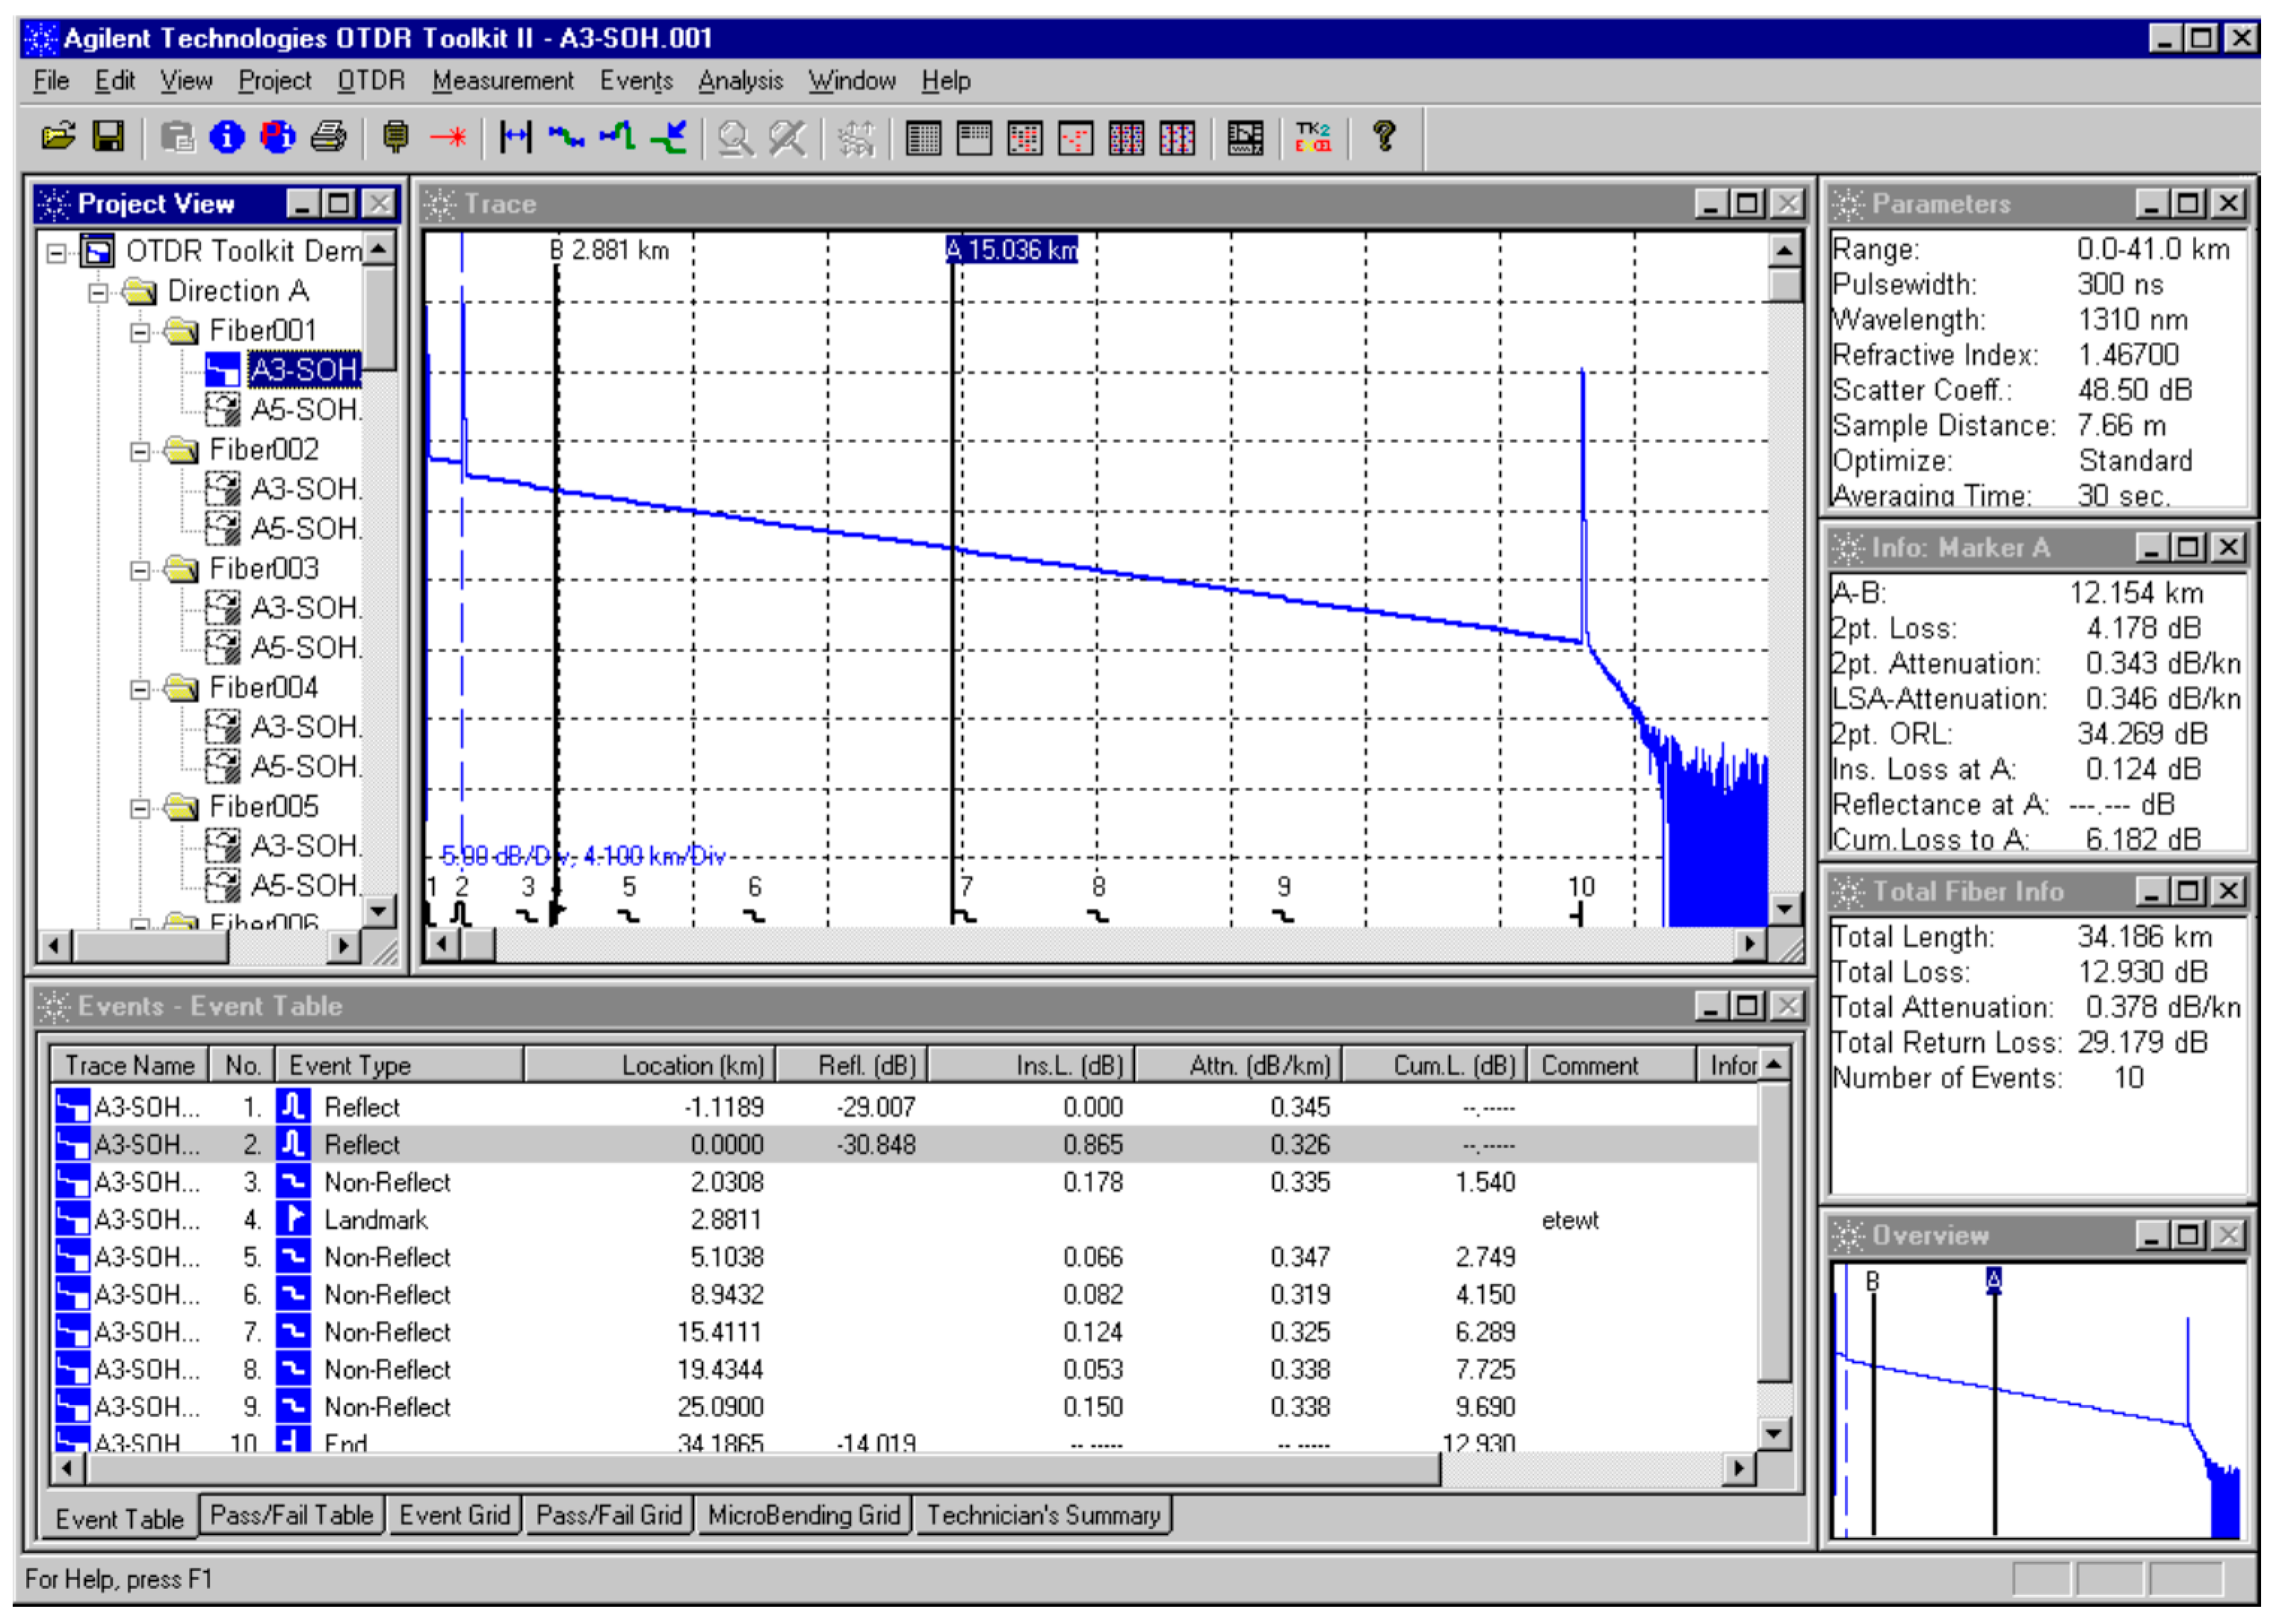
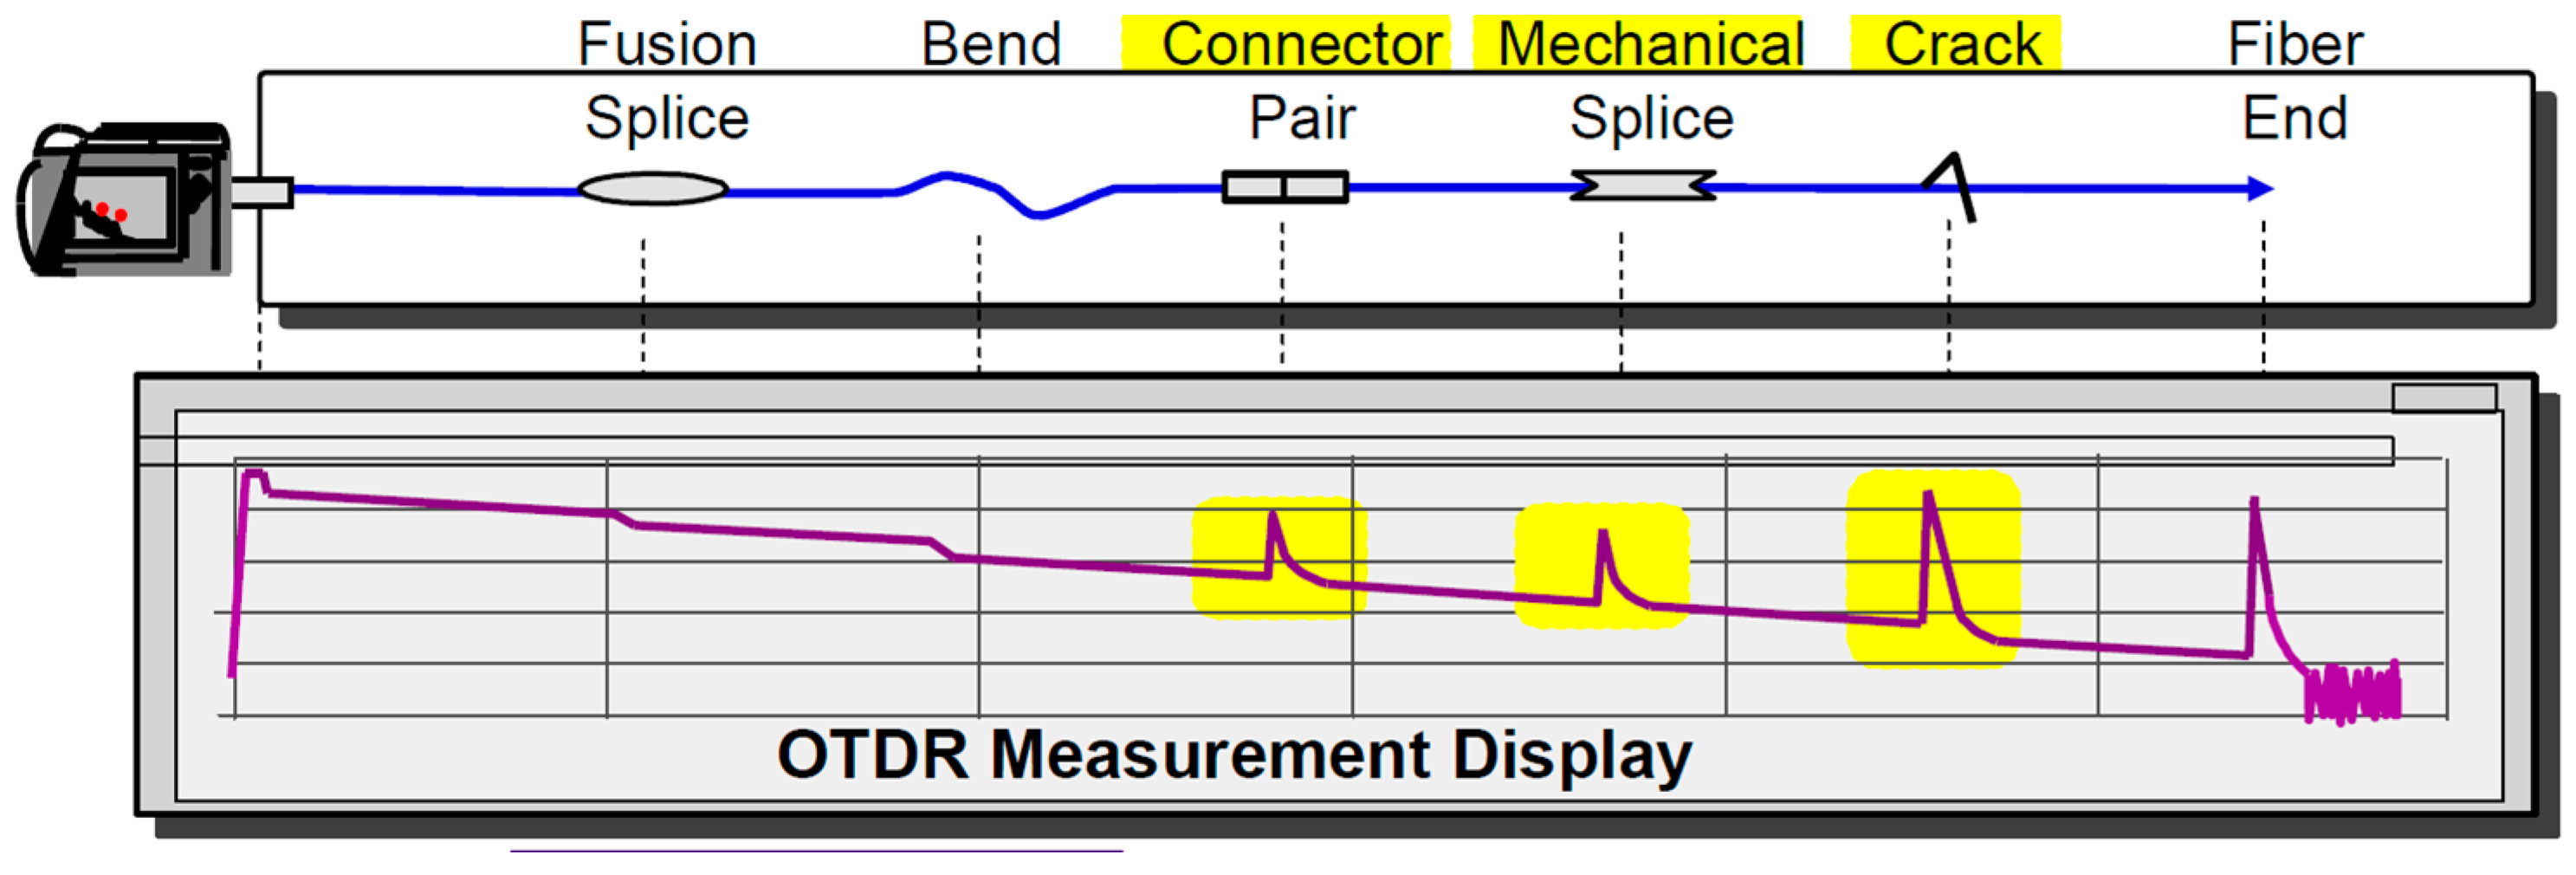
2.2. OTDR Trace as Power-Delay Profile
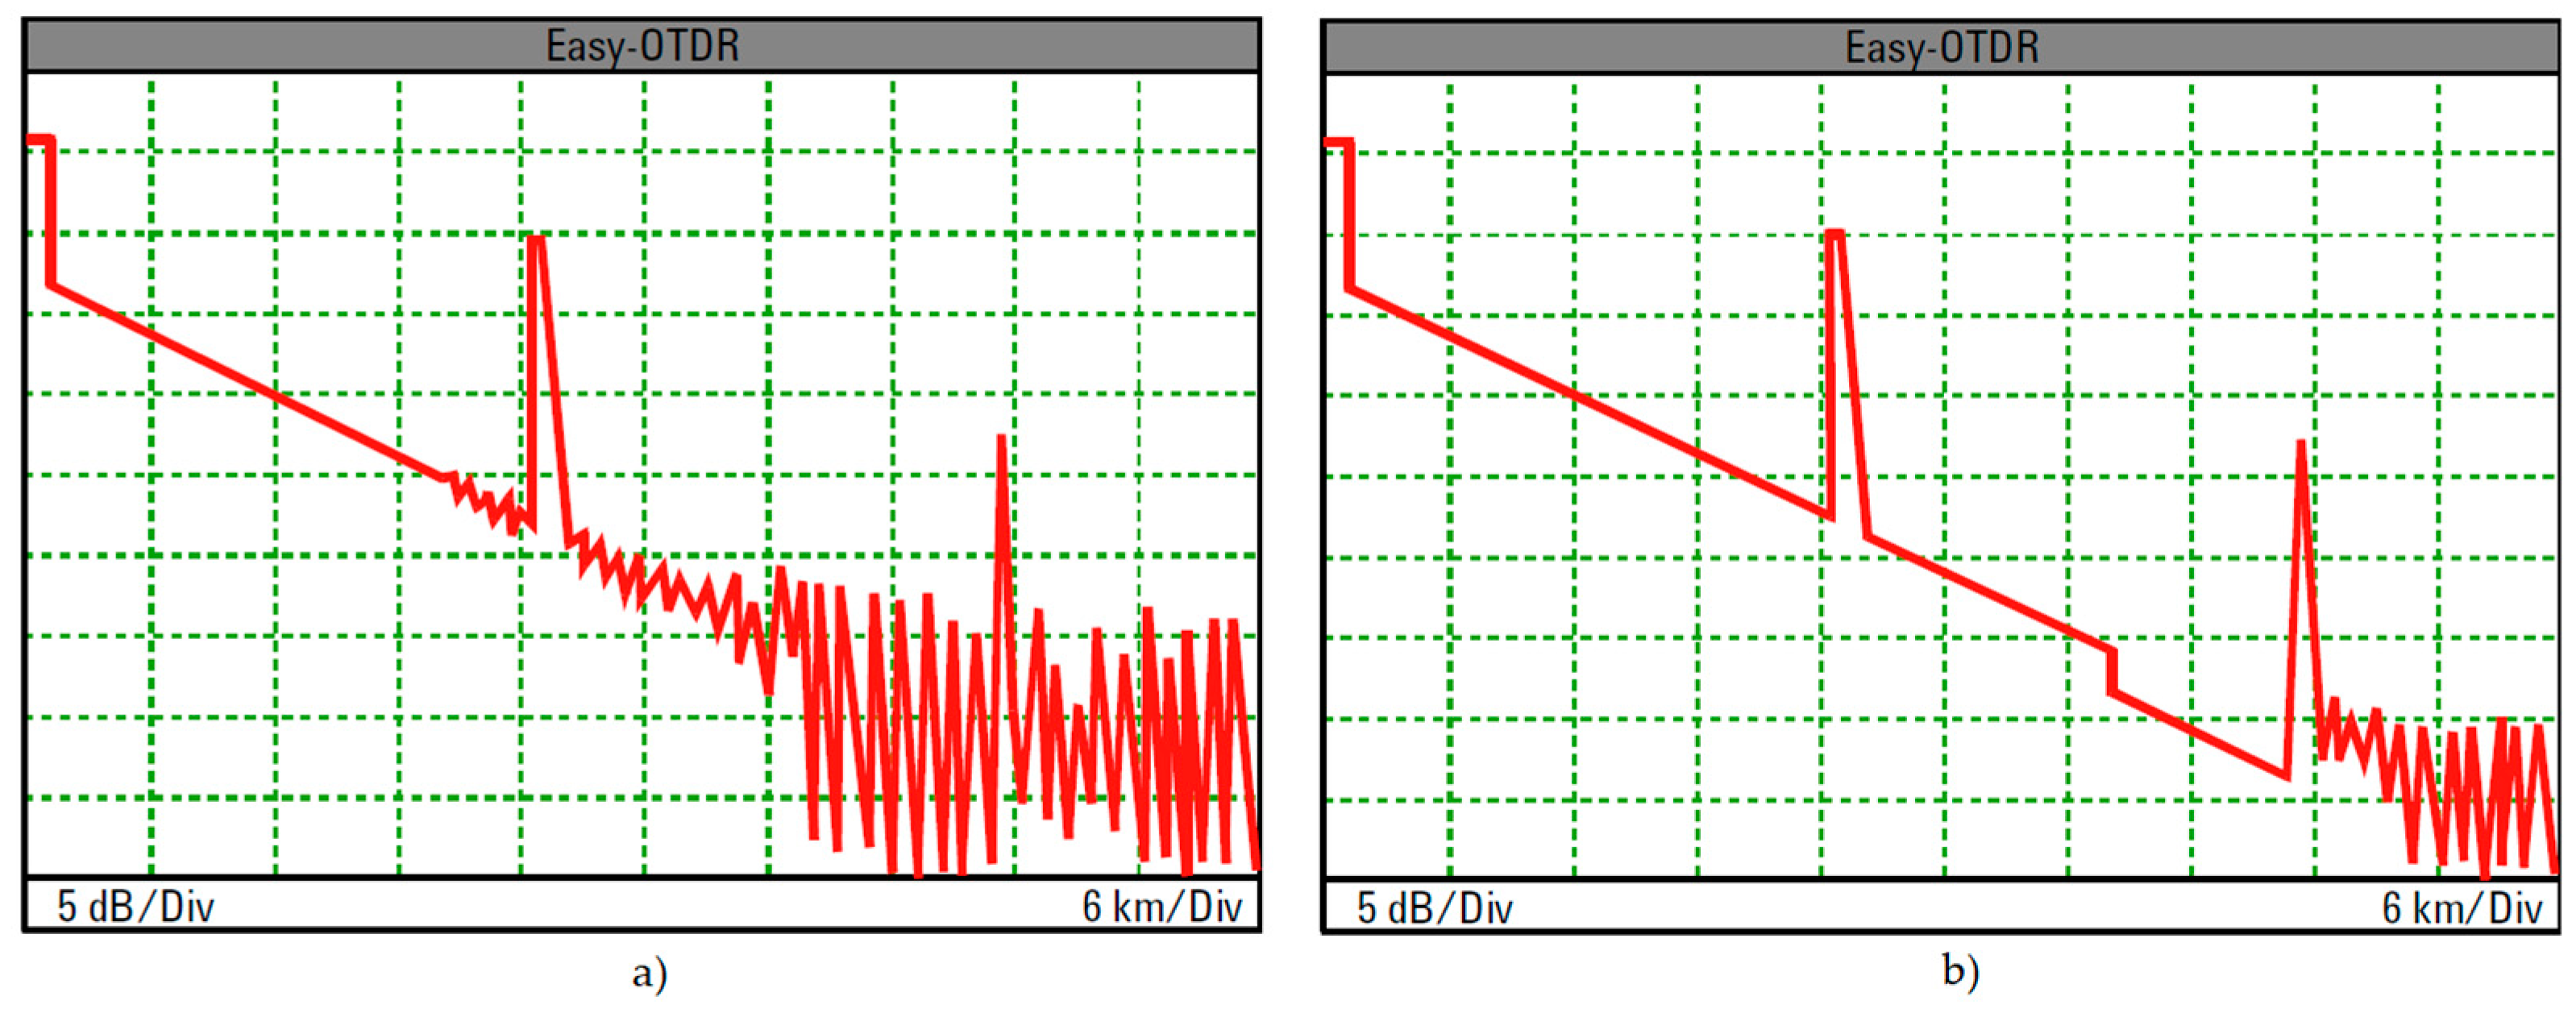
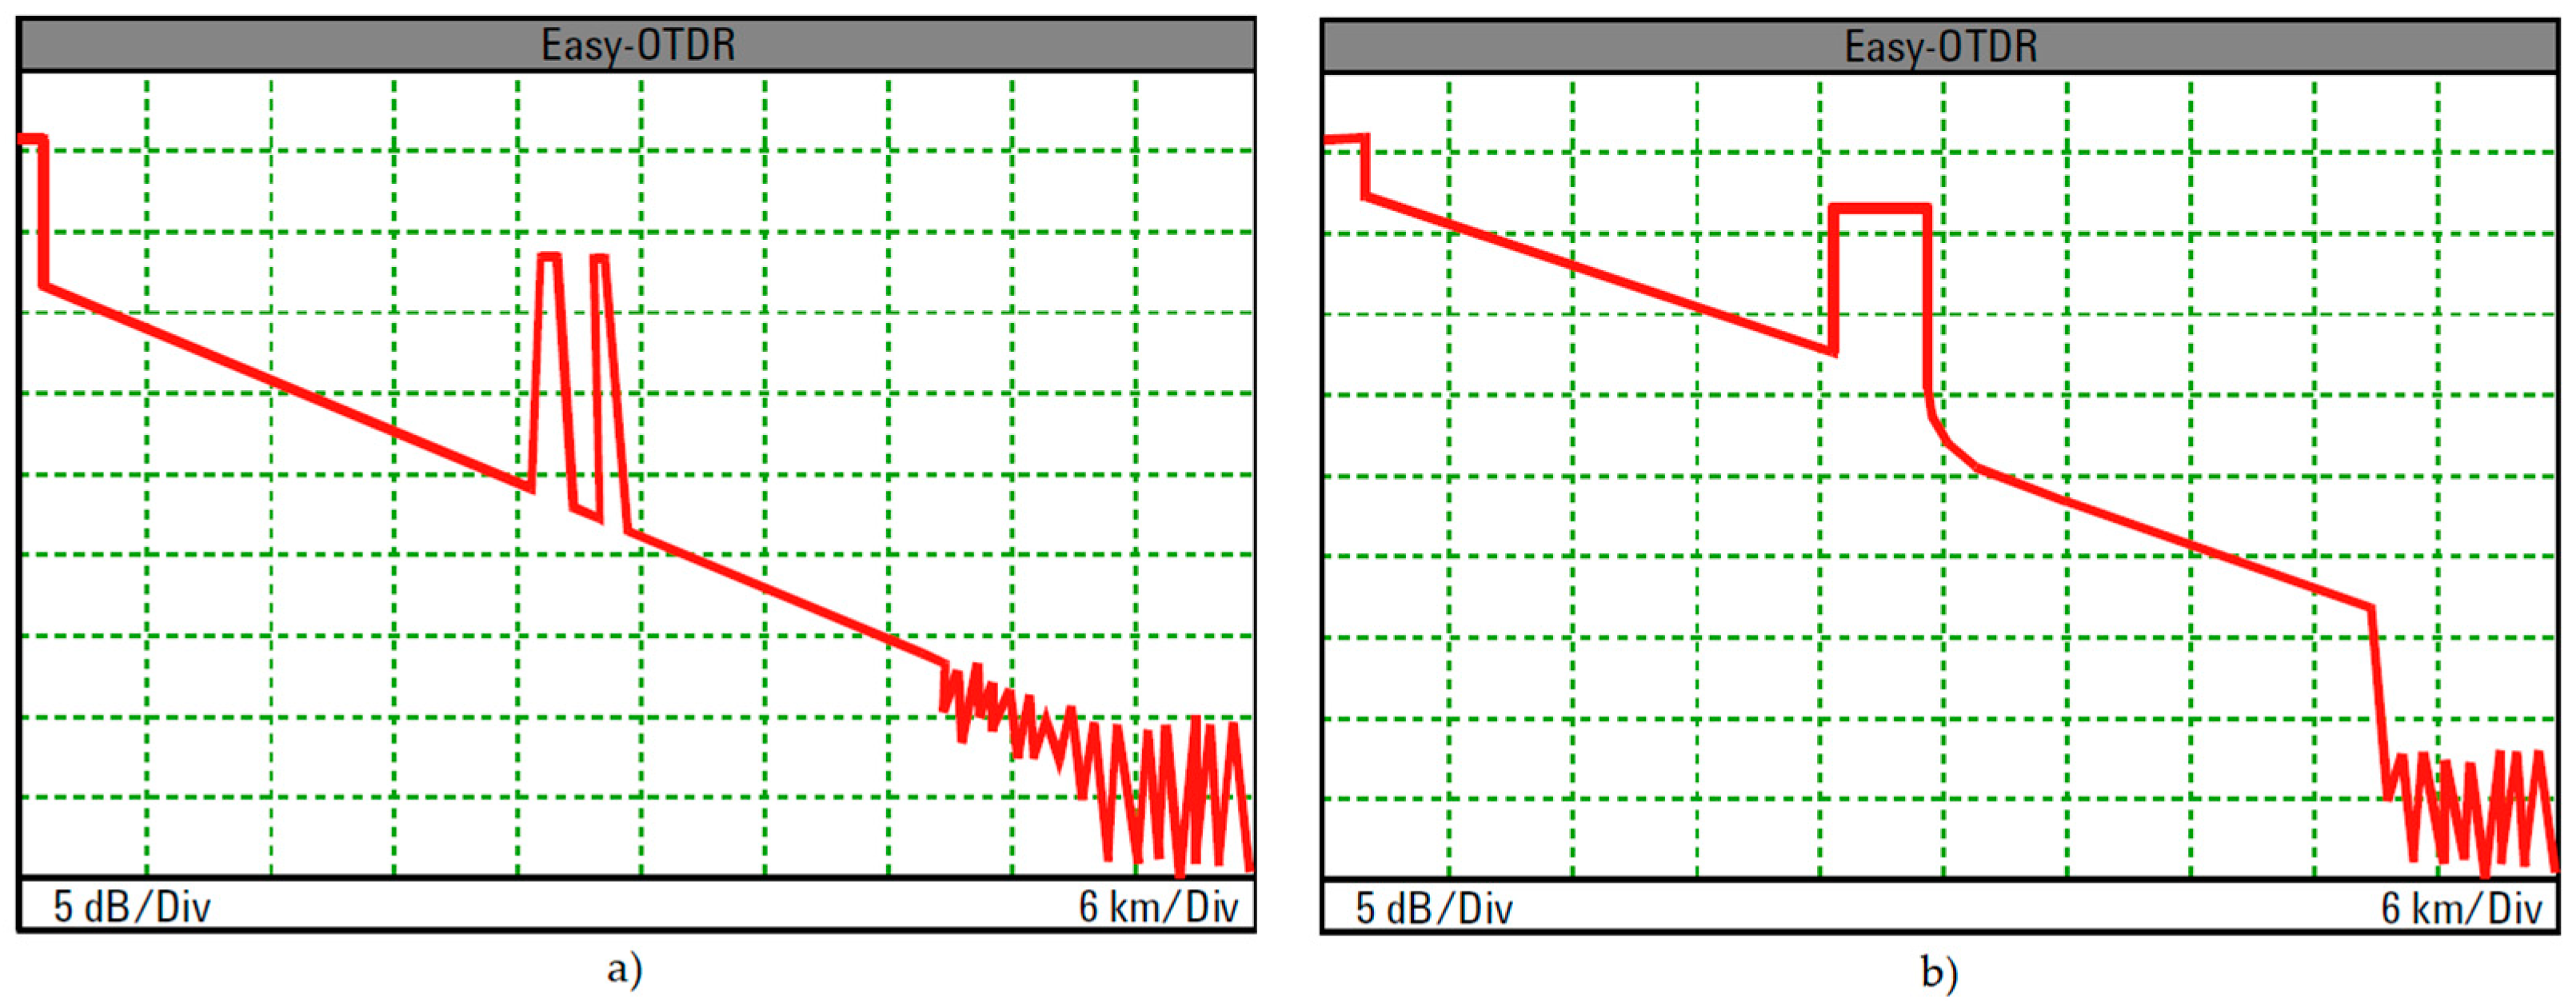
2.3. OTDR Dynamic Range
2.4. OTDR Receiver Noise Floor Reduction
2.4.1. Noise Figure of ODC Coupled OTDR
2.4.2. OA/OC/OTDR Dynamic Range Prediction Model
3. Test Results
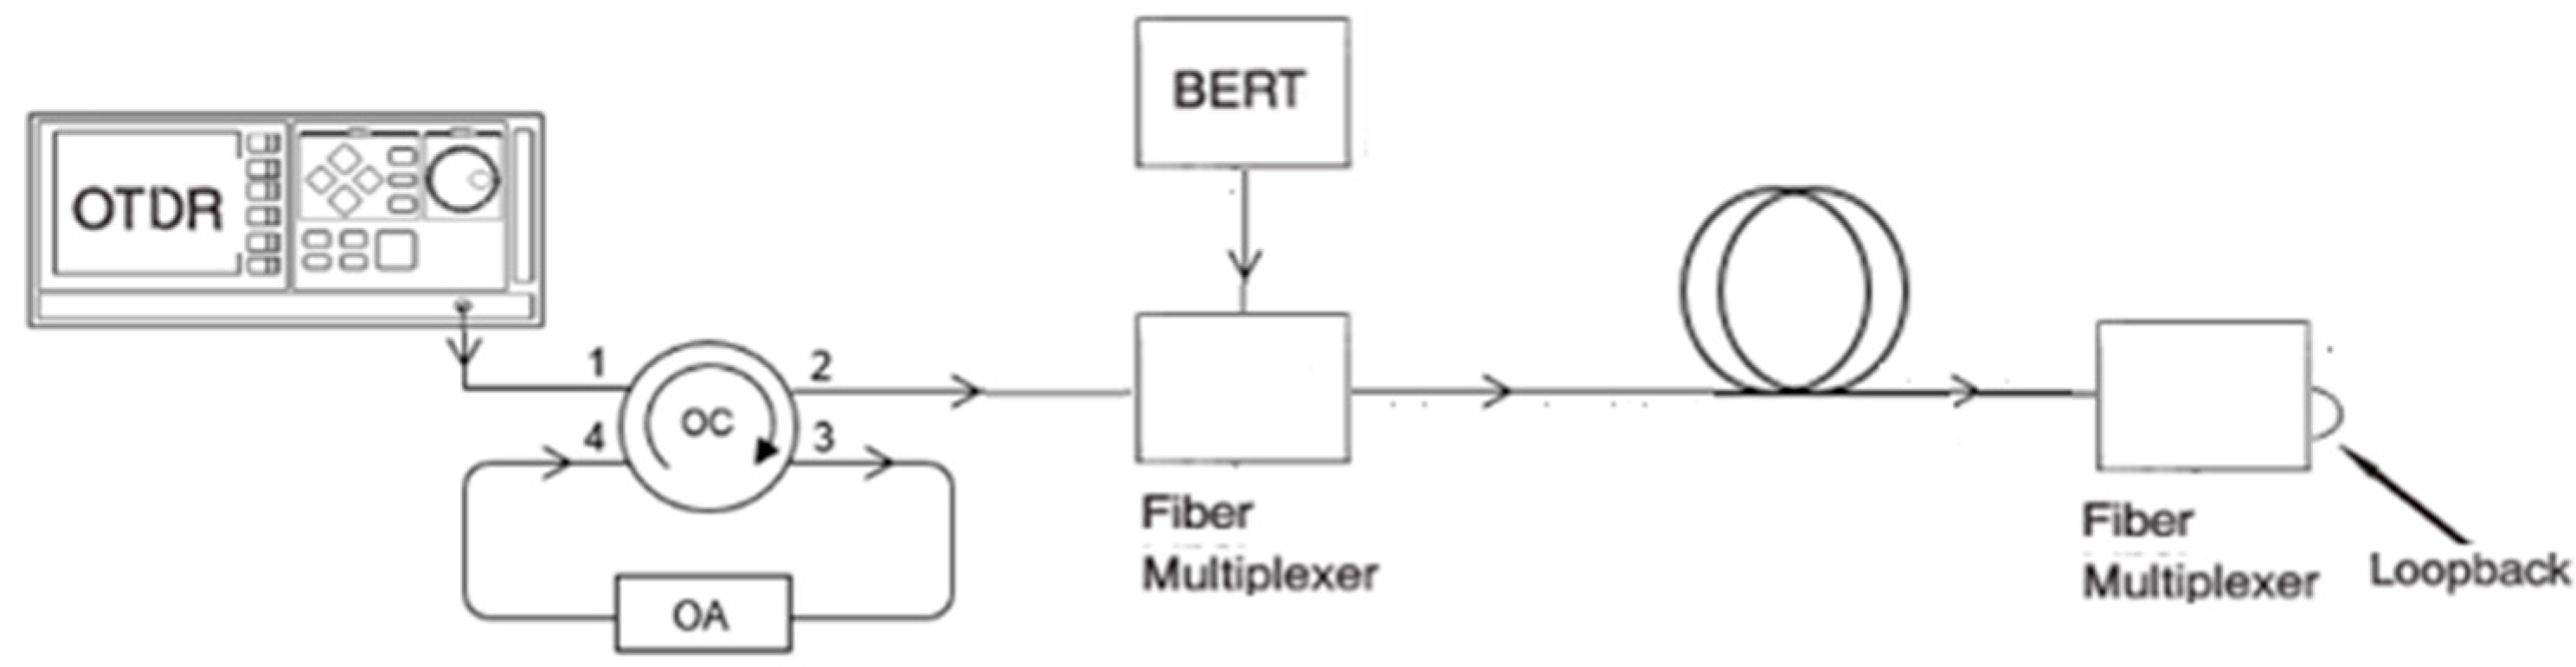
3.1. Test System
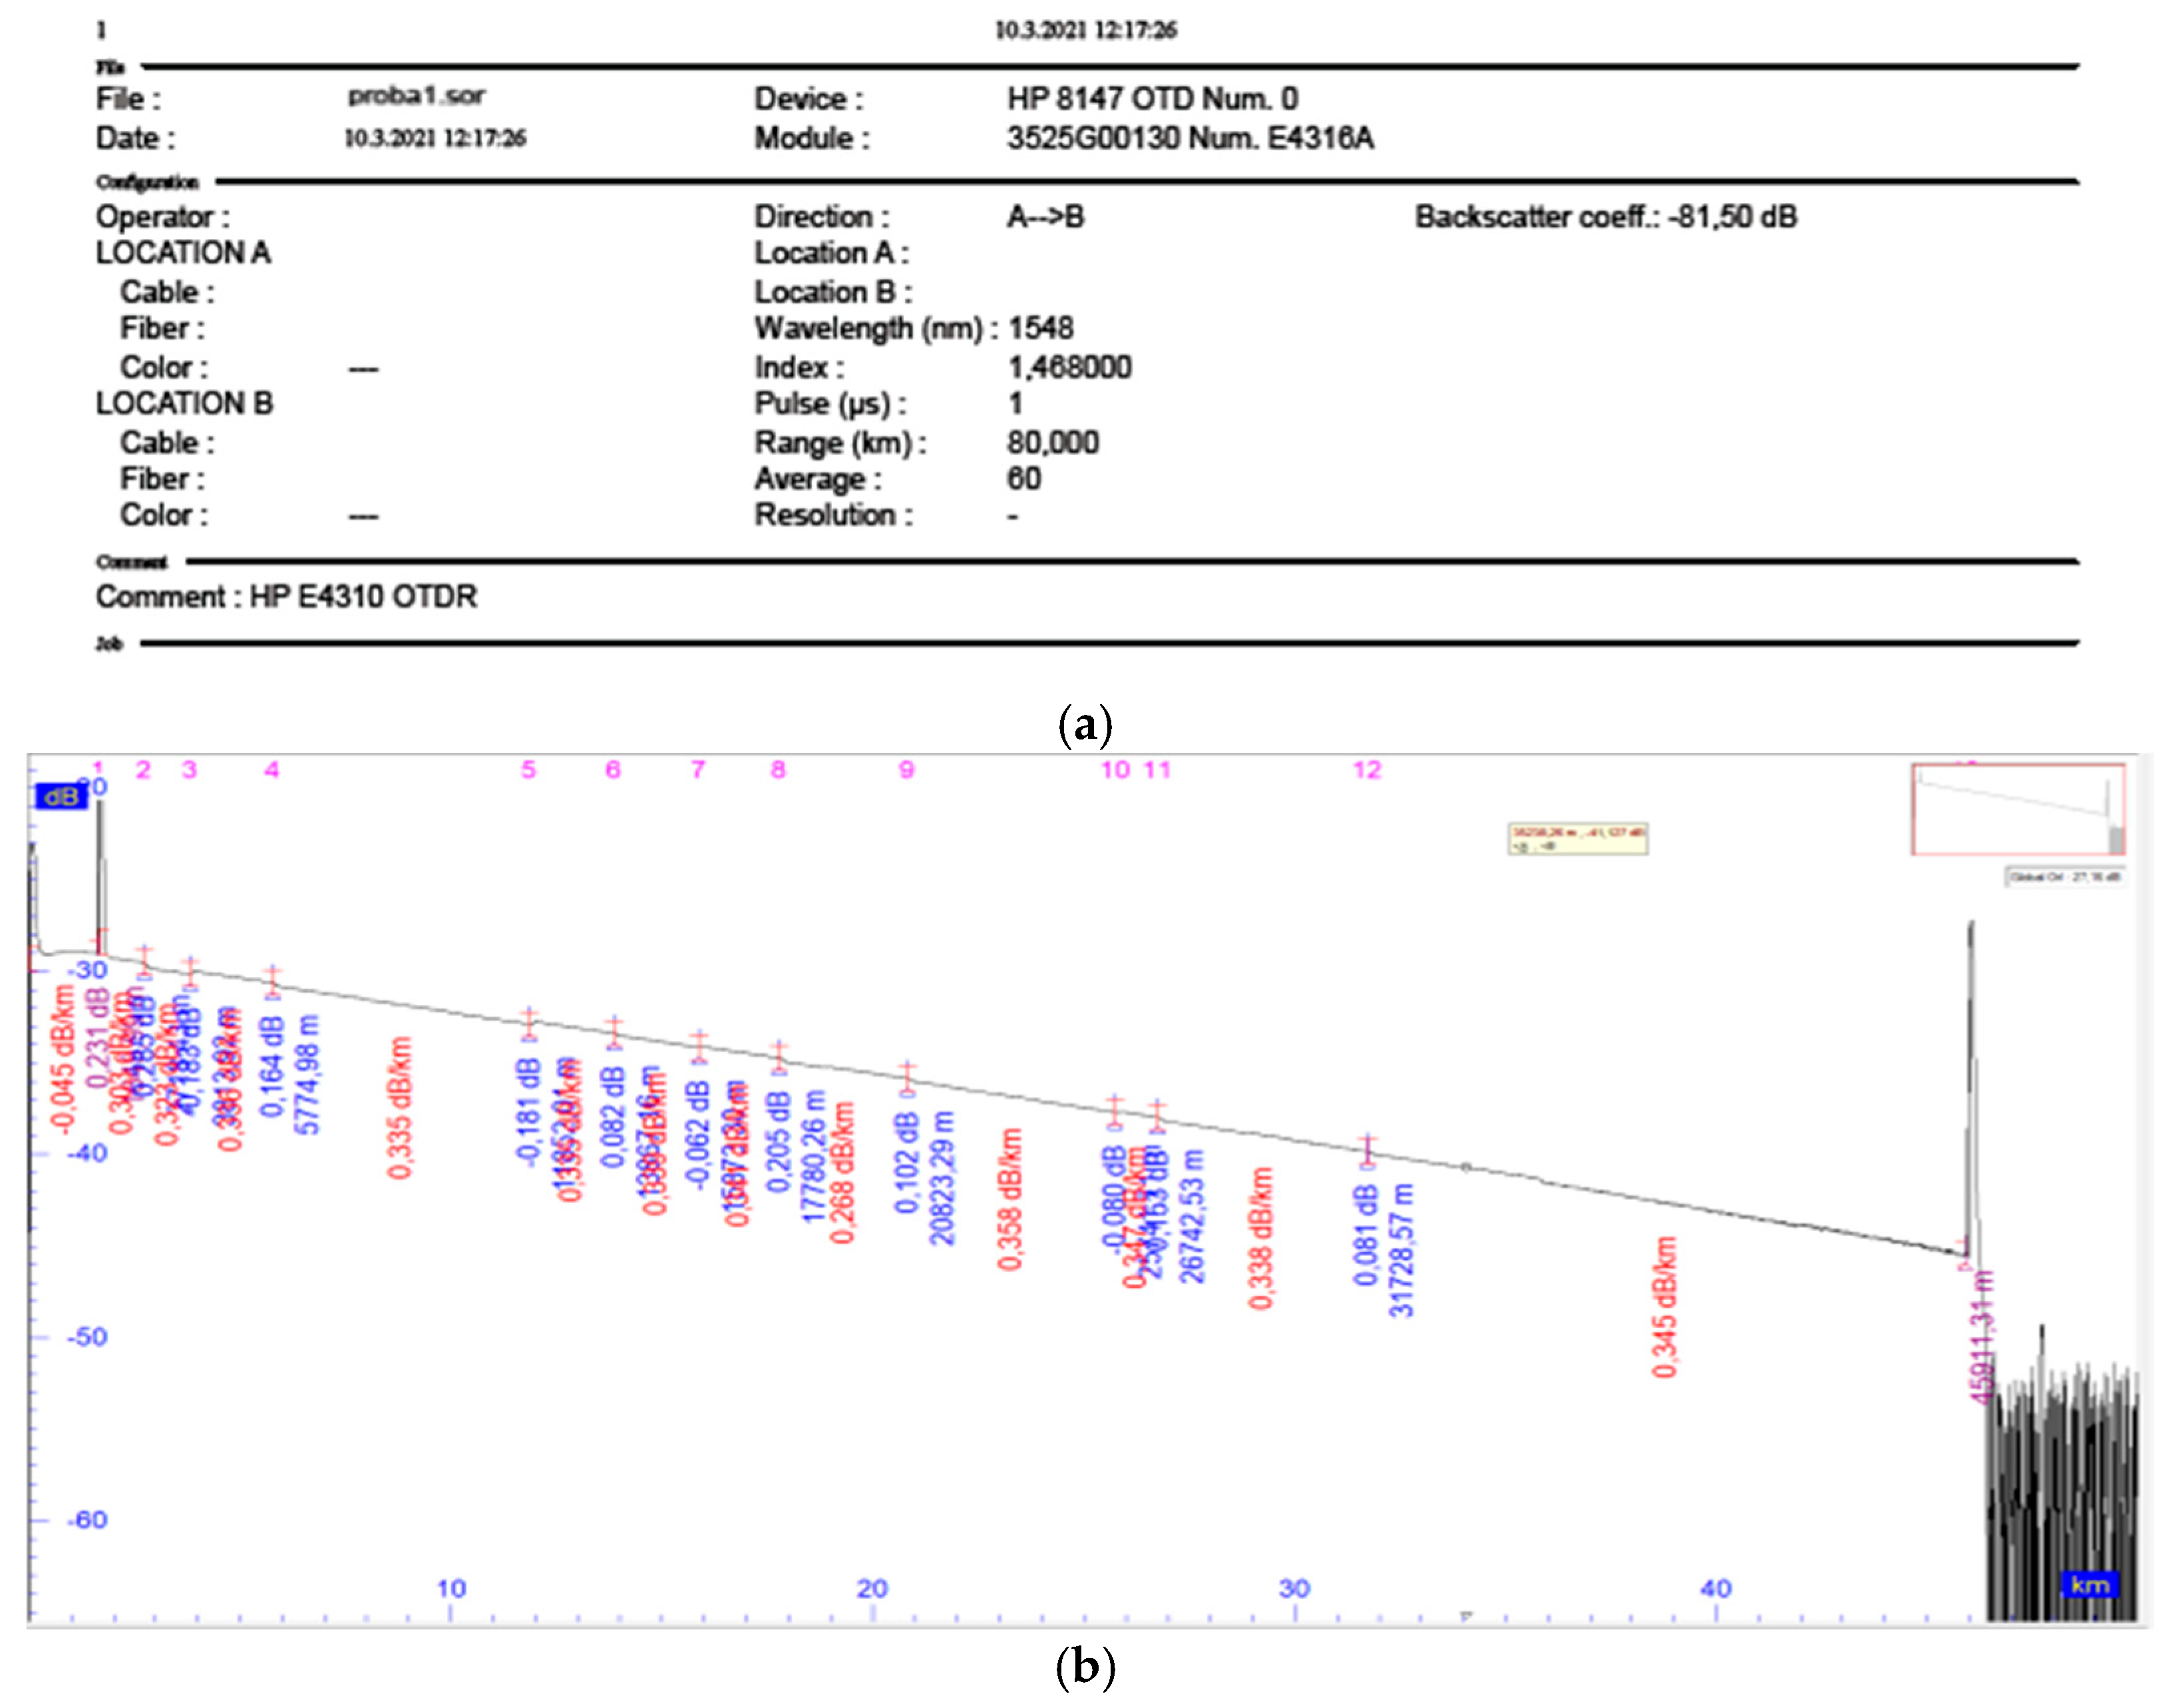
3.2. Preliminary Test Results
4. Conclusions
Author Contributions
Funding
Institutional Review Board Statement
Informed Consent Statement
Data Availability Statement
Conflicts of Interest
References
- Lipovac, A. Practical Enhancement of Fiber Installation and Maintenance Test Tools—Example of Extending OTDR Distance Range by Optical Preamplifier. In Proceedings of the European Lasers, Photonics and Optics Technologies Summit, Paris, France, 24–25 September 2020. [Google Scholar]
- Winzer, P.J.; Neilson, D.T.; Chraplyvy, A.R. Fiber-optic transmission and networking: The previous 20 and the next 20 years. Opt. Express 2018, 26, 24190–24239. [Google Scholar] [CrossRef] [PubMed]
- Hui, R. Passive optical components. In Introduction to Fiber-Optic Communications, 1st ed.; Academic Press: Cambridge, MA, USA, 2020; pp. 209–297. [Google Scholar]
- Hui, R.; O’Sullivan, M. Characterization of Optical Devices. In Fiber Optic Measurement Techniques, 1st ed.; Academic Press: Cambridge, MA, USA, 2009; pp. 259–363. [Google Scholar]
- Lu, X.; Soto, M.A.; Thévenaz, L. Temperature-strain discrimination in distributed optical fiber sensing using phase-sensitive optical time-domain reflectometry. Opt. Express 2017, 25, 16059–16071. [Google Scholar] [CrossRef] [PubMed] [Green Version]
- Alekseev, A.E.; Vdovenko, V.S.; Gorshkov, B.G.; Potapov, V.T.; Simikin, D.E. Fading reduction in a phase optical time-domain reflectometer with multimode sensitive fiber. Laser Phys. 2016, 26, 95–101. [Google Scholar] [CrossRef]
- Hartog, A.H. Frequency-Scanned Optical Time Domain Reflectometry. US Patent 7859654B2, 17 July 2008. [Google Scholar]
- Tangudu, R.; Sahu, P.K. Dynamic Range Improvement of Backscattered Optical Signals using Signal Processing Techniques. In Proceedings of the IEEE Applied Signal Processing Conference (ASPCON), Kolkata, India, 7–9 October 2020. [Google Scholar]
- Agilent Technologies. Optical Time Domain Reflectometers, Pocket Guide; Agilent Technologies: Santa Clara, CA, USA, 2001. [Google Scholar]
- Lipovac, A.; Lipovac, V.; Modlic, B. PHY, MAC, and RLC Layer Based Estimation of Optimal Cyclic Prefix Length. Sensors 2021, 21, 4796. [Google Scholar] [CrossRef] [PubMed]
- Hamza, M.; Lipovac, V.; Lipovac, A. BER-based BLER Prediction for LTE FDD DL Channel with Small Delay Dispersion. In Proceedings of the International Wireless Communications and Mobile Computing Conference (IWCMC), Dubrovnik, Croatia, 24–28 August 2015; pp. 1156–1161. [Google Scholar]
- Lipovac, A.; Lipovac, V.; Hamza, M.; Batoš, V. Extending OTDR Distance Span by External Front-End Optical Preamplifier. Electronics 2021, 10, 2275. [Google Scholar] [CrossRef]
- Anderson, D.R.; Johnson, L.; Bell, F.G. Troubleshooting Optical-Fiber Networks (Understanding and Using your Optical Time-Domain Reflectometer), 2nd ed.; Elsevier Academic Press: San Diego, CA, USA, 2004; pp. 279–290. [Google Scholar]
- Charlamov, J.; Navickas, R.; Baskys, A.; Barzdenas, V.; Nickelson, L. Optical Receiver for Optical Time Domain Reflectometer. Elektronika ir elektrotechnika 2012, 18, 49–52. [Google Scholar] [CrossRef]
- Huntington, A. Sensitivity Analysis of APD Photoreceivers; VoxtelOpto, Voxtel Inc.: Beaverton, OR, USA, 2016; pp. 1–39. [Google Scholar]
- Mackowiak, V.; Peupelmann, J.; Ma, Y.; Gorges, A. NEP—Noise Equivalent Power; Thorlabs, Inc.: Dachau, Germany, 2015; pp. 1–5. [Google Scholar]
- Haus, H.A. The noise figure of optical amplifiers. IEEE Photonics Technol. Lett. 1998, 10, 1602–1604. [Google Scholar] [CrossRef]
- Desurvire, E. Comments on ‘The Noise Figure of Optical Amplifiers’. IEEE Photonics Technol. Lett. 1999, 11, 620–621. [Google Scholar] [CrossRef]
- Abedin, K.S.; Taunay, T.F.; Fishteyn, M.; Yan, M.F.; Zhu, B.; Fini, J.M.; Monberg, E.M.; Dimarcello, F.V.; Wisk, P.W. Amplification and noise properties of an erbium-doped multicore fiber amplifier. Opt. Express 2011, 19, 16715–16721. [Google Scholar] [CrossRef] [PubMed]
- Chen, H.; Jin, C.; Huang, B.; Fontaine, N.K.; Ryf, R.; Shang, K.; Grégoire, N.; Morency, S.; Essiambre, R.-J.; Li, G.; et al. Integrated cladding-pumped multicore few-mode erbium-doped fiber amplifier for space-division-multiplexed communications. Nat. Photonics 2016, 10, 529–533. [Google Scholar] [CrossRef] [Green Version]
- Erbium Doped Fiber Amplifiers. Available online: https://nuphoton.com/product-category/fiber-amplifiers/erbium-doped-fiber-amplifiers/ (accessed on 15 September 2021).
- Zlatar, S.; Lipovac, V.; Lipovac, A.; Hamza, M. Practical Consistency of Ethernet-Based QoS with Performance Prediction of Heterogeneous Microwave Radio Relay Transport Network. Electronics 2021, 10, 913. [Google Scholar] [CrossRef]


| Link Length | 50 km | 80 km |
|---|---|---|
| BER_OTDRT.DISP | 4.13 × 10⁻¹² | 6.31 × 10⁻¹² |
| BER_OTDRT.DISP/OA | 4.08 × 10⁻¹² | 6.22 × 10⁻¹² |
| BER_OTDRABSTR | 4.84 × 10⁻¹² | 6.97 × 10⁻¹² |
| BER_OTDRABSTR/OA | 4.77 × 10⁻¹² | 6.83 × 10⁻¹² |
| BER_BERT | 4.49 × 10⁻¹² | 6.89 × 10⁻¹² |
| BER_BERT/OA | 4.46 × 10⁻¹² | 6.7 × 10⁻¹² |
| Link Length | 50 km | 80 km |
|---|---|---|
| BER_OTDRT.DISP | 5.02 × 10⁻⁸ | 7.63 × 10⁻⁸ |
| BER_OTDRT.DISP/OA | 4.96 × 10⁻⁸ | 7.32 × 10⁻⁸ |
| BER_OTDRABSTR | 5.52 × 10⁻⁸ | 8.42 × 10⁻⁸ |
| BER_OTDRABSTR/OA | 5.48 × 10⁻⁸ | 8.24 × 10⁻⁸ |
| BER_BERT | 5.45 × 10⁻⁸ | 8.37 × 10⁻⁸ |
| BER_BERT/OA | 5.42 × 10⁻⁸ | 8.14 × 10⁻⁸ |
Publisher’s Note: MDPI stays neutral with regard to jurisdictional claims in published maps and institutional affiliations. |
© 2021 by the authors. Licensee MDPI, Basel, Switzerland. This article is an open access article distributed under the terms and conditions of the Creative Commons Attribution (CC BY) license (https://creativecommons.org/licenses/by/4.0/).
Share and Cite
Lipovac, A.; Lipovac, V.; Hamza, M.; Batoš, V. Optical OFDM Error Floor Estimation by Means of OTDR Enhanced by Front-End Optical Preamplifier. Sensors 2021, 21, 7303. https://doi.org/10.3390/s21217303
Lipovac A, Lipovac V, Hamza M, Batoš V. Optical OFDM Error Floor Estimation by Means of OTDR Enhanced by Front-End Optical Preamplifier. Sensors. 2021; 21(21):7303. https://doi.org/10.3390/s21217303
Chicago/Turabian StyleLipovac, Adriana, Vlatko Lipovac, Mirza Hamza, and Vedran Batoš. 2021. "Optical OFDM Error Floor Estimation by Means of OTDR Enhanced by Front-End Optical Preamplifier" Sensors 21, no. 21: 7303. https://doi.org/10.3390/s21217303
APA StyleLipovac, A., Lipovac, V., Hamza, M., & Batoš, V. (2021). Optical OFDM Error Floor Estimation by Means of OTDR Enhanced by Front-End Optical Preamplifier. Sensors, 21(21), 7303. https://doi.org/10.3390/s21217303