1. Introduction
Bluetooth low energy (BLE) beacon sensors that transmit information about environmental changes can potentially be utilized by healthcare providers to learn about when patients have used a health-related device or aid. In rehabilitation fields, it would be valuable to know whether patients are actively using an assistive device or whether they have abandoned it (i.e., given up) [
1,
2], in which case additional rehabilitation training and/or reassessment of the patient’s needs would be warranted. Additionally, both researchers and clinicians in rehabilitation fields may be interested to know if patients are using an assistive device more frequently or for longer durations after rehabilitation training to ascertain whether it has been effective for the patient and helpful to improve their outcomes, since providers are not able to accurately predict which patients will have successful outcomes following vision rehabilitation [
3]. Even in non-rehabilitation fields, healthcare providers may be interested to know about whether patients are compliant with prescribed interventions, such as eyeglasses [
4], eye drops [
5], exercise resistance bands [
6], toothbrushes [
7], test kits [
8] or medications [
9]. Currently, there is not a validated, efficient system to notify clinical providers or researchers about whether an individual has been using the device that was dispensed or prescribed to them. A potential solution is the use of BLE beacon sensors, which are capable of being attached to healthcare devices or aids.
A thermosensor device that does not involve BLE beacon technology has been previously studied to monitor compliance with spectacle eyeglasses prescriptions [
4]. In the field of rehabilitation, it has been reported that BLE patch sensors can be used to measure heart rate, steps and falls in the elderly [
10], and BLE beacon sensors that provide localization data have been proposed to track elderly individuals inside of facility buildings [
11,
12]. For individuals with visual impairment, systems involving BLE beacon sensors are being developed and evaluated to assist with indoor navigation inside buildings [
13] or adherence to the use of prescribed eye drops to treat glaucoma [
5]. We previously published on our idea to use BLE beacon sensors that measure changes in motion, temperature and/or humidity to track the use of handheld magnification devices (i.e., magnifiers) used by individuals with vision loss, but had only completed preliminary, brief evaluations (up to 150 s) in a clinical office setting [
14]. Here, we report on new data collected by BLE beacon sensors that were attached to magnifiers used by visually impaired people in their homes during real-world tasks. We hypothesized that meaningful changes would occur for both motion and temperature at times when magnifiers were used, such that those data, in combination, would be useful indicators of magnifier use by our visually impaired participants, as evidenced by correspondence to self-reported use of the magnifier in diary logs maintained by the participants.
2. Materials and Methods
We provided Estimote Sticker BLE beacon sensors to participants in a clinical trial (‘Beacon Sensors and Telerehabiliation to Assess and Improve use of Devices for visual functioning (BeST-AID)’ (NCT04066075) (
https://clinicaltrials.gov/ct2/show/NCT04066075 (accessed on 23 August 2021)). Here, we present data collected from eight older adult participants aged 68–93 years who had recently received a new handheld optical magnifier device from their vision rehabilitation provider. Information about each of the participants is provided
Table 1. Participants were recruited from three vision rehabilitation practices in the United States: a private optometric practice, Mid-Michigan Eye Care, by Dr. John Kaminski, and two academic centers, the University of California, Los Angeles (UCLA) and University of Nebraska Medical Center, by Drs. Ava Bittner and John Shepherd, respectively. Informed consent was obtained from all participants via phone by a UCLA study coordinator. The multicenter studies received approvals from the Institutional Review Board (IRB) at UCLA.
Each participant received one Estimote Sticker BLE beacon sensor that was attached to the handheld aspect of their light-emitting diode (LED) illuminated magnifier. The BLE beacon sensor was placed either on the top, bottom or side of the magnifier, whichever was in close proximity to their hand while using the magnifier and most comfortable for the participant. When the magnifier was not being used by the participant, the BLE beacon sensor collected data about the ambient temperature in the room, whereas the direct or indirect contact of the participant’s hand and/or fingers with the BLE beacon sensor on the handheld portion of the magnifier was expected to create an increased temperature measurement due to the transfer of body heat from the hand during magnifier use. We anticipated that the BLE beacon sensor would not detect motion when the magnifier was not used, whereas intermittent motion would be detected while participants actively used the magnifier for reading, since it involves making fine movements with the magnifier to scan the reading material.
Along with the BLE beacon sensor, we also provided a loaner smartphone (Samsung Galaxy S6) with a preinstalled mobile application to collect the signals from the transmitting BLE beacon sensors. We developed a dedicated mobile application for this study in order to assign a study ID code to each participant’s BLE beacon sensor data and send the collected data to our secure database server for later analysis. Participants were instructed to keep the loaner smartphone with the study mobile application plugged in and continuously turned on within ten feet of their magnifier use at home. Additionally, they were asked to keep a hand-written diary log for a two-week period to record the days on which they used their magnifier at home, along with the start and end times.
Descriptive data analyses were used to explore the mean, standard deviation (SD) and range of data collected by the BLE beacon sensor and participants’ diary logs. Generalized estimating equations and population-averaged models with logistic regressions and robust variance estimators, with clustering by subject for the repeated measures, were used to explore the relationships between the duration of magnifier use reported in the diary logs and the BLE beacon sensor data for the number of instances of motion recorded as a binary variable, rate of temperature increase and the total magnitude of temperature increase in degrees Celsius (°C). For the comparison of the duration of magnifier use in the diary logs in relation to the rate of temperature increase measured by the beacon sensor, it was necessary to use a transformation of the variable for the rate of temperature increase in order to achieve a more normal distribution for the analyses, as indicated by Box–Cox analysis and tests of the regression residuals. Data were analyzed using Stata/IC version 15.1 (Stata Corp., College Station, TX, USA).
3. Results
Each Beacon was configured to dynamically adjust broadcasting intervals from 2600 ms when static to 500 ms upon detecting motion. The BLE beacon’s broadcasting power was set to −12 dBm, which allows for a range of up to 7 m, using a broadcasting frequency range from 2400 MHz to 2483.5 MHz. The recorded frequency of data collection across all participants was 2.05 s, on average (SD 1.87 s; range 0.5–12 s); however, one subject (#3) had data that were collected less frequently than others (for unknown reasons), and the mean frequency was every 1.14 s (SD 0.64; range 0.5–3 s) when this participant was excluded. This analyzed data only accounted for times that recorded motion of the magnifier was detected, so we only measured beacon transmission frequency during periods of usage by the participant.
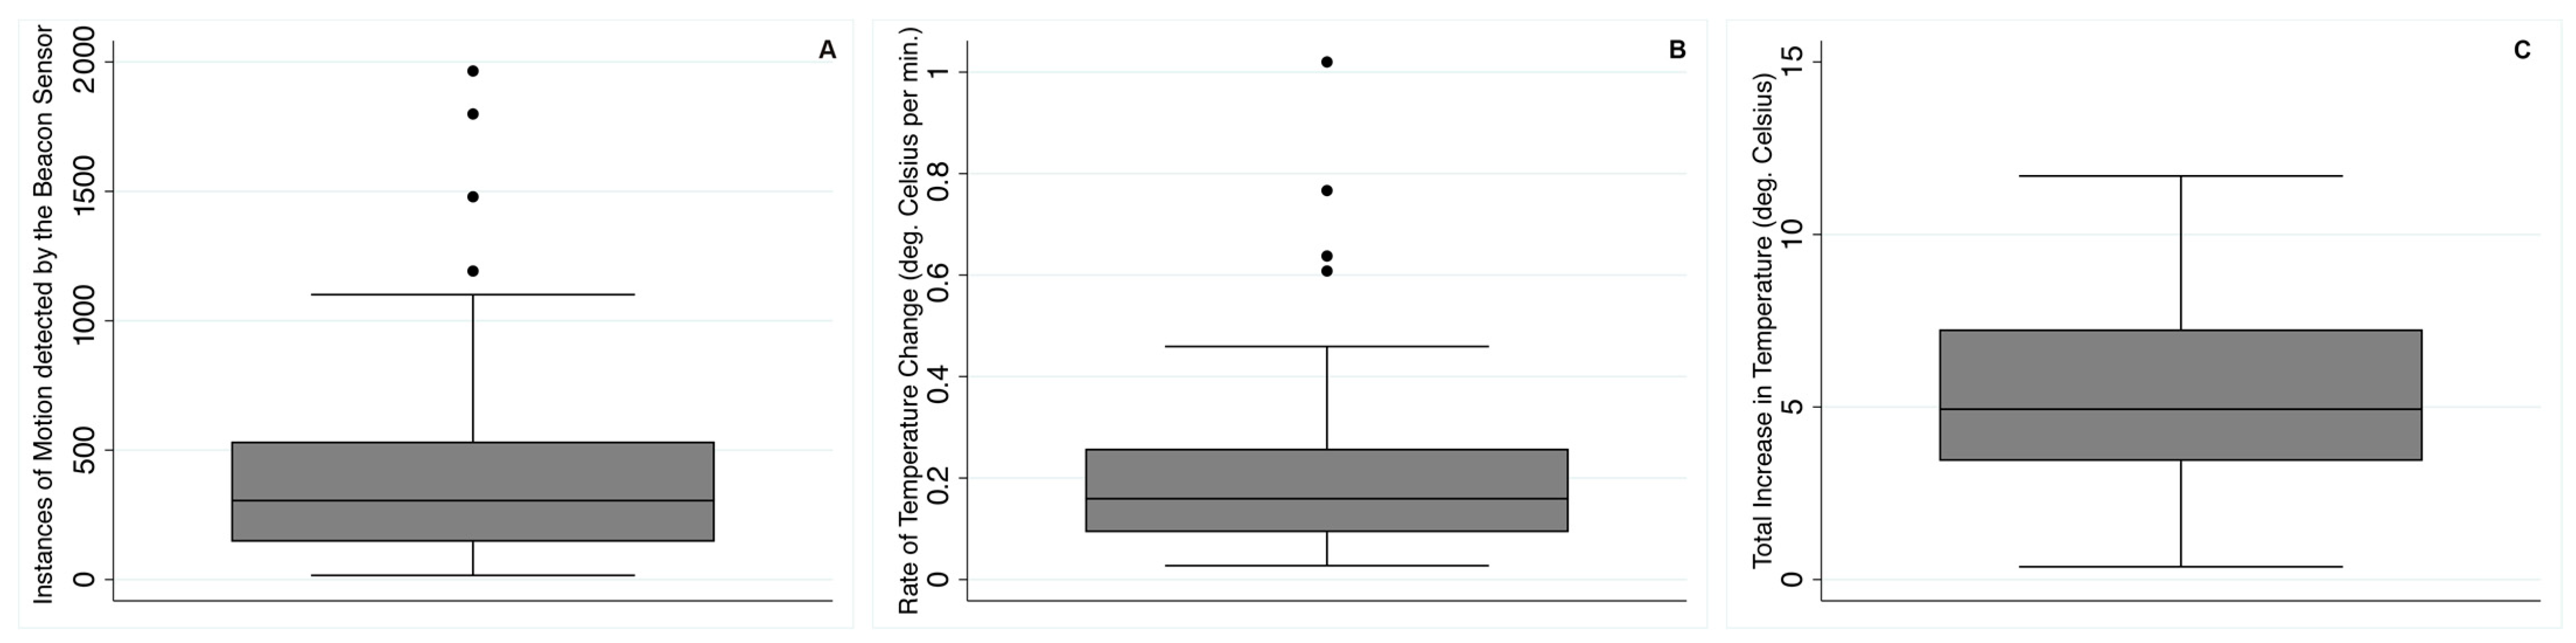
Figure 1 displays representative examples of the results for temperature and motion obtained from the BLE beacon sensor for one time when each participant indicated using their magnifier in the diary log. Note the various patterns of temperature rise according to the duration of magnifier use, as indicated by motion detected by the beacon sensor. Motion appears to be a useful indicator, since all of the 99 self-reports of magnifier use in the diary logs across subjects were associated with a range of 16 to 1965 instances of motion (mean 407 instances of motion; SD 365) detected by the beacon sensor;
Figure 2A shows the distribution of the number of instances of motion per self-reported magnifier use. Across all subjects’ data, the beacon sensors measured rapidly increased temperature (0.20 °C per minute on average; range 0.03–1.02 °C, SD 0.16 °C) when several instances of motion were detected, as shown in
Figure 2B.
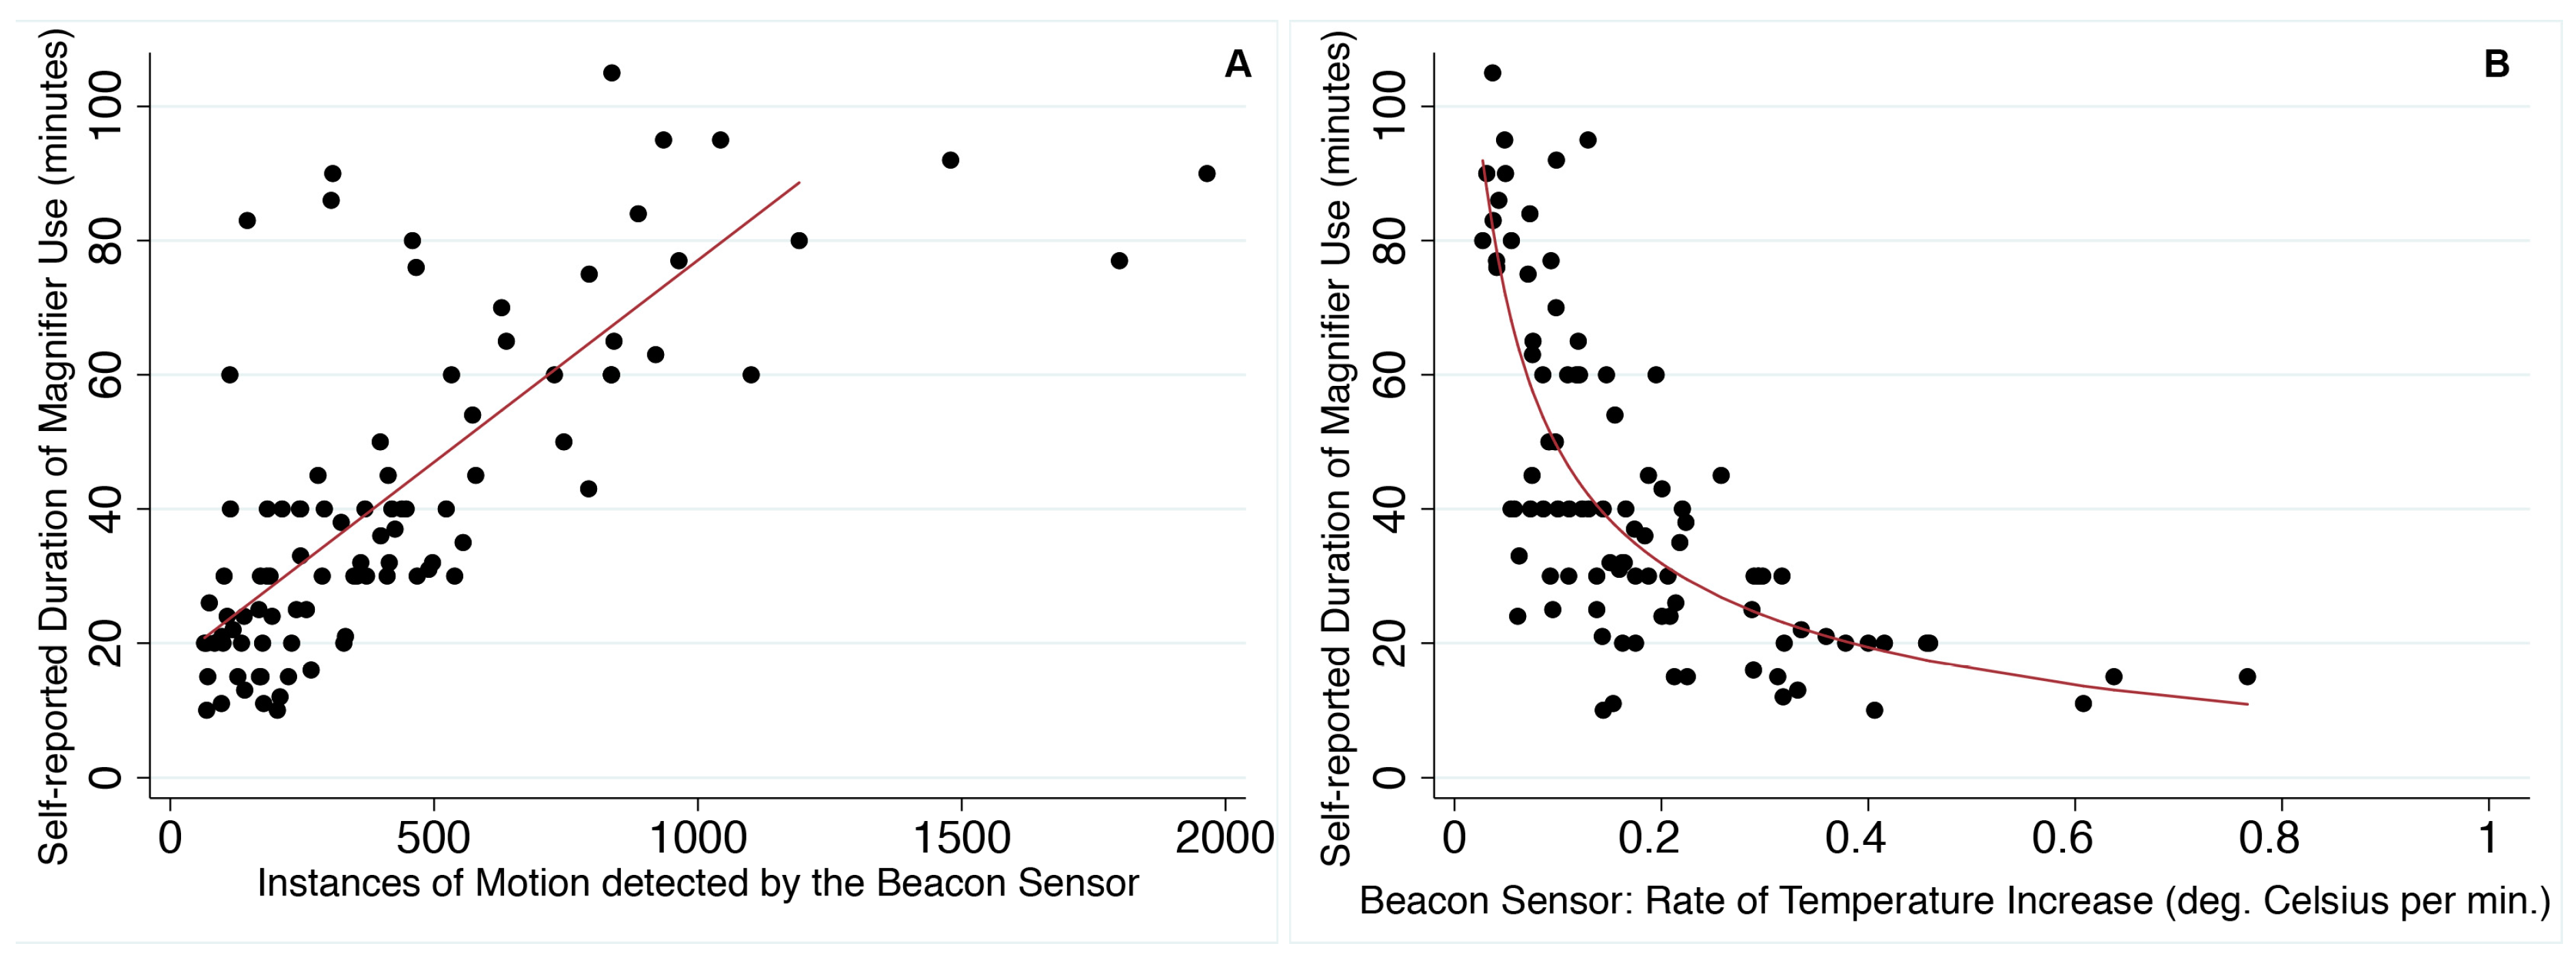
The self-reported duration of magnifier use in the diary logs (mean 42 min; SD 24, range 10–105 min) was significantly correlated with: (1) the number of instances of motion recorded by the beacon sensor (i.e., self-reported magnifier use increased by 4.4 min, on average, for every 100 instances of detected motion; 95% CI: 2.6, 6.1;
p < 0.001;
Figure 3A) and (2) the mean linear rate of temperature increase measured by the sensor (i.e., self-reported magnifier use decreased by 19.0 min, on average, for every 0.1 °C per minute temperature increase when the rate of temperature increase was <0.3 °C per minute; 95% CI: 9.3, 28.6;
p < 0.001;
Figure 3B; although, there was no statistically significant linear relationship with the amount of beacon sensor-recorded motion when the rate of temperature increase was >0.3 °C per minute, displayed in
Figure 3B).
The total magnitude of temperature increase was 5.4 °C, on average, across participants (range 0.4–11.7 °C, SD 2.6 °C) during each period when motion was recorded, as depicted in
Figure 2C. The total magnitude of temperature increase did not vary according to the self-reported duration of magnifier use in the diary (
p = 0.23). The rates of temperature increase during magnifier usage when motion was detected were much greater than the maximum room fluctuations when magnifier use was not reported but due to changes in environmental conditions, e.g., related to indoor heating systems or air conditioning.
4. Discussion
In the present study, beacon sensors reliably detected meaningfully increased temperature coupled with several instances of motion during periods when magnifiers were used at home by low-vision (LV) participants during usual, real-world reading tasks. We collected data for a wide range of durations of magnifier use across older adults with LV. Building upon the results of our preliminary study with BLE beacon sensors on magnifiers used by LV patients in clinics [
14], the present work provides further support for the continued development and evaluation of similar BLE beacon sensors to develop a system to quantify when magnifiers are used at home. We demonstrated the feasibility of remote, continuous, longitudinal data collection. We propose that both temperature and motion data need to be considered jointly, as the magnifier may detect motion but no temperature increase if bumped inadvertently without use, or conversely, temperature might rise without motion if left in direct sunlight.
As anticipated, our data show a significant positive correlation between self-reported duration of magnifier use and the number of instances of motion detected by the beacon sensor (
Figure 3A). We found an inverse relationship between the duration of magnifier use in the diary log and rate of temperature increase recorded by the beacon sensor (
Figure 3B). In part, this may be due to the fact that the peak temperature did not necessarily correspond with the end of the magnifier use period (e.g.,
Figure 1b,c,g,h), as many participants continued to use the magnifier (perhaps intermittently) as the temperature reading declined but the beacon sensor continued to detect motion. Our findings indicate that the fastest temperature rises tended to occur when magnifiers were used for approximately 20 min or less. However, we found a wide range for the rate of temperature increase when magnifiers were used for about 20 min, which might be related to whether the participant’s hand or fingers made direct or indirect contact with the beacon sensor. We did not collect information on direct versus indirect contact with the beacon sensor in this study, but meaningfully increased temperature was measured across all participants, and our previous work indicated that either indirect or direct contact observed in the clinic resulted in increased temperature recorded by the same Estimote sticker BLE beacon sensors [
14]. The graphs for temperature, as recorded by the Estimote BLE beacon sensors in the current study, are similar to graphs we previously published for temperature data collected by BlueMaestro BLE beacon sensors attached to handheld magnifiers used by low-vision patients at home [
14]. The previously studied BlueMaestro BLE beacon sensors did not collect data on motion and only stored a limited amount of data internally, which does not allow for data collection beyond a few days.
Some advantages of our study design were the inclusion of multiple centers in different regions of the U.S. and data collection during different times of the year to help increase generalizability. The ambient room temperature without magnifier use that was recorded by the BLE beacon sensor varied across participants, and yet, the temperature increases were meaningful across all instances when motion was detected. One inherent limitation in the study design involved the participants’ self-reports of the magnifier use in the daily logs, since they varied in precision for the reported start and end times, as some people were exact, to the minute, for each recorded time, whereas others indicated approximate times. However, the diary logs were helpful to support and confirm that they used the magnifier at that time when the beacon sensor recorded significantly increased temperature and several instances of motion.
To increase compliance with maintaining the diary logs, we tried to limit the burden associated with keeping track of magnifier usage by only asking about the date and start and end times for magnifier use. Therefore, we did not ask the participants to record the type of task for which they used the magnifier. Magnifiers are typically utilized for reading tasks [
15], some of which may involve continuous reading, but others can entail intermittent spot reading, possibly combined with some handwriting during the same general time period when the magnifier is used. In our study, it is unknown at which times the magnifiers were used intermittently versus continuously during the time period that was indicated in the diary logs. Future studies could include video recordings of the magnifier usage to distinguish between intermittent versus continuous magnifier use for various types of tasks and then determine relationships with the beacon sensor data for temperature changes and motion. Our data likely contain a variety of magnifier uses, but regardless of whether they were used continuously or sporadically for a task, our data support that both motion and temperature rises occurred in conjunction with magnifier use.
Missing data can occur when the receiving device (i.e., smartphone) is either turned off (or runs out of battery charge) or is out of range of the transmitting device (i.e., BLE beacon sensor). This happens if the two devices are too far away or if there are too many or very dense obstacles in between them. A potential future solution could involve the use of custom development boards that leverage Mesh and LTE cellular capabilities to eliminate the need for BLE robustness while allowing for the customization of data packets and types of sensor data. Future studies should also consider the ergonomics of the placement of the BLE beacon sensor in conjunction with the users’ hands and fingers for comfort and compliance. Additional longitudinal studies in a larger cohort are needed to validate whether BLE beacon sensors can accurately determine when individuals have abandoned their magnifier (i.e., non-usage for an extended period of 1–3 months). In the future, advanced data analysis methods for big data and/or machine learning may be valuable for BLE beacon sensor data in order to distinguish periods of magnifier usage from non-usage. The development of new analytical systems for these data will be important to be able to give alerts to clinical providers if their patients have stopped using their magnifiers over an extended period so that a timely intervention can occur to attempt to remedy any issues, as well as to provide researchers with data on the frequency of magnifier use by study participants to learn more about the longitudinal patterns of magnifier use and their relationship with patient outcomes.
In conclusion, this current work provides further evidence in support of our hypothesis that BLE beacon sensors that detect temperature and motion have the potential to be used as a monitoring system for handheld device usage by individuals at home during usual activities.
5. Patents
US provisional patent application: 62/881,257: Systems and Methods for Determining Magnification Device Usage Using Wireless Beacon Sensors (2019).
Author Contributions
Conceptualization, A.K.B.; Methodology, A.K.B.; Software, N.D.; Validation, A.K.B., M.E. and N.D.; Formal Analysis, A.K.B. and M.E.; Investigation, A.K.B.; Resources, N.D.; Data Curation, A.K.B., M.E. and N.D.; Writing—Original Draft Preparation, A.K.B.; Writing—Review and Editing, M.E. and N.D.; Visualization, A.K.B. and M.E.; Supervision, A.K.B.; Project Administration, A.K.B., M.E. and N.D.; Funding Acquisition, A.K.B. All authors have read and agreed to the published version of the manuscript.
Funding
This research was funded by the National Institutes of Health: NIH R21 EY029883 to A.K.B. and the 2019 American Academy of Optometry Clinical Research Award to A.K.B. This work was also supported by an Unrestricted Grant from Research to Prevent Blindness, Inc. to the Department of Ophthalmology at UCLA.
Institutional Review Board Statement
The study was conducted according to the guidelines of the Declaration of Helsinki and approved by the Institutional Review Board of the University of California Los Angeles (protocol #18-002041 with date of approval: 27 June 2019 and protocol #19-000267 with date of approval: 14 August 2019).
Informed Consent Statement
Informed consent was obtained from all subjects involved in the study.
Data Availability Statement
Collected data are housed within an Amazon Web Services (AWS) database. Exports of collected data, along with mobile app source code, are available in a public Github repository.
Acknowledgments
Robert Dennis provided assistance with technical design and architecture consult. The co-investigators who recruited the study participants and dispensed the beacon sensors were John Kaminski at Mid-Michigan Eye Care in Midland, MI, and John Shepherd and Stacy Thoene at the University of Nebraska Medical Center. UCLA study coordinator Kelly Hofschneider obtained informed consent from the study participants and assisted with project administration related to the study participants. UCLA student research assistants, Tameen Ahmed, Megan Yu, Jewel J. Chu and Sarah Z. Bui, helped with some of the data organization.
Conflicts of Interest
The authors declare no conflict of interest relevant to the topic of this presentation. The sponsors had no role in the design, execution, interpretation, or writing of the study.
References
- Dougherty, B.E.; Kehler, K.B.; Jamara, R.; Patterson, N.; Valenti, D.; Vera-Diaz, F.A. Abandonment of low-vision devices in an outpatient population. Optom. Vis. Sci. 2011, 88, 1283–1287. [Google Scholar] [CrossRef] [PubMed] [Green Version]
- Gobeille, M.R.; Malkin, A.G.; Jamara, R.; Ross, N.C. Utilization and Abandonment of Low Vision Devices Prescribed on a Mobile Clinic. Optom. Vis. Sci. 2018, 95, 859–864. [Google Scholar] [CrossRef]
- Chan, T.L.; Goldstein, J.E.; Massof, R.W. Low Vision Research Network Study Group. Comparison of clinician-predicted to measured low vision outcomes. Optom. Vis. Sci. 2013, 90, 776–787. [Google Scholar]
- Huang, J.; Lentsch, M.J.; Marsack, J.D.; Anderson, H.A. Evaluating the use of a temperature sensor to monitor spectacle compliance in warm versus cold climates. Clin. Exp. Optom. 2019, 102, 147–153. [Google Scholar] [CrossRef] [PubMed]
- Aguilar-Rivera, M.; Erudaitius, D.T.; Wu, V.M.; Tantiongloc, J.C.; Kang, D.Y.; Coleman, T.P.; Baxter, S.L.; Weinreb, R.N. Smart Electronic Eyedrop Bottle for Unobtrusive Monitoring of Glaucoma Medication Adherence. Sensors 2020, 20, 2570. [Google Scholar] [CrossRef] [PubMed]
- Petersen, C.L.; Minor, C.M.; Mohieldin, S.; Park, L.G.; Halter, R.J.; Batsis, J.A. Remote Rehabilitation: A Field-Based Feasibility Study of an mHealth Resistance Exercise Band. In Proceedings of the 2020 IEEE/ACM International Conference on Connected Health: Applications, Systems and Engineering Technologies, Crystal City, VA, USA, 16–18 December 2020; pp. 5–6. [Google Scholar]
- Chen, C.H.; Wang, C.C.; Chen, Y.Z. Intelligent Brushing Monitoring Using a Smart Toothbrush with Recurrent Probabilistic Neural Network. Sensors 2021, 21, 1238. [Google Scholar] [CrossRef] [PubMed]
- Wray, T.; Chan, P.A.; Simpanen, E.; Operario, D. eTEST: Developing a Smart Home HIV Testing Kit that Enables Active, Real-Time Follow-Up and Referral after Testing. JMIR Mhealth Uhealth 2017, 5, e62. [Google Scholar] [CrossRef] [PubMed] [Green Version]
- Aldeer, M.; Javanmard, M.; Martin, R.P. A Review of Medication Adherence Monitoring Technologies. Appl. Syst. Innov. 2018, 1, 14. [Google Scholar] [CrossRef] [Green Version]
- Chan, A.M.; Selvaraj, N.; Ferdosi, N.; Narasimhan, R. Wireless patch sensor for remote monitoring of heart rate, respiration, activity, and falls. In Proceedings of the 2013 35th Annual International Conference of the IEEE Engineering in Medicine and Biology Society (EMBC), Osaka, Japan, 3–7 July 2013; pp. 6115–6118. [Google Scholar]
- Komai, K.; Fujimoto, M.; Arakawa, Y.; Suwa, H.; Kashimoto, Y.; Yasumoto, K. Elderly person monitoring in day care center using Bluetooth Low Energy. In Proceedings of the 2016 10th International Symposium on Medical Information and Communication Technology (ISMICT), Worcester, MA, USA, 20–23 March 2016; pp. 1–5. [Google Scholar]
- Ramezani, R.; Zhang, W.; Xie, Z.; Shen, J.; Elashoff, D.; Roberts, P.; Stanton, A.; Eslami, M.; Wenger, N.; Sarrafzadeh, M.; et al. A Combination of Indoor Localization and Wearable Sensor-Based Physical Activity Recognition to Assess Older Patients Undergoing Subacute Rehabilitation: Baseline Study Results. JMIR Mhealth Uhealth 2019, 7, e14090. [Google Scholar] [CrossRef] [PubMed]
- AL-Madani, B.; Orujov, F.; Maskeliūnas, R.; Damaševičius, R.; Venčkauskas, A. Fuzzy Logic Type-2 Based Wireless Indoor Localization System for Navigation of Visually Impaired People in Buildings. Sensors 2019, 19, 2114. [Google Scholar] [CrossRef] [PubMed] [Green Version]
- Bittner, A.K.; Jacobson, A.J.; Khan, R. Feasibility of Using Bluetooth Low Energy Beacon Sensors to Detect Magnifier Usage by Low Vision Patients. Optom. Vis. Sci. 2018, 95, 844–851. [Google Scholar] [CrossRef] [PubMed]
- Macnamara, A.; Chen, C.S.; Davies, A.; Sloan, C.; Loetscher, T. Low vision devices for age-related macular degeneration: A systematic review. Disabil. Rehabil. Assist. Technol. 2021, 20, 1–13. [Google Scholar] [CrossRef] [PubMed]
| Publisher’s Note: MDPI stays neutral with regard to jurisdictional claims in published maps and institutional affiliations. |
© 2021 by the authors. Licensee MDPI, Basel, Switzerland. This article is an open access article distributed under the terms and conditions of the Creative Commons Attribution (CC BY) license (https://creativecommons.org/licenses/by/4.0/).


