
Situational Awareness: The Effect of Stimulus Type and Hearing Protection on Sound Localization


Abstract
1. Introduction
2. Materials and Methods
2.1. Participants
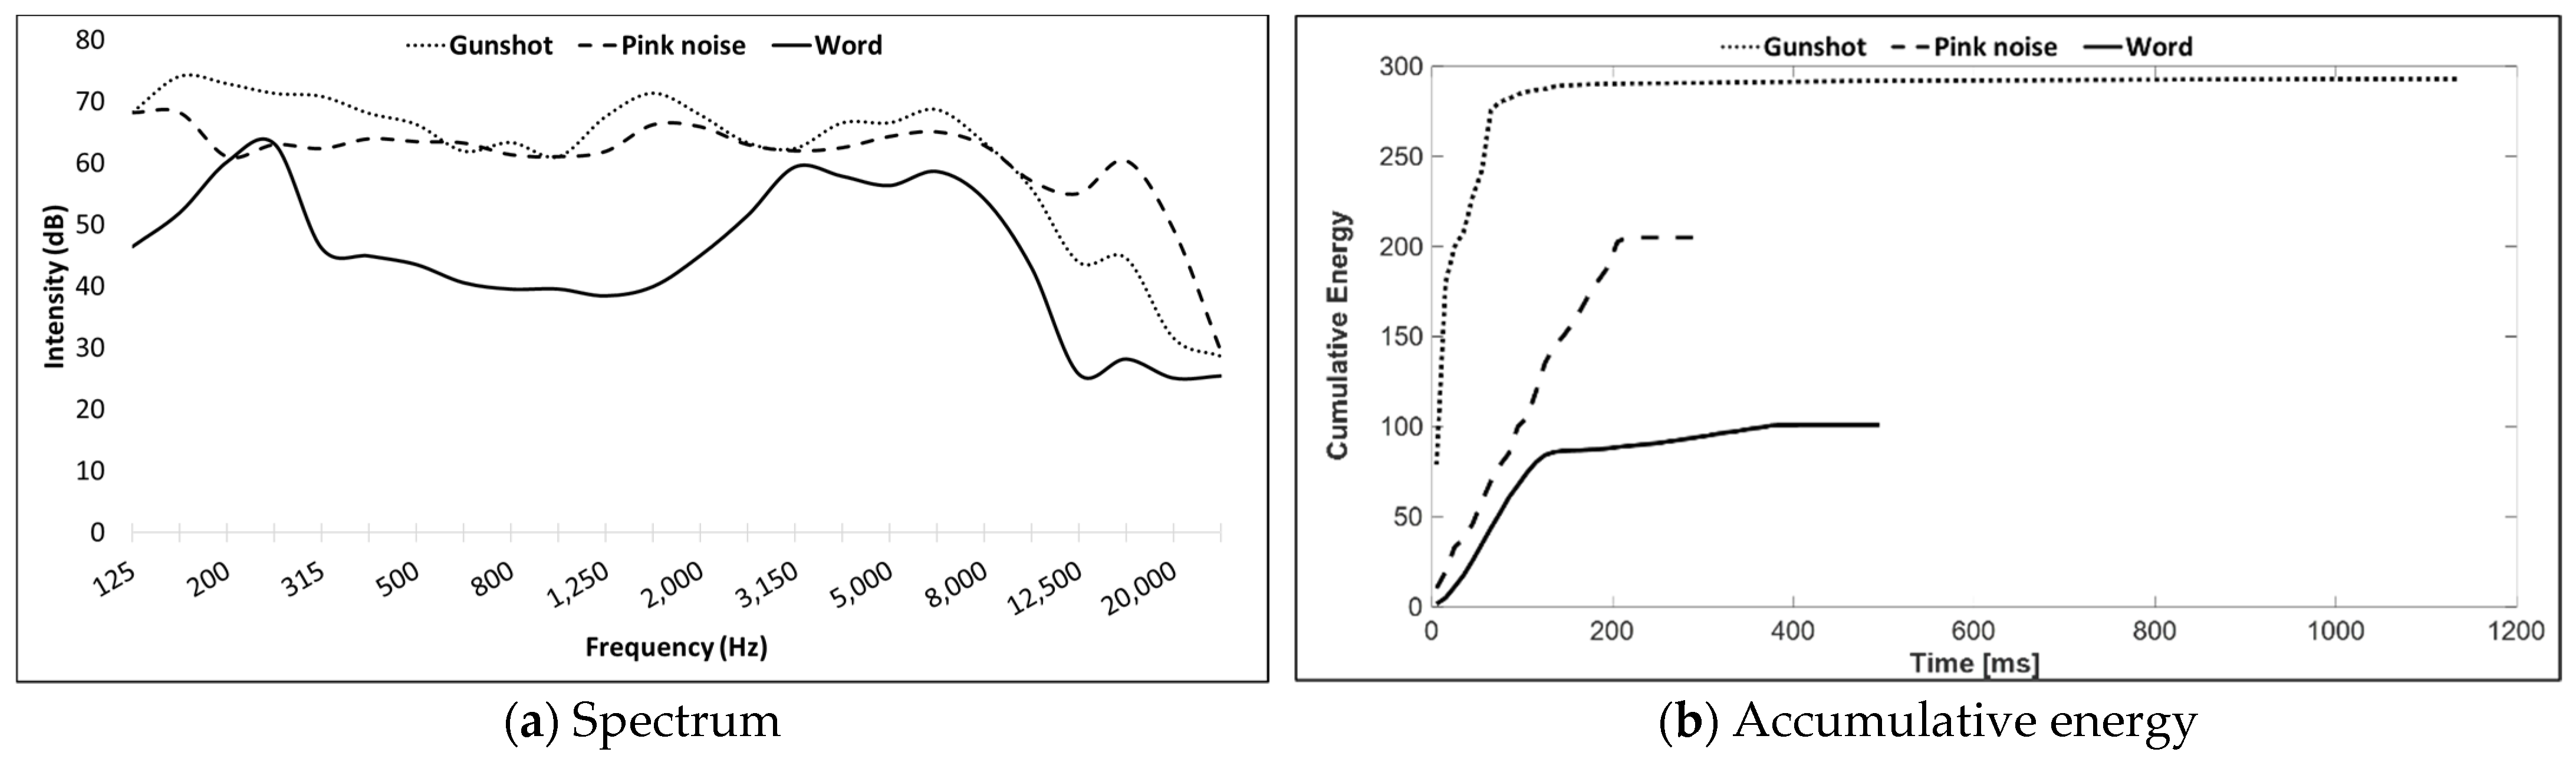
2.2. Stimuli
2.3. Hearing Protection Devices
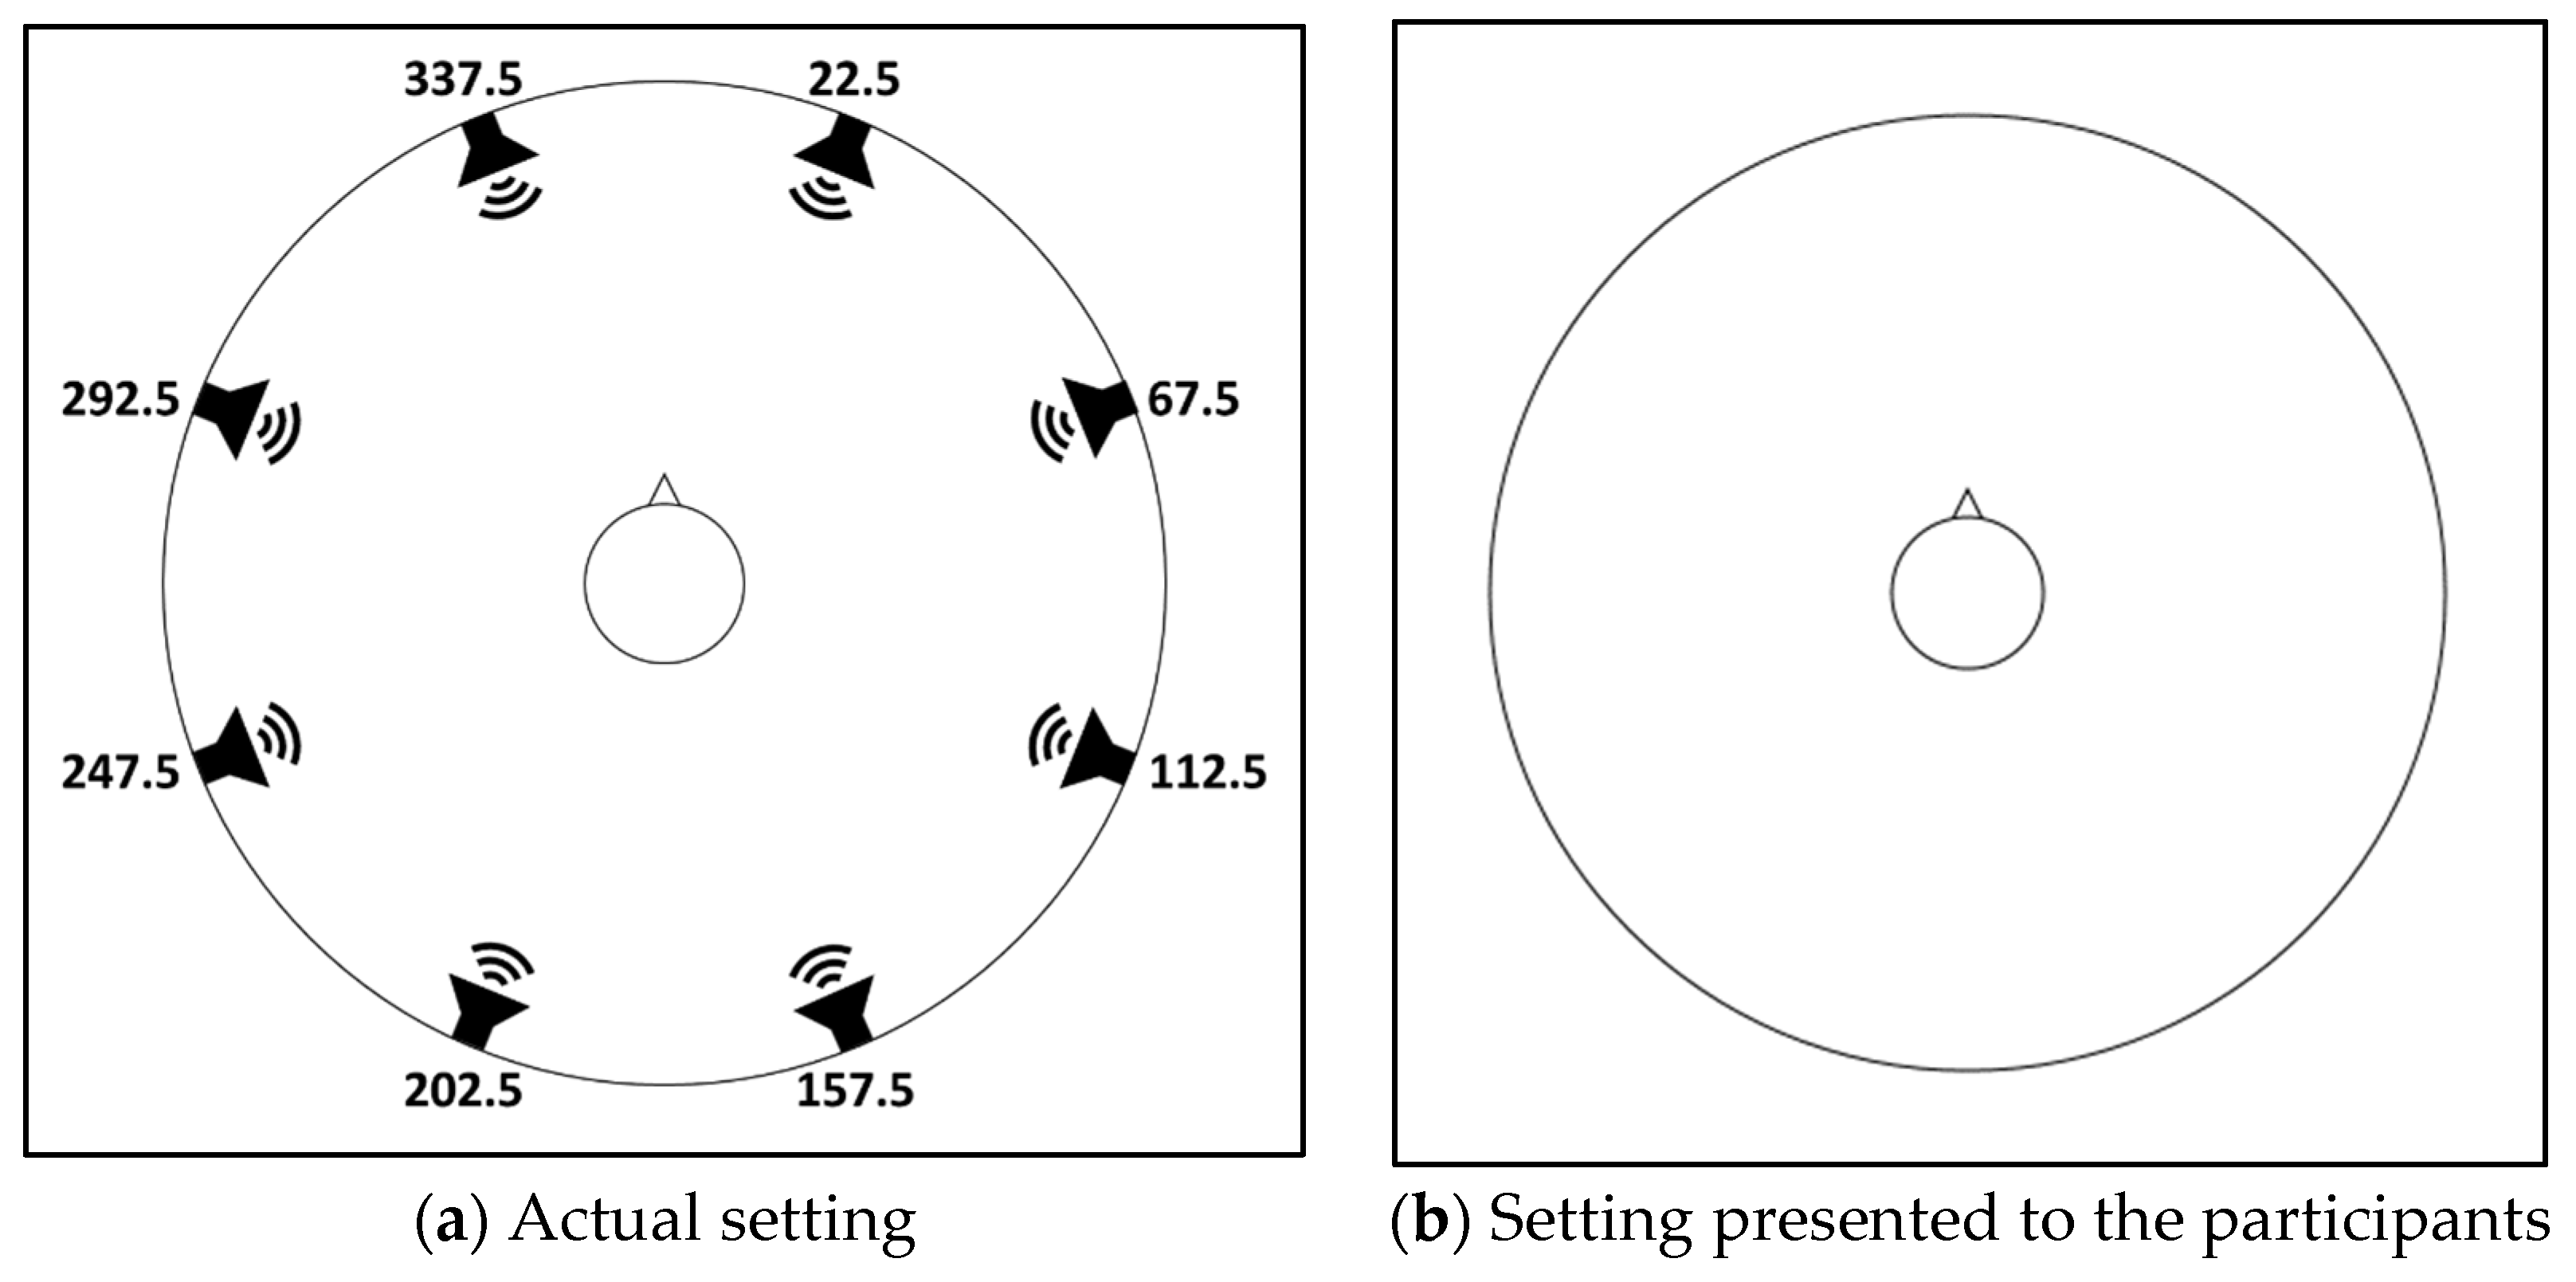
2.4. Apparatus
2.5. Procedure
2.6. Data Analysis
3. Results
3.1. Discrimination Accuracy
3.1.1. No-HPD (Baseline)
3.1.2. With-HPD
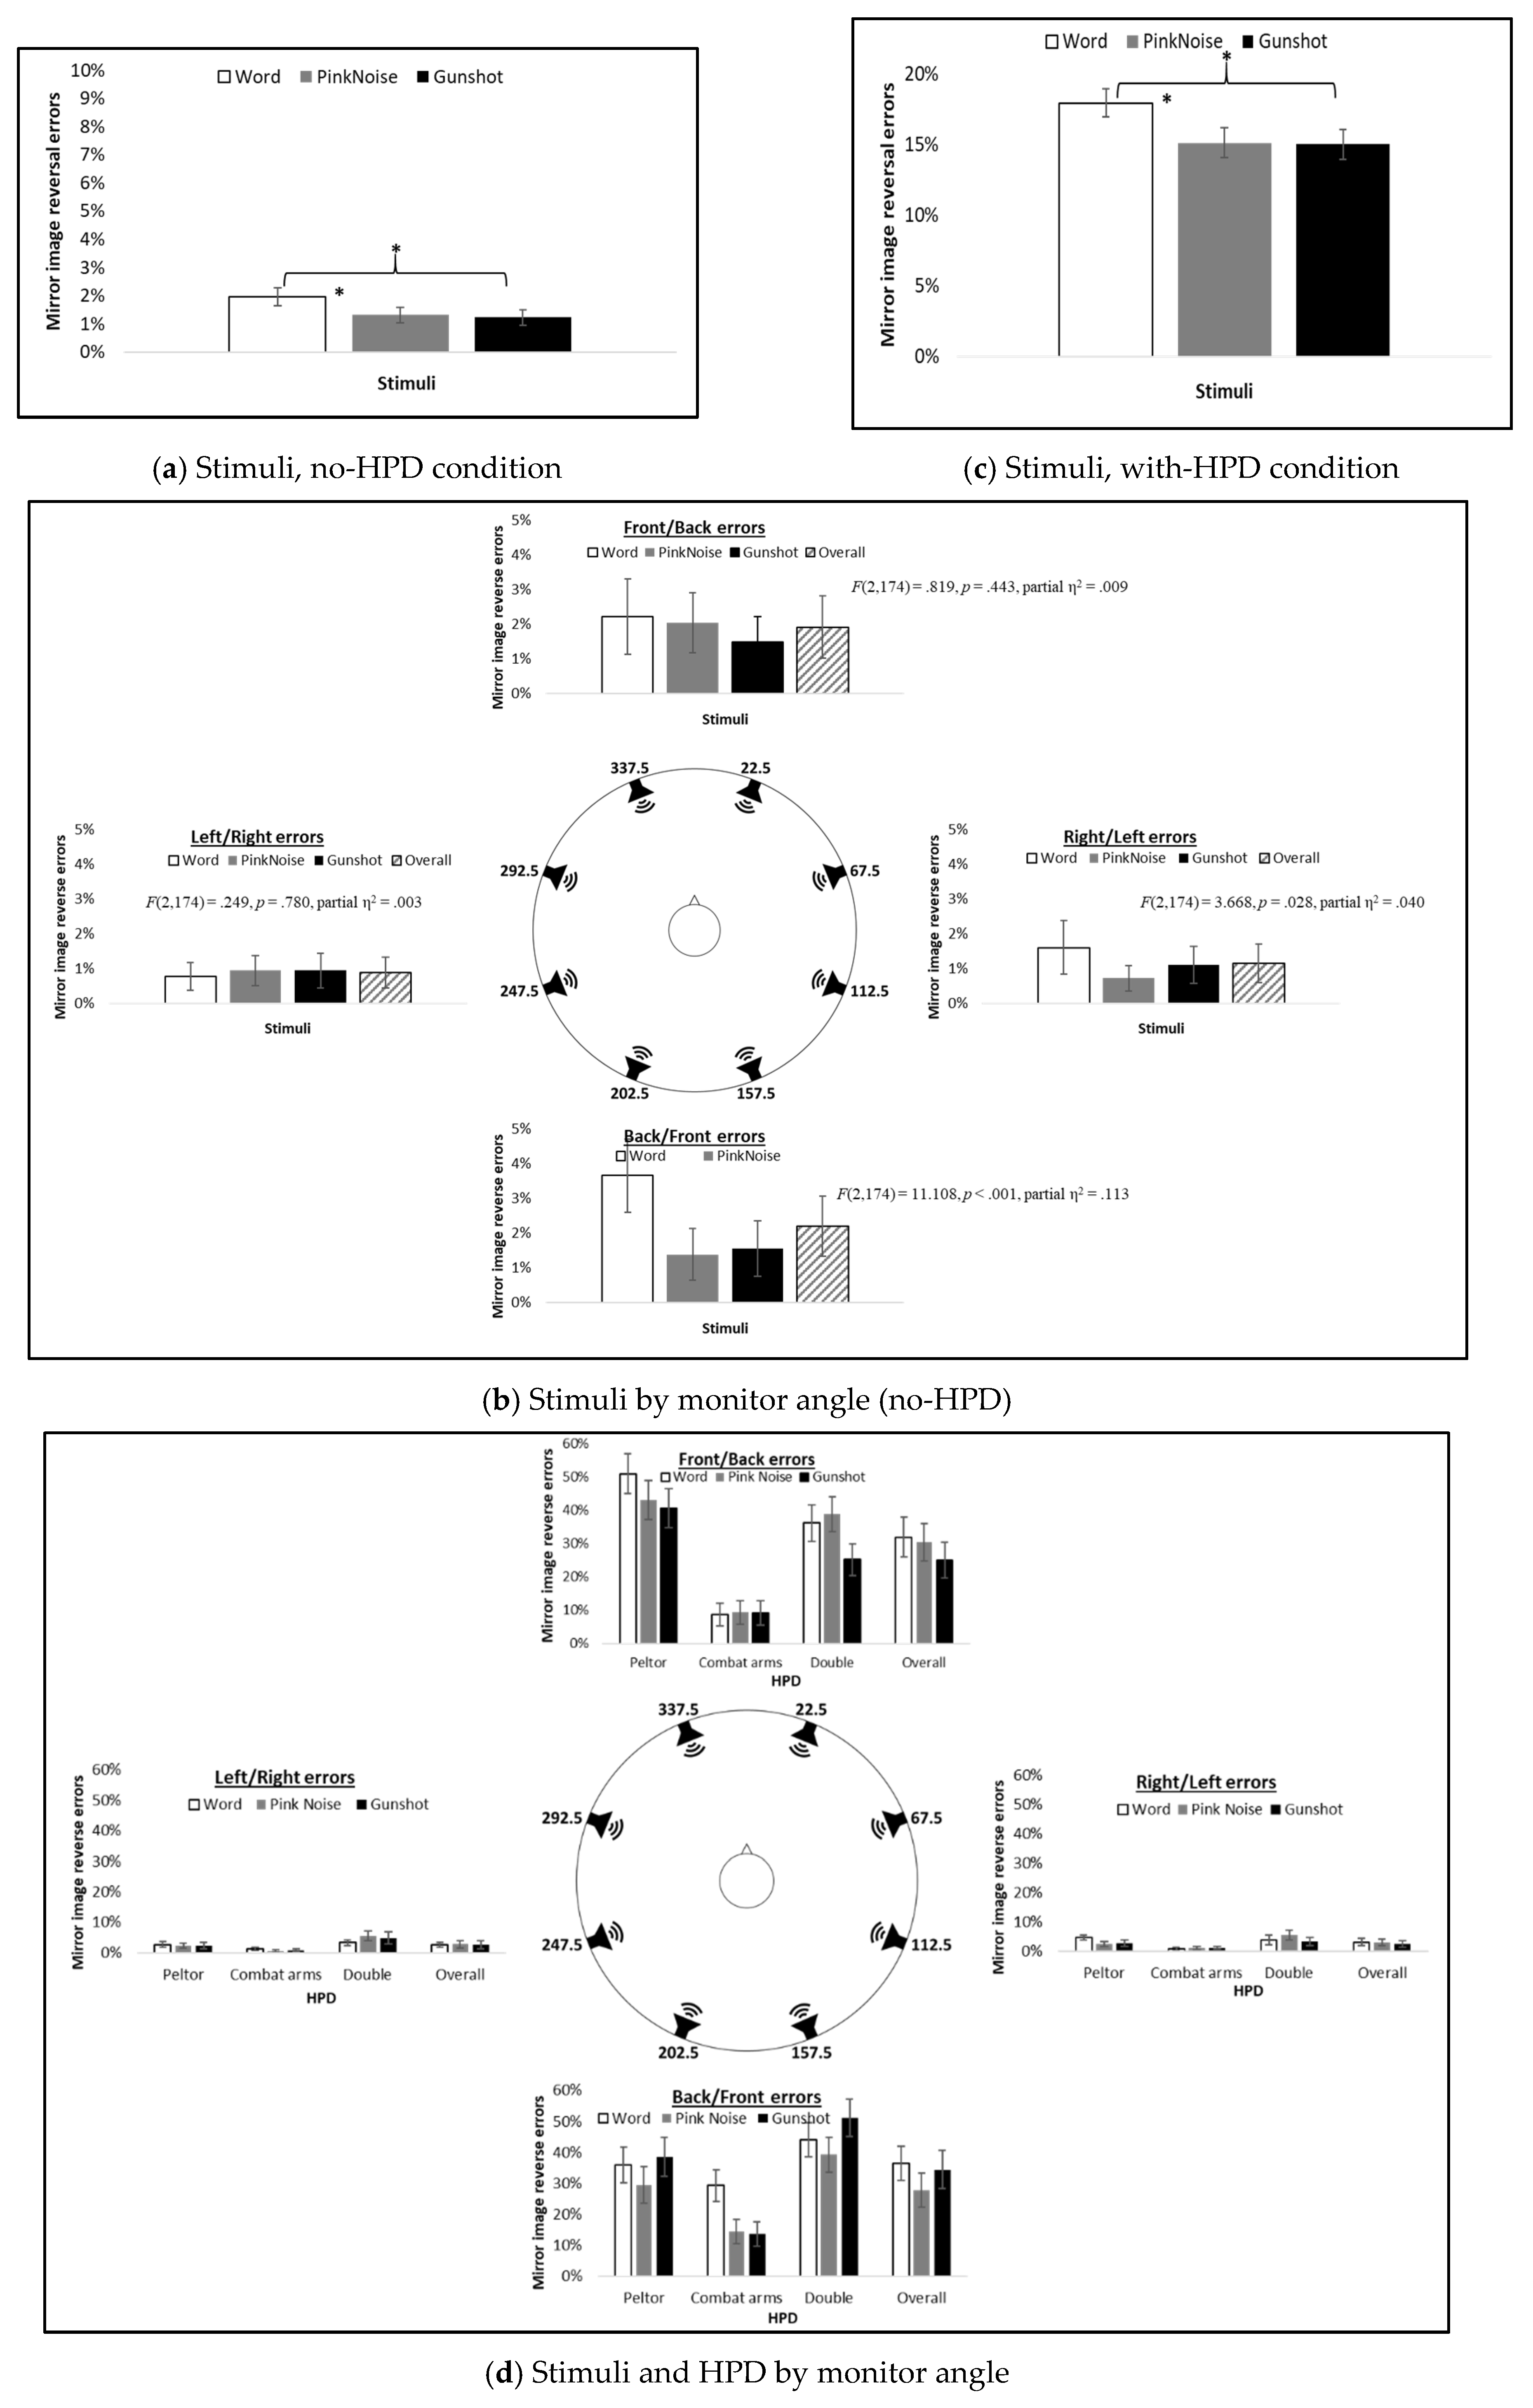
3.2. Mirror Image Reversal Errors
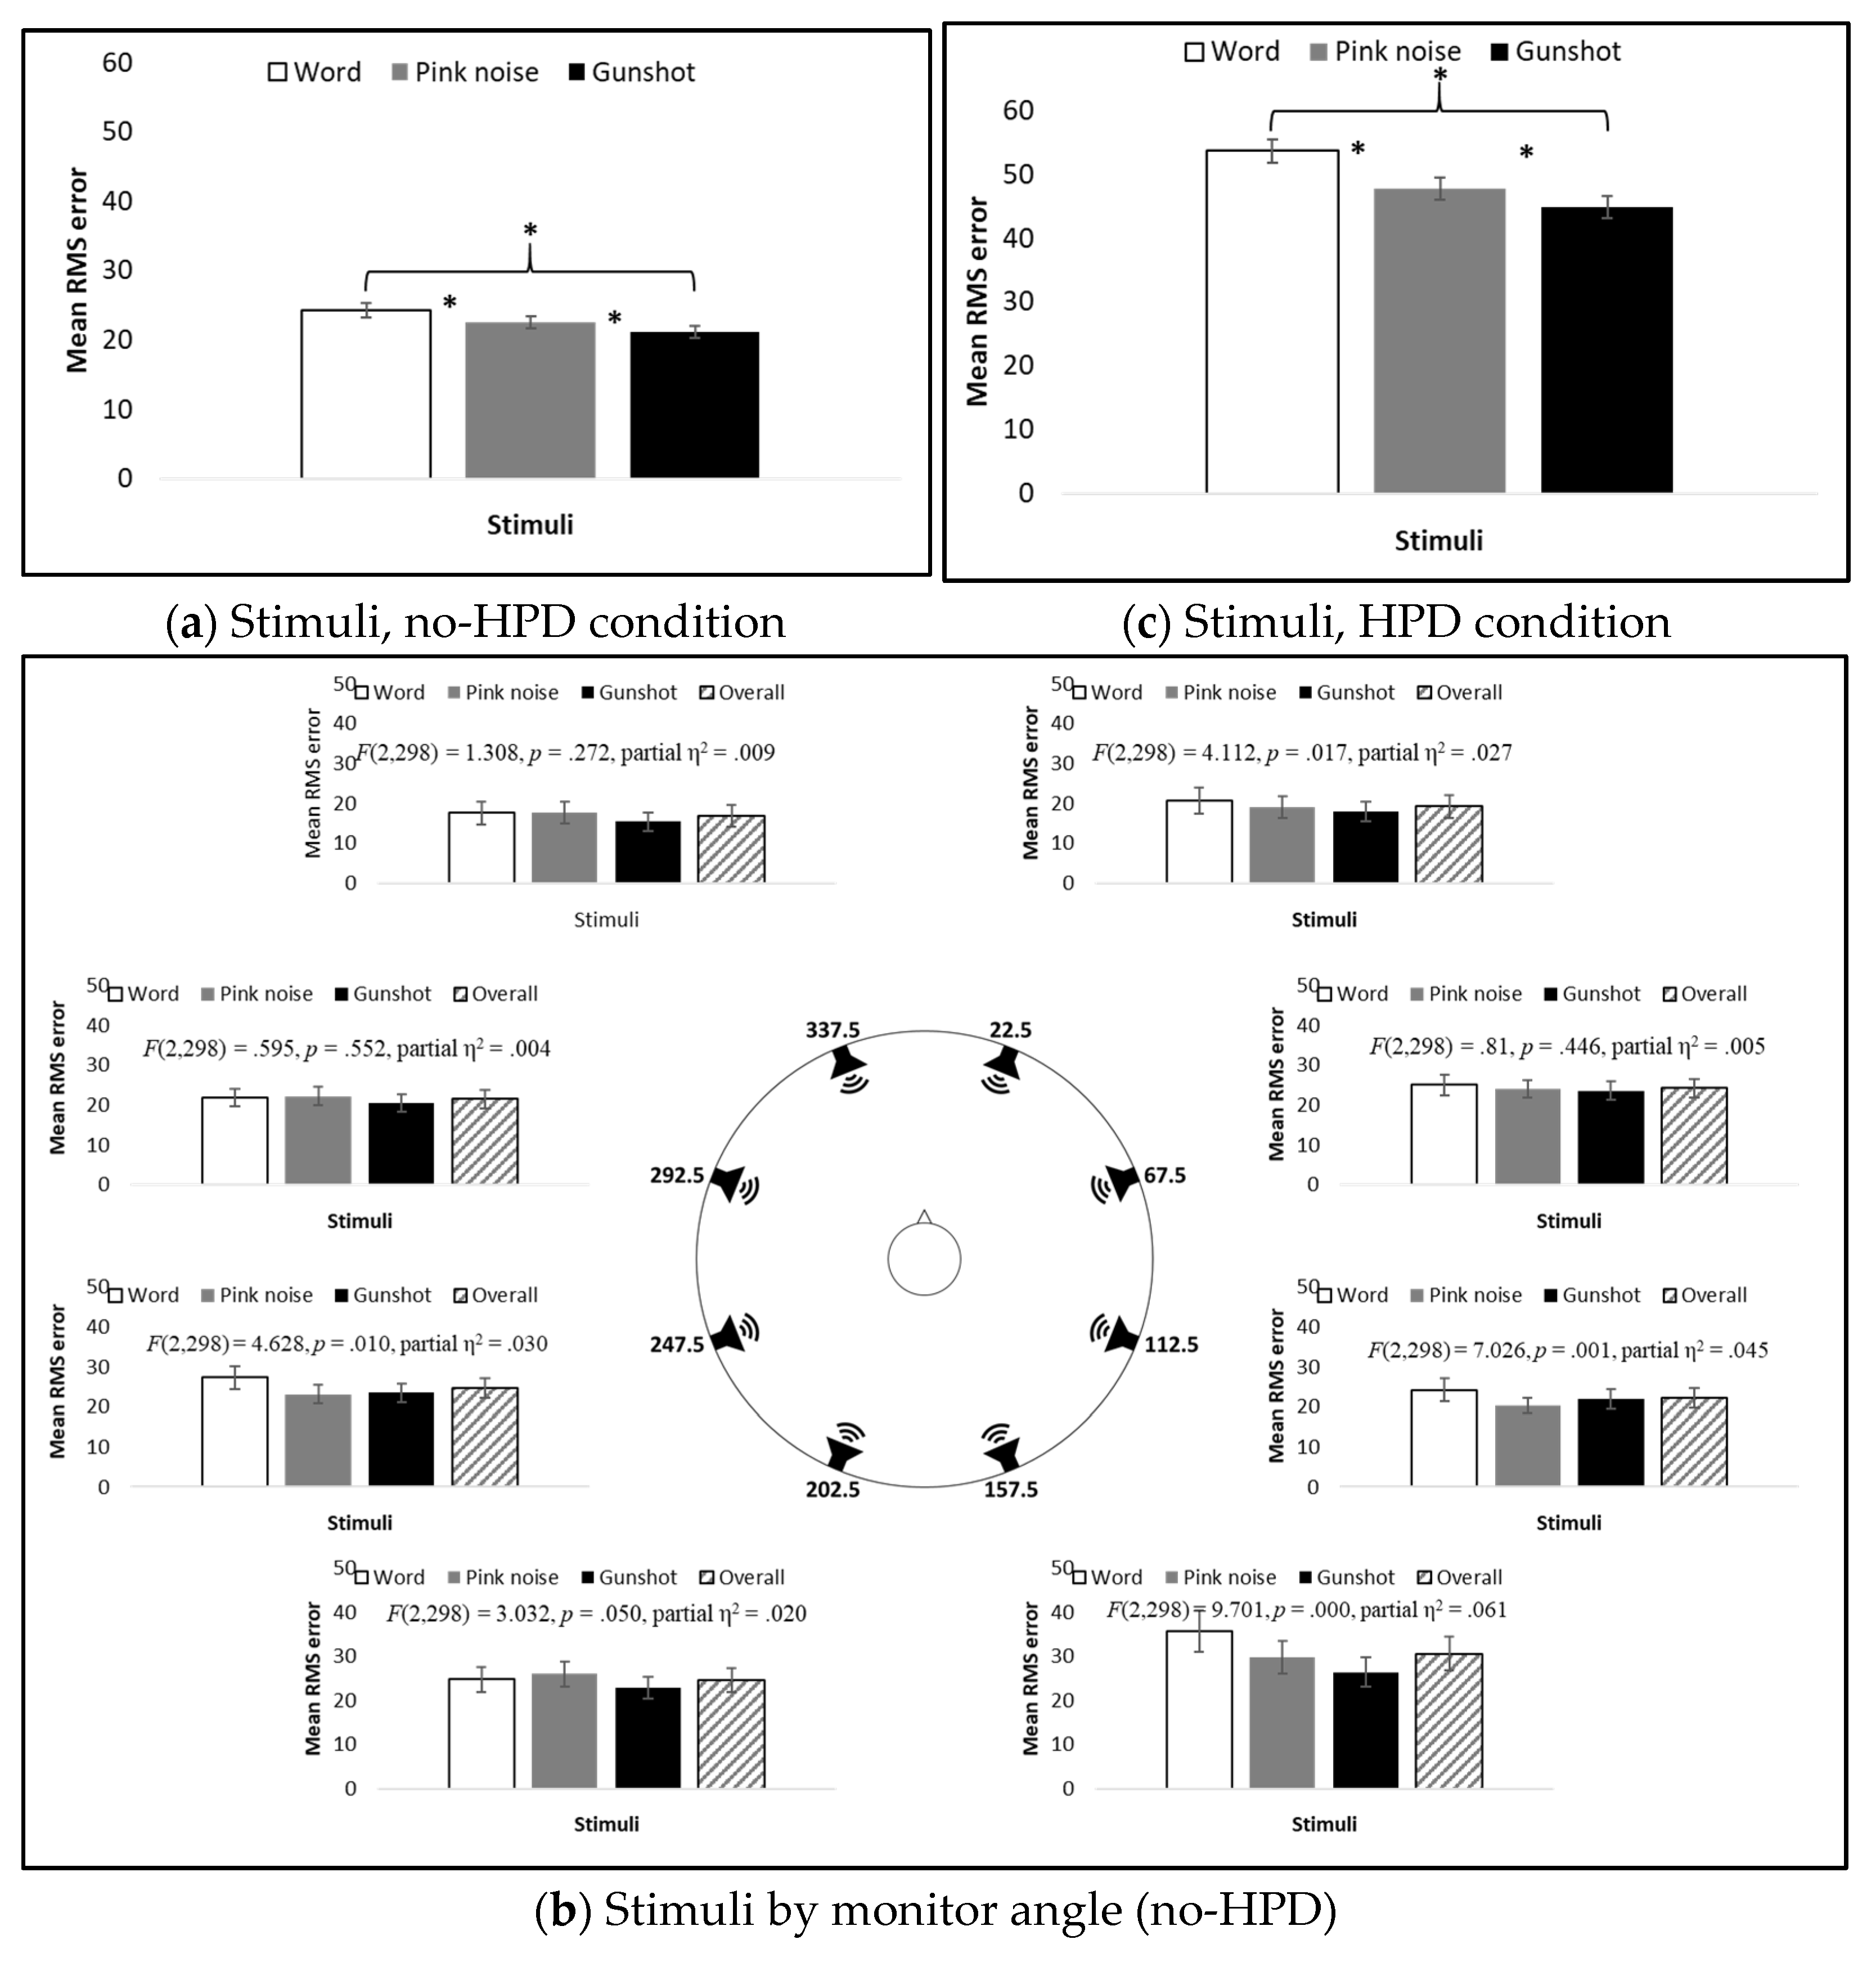
3.2.1. No-HPD (Baseline)
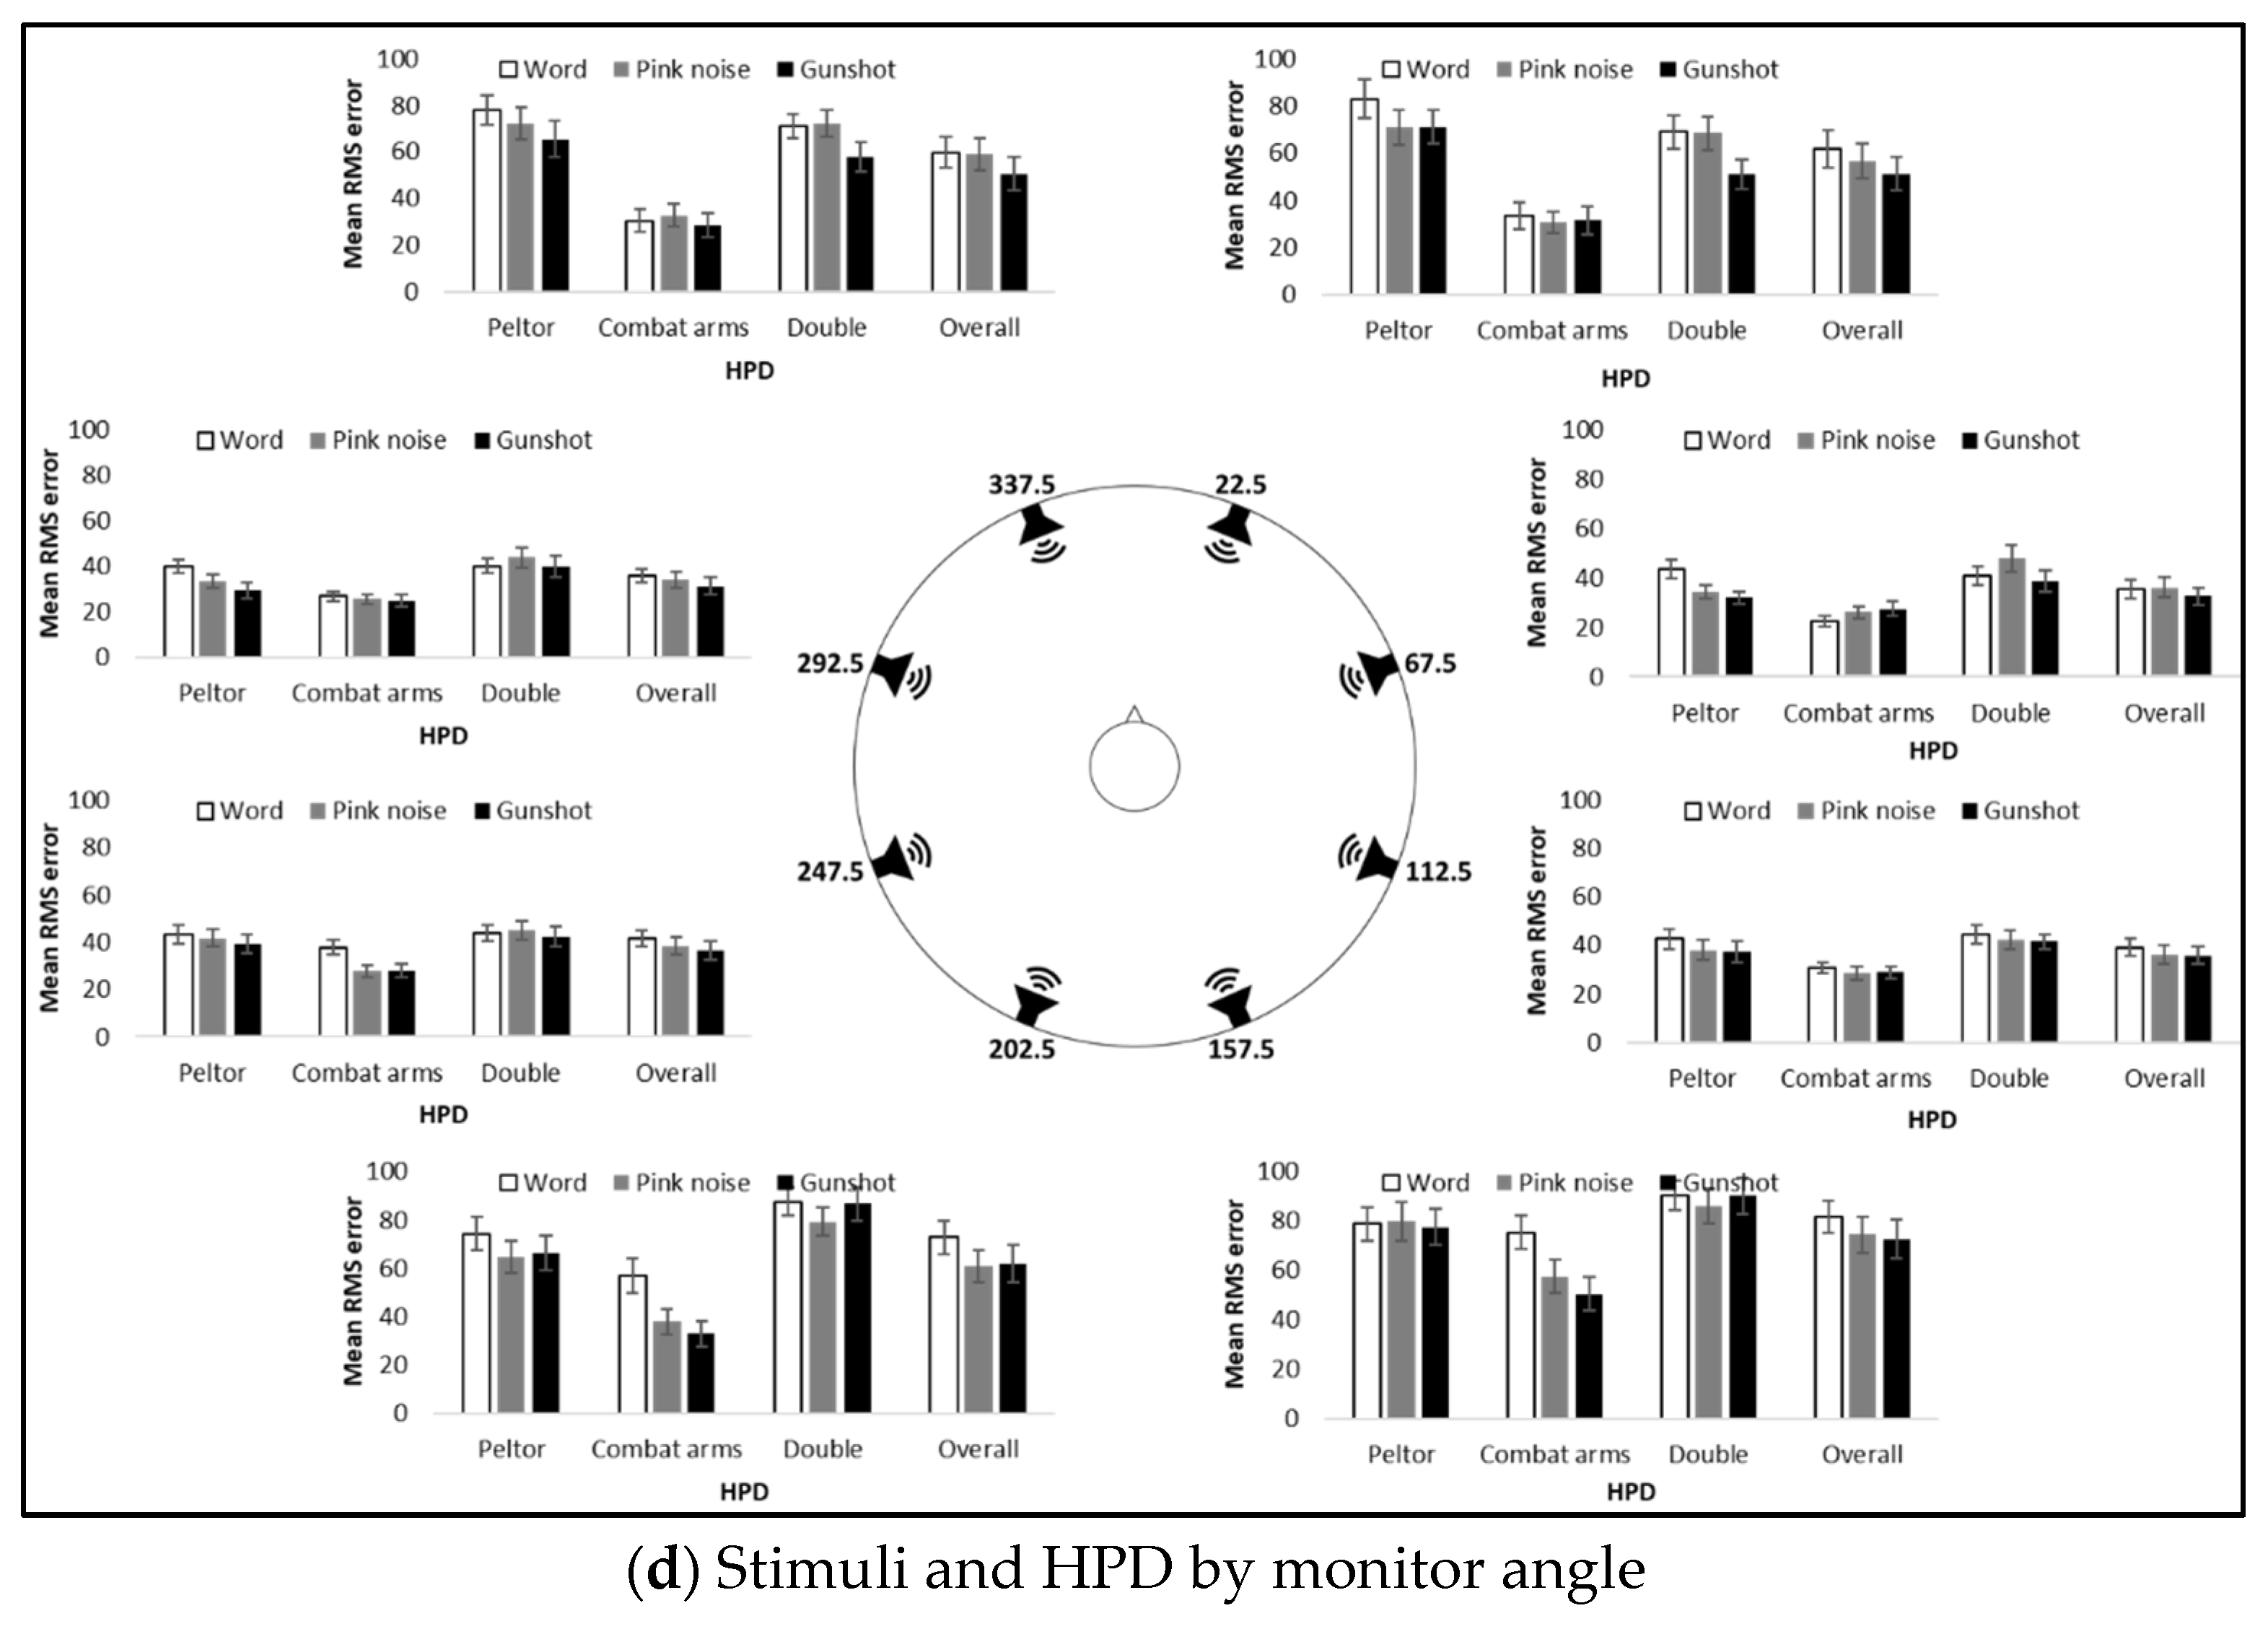
3.2.2. With-HPD
4. Discussion
Author Contributions
Funding
Institutional Review Board Statement
Informed Consent Statement
Data Availability Statement
Acknowledgments
Conflicts of Interest
References
- Gelfand, S.A. Hearing: An Introduction to Psychological and Physiological Acoustics; CRC Press: New York, NY, USA, 2017. [Google Scholar]
- Litovsky, R. Development of the Auditory System. In Handbook of Clinical Neurology; Elsevier: Waltham, MA, USA, 2015; Volume 129, pp. 55–72. [Google Scholar]
- Yost, W.A.; Zhong, X. Sound source localization identification accuracy: Bandwidth dependencies. J. Acoust. Soc. Am. 2014, 136, 2737–2746. [Google Scholar] [CrossRef] [PubMed]
- Noble, W.G.; Russell, G. Theoretical and practical implications of the effects of hearing protection devices on localization ability. Acta Otolaryngol. 1972, 74, 29–36. [Google Scholar] [CrossRef]
- Abel, S.M.; Tsang, S.; Boyne, S. Sound localization with communications headsets: Comparison of passive and active systems. Noise Health 2007, 9, 101–108. [Google Scholar] [CrossRef]
- Abel, S.M.; Boyne, S.; Roesler-Mulroney, H. Sound localization with an army helmet worn in combination with an in-ear advanced communications system. Noise Health 2009, 11, 199–205. [Google Scholar] [CrossRef]
- Borg, E.; Bergkvist, C.; Bagger-Sjöbäck, D. Effect on directional hearing in hunters using amplifying (level dependent) hearing protectors. Otol. Neurotol. 2008, 29, 579–585. [Google Scholar] [CrossRef] [PubMed]
- Brungart, D.S.; Kordik, A.J.; Simpson, B.D.; McKinley, R.L. Auditory localization in the horizontal plane with single and double hearing protection. Aviat. Space Environ. Med. 2003, 74, 937–946. [Google Scholar] [CrossRef]
- Vause, N.L.; Grantham, D.W. Effects of earplugs and protective headgear on auditory localization ability in the horizontal plane. Hum. Factors 1999, 41, 282–294. [Google Scholar] [CrossRef] [PubMed]
- Dorman, M.F.; Natale, S.; Loiselle, L. Speech understanding and sound source localization by cochlear implant listeners using a pinna-effect imitating microphone and an adaptive beamformer. J. Am. Acad. Audiol. 2018, 29, 197–205. [Google Scholar] [CrossRef] [PubMed]
- Jones, H.; Kan, A.; Litovsky, R.Y. Comparing sound localization deficits in bilateral cochlear-implant users and vocoder simulations with normal-hearing listeners. Trends Hear. 2014, 18, 1–16. [Google Scholar] [CrossRef]
- Potts, L.G.; Skinner, M.W.; Litovsky, R.A.; Strube, M.J.; Kuk, F. Recognition and localization of speech by adult cochlear implant recipients wearing a digital hearing aid in the nonimplanted ear (bimodal hearing). J. Am. Acad. Audiol. 2009, 20, 353–373. [Google Scholar] [CrossRef]
- Brown, A.D.; Beemer, B.T.; Greene, N.T.; Argo IV, T.; Meegan, G.D.; Tollin, D.J. Effects of active and passive hearing protection devices on sound source localization, speech recognition, and tone detection. PLoS ONE 2015, 10, e0136568. [Google Scholar] [CrossRef]
- Brungart, D.S.; Kordik, A.J.; Simpson, B.D. The effects of single and double hearing protection on the localization and segregation of spatially-separated speech signals (L). J. Acoust. Soc. Am. 2004, 116, 1897–1900. [Google Scholar] [CrossRef]
- Joubaud, T.; Zimpfer, V.; Garcia, A.; Langrenne, C. Sound localization models as evaluation tools for tactical communication and protective systems. J. Acoust. Soc. Am. 2017, 141, 2637–2649. [Google Scholar] [CrossRef]
- Fink, N.; Pikkel, H.Z.; Eisenkraft, A.; Banta, G.A. Hearing protection devices and methods used for their evaluation: A military perspective. J. Mil. Veteran Fam. Health 2019, 5, 141–147. [Google Scholar] [CrossRef]
- Yost, W.A. Sound source localization identification accuracy: Level and duration dependencies. J. Acoust. Soc. Am. 2016, 140, EL14–EL19. [Google Scholar] [CrossRef] [PubMed]
- Middlebrooks, J.C. Auditory space processing: Here, there or everywhere? Nat. Neurosci. 2002, 5, 824–826. [Google Scholar] [CrossRef] [PubMed]
- Stevens, S.S.; Newman, E.B. The localization of actual sources of sound. Am. J. Psychol. 1936, 48, 297–306. [Google Scholar] [CrossRef]
- Ihlefeld, A.; Shinn-Cunningham, B.G. Effect of source spectrum on sound localization in an everyday reverberant room. J. Acoust. Soc. Am. 2011, 130, 324–333. [Google Scholar] [CrossRef]
- Middlebrooks, J.C. Narrow-band sound localization related to external ear acoustics. J. Acoust. Soc. Am. 1992, 92, 2607–2624. [Google Scholar] [CrossRef]
- Blauert, J. Spatial Hearing: The Psychophysics of Human Sound Localization; MIT Press: Cambridge, MA, USA, 1997. [Google Scholar]
- Chau, W.; Duda, R.O. Combined monaural and binaural localization of sound sources. Proc. Asilomar. 1996, 2, 1281–1285. [Google Scholar]
- Davis, R.J.; Stephens, S.D.G. The effect of intensity on the localization of different acoustical stimuli in the vertical plane. J. Sound Vib. 1974, 35, 223–229. [Google Scholar] [CrossRef]
- Shigeno, S.; Oyama, T. Localization of speech and non-speech sounds. Jpn. Psychol. Res. 1983, 25, 112–117. [Google Scholar] [CrossRef][Green Version]
- Simpson, B.D.; Bolia, R.S.; McKinley, R.L.; Brungart, D.S. The impact of hearing protection on sound localization and orienting behavior. Hum. Factors 2005, 47, 188–198. [Google Scholar] [CrossRef] [PubMed]
- Dobreva, M.S.; O’Neill, W.E.; Paige, G.D. Influence of aging on human sound localization. J. Neurophysiol. 2011, 105, 2471–2486. [Google Scholar] [CrossRef]
- Gordon, M.S.; Russo, F.A.; MacDonald, E. Spectral information for detection of acoustic time to arrival. Atten. Percept. Psychophys. 2013, 75, 738–750. [Google Scholar] [CrossRef]
- Rychtáriková, M.; Chmelik, V.; Roozen, N.B.; Glorieux, C. Front–back localization in simulated rectangular rooms. Appl. Acoust. 2015, 90, 143–152. [Google Scholar] [CrossRef]
- Yost, W.A.; Loiselle, L.; Dorman, M.; Burns, J.; Brown, C.A. Sound source localization of filtered noises by listeners with normal hearing: A statistical analysis. J. Acoust. Soc. Am. 2013, 133, 2876–2882. [Google Scholar] [CrossRef] [PubMed]
- Abel, S.; Burrell, C.; Saunders, D. The Effects of Integrated Hearing Protection Surround Levels on Sound Localization, Scientific Report; DRDC-RDDC2015-R012; Defense Research and Development Canada: Ottawa, ON, Canada, 2015.
- Alali, K.; Casali, J.G. Auditory backup alarms: Distance-at-first-detection via in-situ experimentation on alarm design and hearing protection effects. Work 2012, 41 (Suppl. 1), 3599–3607. [Google Scholar] [CrossRef]
- Lee, K.; Casali, J.G. Development of an auditory situation awareness test battery for advanced hearing protectors and TCAPS: Detection subtest of DRILCOM (detection-recognition/identification-localization-communication). Int. J. Audiol. 2017, 56 (Suppl. 1), 22–33. [Google Scholar] [CrossRef]
- Talcott, K.A.; Casali, J.G.; Keady, J.P.; Killion, M.C. Azimuthal auditory localization of gunshots in a realistic field environment: Effects of open-ear versus hearing protection-enhancement devices (HPEDs), military vehicle noise, and hearing impairment. Int. J. Audiol. 2012, 51 (Suppl. 1), S20–S30. [Google Scholar] [CrossRef]
- Sintonizar Productions and TheWhiteKnuckleFilms. Real life Gunshot Sound Effects. Gunshot Sound Effect. ASMR. YouTube. Available online: https://www.youtube.com/watch?v=1N_m3tsPyP0 (accessed on 10 October 2021).
- Middlebrooks, J.C. Individual differences in external-ear transfer functions reduced by scaling in frequency. J. Acoust. Soc. Am. 1999, 106, 1480–1492. [Google Scholar] [CrossRef] [PubMed]
- Laroche, C.; Giguère, C.; Vaillancourt, V.; Marleau, C.; Cadieux, M.F.; Laprise-Girard, K.; Gula, E.; Carroll, V.; Bibeau, M.; Nélisse, H. Effect of hearing and head protection on the localization of tonal and broadband reverse alarms. Hum. Factors 2021. [Google Scholar] [CrossRef] [PubMed]
- Derey, K.; Rauschecker, J.P.; Formisano, E.; Valente, G.; de Gelder, B. Localization of complex sounds is modulated by behavioral relevance and sound category. J. Acoust. Soc. Am. 2017, 142, 1757–1773. [Google Scholar] [CrossRef] [PubMed]
- Yost, W.A. Sound source localization identification accuracy: Envelope dependencies. J. Acoust. Soc. Am. 2017, 142, 173–185. [Google Scholar] [CrossRef]
- Yehudai, N.; Fink, N.; Shpriz, M.; Marom, T. Acute acoustic trauma among soldiers during an intense combat. J. Am. Acad. Audiol. 2017, 28, 436–443. [Google Scholar] [CrossRef] [PubMed]


| Combat Arms™ 4.1 | Peltor™ H515FB | Double Protection | ||||||||
|---|---|---|---|---|---|---|---|---|---|---|
| Word vs. Pink Noise | Word vs. Gunshot | Pink Noise vs. Gunshot | Word vs. Pink Noise | Word vs. Gunshot | Pink Noise vs. Gunshot | Word vs. Pink Noise | Word vs. Gunshot | Pink Noise vs. Gunshot | ||
| Back | 157.5° | 17.744 | 24.854 | 7.110 | −1.125 | 1.124 | 2.249 | 4.636 | 0.418 | −4.219 |
| Right | 112.5° | 2.108 | 1.834 | −0.274 | 4.634 | 5.376 | 0.742 | 2.147 | 2.815 | 0.668 |
| 67.5° | −3.403 | −4.789 | −1.386 | 9.263 | 11.597 | 2.334 | −7.114 | 2.182 | 9.297 | |
| Front | 22.5° | 2.962 | 2.063 | −0.899 | 12.268 | 12.115 | −0.153 | 0.538 | 17.849 | 17.312 |
| 337.5° | −2.300 | 1.817 | 4.117 | 5.659 | 12.485 | 6.826 | −1.102 | 13.360 | 14.462 | |
| Left | 292.5° | 1.400 | 2.282 | 0.882 | 6.486 | 10.542 | 4.055 | −3.730 | −0.010 | 3.720 |
| 247.5° | 9.916 | 10.089 | 0.173 | 1.456 | 4.119 | 2.662 | −1.316 | 1.340 | 2.656 | |
| Back | 202.5° | 18.819 | 23.774 | 4.955 | 9.445 | 7.831 | −1.614 | 8.445 | 0.983 | −7.462 |

| (a) no-HPD | ||||
| L/R | F/B | B/F | R/L | |
| Word vs. pink noise 1 | −0.002 | 0.002 | 0.023 | 0.009 |
| Word vs. gunshot 1 | −0.002 | 0.007 | 0.021 | 0.005 |
| Pink noise vs. gunshot 1 | −0.001 | 0.006 | −0.002 | −0.004 |
| (b) with-HPD | ||||
| L/R | F/B | B/F | R/L | |
| Peltor™2 | 0.027, 0.001 | 4.234, 0.127 | 3.830, 0.117 | 0.514, 0.017 |
| Word vs. pink noise 1 | 0.001 | 0.080 | 0.065 | 0.008 |
| Word vs. gunshot 1 | 0.001 | 0.103 | −0.027 | 0.006 |
| Pink noise vs. gunshot 1 | 0.007 | 0.023 | −0.092 | −0.002 |
| Combat Arms™ 2 | 0.635, 0.021 | 0.099, 0.003 | 11.387, 0.282 | 0.125, 0.004 |
| Word vs. pink noise 1 | 0.003 | −0.007 | 0.148 | 0.000 |
| Word vs. gunshot 1 | 0.002 | −0.005 | 0.157 | −0.002 |
| Pink noise vs. gunshot 1 | −0.002 | 0.002 | 0.008 | −0.002 |
| Double protection 2 | 0.329, 0.011 | 6.415, 0.181 | 4.258, 0.128 | 3.083, 0.096 |
| Word vs. pink noise 1 | −0.009 | −0.027 | 0.047 | −0.013 |
| Word vs. gunshot 1 | −0.003 | 0.110 | −0.072 | 0.009 |
| Pink noise vs. gunshot 1 | 0.007 | 0.137 | −0.118 | 0.022 |
Publisher’s Note: MDPI stays neutral with regard to jurisdictional claims in published maps and institutional affiliations. |
© 2021 by the authors. Licensee MDPI, Basel, Switzerland. This article is an open access article distributed under the terms and conditions of the Creative Commons Attribution (CC BY) license (https://creativecommons.org/licenses/by/4.0/).
Share and Cite
Fostick, L.; Fink, N. Situational Awareness: The Effect of Stimulus Type and Hearing Protection on Sound Localization. Sensors 2021, 21, 7044. https://doi.org/10.3390/s21217044
Fostick L, Fink N. Situational Awareness: The Effect of Stimulus Type and Hearing Protection on Sound Localization. Sensors. 2021; 21(21):7044. https://doi.org/10.3390/s21217044
Chicago/Turabian StyleFostick, Leah, and Nir Fink. 2021. "Situational Awareness: The Effect of Stimulus Type and Hearing Protection on Sound Localization" Sensors 21, no. 21: 7044. https://doi.org/10.3390/s21217044
APA StyleFostick, L., & Fink, N. (2021). Situational Awareness: The Effect of Stimulus Type and Hearing Protection on Sound Localization. Sensors, 21(21), 7044. https://doi.org/10.3390/s21217044