Article

Discrete Convolution-Based Energy Spectrum Configuring Method for the Analysis of the Intrinsic Radiation of 176Lu

1
Department of Nuclear and Quantum Engineering, Korea Advanced Institute of Science and Technology, Daejeon 34141, Korea
2
Department of Nuclear Engineering, Khalifa University of Science Technology and Research, Abu Dhabi P.O. Box 127788, United Arab Emirates
*
Author to whom correspondence should be addressed.
Sensors 2021, 21(21), 7040; https://doi.org/10.3390/s21217040
Submission received: 25 August 2021 / Revised: 15 October 2021 / Accepted: 21 October 2021 / Published: 23 October 2021

Abstract

:
There has been considerable interest in inorganic scintillators based on lutetium due to their favorable physical properties. Despite their advantages, lutetium-based scintillators could face issues because of the natural occurring radioisotope of 176Lu that is contained in natural lutetium. In order to mitigate its potential shortcomings, previous works have studied to understand the energy spectrum of the intrinsic radiation of 176Lu (IRL). However, few studies have focused on the various principal types of photon interactions with matter; in other words, only the full-energy peak according to the photoelectric effect or internal conversion have been considered for understanding the energy spectrum of IRL. Thus, the approach we have used in this study considers other principal types of photon interactions by convoluting each energy spectrum with combinations for generating the spectrum of the intrinsic radiation of 176Lu. From the results, we confirm that the method provides good agreement with the experiment. A significant contribution of this study is the provision of a new approach to process energy spectra induced by mutually independent radiation interactions as a single spectrum.

1. Introduction

There has been considerable interest in inorganic scintillators based on lutetium, such as lutetium oxyorthosilicate (LSO) and lutetium yttrium oxyorthosilicate (LYSO), for use in positron emission tomography (PET) due to their favorable physical properties including high detection efficiency (≈0.86 cm−1, linear attenuation coefficient at 511 keV), fast decay time (≈40 ns), and high light yield (≈80% NaI (Tl)) [1,2]. Despite their advantages, lutetium-based scintillators could face issues in single transmission measurement, low sensitivity imaging, and wide energy window-scanning because of the natural occurring radioisotope of 176Lu that is contained in natural lutetium [3,4,5]. As shown in Figure 1, 176Lu undergoes decay and emits a beta particle with a mean and maximum energy of 182 and 593 keV, and a cascade of gamma rays or internal conversion electrons with energies of 307, 202, and 88 keV [6]. The intrinsic radiation of 176Lu (IRL) could create background noise in apparatuses as a uniformly distributed radiation source in scintillation crystals.
Although the effects of IRL on medical imaging have been studied, they have not been a major concern in common in-vivo situations because the activity is negligibly low compared to the radiopharmaceuticals and the nuclear medicine scanners have background rejection capabilities, such as coincidence-timing windows and energy windows [7,8,9]. However, when used in preclinical PET, in-beam PET, the PET/SPECT system, and cell-trafficking studies under the aforementioned special conditions, these effects become problematic. The approach to the considered issue is not straightforward because of the poor energy resolution of the emission tomography apparatus, especially in silicon photomultiplier (SiPM)-based systems, and sometimes the performance of spectroscopy is not guaranteed for a wide energy range [10]. Moreover, 176Lu radioactivity of about 240–300 Bq/cm3 [11] with a combination of the beta particle and cascade gamma rays affects the entire range of energy for emission tomography, making this approach more difficult.
However, if we have a deep understanding of the background, some characteristics of IRL could actually be beneficial for a number of applications. For instance, the position of the peaks from the cascade gamma rays can be used as an ideal radioactive source for energy calibration without external sources [12,13,14]. The uniformly distributed background radiation can serve as measured transmission data for performing emission data corrections such as attenuation correction and scatter correction, or as initial values for algorithms [13]. The sum energy peak of cascade gamma rays can be used for monitoring detector calibration shift and for self-calibration of detectors in complex detector systems [14].
In order to mitigate the potential shortcomings and encourage the strengths of lutetium-based scintillators in a variety of fields, the present work will address the self-detection characteristics of the IRL in the scope of energy spectroscopy. Previous works have studied the spectrum of IRL self-detection in the scintillation crystal [14,15,16,17,18]. The typical broad-spectrum of IRL was observed and it indicated that simultaneous detection of the β-particle and γ-rays likely contributes to the broadening of the spectrum [14]. Since the relative intensity of the peaks in the spectrum has not been clearly explained, subsequent studies emphasized this and suggested a method based on distinguishing each event combination and interaction probability [14]. More recently, researchers have demonstrated the dependence of the IRL energy spectrum on the geometry of the scintillator through light transport simulation [16]. Apart from these efforts, studies and validation studies have also been conducted to obtain the background spectrum of IRLs by simulating ion sources in simulation packages, such as Geant4 or Geant4-based code. However, simulations of the complete decay and detection processes using simulation packages can be time-consuming and require an experienced user to correctly set the involved simulation parameters to obtain the correct energy spectrum [19,20].
Few studies have focused on other principal types of photon interactions with matter when the IRL spectrum was obtained with a previously presented method known as analytical calculation; in other words, only the full-energy peak according to the photoelectric effect or internal conversion was considered for understanding the energy spectrum of IRL. The full-energy peak is dominant compared to the Compton region but this may not always be a reasonable assumption when the escape probability of the scattered gamma ray increases depending on the structure of the scintillation crystal. Thus, considering various interactions, even analytical calculation, would represent a more detailed approach for understanding while offering generality in relatively small pixelated scintillators, unlike the bulk scintillators used in previous studies [15,16].
The approach we have used in this study considers principal types of photon interactions without ion source simulation. To this end, using empirical parameters, energy spectra reflecting the variation of each gamma ray interaction at a pixelated scintillation crystal were simulated simultaneously with the process that calculates the relative intensity of interactions, as in previous studies (in Section 2.1 to Section 2.2). Each energy spectrum was then convoluted with combinations as base spectra for generating the IRL spectrum (in Section 2.3). Finally, the generated IRL spectrum was compared to the experiment, ion source, and previous method in order to validate the method we used (in Section 3.3). The aim of this work is to suggest the method that shows how to obtain the more detailed IRL background spectrum using only cascade gamma ray interactions without complex understandings of ion source simulation.

2. Materials and Methods

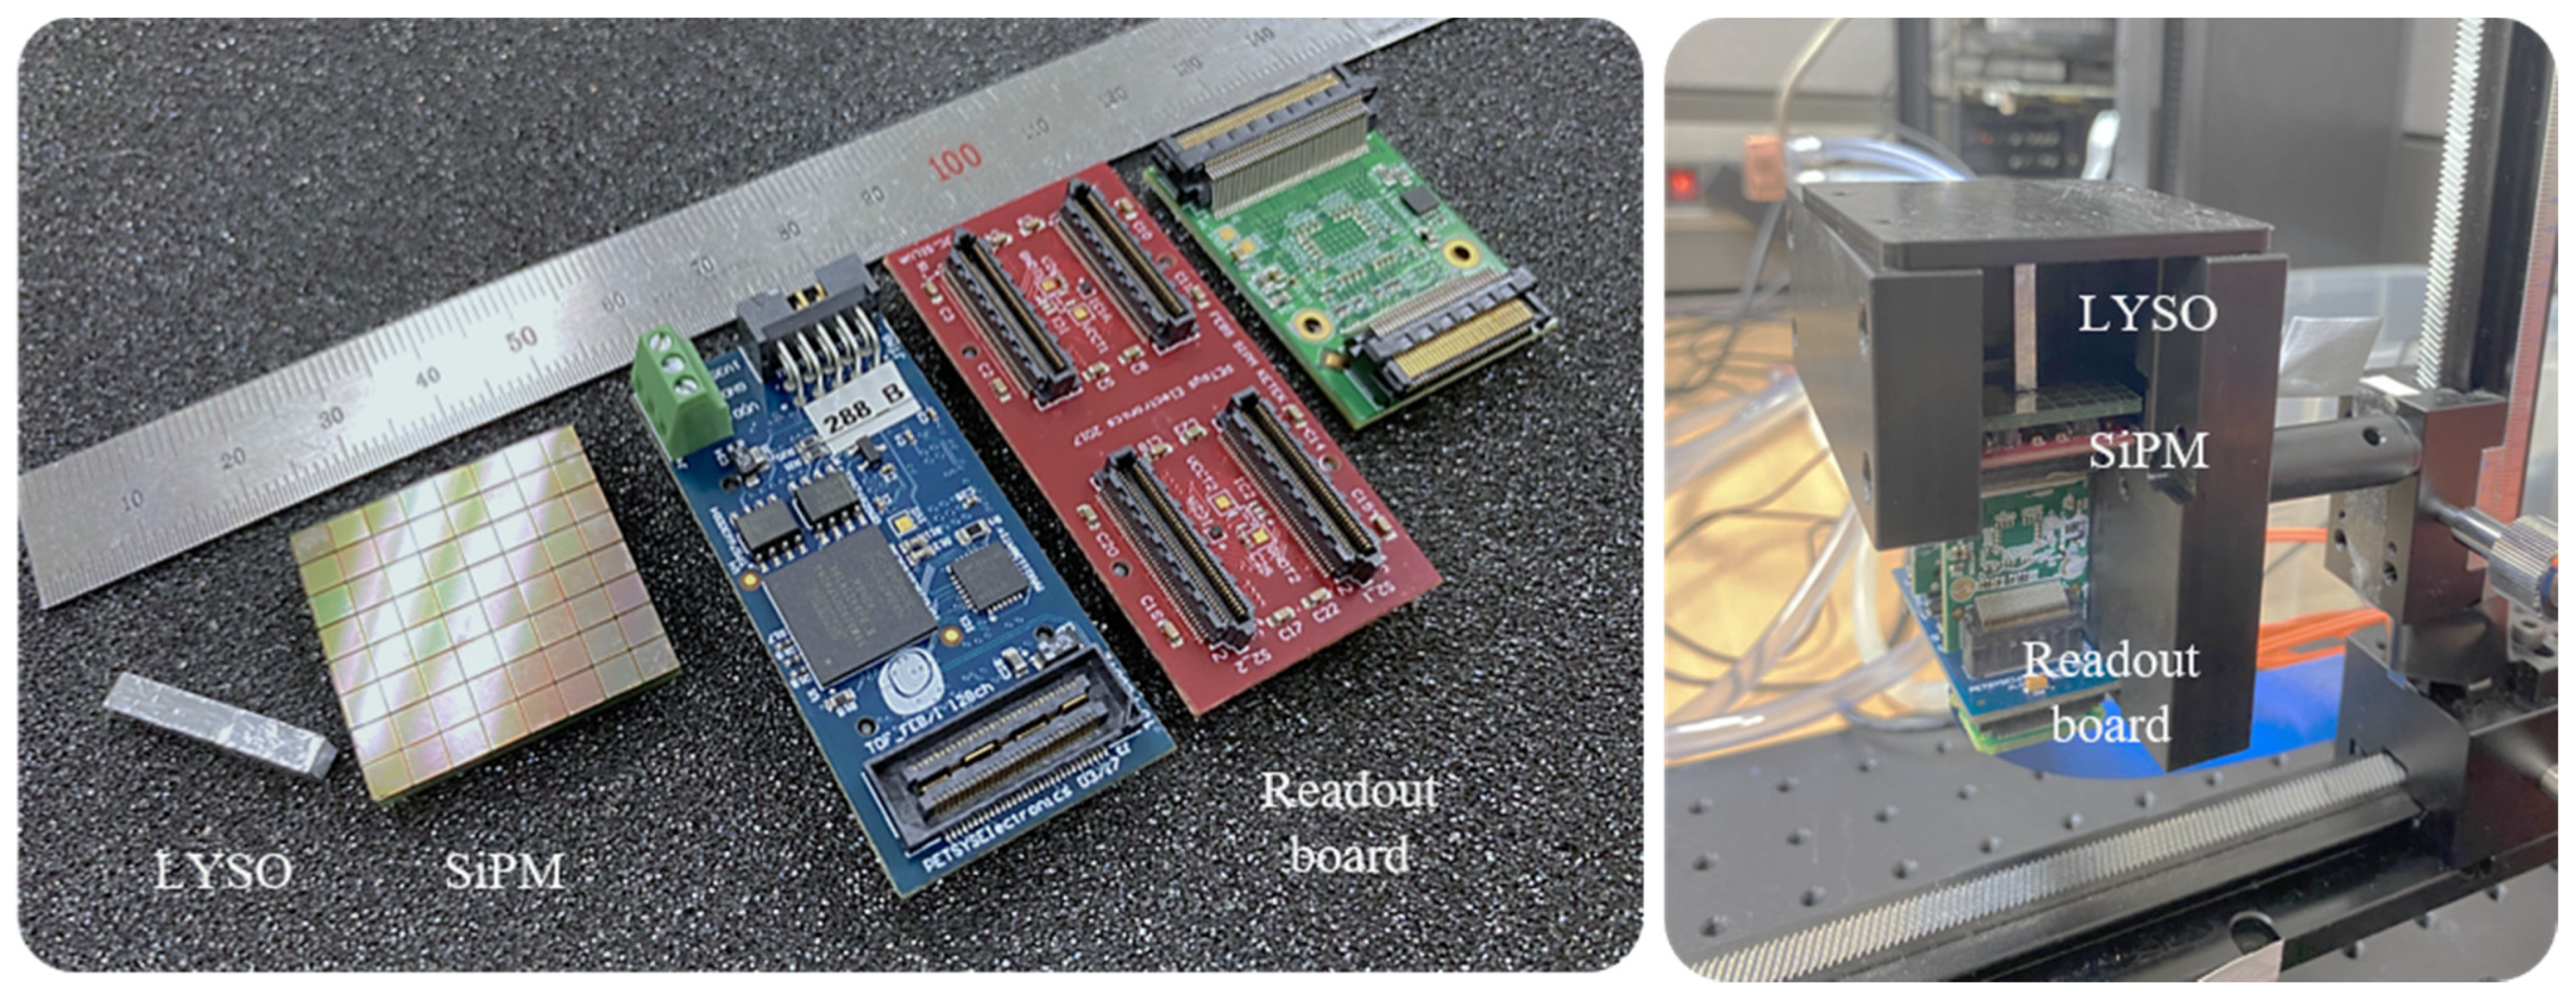
2.1. Experimental Environment

Experiments were set up to acquire the empirical parameters used for simulation and to measure the IRL spectrum. The apparatus used in the experiment is part of the Brain-PET, which the KAIST research team has been developing. The detector modules, readout, and experiment environment are described next.
The detector module is assembled with a surface mount silicon photomultiplier (SiPM) array PM3325-WB (KETEK GmbH, Munich, Germany) coupled with optical grease (Eljen Technology, Sweetwater, TX, USA) to an LYSO scintillator crystal (Epic crystal, Shanghai, China). SiPM is an analogue device that consists of thousands of Geiger-mode avalanche photo-diode (GAPD) pixels in its area and receives the sum of the signals in a unit pixel as an output signal to measure the amount of incident light [21]. Square-base prism LYSO crystals with all surfaces polished and their sides covered with enhanced specular reflector film (3M Company, Saint Paul, MN, USA) were used in this study. An 8 × 8 SiPM array model was used and the single-pixel package size was 3.315 × 3.315 mm2, the active area was 3 × 3 mm2, and the fill factor was 80%. The scintillation crystal was 3 × 3 × 20 mm3 and one-to-one coupled with the single pixel of SiPM.
A SiPM readout circuit (Front-End Module, PETsys Electronics Inc., Oeiras, Portugal) was used for simultaneous processing of the GAPDs’ charge integration and photo-sensor channel signals. The readout circuit was based on an application-specific integrated circuit (ASIC) in a standard complementary metal-oxide-semiconductor (CMOS). The ASIC digitizes the time and energy signal of a photo-sensor channel by using two time-to-digital converters (TDCs) and a charge integrator. The digitized signals were stacked as event data, which have information on time tag, channel identifier, and measured energy, through a module referred to as the global controller (FEB/D_V2 board, PETsys Electronics Inc., Oeiras, Portugal). Event data were transmitted to a computer system using a data acquisition board equipped with a field-programmable gate array (FPGA Kintex-7, Xilinx Inc., San Jose, CA, USA). The components of the experiments listed above are shown in Figure 2 (left) and these components were assembled and installed in light-tight structures for the experiment, as shown in Figure 2 (right).
The experiment was performed at a controlled temperature with the air temperature set to 18 °C. Temperature is one of the important SiPM characterization factors because it has significant temperature dependency. Accordingly, SiPM and ASIC temperatures were stable at about 20 and 25 °C, respectively. The breakdown voltage and overvoltage of SiPM were set to 27 and 4 V. ASIC calibration under these settings was performed to reject unnecessary noise signals.

2.2. Monte Carlo Simulation

A Monte Carlo simulation was conducted with Monte Carlo N-Particle Transport Code 6, version 1.0 (MCNP 6.1). MCNP6.1 is widely used for modeling the spectroscopy of radiation detectors because this code enables each modeled detector to obtain the pulse height from the emitted particles. To calculate the variations of the transferred energy according to the scintillator interaction with gamma rays of 176Lu, an identical detector module to that in the experiment was modeled in the simulation. Moreover, cascade gamma rays, as an evenly distributed radiation source, were inserted in the scintillator. In the case of the beta particles from 176Lu, we assumed that their energy was locally deposited in the scintillator.
The energy resolution of the full-energy peak in the pulse-height spectrum measured with a scintillation detector based on SiPM is normally determined by a combination of the physical uncertainties. However, the Monte Carlo simulation used in this study cannot directly take into account the uncertainty factors. Hence, a special treatment, referred to as Gaussian energy broadening (GEB) treatment as a Gaussian kernel, was used to better simulate the detector system [22]. The treatment broadens the energy peaks by sampling from the following Gaussian function:
f ( E ) = C e ( ( E E 0 ) / A ) 2
where E is the broadened energy; E0 is the unbroadened energy of the peaks; C is a normalization constant; and A is the Gaussian width.
The Gaussian width is related to the full width at half maximum (FWHM) by
A = F W H M 2 ln 2
The FHWM is defined as the energy-dependent non-linear response in this code and the expressions of the FHWM are shown below. The parameters a, b, and c were derived from experiments with the standard gamma sources (137Cs, 22Na, and 133Ba).
F W H M = a + b E + c E 2
In this study, the least-square fitting with a gradient descent method was used for acquiring the desired parameters by defining the loss function with a, b, and c. Parameters used for this study are 0.006555456 for “a”, 0.060221652 for “b”, and 1.130257109 for “c”.

2.3. Spectra Processing

2.3.1. Definition of Source Pathway and Energy Transfer Cases

The base spectra that constitute the IRL spectrum were derived based on source pathways and interaction cases, as reported previously [16]. Although in some ways the approach we used in the present work is similar to previously reported methods, we subdivided the transferred energy when gamma rays were absorbed in the crystal to address all the relevant physical processes. In the case of the internal conversion in the source pathways, a process in which an excited nucleus transfers its excitation energy directly to an atomic electron, we assumed that its energy is also locally deposited in the scintillator. When gamma rays are emitted as a result of the isomeric transition, each gamma ray interacts independently with the material and transmits its energy to the scintillator. Thus, source pathways, by combinations of the isomer transition pathway, are defined as shown in Table 1 and the resulting combinations of energy transfer cases are defined as shown in Table 2. The amount of energy transfer of each gamma in each case was induced by the Monte Carlo simulations.

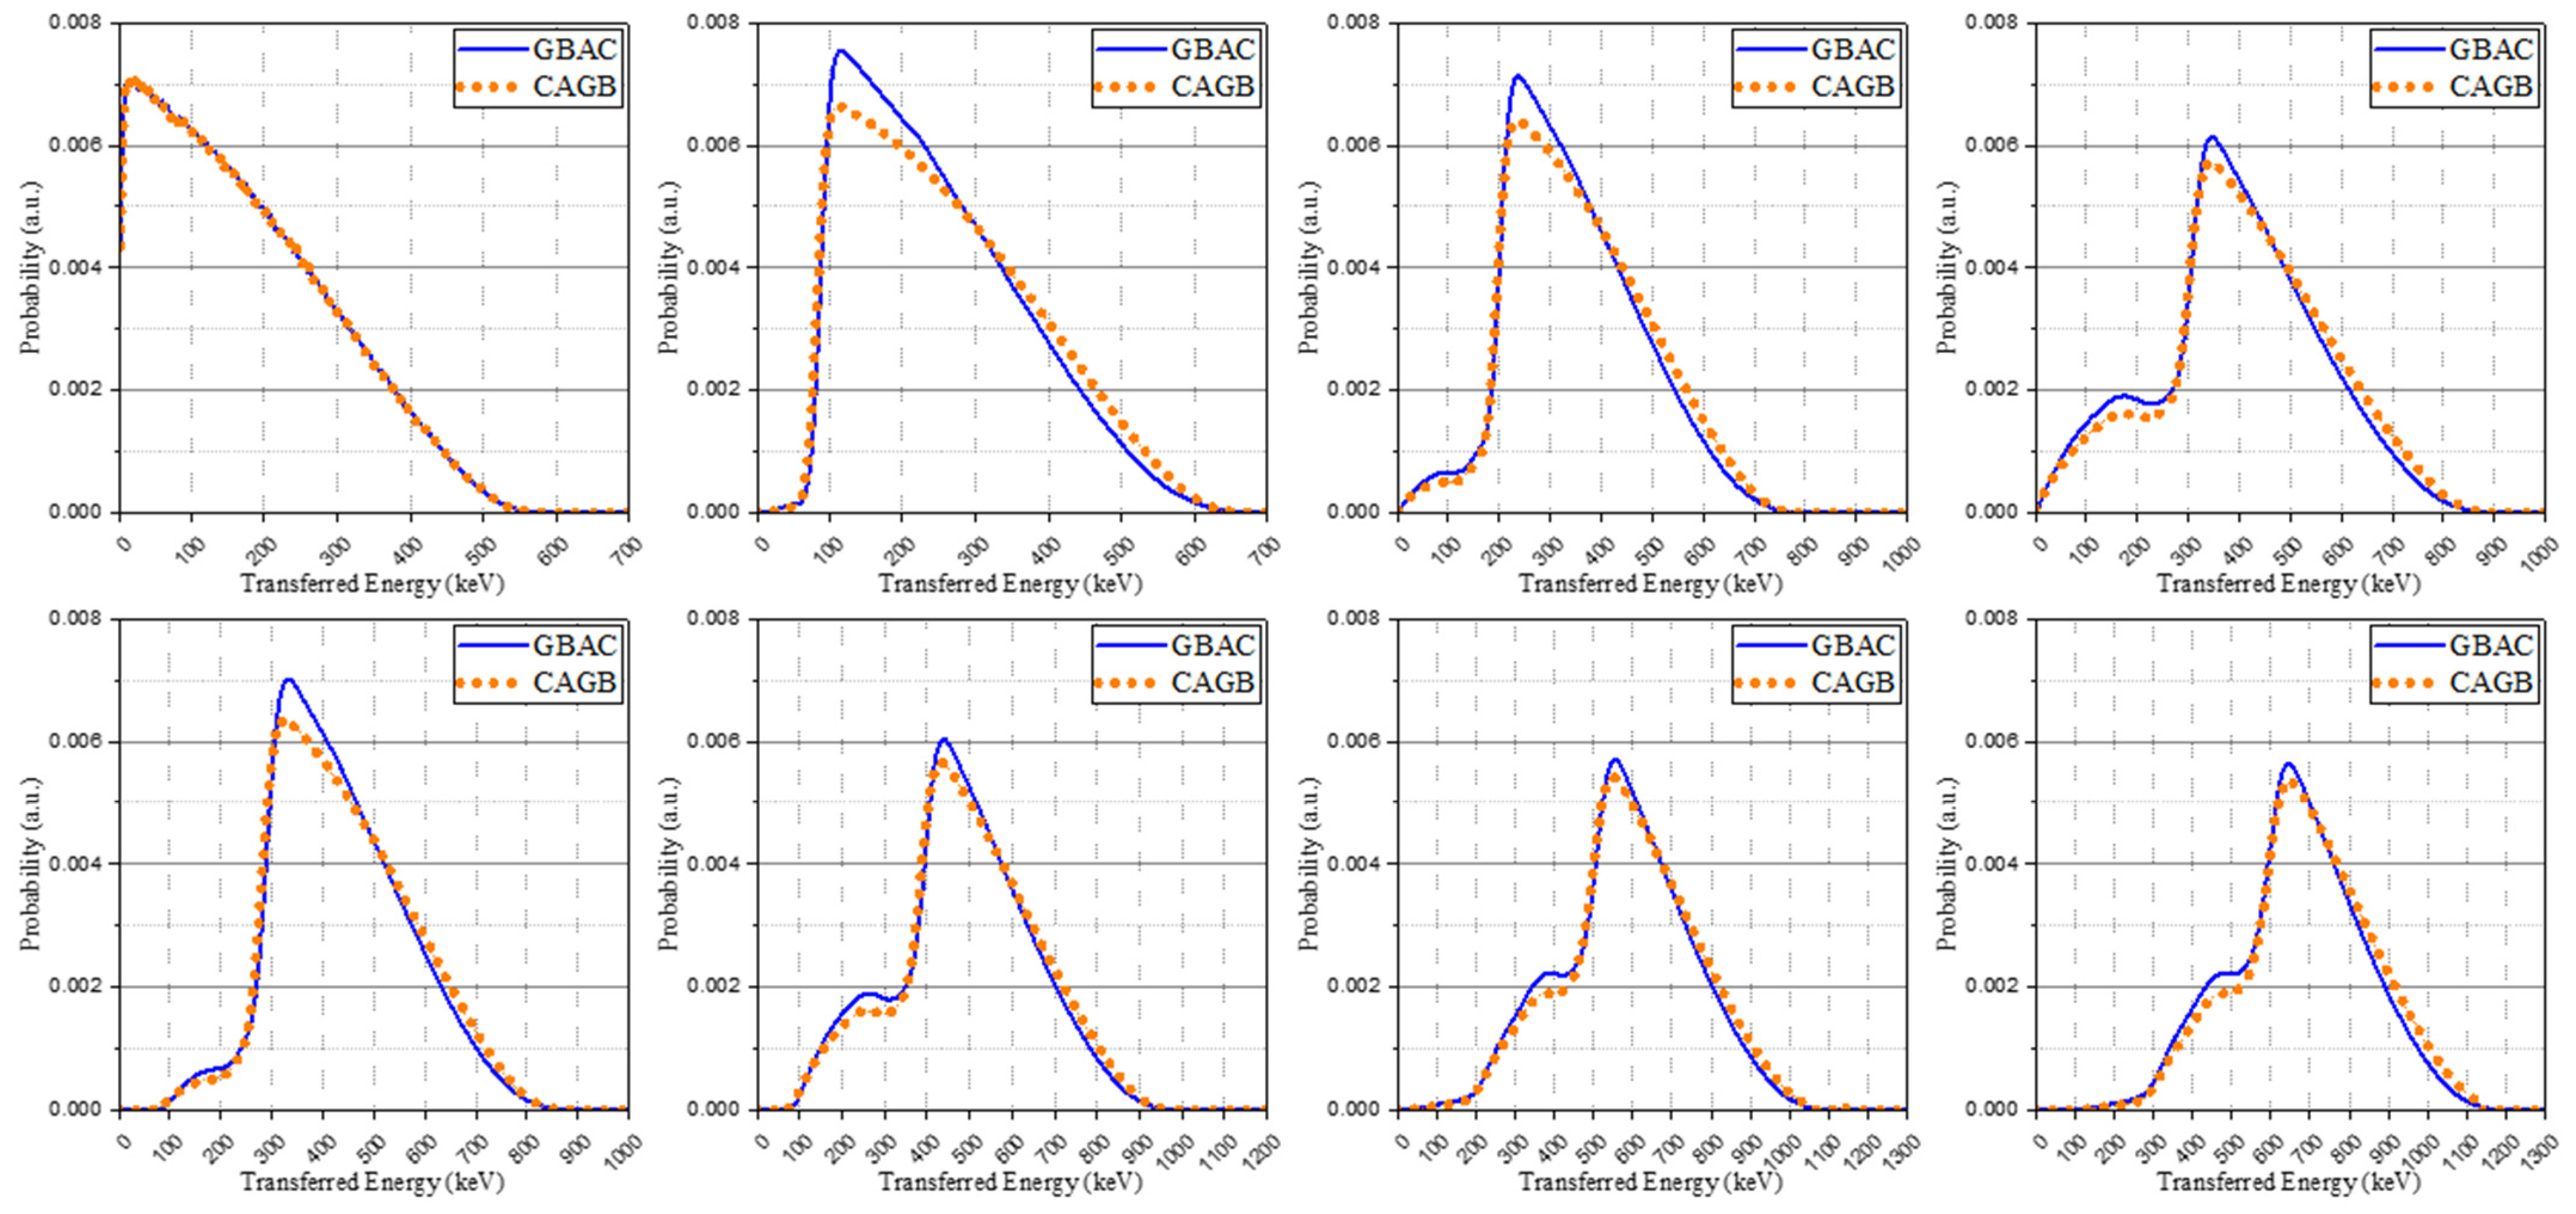
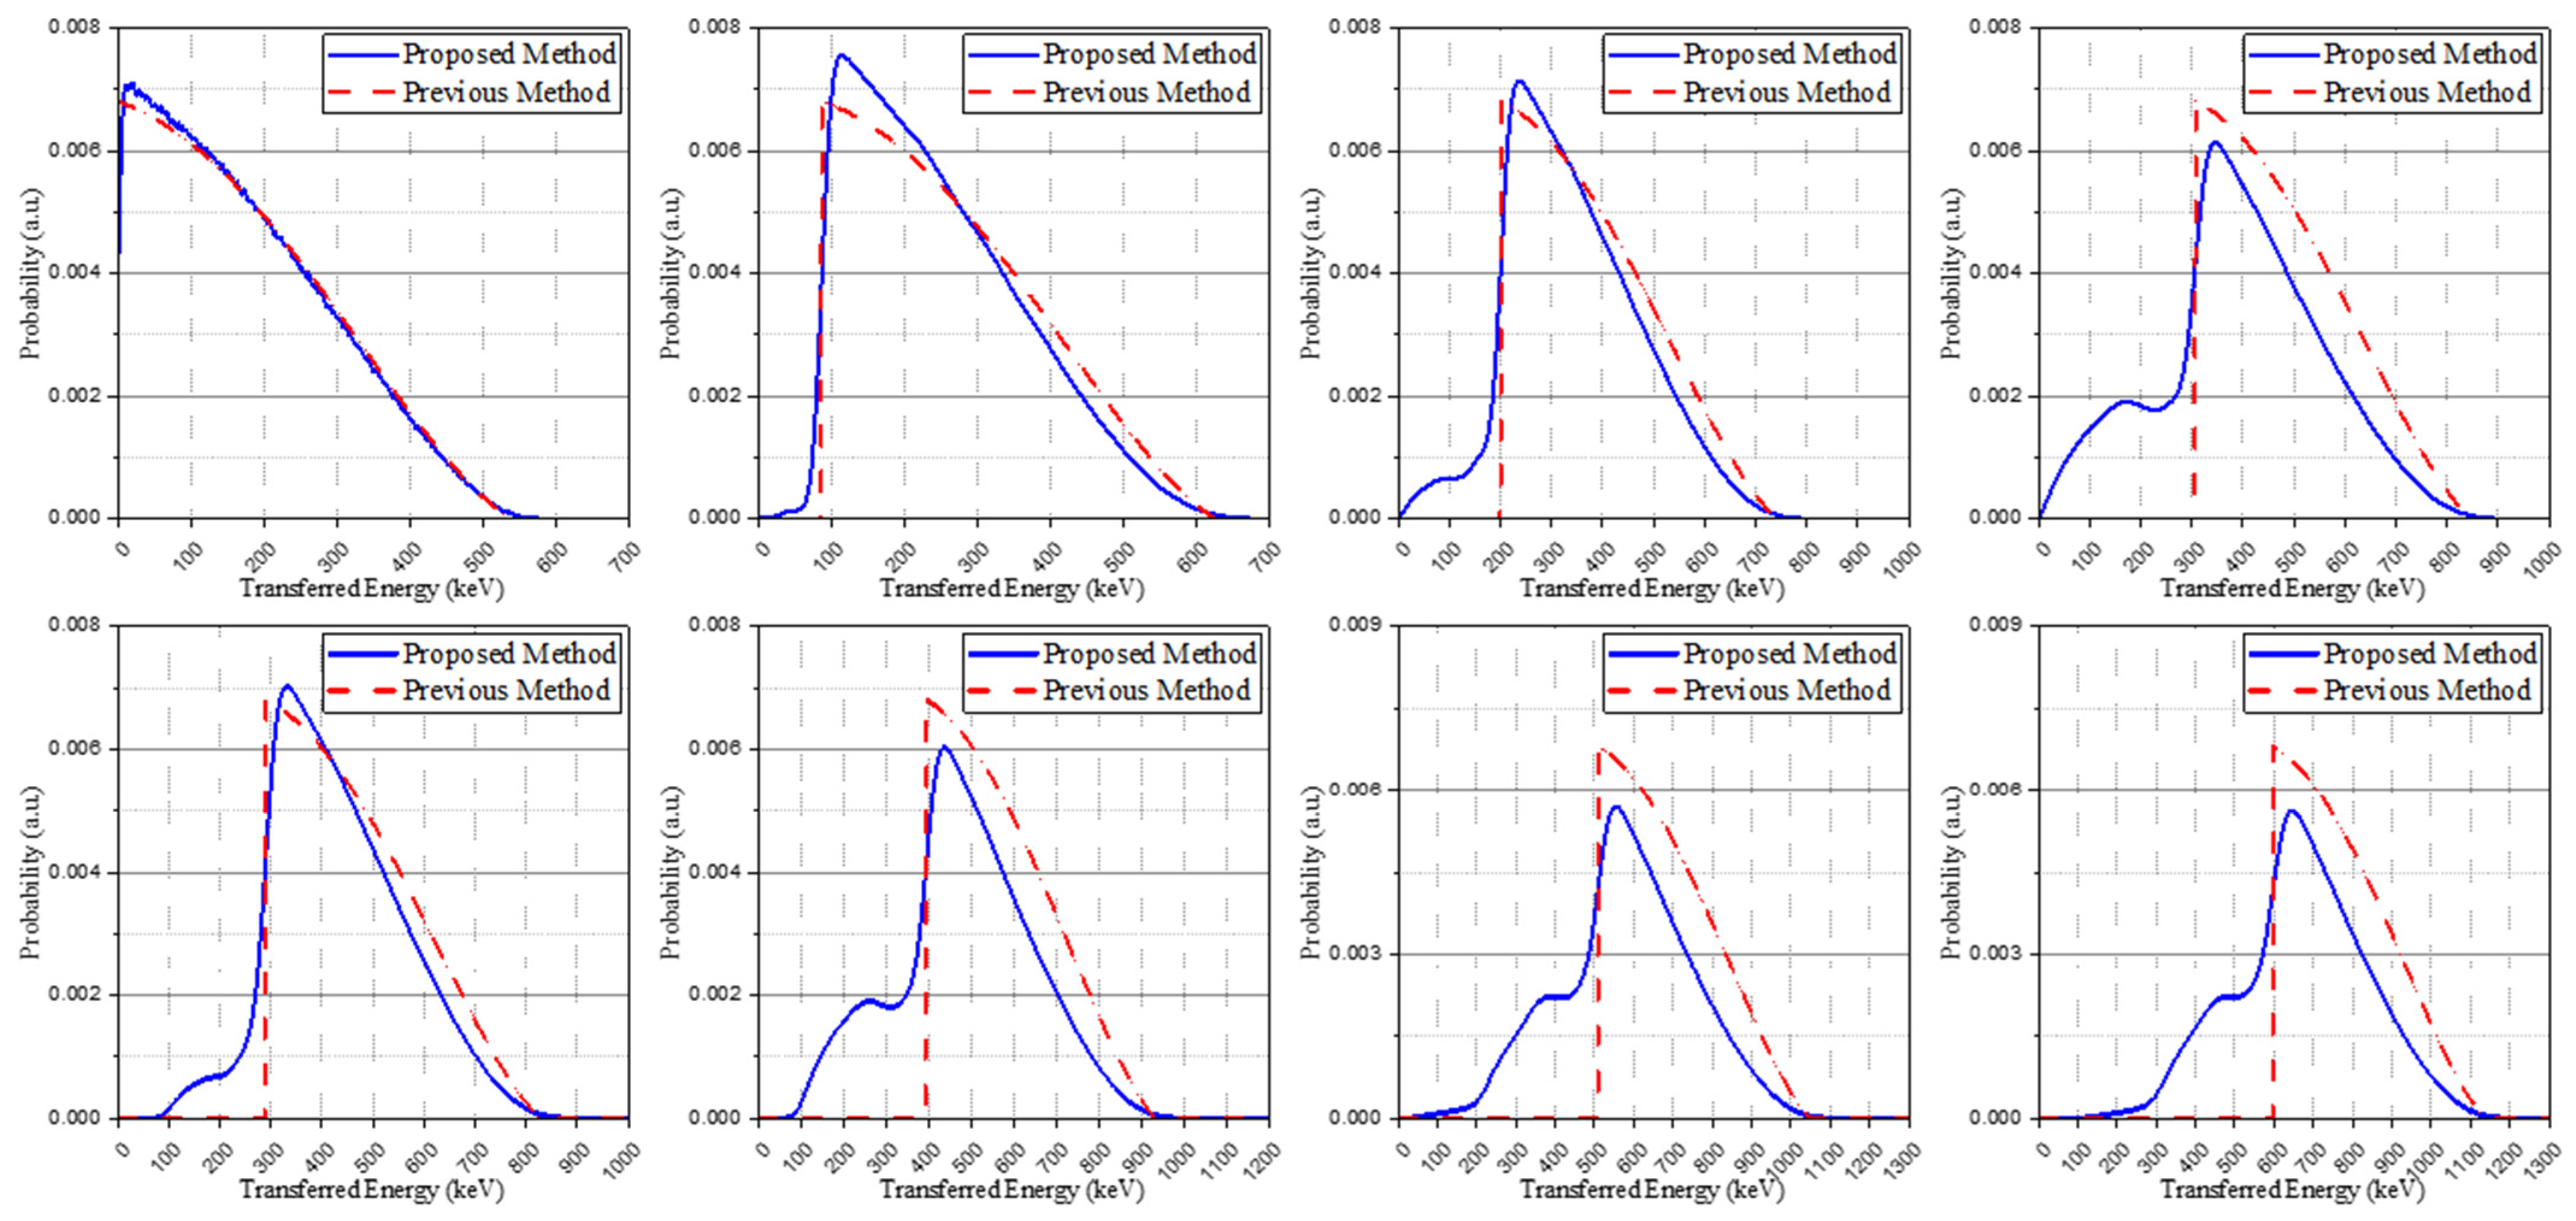
2.3.2. Data Processing with Discrete Convolution

We represented the amount of energy transfer as the energy spectrum and conducted data processing according to the combinations to obtain the total amount of energy from the simultaneously independent interactions. Internal conversion in the source pathways contributed to the energy spectrum as part of the total energy peak.
To process the spectra according to the cases, we conducted convolution between energy spectra. All cases have a contribution of the beta particle; thus, the probabilities of the beta spectrum were exploited to fulfill the role of the finite impulse response filter (FIR, h[n]) in the calculation. Therefore, the probabilities of the gamma spectra were used for input (x[n]) in order to derive an output (y[n]). In this process, FIR has values only at finite intervals and the lower bound of energy bins was considered as the representative energy of the energy bin.
y [ n ] = h [ n ] x [ n ] = k = 1 n h [ n k ] · x [ k ]
Sβ denotes the beta particle spectrum; S 1 , S 2 , and S 3 denote each gamma ray spectra from the Monte Carlo simulation; and Se denotes the measured spectrum. The energy scale of all the spectra was discretized into an identical number of channels (n) and S β ( k , p ) , S 1 , 2 , 3 ( k , p ) , and S e ( k , p ) are the normalized probability of the kth channel. To implement the combination of each spectrum, convolution was conducted according to the following:
C 1 ( k ,   p ) = S β ( k , p ) C 2 ( k , p ) = S β ( k , p ) S 1 ( k , p ) C 7 ( k , p ) = S β ( k , p ) ( S 2 ( k , p ) S 3 ( k , p ) ) C 8 ( k , p ) = S β ( k , p ) ( S 1 ( k , p ) S 2 ( k , p ) S 3 ( k , p ) )
The Gaussian broadened spectrum used here is defined as follows:
C i ( k , p ) = C i ( k , p ) f ( k ) ,   i = 1 ,   2 ,   , 8 .
An IRL spectrum can then be produced by considering the weights of each case.
S g ( k , p ) = i = 1 8 w i C i ( k , p )
It can be seen that particular weight coefficients w i in Equation (7) are needed to generate a proper spectrum. Thus, we calculated the weight coefficients through the measured spectrum. In this paper, a non-linear least-squares optimization method was used to estimate the weight coefficients using the following objective functions:
f ( w i ) = r ( w i ) n ,             r ( w i ) = p = 1 n { S e ( k , p ) S g ( k , p ) } 2
where S g ( k , p ) is the re-organizing spectrum calculated with w i , which indicates it makes a contribution to the spectrum. The proper values of w i should minimize the difference between S e ( k , p ) and S g ( k , p ) . The optimized group of w i , G o p t ( w i ) can be calculated by solving the following optimization problem:
G o p t ( w i ) = a r g min w i f ( w i )
There are many methods to solve a non-linear optimization problem. In this study, the genetic algorithm (GA) was employed to solve the problem since it is not easy to define the existence of the local optimal solution. The algorithm, as an optimization solver based on a stochastic process derived from an evolutionary model, with operations such as selection, crossover, and mutation, could derive a global optimal solution, thus escaping the local optimal solution by using these operations [23,24].

3. Results and Discussion

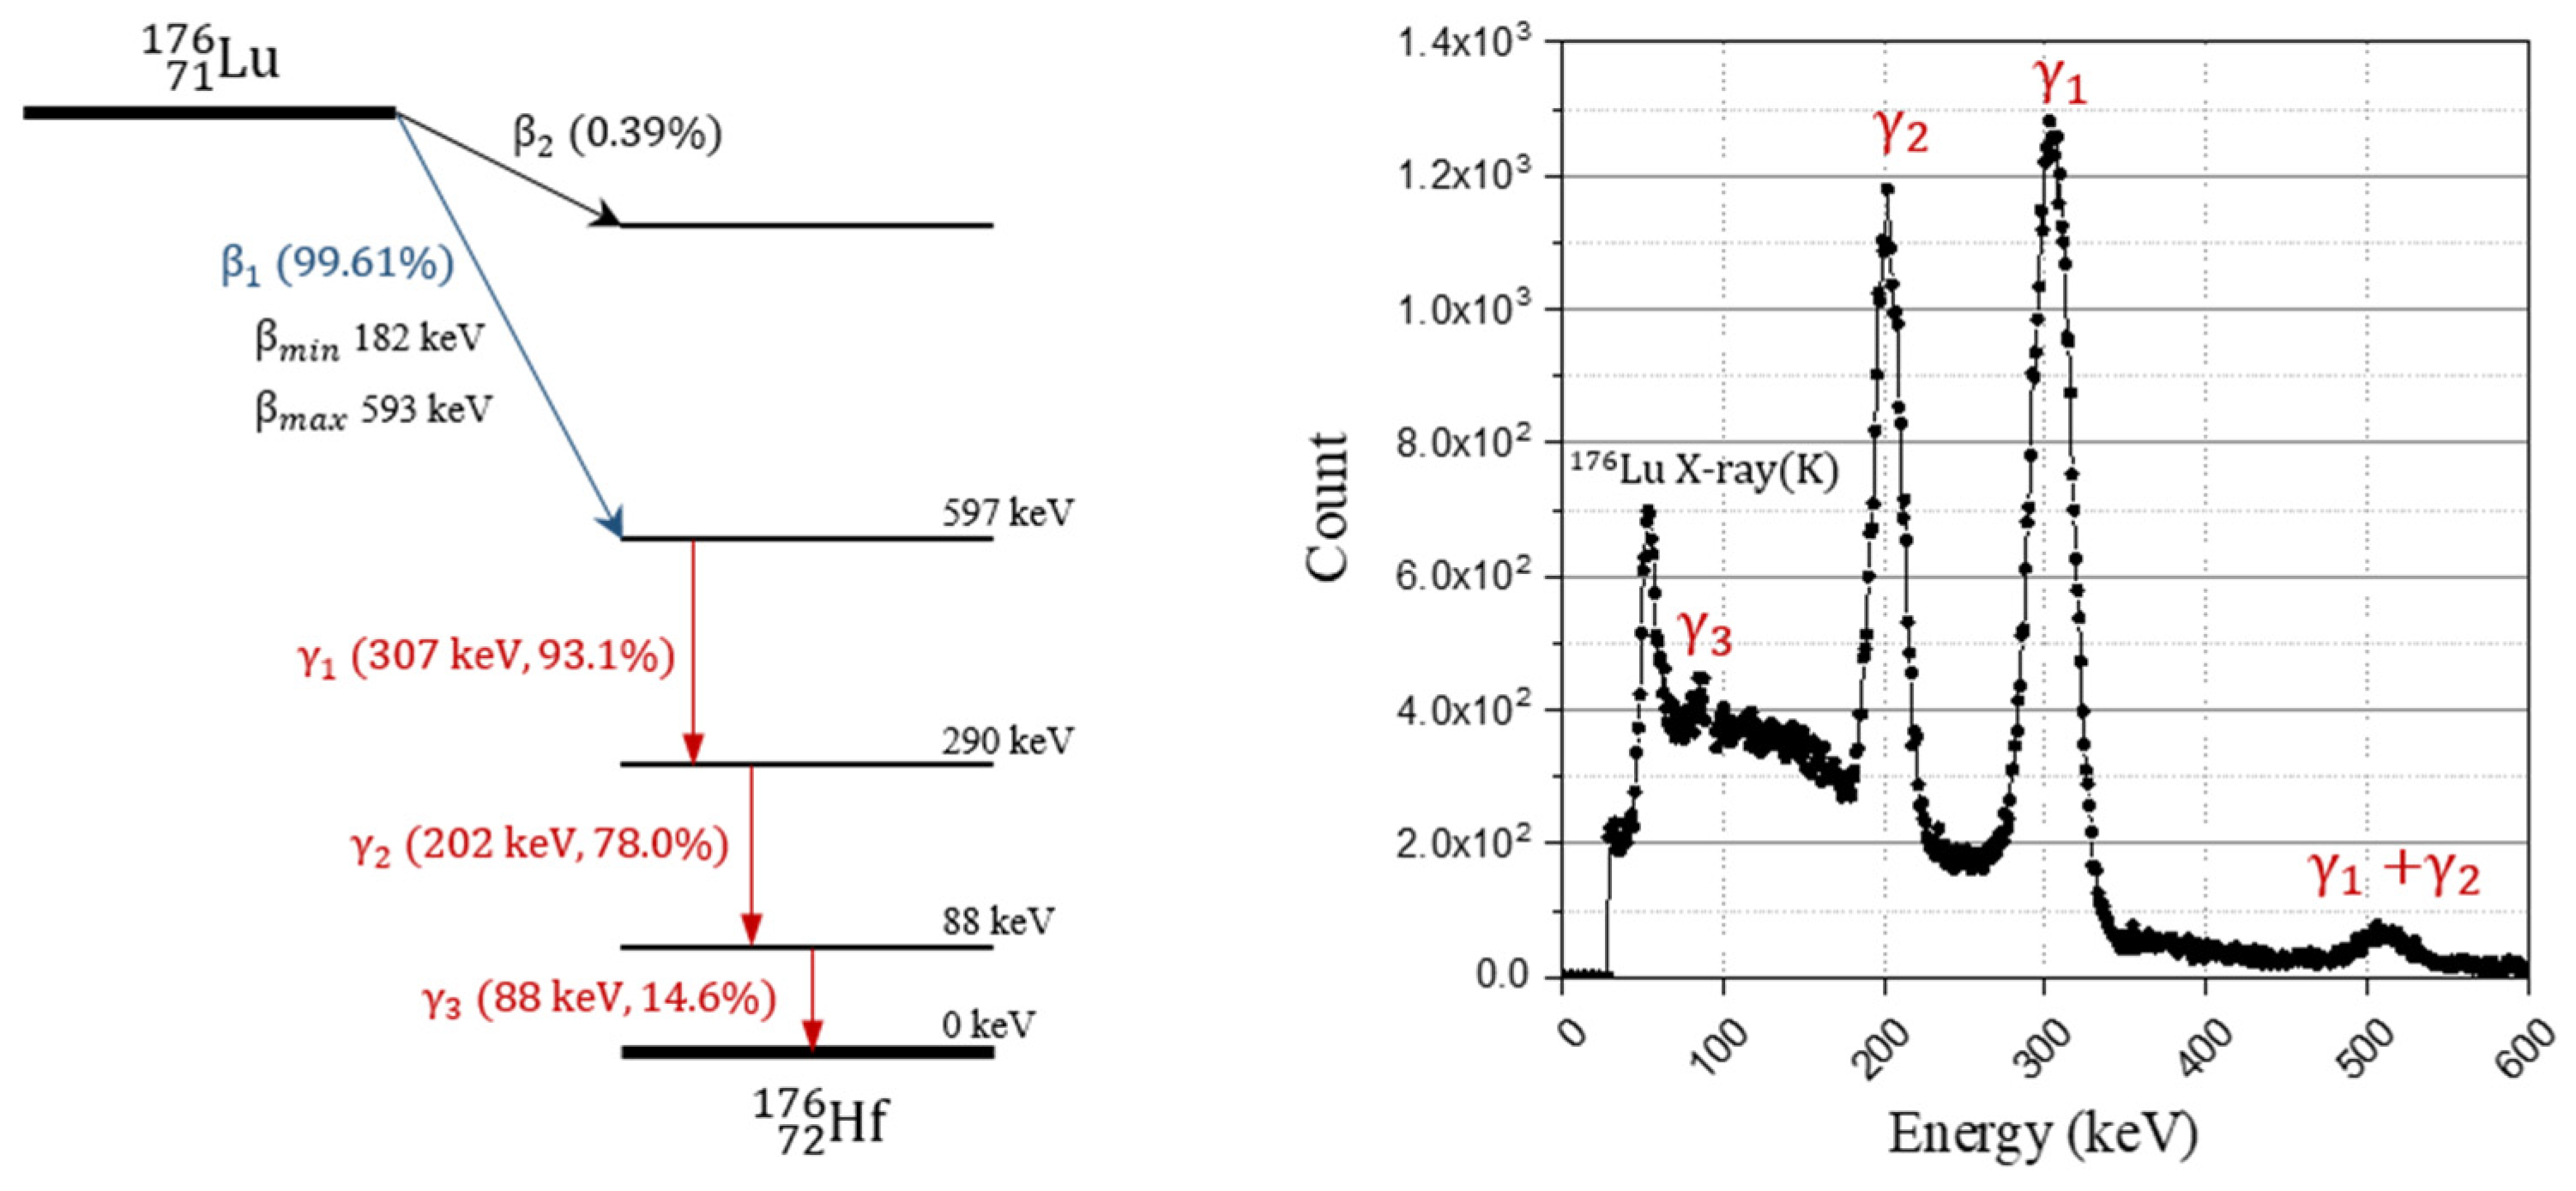
3.1. Isomer Transition Spectra

3.1.1. Calculation of the Total Photo-Peak Ratio

The interaction of IRL with the LYSO scintillator was calculated using a Monte Carlo simulation. In addition, the results of the simulation were modified based on the following equation considering the pathway yield of the isomer transition, which was assumed in advance.
T = ( Y γ · P γ · E γ ) + ( Y I C · P I C · E I C ) ( Y γ · P γ ) + ( Y I C · P I C )
In the equation, the total peak ratio (T) of the isomer transition was induced by the yield (Y), interaction probability (P), and full-energy peak (or photo-peak) efficiency (E). The interaction probability represents the interaction probability of the radiation emitted from the isomer transition with the scintillator. In the case of the gamma ray emission, the interaction probability varied because the energy was different according to the isomer transition phase. For the internal conversion, however, all probabilities were expressed as 1 because the electrons from the internal conversion were locally deposited. The photo-peak efficiency represents the probability of total absorption when the radiation interacted with the scintillator. The total peak ratio considering all paths of each isomer transition based on these calculations is shown in Table 3.
Although this study used a pixelated small crystal (3 × 3 × 20 mm3), the relatively bulky crystals (10 × 10 × 10 mm3 and 30 × 30 × 30 mm3) used in previous studies and the much smaller crystal (3 × 3 × 3 mm3) were also simulated to calculate and compare the total peak ratio of each isomer transition. As shown in Table 4, it can be seen that as the size of the crystal increases, the ratio of the peak ratio increases. This suggests that if the crystal is sufficiently bulky, there is no significant difference in the IRL spectrum even if all the interactions are considered as the full-energy peak. In addition, this study adopted a 176Lu decay scheme with relatively low gamma emission yields, as presented in existing papers. Accordingly, if a value other than the decay scheme used in this manuscript is used, the photo-peak ratio may decrease.

3.1.2. Post-Processing Isomer Transition Spectra
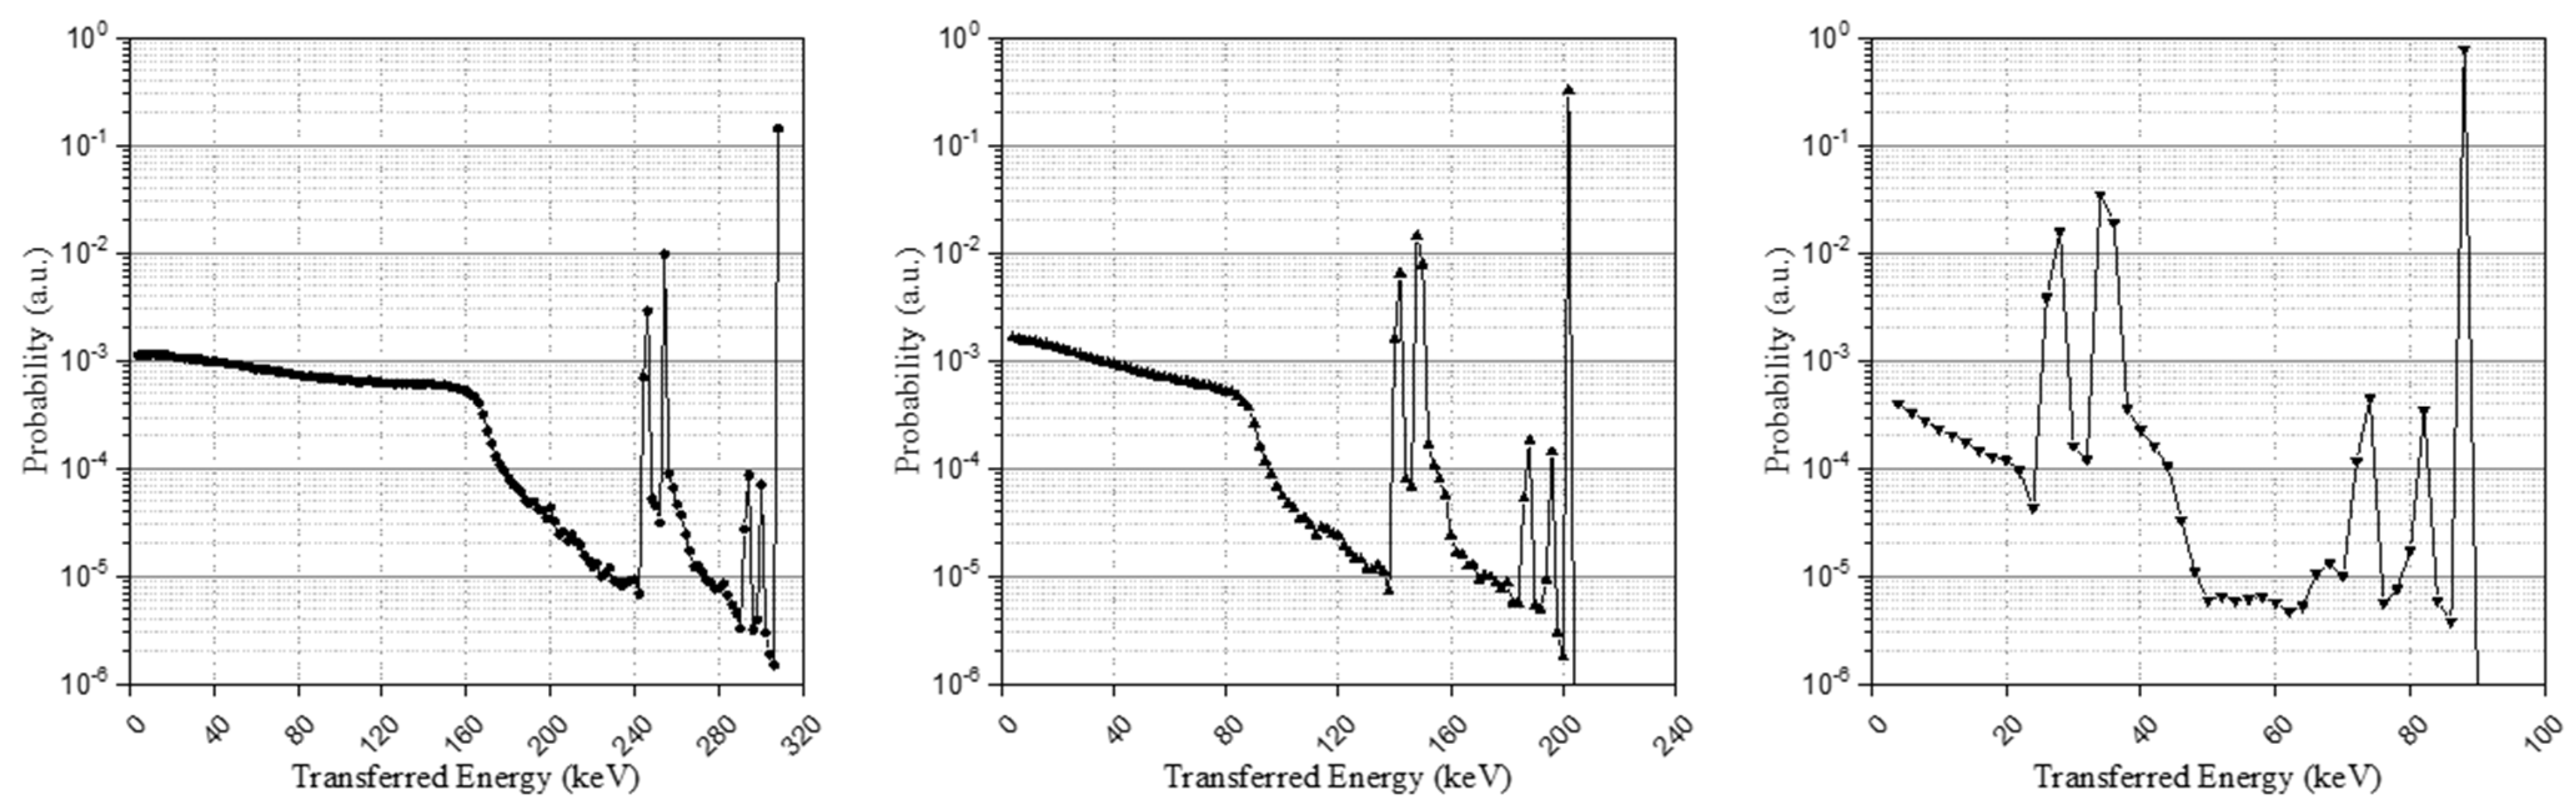
The post-processing results of the simulation, considering all source pathways, are shown as an energy spectrum in Figure 3 and each energy spectrum represents each isomer transition result. Broadening had not yet been applied to the energy spectra through the pre-defined Gaussian kernel and the base spectra will be configured through data processing in the next section.

3.2. Base Spectra

The isomer transition energy spectra were processed by the combination of cases to configure the base spectra that form the IRL spectrum. In this study, the Gaussian kernel used for spectrum broadening was defined using energy resolutions of radiation sources as empirical data in the indirect radiation measurement using a scintillator and SiPM [25,26]. In these measurement systems, the energy resolution ( Δ E / E ) can be expressed as follows:
( Δ E / E ) 2 = ( δ s c ) 2 + ( δ p ) 2 + ( δ s t ) 2 + ( δ n ) 2
where δ s c is the intrinsic resolution of the scintillator, δ p is the transfer resolution, δ s t is the statistical contribution of a silicon photomultiplier, and δ n is the noise contribution. The interaction by each isomer transition contributes to the signal simultaneously but each interaction is mutually independent. In other words, if broadening is performed on the energy merged after convolution, it is possible that the system performance may not be accurately reflected because the energy resolution is also an energy-dependent non-linear response [27]. Thus, we tried to confirm these concerns through a comparison of the two methods. One comparison is to apply the Gaussian broadening after the convolution, as described in Section 2.3.2 (GBAC), and another is to apply the Gaussian broadening before the convolution, as described below the following equation (CAGB).
S i ( k , p ) = S i ( k , p ) f ( k ) ,   i = β ,   1 ,   2 ,   3
The isomer transition spectra modified through Gaussian broadening replaced the primary spectra and created the base spectra in the same way. The base spectra obtained by these methods were normalized to have identical areas. There was no significant difference in most spectra according to the order of convolution and Gaussian broadening. Through this process, however, we confirm that when simultaneously contributing to a signal through independent interactions, there could be a difference in the low-energy area in which the performance of the system is relatively degraded. The spectra from two methods are described in Figure 4 and GBAC-based spectra were used in the discussion of the remaining results.
Figure 5 shows the base spectra derived from the proposed method (GBAC) in this manuscript and the base spectra used in previous studies [15]. The proposed method considered Compton-scattering using the isomer transition spectra (blue solid line), whereas the previous method does not consider Compton-scattering (red dash line). For the base spectra used in previous studies, no post-processing was carried out.

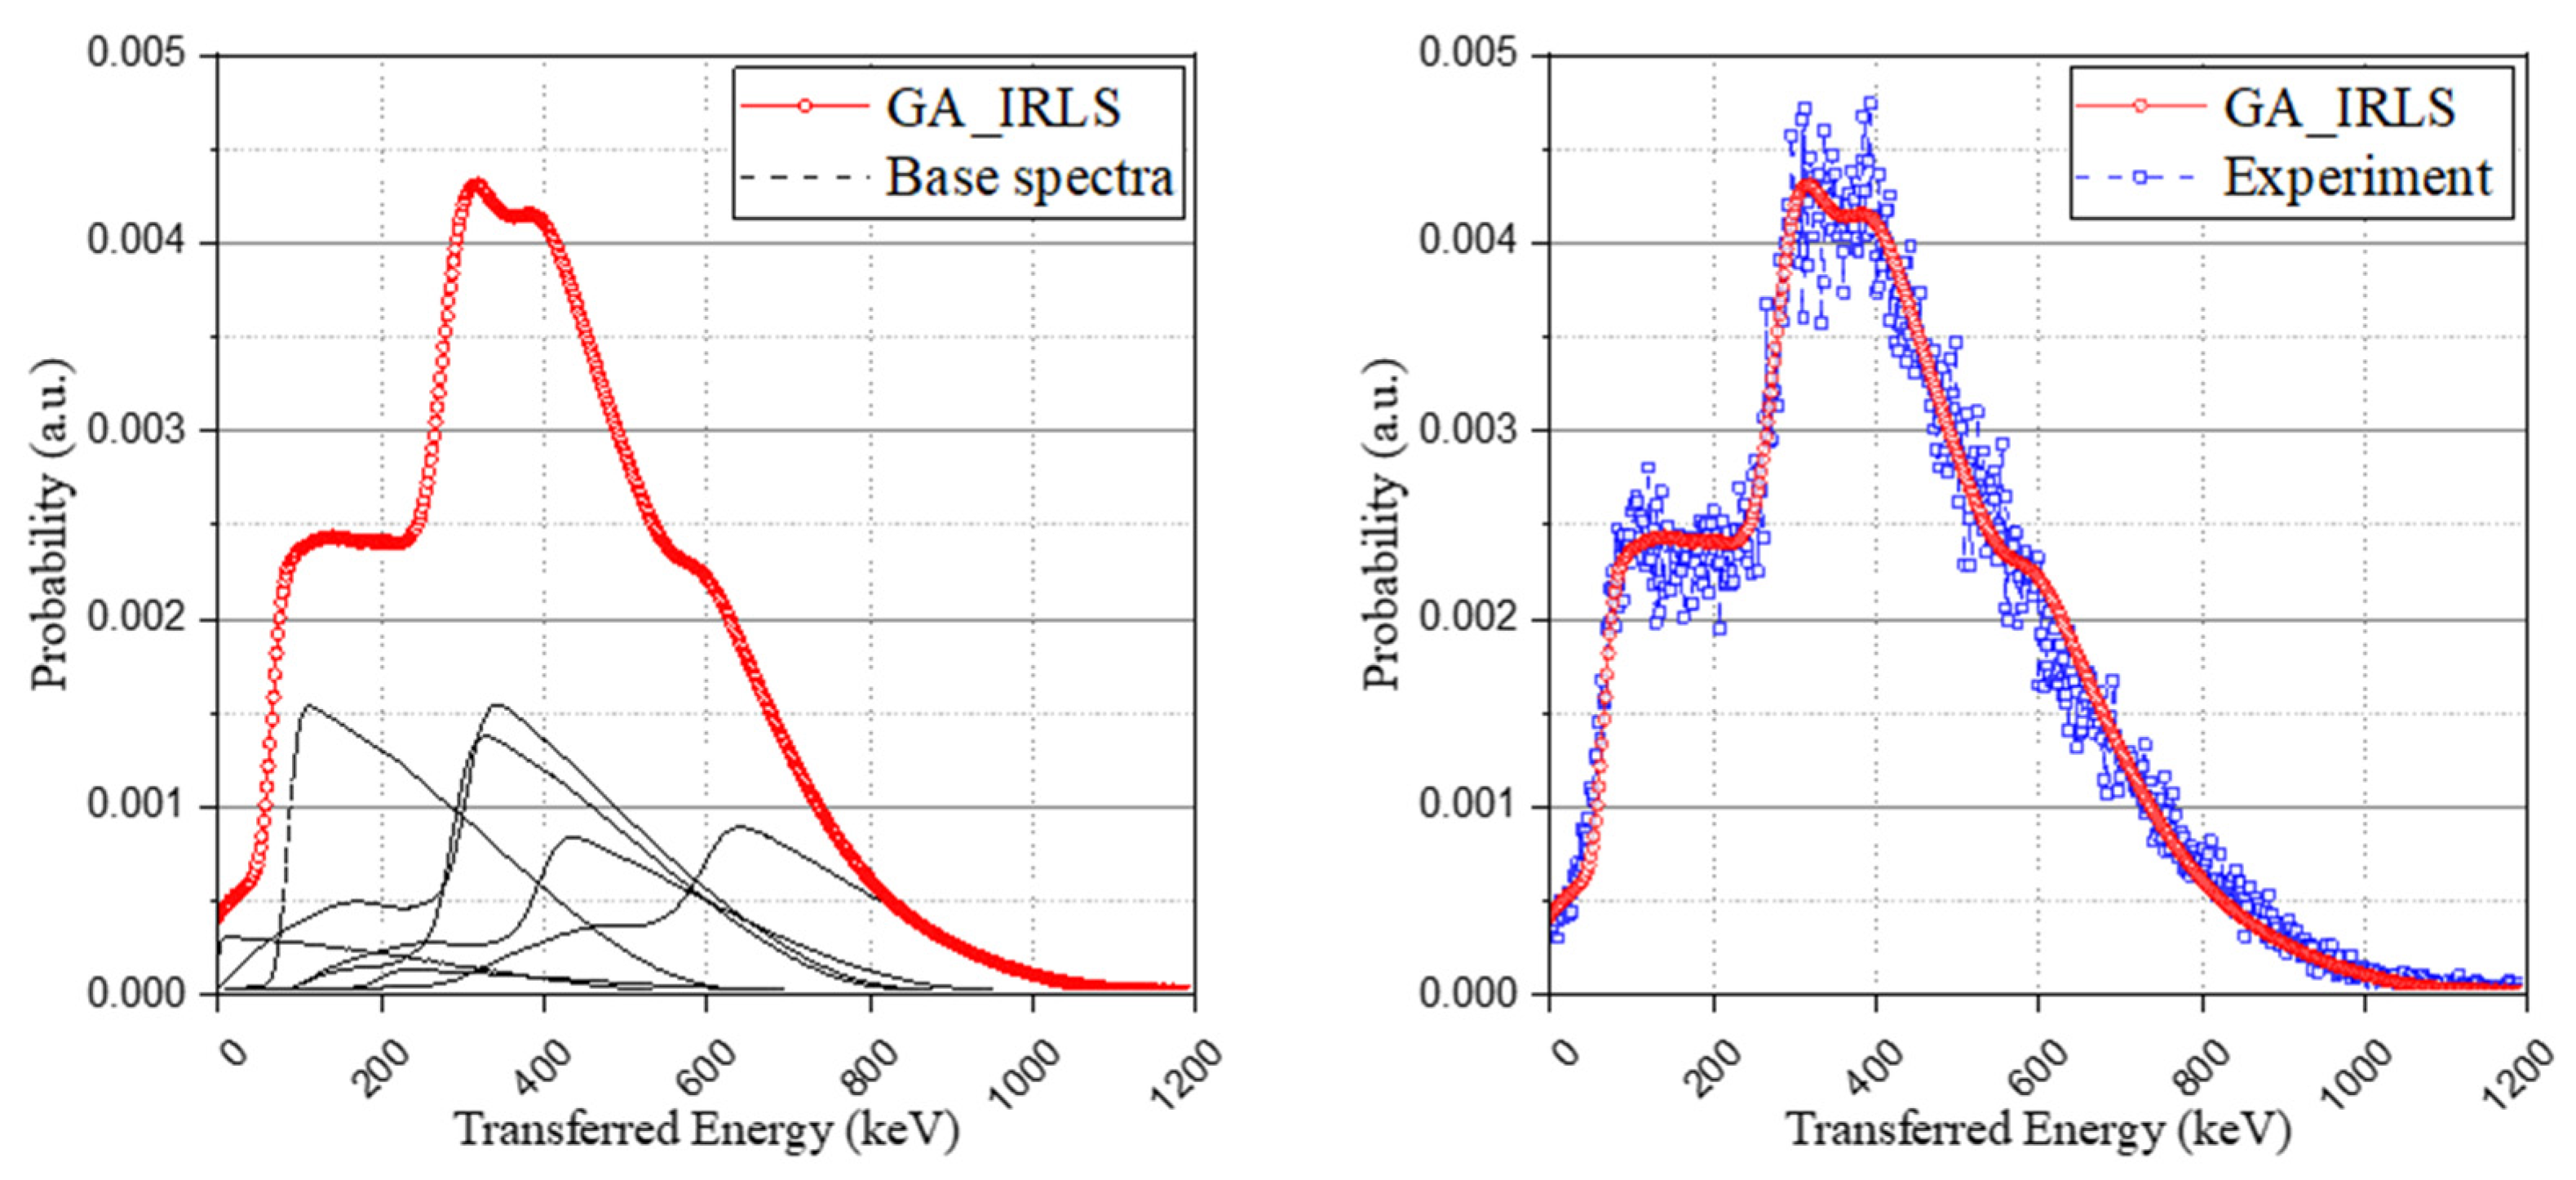
3.3. Validation of the Study

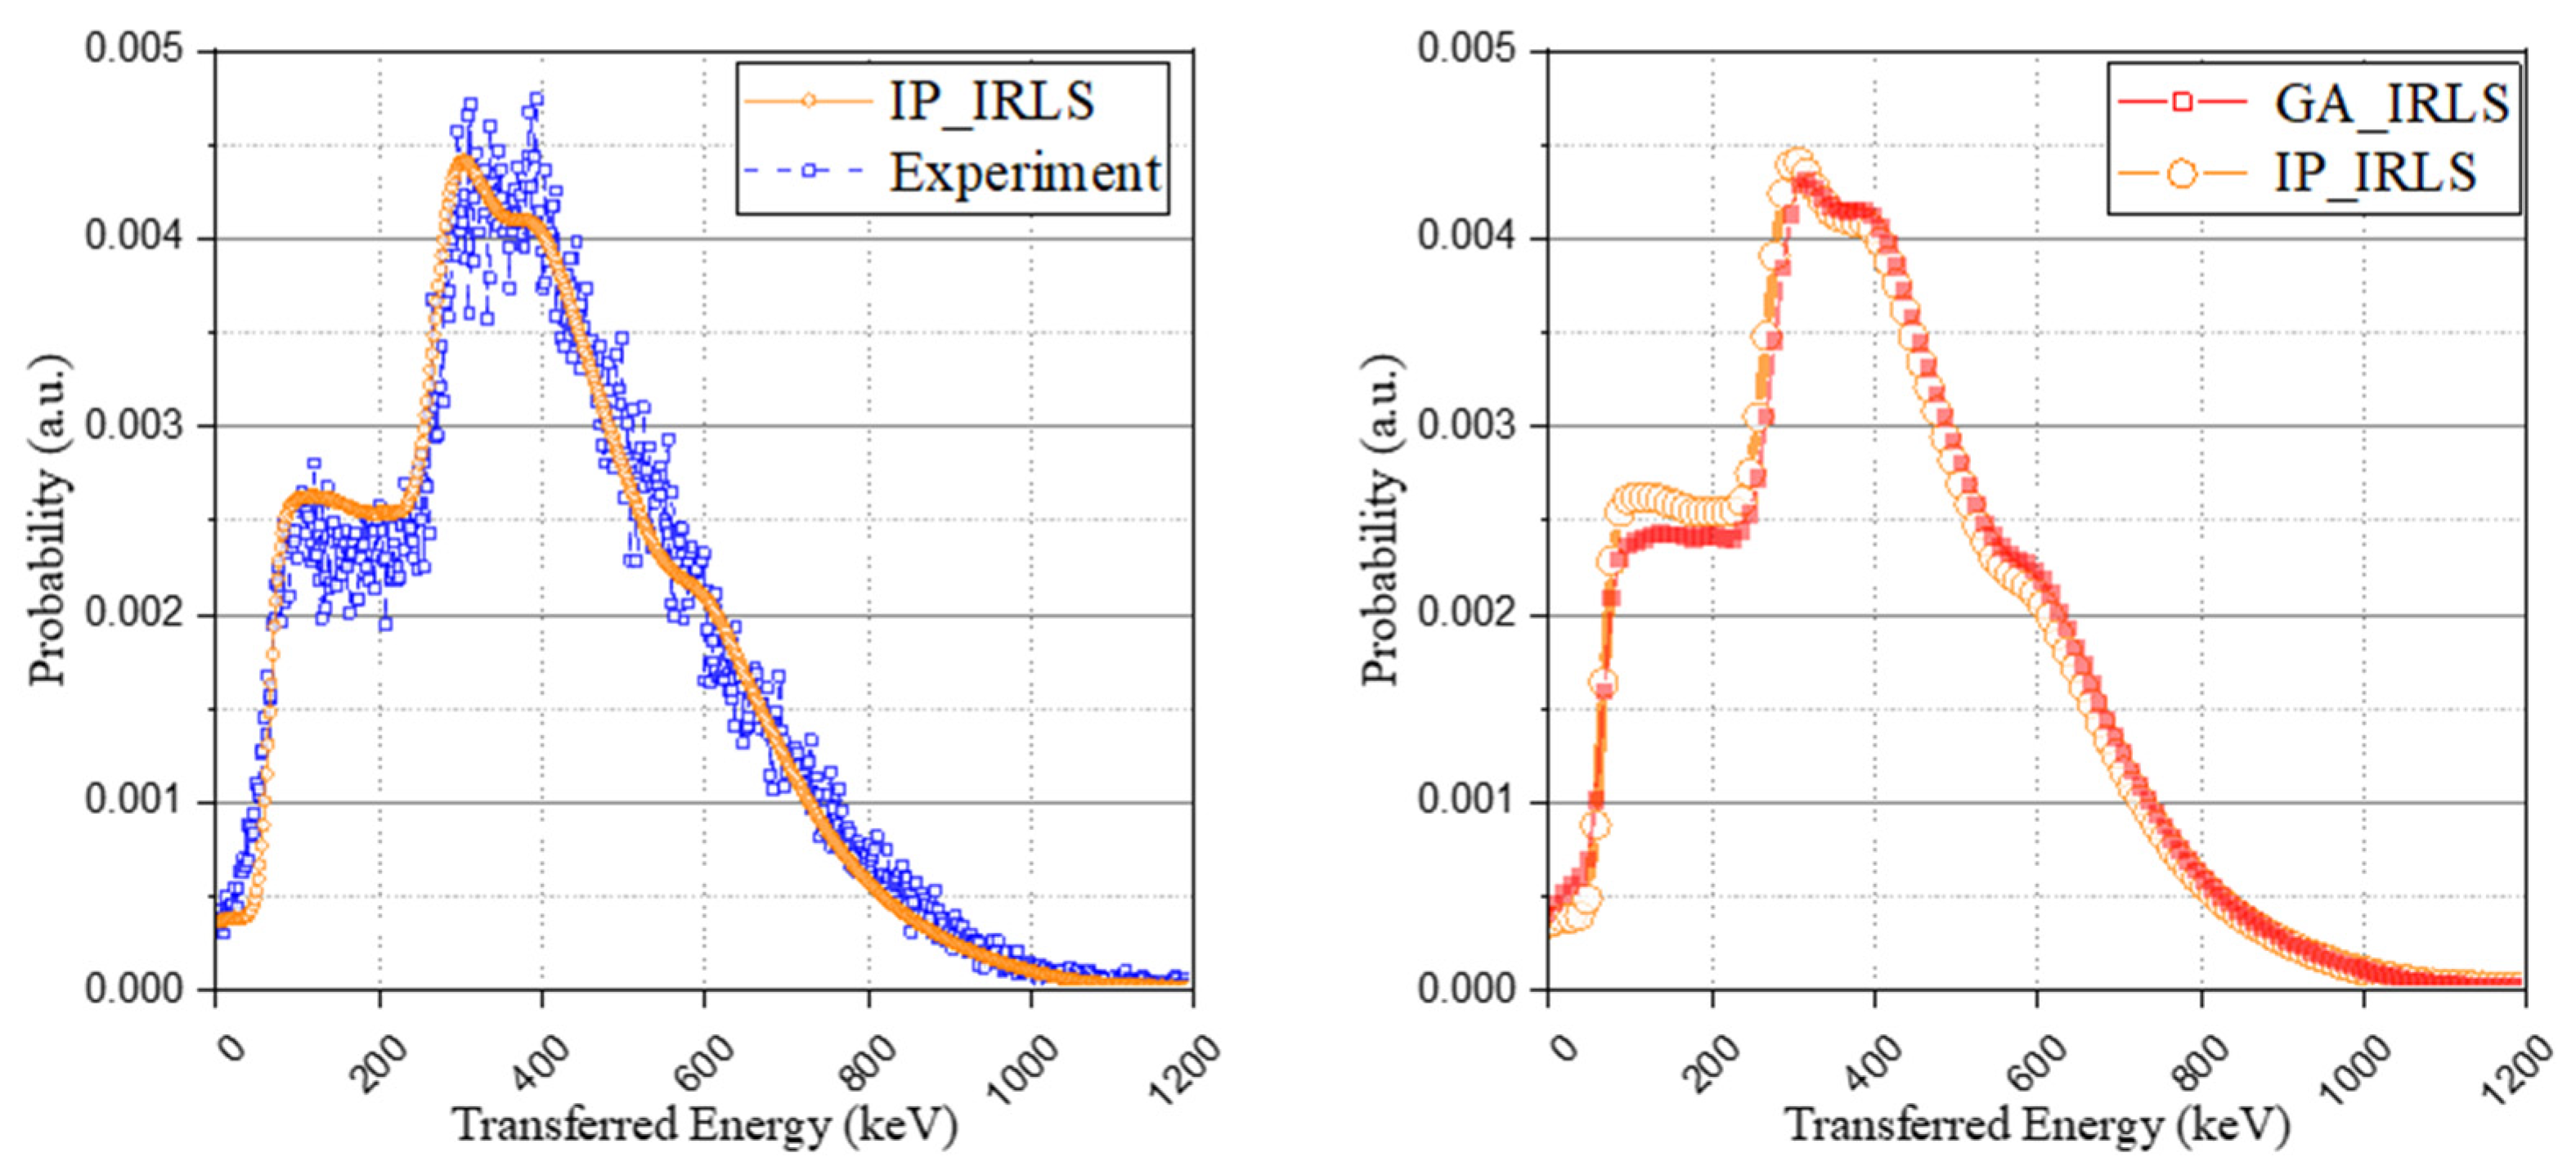
3.3.1. Genetic Algorithm-Based Spectrum Configuring

The experimental spectrum and base spectra were normalized to have identical areas and to be used as the input of the objective function. The objective function for optimizing the spectrum was solved using a genetic algorithm. The results derived from the calculation were the weight coefficients that minimize the root-mean square error (RMSE) of the simulated and experimental spectrum within specific conditions. Thereby, based on Equation (7), the IRL spectrum of the simulation was generated by the sum of the multiplication of the optimized weight coefficients and the corresponding base spectrum. As can be seen in Figure 6, the simulation spectrum was generated in good agreement with the experimental spectrum.

3.3.2. Interaction Probability-Based Spectrum Configuring

In addition to the approach of the optimization problem using the genetic algorithm, another method using relative intensity calculation with a Monte Carlo simulation to derive the possibility of the occurrence of each case was used to generate the IRL spectrum. The interaction probability and the escape probability of each radiation according to the isomer transition phase were taken into account (the results were set out in Table 5), and the method also used the same base spectrum as used in the optimization method and normalized it to have an identical area. As shown in Figure 7, although the retrospective method using the genetic algorithm provides a more detailed spectrum than the relative intensity calculation approach, both methods have good agreement with the experimental spectrum.
The probability of all cases may not be ideal during the experiment, unlike a simulation, and the following uncertainties can produce differences between the two approaches. Accordingly, this suggests that when the insufficient IRL spectrum is used for various purposes, the probability of the occurrence of each case can be extracted more precisely with optimization methods such as the genetic algorithm.

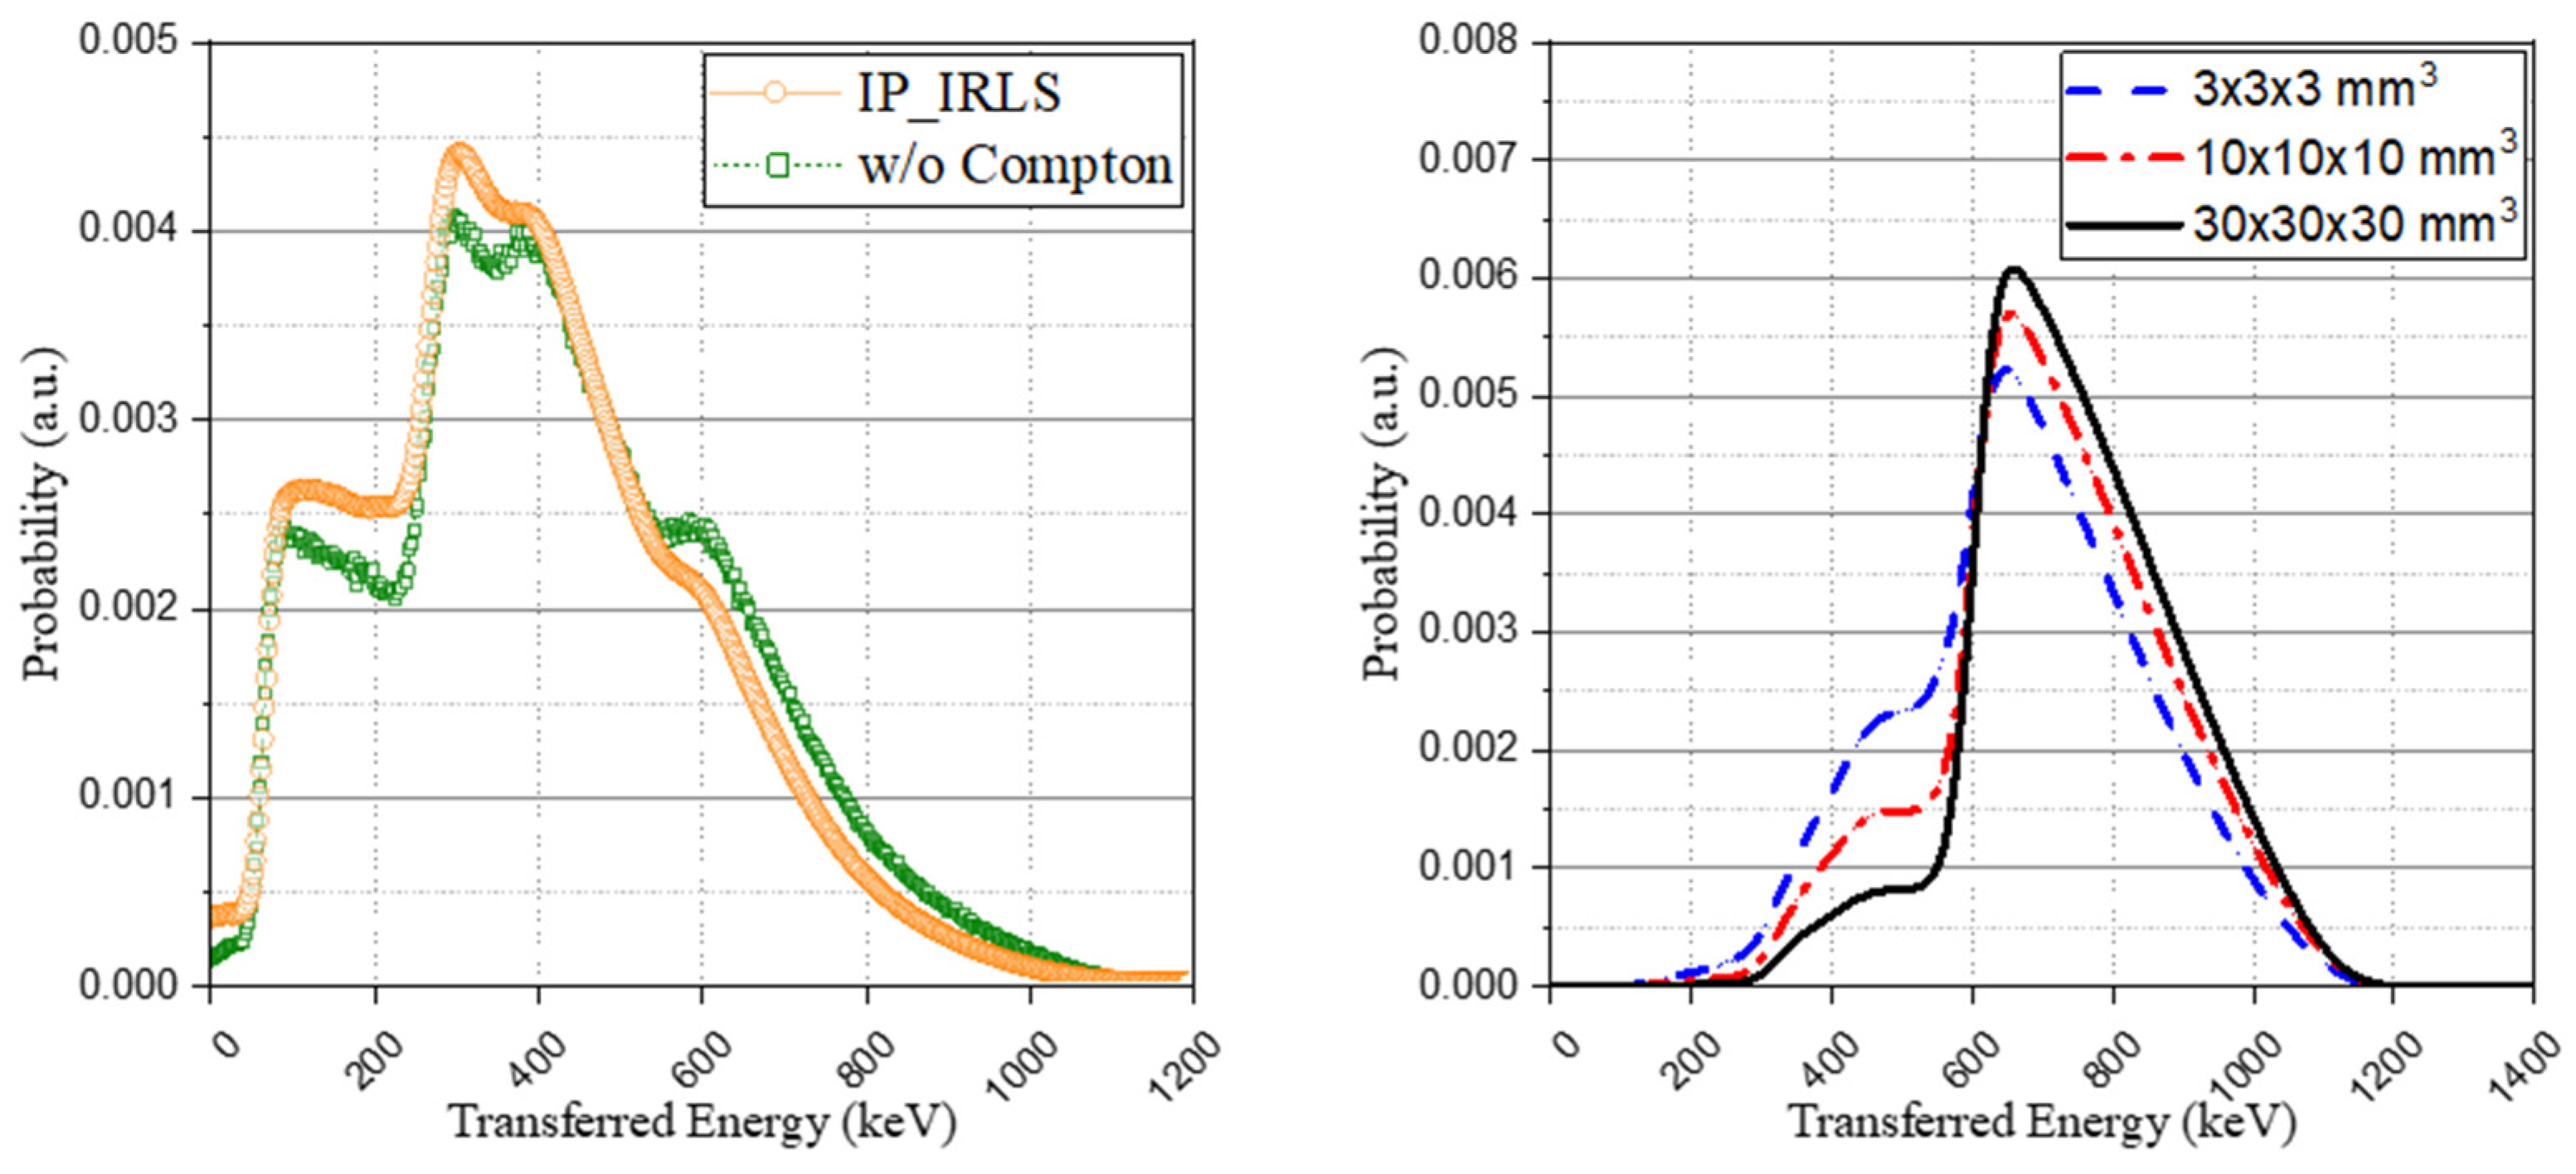
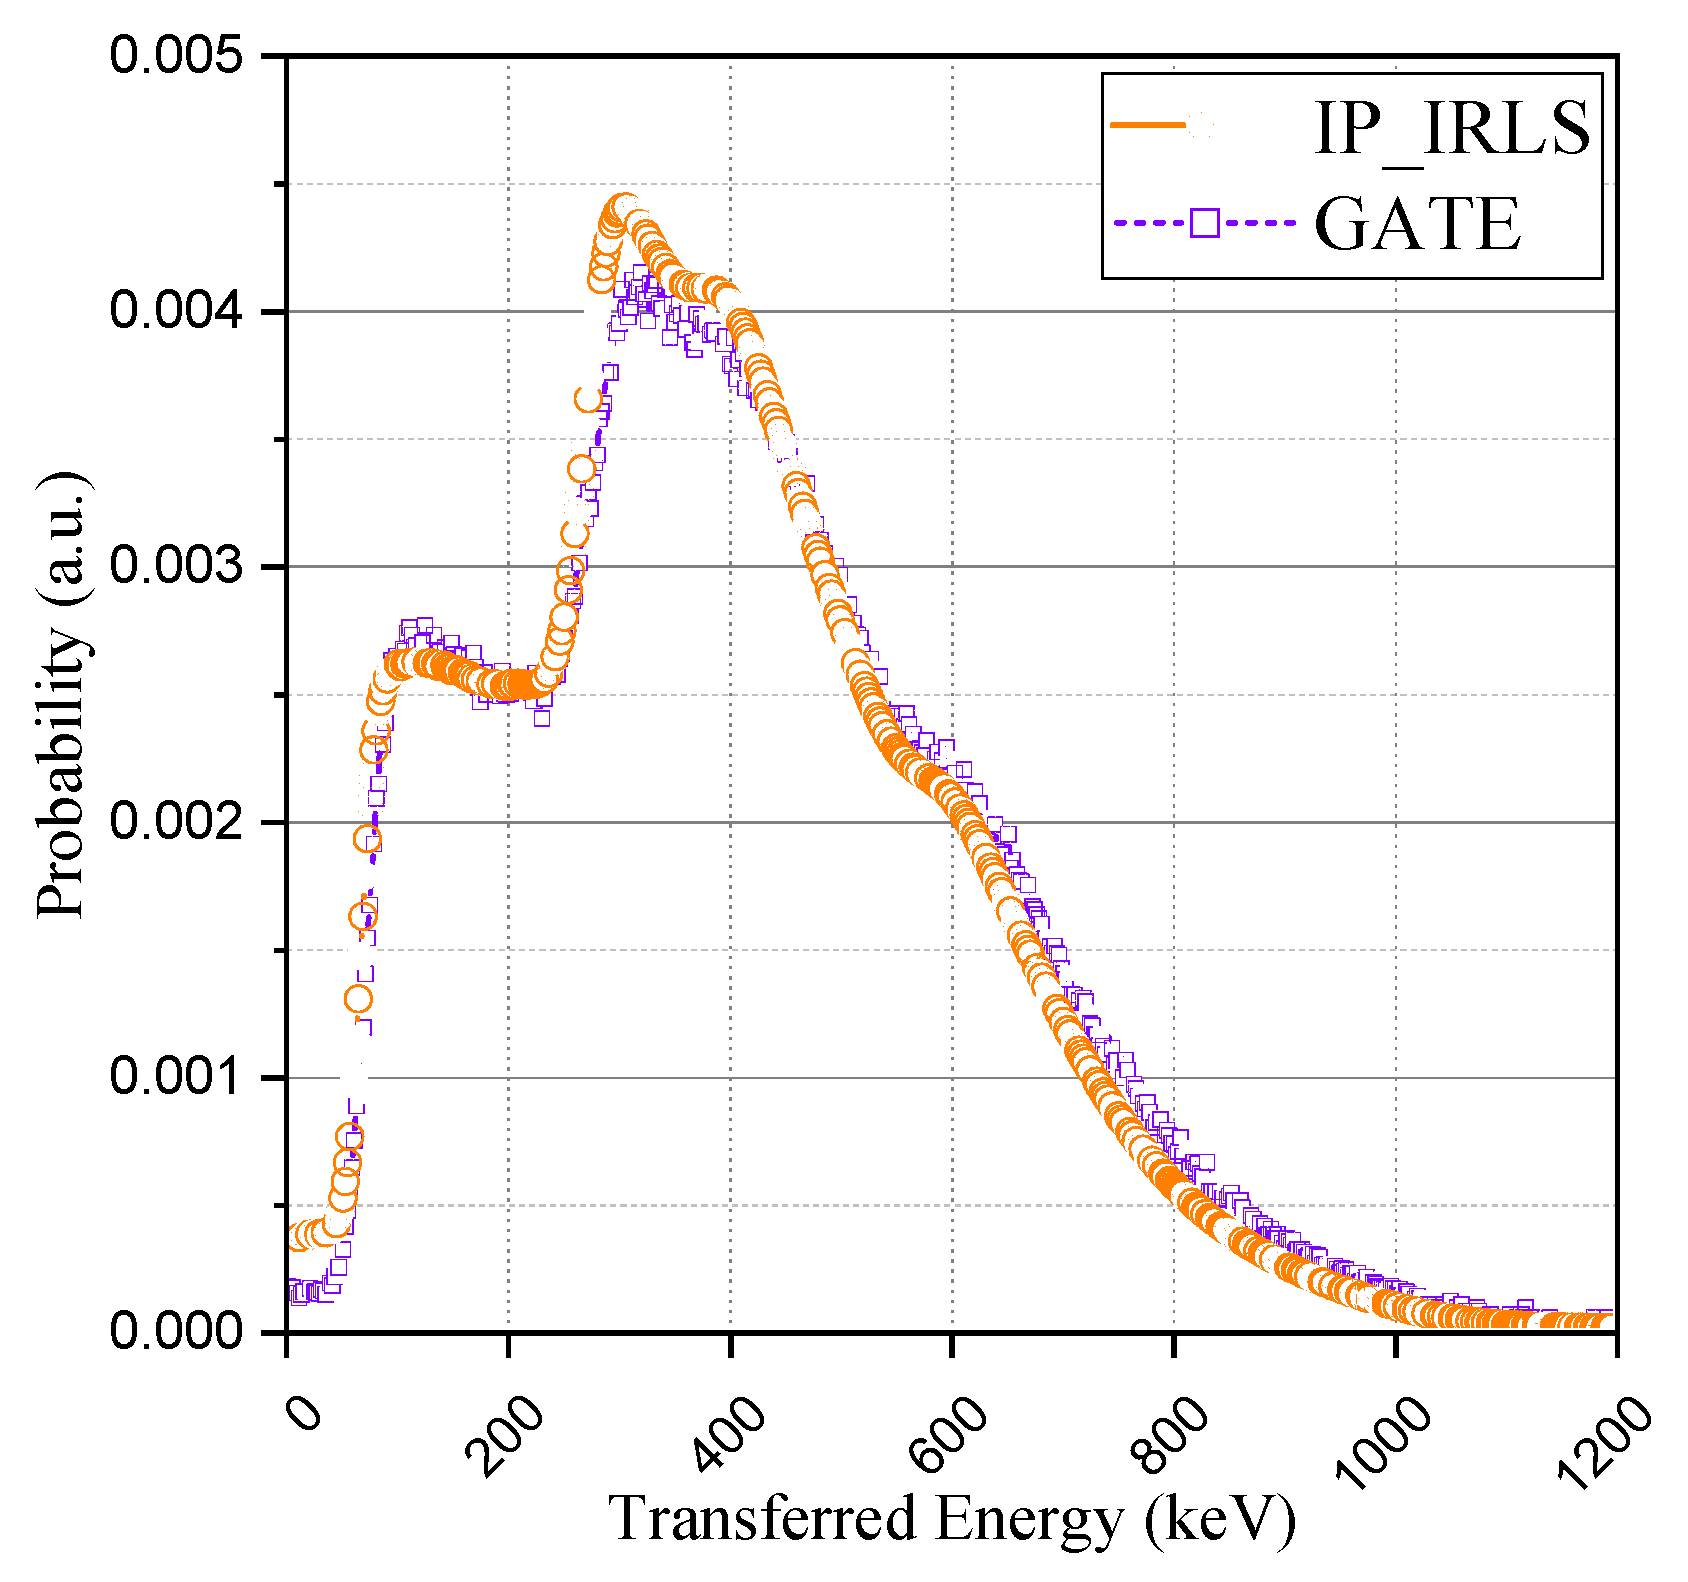
3.3.3. Comparison of the Proposed Method without the Compton Model and GATE Simulation Package

A comparison of the method without the Compton model, as proposed from previous studies, was performed. For this, the based spectra of Figure 5 and the weight coefficient derived from the interaction probability calculation were used to generate the IRL spectrum. Although a general agreement was achieved with both spectra, showing similar trends, as depicted in Figure 8 (left), there was a difference in the peaks of the spectrum. This is because, as shown in Figure 8 (right), the previous method that considers all the interactions from the isomer transition, including gamma ray emission or internal conversion as a total energy peak, overestimates the peak intensity when the scintillator structure becomes smaller.
Finally, the comparison was made using the 176Lu ion source of the GATE (Geant4 Application for Tomographic Emission) simulation package. Considering that the simulation package also does not include this intrinsic radioactivity by default in its Lutetium-based scintillator model [19], we evenly distributed the ion source in the crystal volume. The result from the GATE simulation was also discretized into an identical number of channels and normalized. As can be seen in Figure 9, the acquired spectrum with GATE was in good agreement with the proposed method and experimental spectrum. The results of the GATE simulation and the proposed method have something in common; the IRL spectrum can be acquired in consideration of Compton-scattering. It is a great advantage to be able to insert the intrinsic radioactivity of lutetium into the Monte Carlo simulation because it could be usefully utilized for various studies based on its radioactivity. This study derived the base spectra of the IRL spectrum considering the effect of Compton-scattering, which was a limitation of previous studies, instead of the IRL spectrum obtainable from the results of the experiment. We believe that these results will enable a more delicate approach in applications such as energy calibration and system performance evaluation.

4. Conclusions

A method for deriving the spectrum from intrinsic radiations of 176Lu considering the various physical process has been proposed. Base spectra configuring the IRL spectrum were generated by combining three isomer transition spectra and the spectrum of the β-particle. Using two approaches, namely the optimization problem and relative intensity calculation, contributions of each base spectrum were calculated. From the results, we confirm that both approaches using the proposed methods provide good agreement with the experiment.
A significant contribution of this study is the provision of a new approach to process the energy spectra induced by simultaneously detecting the multiple signals of mutually independent radiation interactions in the system. Formerly, a simple summation of the emitted energy from the isomeric transition was used to generate the spectrum formed by the interactions of the intrinsic radiation of lutetium. In this study, however, all the physical processes in the scintillator crystal were reflected using spectrum convolution. Furthermore, we confirmed that the structure of the scintillator not only causes differences in the contribution of the cases but also produces differences in the base spectra that make up each case.
As a result, base spectra, in which Compton-scattering was considered, were derived and the validation of the results was confirmed by the experiments and simulation package. We believe that this achievement could provide more detailed information for cases when the intrinsic radiation of 176Lu is utilized, such as in energy calibration and system performance evaluations without external radiation sources. Furthermore, this study suggests that necessary data can be extracted and utilized by solving optimization problems using appropriate constraints for the non-ideal IRL spectrum even when the data is insufficient.

Author Contributions

Conceptualization, K.K.; methodology, K.K.; software, K.K.; simulation, K.K. and H.C.; validation, K.K.; formal analysis, K.K.; investigation, K.K. and W.K.; resource, K.K., J.K. and J.H.; experiment, K.K., E.K., and H.C.; data curation, J.K., J.H. and E.K.; writing—original draft preparation, K.K.; writing—review and editing, K.K., Y.Y. and G.C.; visualization, K.K. and H.C.; supervision, G.C.; project administration, K.K., Y.Y. and G.C.; funding acquisition, Y.Y. and G.C. All authors have read and agreed to the published version of the manuscript.

Funding

This research was supported by the KAI-NEET Institute, the Korea Atomic Energy Research Institute funded by the Ministry of Science and ICT (2020M2C9A106861712), and Institute of Civil Military Technology Cooperation funded by the Defense Acquisition Program Administration and Ministry of Trade, Industry and Energy of Korean government (UM19207RD2).

Institutional Review Board Statement

Not applicable.

Informed Consent Statement

Not applicable.

Data Availability Statement

Not applicable.

Conflicts of Interest

The authors declare no conflict of interest.

References

  1. Melcher, C.L.; Schweitzer, J.S. A promising new scintillator: Cerium-doped lutetium oxyorthosilicate. Nucl. Instr. Meth. A 1992, 314, 212–214. [Google Scholar] [CrossRef]
  2. Lee, M.S.; Cates, J.W.; Kapusta, M.; Schmand, M.; Levin, C.S. Study of Lutetium-based scintillators for PET system design with 100-ps coincidence time resolution. In Proceedings of the 2019 IEEE Nuclear Science Symposium and Medical Imaging Conference, Manchester, UK, 26 October–2 November 2019. [Google Scholar]
  3. Goertzen, A.L.; Suk, J.Y.; Thompson, C.J. Imaging of Weak-Source Distributions in LSO-Based Small-Animal PET Scanners. J. Nucl. Med. 2007, 48, 1693–1698. [Google Scholar] [CrossRef] [Green Version]
  4. Yoshida, E.; Tashima, H.; Nishikido, F.; Murayama, H.; Yamaya, T. Reduction method for intrinsic random coincidence events from 176Lu in low activity PET imaging. Radiol Phys. Technol. 2014, 7, 235–245. [Google Scholar] [CrossRef]
  5. Huber, J.S.; Moses, W.W.; Jones, W.F.; Watson, C.C. Effect of 176Lu background on singles transmission for LSO-based PET cameras. Phys. Med. Biol. 2002, 47, 3535–3541. [Google Scholar] [CrossRef]
  6. Basunia, M.S. Nulcear data sheets for A = 176. Nucl. Data Sheets 2006, 107, 791–1026. [Google Scholar] [CrossRef]
  7. Enríquez-Mier-y-Terán, F.E.; Ortega-Galindo, A.S.; Murrieta-Rodríguez, T.; Rodríguez-Villafuerte, M.; Martínez-Dávalos, A.; Alva-Sánchez, H. Coincidence energy spectra due to the intrinsic radioactivity of LYSO scintillation crystals. EJNMMI Phys. 2020, 7, 21. [Google Scholar] [CrossRef] [PubMed] [Green Version]
  8. Conti, M.; Eriksson, L.; Rothfuss, H.; Sjoeholm, T.; Townsend, D.; Rosenqvist, G.; Carlier, T. Characterization of 176Lu background in LSO-based PET scanners. Phys. Med. Biol. 2017, 62, 3700–3711. [Google Scholar] [CrossRef]
  9. Wei, Q. Intrinsic radiation in lutetium based PET detector: Advantages and disadvantages. arXiv 2015, arXiv:1501.05372. [Google Scholar]
  10. Grodzicka, M.; Moszynski, M.; Szczesnlak, T.; Kapusta, M.; Szawlowski, M.; Wolski, D. Energy resolution of small scintillation detectors with SiPM light readout. J. Instrum. JINST 2013, 8, P02017. [Google Scholar] [CrossRef]
  11. Seidel, J.; Gandler, W.R.; Green, M.V. Characteristics of a pair of small field-of-view LSO scintillation cameras. IEEE Trans. Nucl. Sci. 1996, 43, 1968–1973. [Google Scholar] [CrossRef] [Green Version]
  12. Wang, L.; Wang, Y.; Wang, M. Energy calibration using scintillator background radiation for high-resolution PET detectors. Nucl. Instr. Meth. A 2020, 974, 164202. [Google Scholar] [CrossRef]
  13. Rothfuss, H.; Panin, V.; Moor, A.; Young, J.; Hong, I.; Michel, C.; Hamill, J.; Casey, M. LSO background radiation as a transmission source using time of flight. Phys. Med. Biol. 2014, 59, 5483–5500. [Google Scholar] [CrossRef]
  14. Conti, M.; Eriksson, L.; Hayden, C. Monitoring energy calibration drift using the scintillator background radiation. IEEE Trans. Nucl. Sci. 2011, 58, 687–694. [Google Scholar] [CrossRef]
  15. Alva-Sánchez, H.; Zepeda-Barrios, A.; Díaz-Martínez, V.D.; Murrieta-Rodríguez, T.; Rodríguez-Villafuerte, A.M.M. Understanding the intrinsic radioactivity energy spectrum from 176Lu in LYSO/LSO scintillation crystals. Sci. Rep. 2018, 8, 17310. [Google Scholar] [CrossRef]
  16. Lara-Camacho, V.M.; Hernández-Acevedo, E.M.; Alva-Sánchez, H.; Murrieta-Rodríguez, T.; Martínez-Dávalos, A.; Moranchel, M.; Rodríguez-Villafuerte, M. Experimental validation of the ANTS2 code for modelling optical photon transport in monolithic LYSO crystals. Phys. Med. 2021, 81, 215–226. [Google Scholar] [CrossRef] [PubMed]
  17. Yamamoto, S.; Horii, H.; Hurutani, M.; Matsumoto, K.; Senda, M. Investigation of single, random, and true counts from natural radioactivity in LSO-based clinical PET. Ann. Nucl. Med. 2005, 19, 109–114. [Google Scholar] [CrossRef]
  18. Afanaciev, K.G.; Artikov, A.M.; Baranov, V.Y.; Batouritski, M.A.; Budagov, J.A.; Davydov, Y.I.; Djilkibaev, R.M.; Emeliantchik, I.F.; Fedorov, A.A.; Glagolev, V.V.; et al. Response of LYSO:Ce scintillation crystals to low energy gamma-rays. Phys. Part. Nuclei Lett. 2015, 12, 319–324. [Google Scholar] [CrossRef]
  19. McIntosh, B.; Stout, D.B.; Goertzen, A.L. Validation of a GATE model of 176Lu intrinsic radioactivity in LSO PET system. IEEE Trans. Nucl. Sci. 2011, 58, 682–686. [Google Scholar] [CrossRef]
  20. Domínguez-Jiménez, D.Y.; Alva-Sánchez, H. Energy spectra due to the intrinsic radiation of LYSO/LSO scintillators for a wide range of crystal sizes. Med. Phys. 2021, 48, 1596–1607. [Google Scholar] [CrossRef]
  21. Park, H.M.; Hong, H.S.; Kim, J.H.; Joo, K.S. Development of a Portable Device Based Wireless Medical Radiation Monitoring System. J. Radiat. Prot. Res. 2014, 39, 150–158. [Google Scholar] [CrossRef]
  22. Taheri, M.A.; Askari, M. Taghan Sasanpour, Simulation of Gaussian energy broadening in gamma response of a LYSO array detector using a semi-empirical method. Eur. Phys. J. Plus 2017, 132, 384. [Google Scholar] [CrossRef]
  23. Jeon, B.; Kim, J.; Moon, M.; Cho, G. Parametric optimization for energy calibration and gamma response functionof plastic scintillation detectors using a genetic algorithm. Nucl. Instr. Meth. A 2019, 930, 8–14. [Google Scholar] [CrossRef]
  24. Li, H.; Love, P.E.; Ogunlana, S. Genetic algorithm compared to nonlinear optimization for labour and equipment assignment. Build. Res. Inf. 1998, 26, 322–329. [Google Scholar] [CrossRef]
  25. Grodzicka, M.; Moszynski, M.; Szczesniak, T.; Szawlowski, M.; Baszak, J. Characterization of 4 × 4 ch MPPC array in scintillation spectrometry. In Proceedings of the 2012 IEEE Nuclear Science Symposium and Medical Imaging Conference Record (NSS/MIC), Anaheim, CA, USA, 29 October–3 November 2012; pp. 327–330. [Google Scholar] [CrossRef]
  26. Moszynski, M.; Syntfeld-Kazuch, A.; Swiderski, L.; Grodzicka, M.; Wanowska, J.I.; Sibczynski, P.; Szczesniak, T. Energy resolution of scintillation detectors. Nucl. Instr. Meth. A 2016, 805, 25–35. [Google Scholar] [CrossRef]
  27. Knoll, G.F. Radiation Detection and Measurement, 4th ed.; Wiley: Hoboken, NJ, USA, 2010; ISBN 978-0-470-13148-0. [Google Scholar]
Figure 1. Decay scheme of 176Lu and energy spectrum of gamma rays by emitted by decay of 176Lu (measured using 2 inch × 2 inch NaI(Tl) scintillator).
Sensors 21 07040 g001
Figure 2. Detector system components (LYSO scintillation crystal (3 × 3 × 20 mm3), 8 × 8 array silicon photomultiplier (SiPM), and readout board) (left) and experimental setup with light-tight structures (right).
Sensors 21 07040 g002
Figure 3. Isomer transition I, II, and III spectra in the LYSO crystal with a size of 3 × 3 × 20 mm3.
Sensors 21 07040 g003
Figure 4. The base spectra obtained by two methods: Gaussian broadening after convolution (GBAC, blue solid line) and convolution after Gaussian broadening (CAGB, orange dot line).
Sensors 21 07040 g004
Figure 5. Base spectra of the proposed method (blue solid line) and base spectra of the previous method (red dot line) for configuring the IRL spectrum.
Sensors 21 07040 g005
Figure 6. Configuring the genetic algorithm-based IRL spectrum (GA_IRLS) with weighted base spectra (left) and the validation of the study with experimental IRL spectrum (right).
Sensors 21 07040 g006
Figure 7. Interaction probability-based IRL spectrum (IP_IRLS) with experimental IRL spectrum (left) and comparison of the two approaches (right).
Sensors 21 07040 g007
Figure 8. Comparison of the method without the Compton model (previous studies) (left) and base spectra of the eighth case depending on crystal structures (right).
Sensors 21 07040 g008
Figure 9. Comparison with GATE simulation (176Lu ion source).
Sensors 21 07040 g009
Table 1. The source pathway by combinations of the isomer transition pathway.
Source PathwayCases of Gamma Ray Emission (γ) or Internal Conversion (IC) by Isomer Transition (IT)
307 keV (ITI)202 keV (ITII)88 keV (ITIII)
1γ1γ2γ3
2γ1γ2IC3
3γ1IC2γ3
4γ1IC2IC3
5IC1γ2γ3
6IC1γ2IC3
7IC1IC2γ3
8IC1IC2IC3
Table 2. The cases of energy deposition by the state of ionizing radiation from the isomer transition.
Energy Deposition CasesBeta ParticleState of Ionizing Radiation
Isomer Transition IIsomer Transition IIIsomer Transition III
1InteractionInteractionInteractionEscape
2InteractionInteractionInteractionInteraction
3InteractionInteractionEscapeEscape
4InteractionInteractionEscapeInteraction
5InteractionEscapeInteractionEscape
6InteractionEscapeInteractionInteraction
7InteractionEscapeEscapeEscape
8InteractionEscapeEscapeInteraction
Table 3. Total photo-peak ratio by isomer transitions.
Isomer Transition PathwayIsomer Transition IIsomer Transition IIIsomer Transition III
γ1IC1γ2IC2γ3IC3
Yield (Y)0.9310.0690.7800.2200.1460.854
Interaction probability (P)0.2241.0000.3991.0000.8631.000
Photo-peak efficiency (E)0.6411.0000.8181.0000.9091.000
Total photo-peak ratio (T)0.7300.8930.988
Table 4. Dependency of the total photo-peak ratio according to the crystal structures.
Crystal SizeIsomer Transition IIsomer Transition IIIsomer Transition III
3 × 3 × 3 mm30.7170.8800.985
10 × 10 × 10 mm30.8090.9410.995
30 × 30 × 30 mm30.9140.9780.998
Table 5. Relative intensity calculation by energy deposition case for configuring the spectrum.
Isomer Transition IIsomer Transition IIIsomer Transition III
Interaction0.27750.53100.9800
Escape0.72250.46880.020
Energy deposition casesProbability
10.00677
20.33182
30.00767
40.00260
50.37632
60.12745
70.00294
80.14443
Sum1.00000
Publisher’s Note: MDPI stays neutral with regard to jurisdictional claims in published maps and institutional affiliations.

