Piezoelectric Sensor for the Monitoring of Arterial Pulse Wave: Detection of Arrhythmia Occurring in PAC/PVC Patients


Abstract
:1. Introduction
Our Contribution
2. Materials and Designs
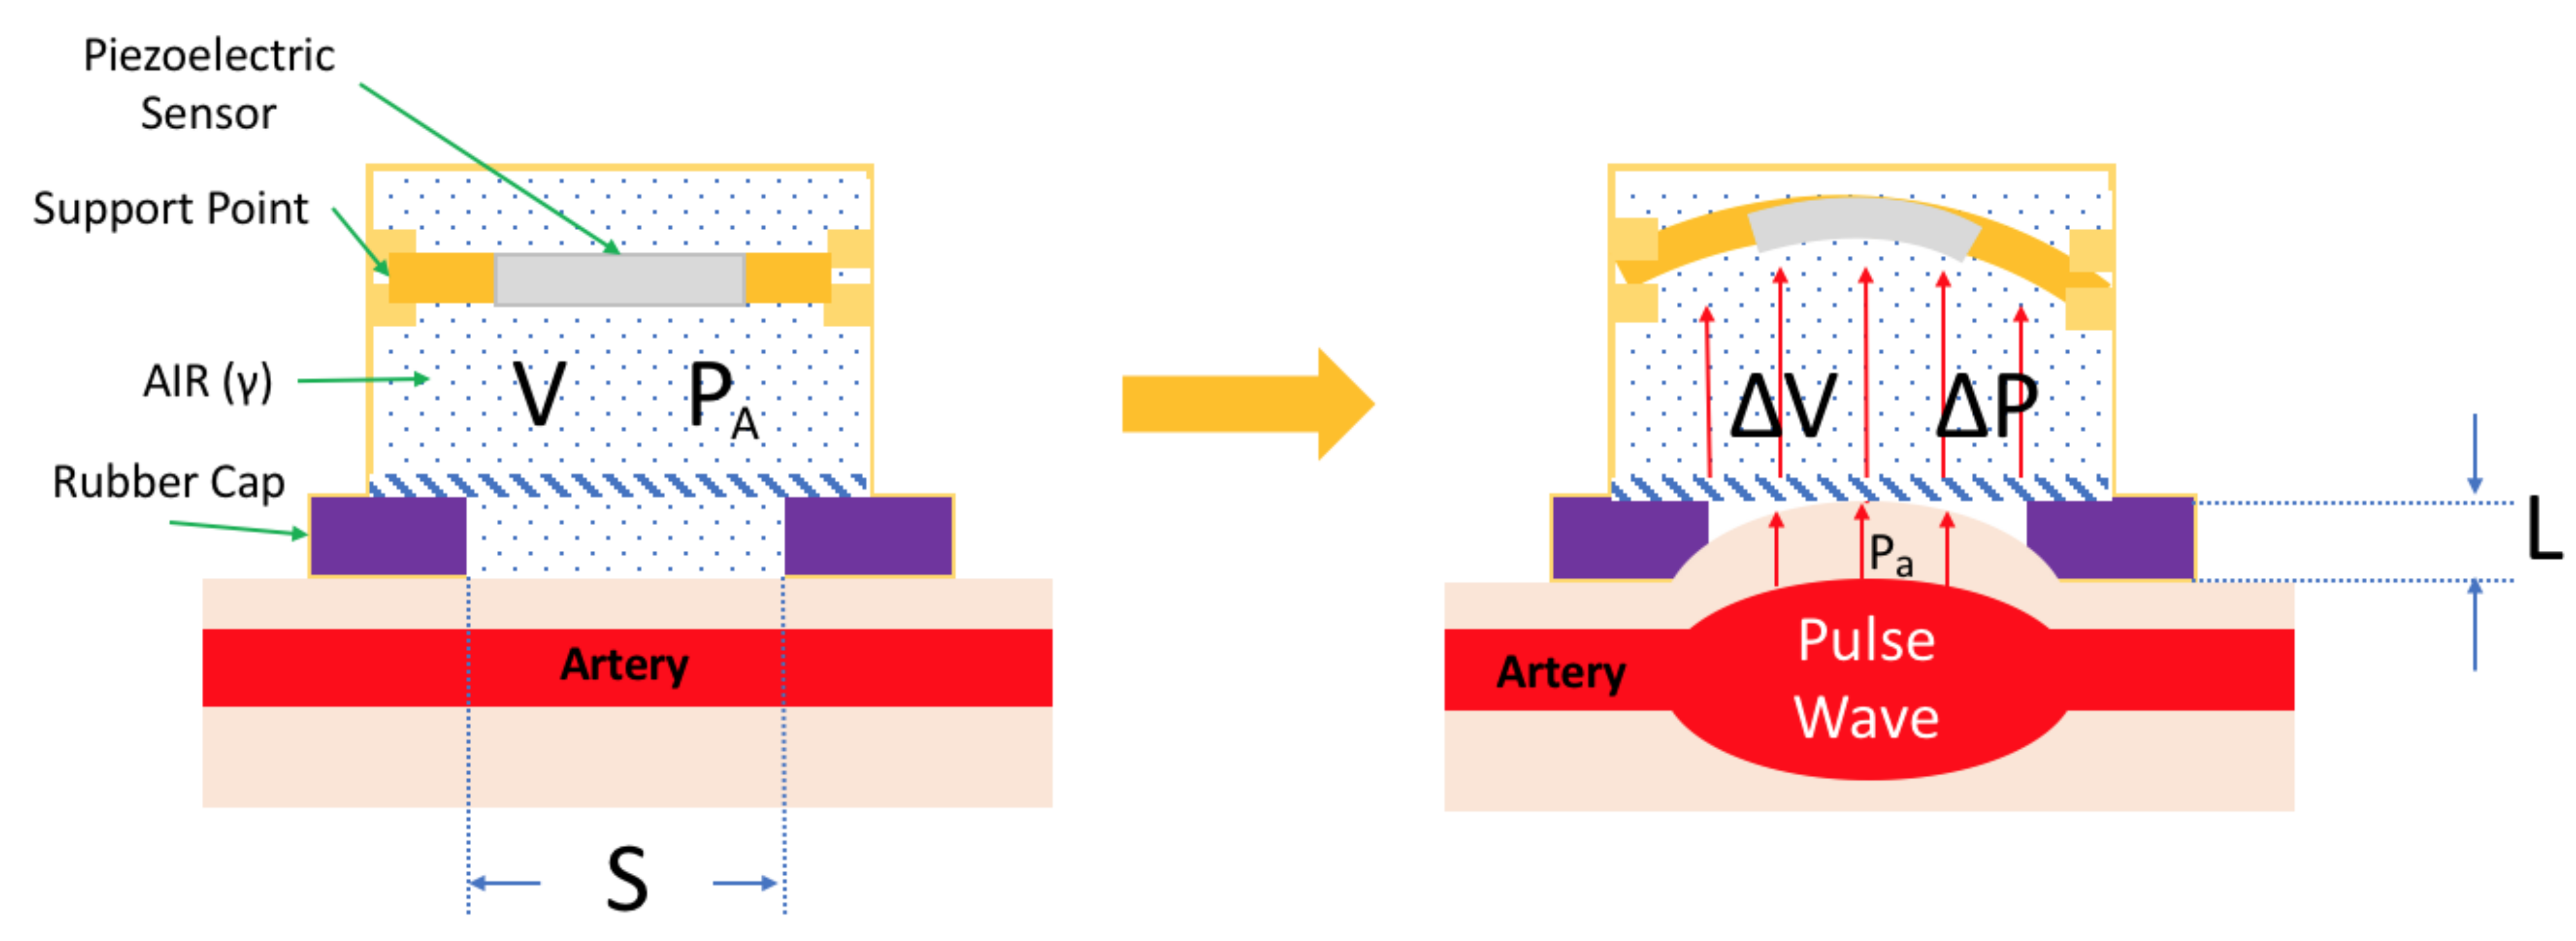
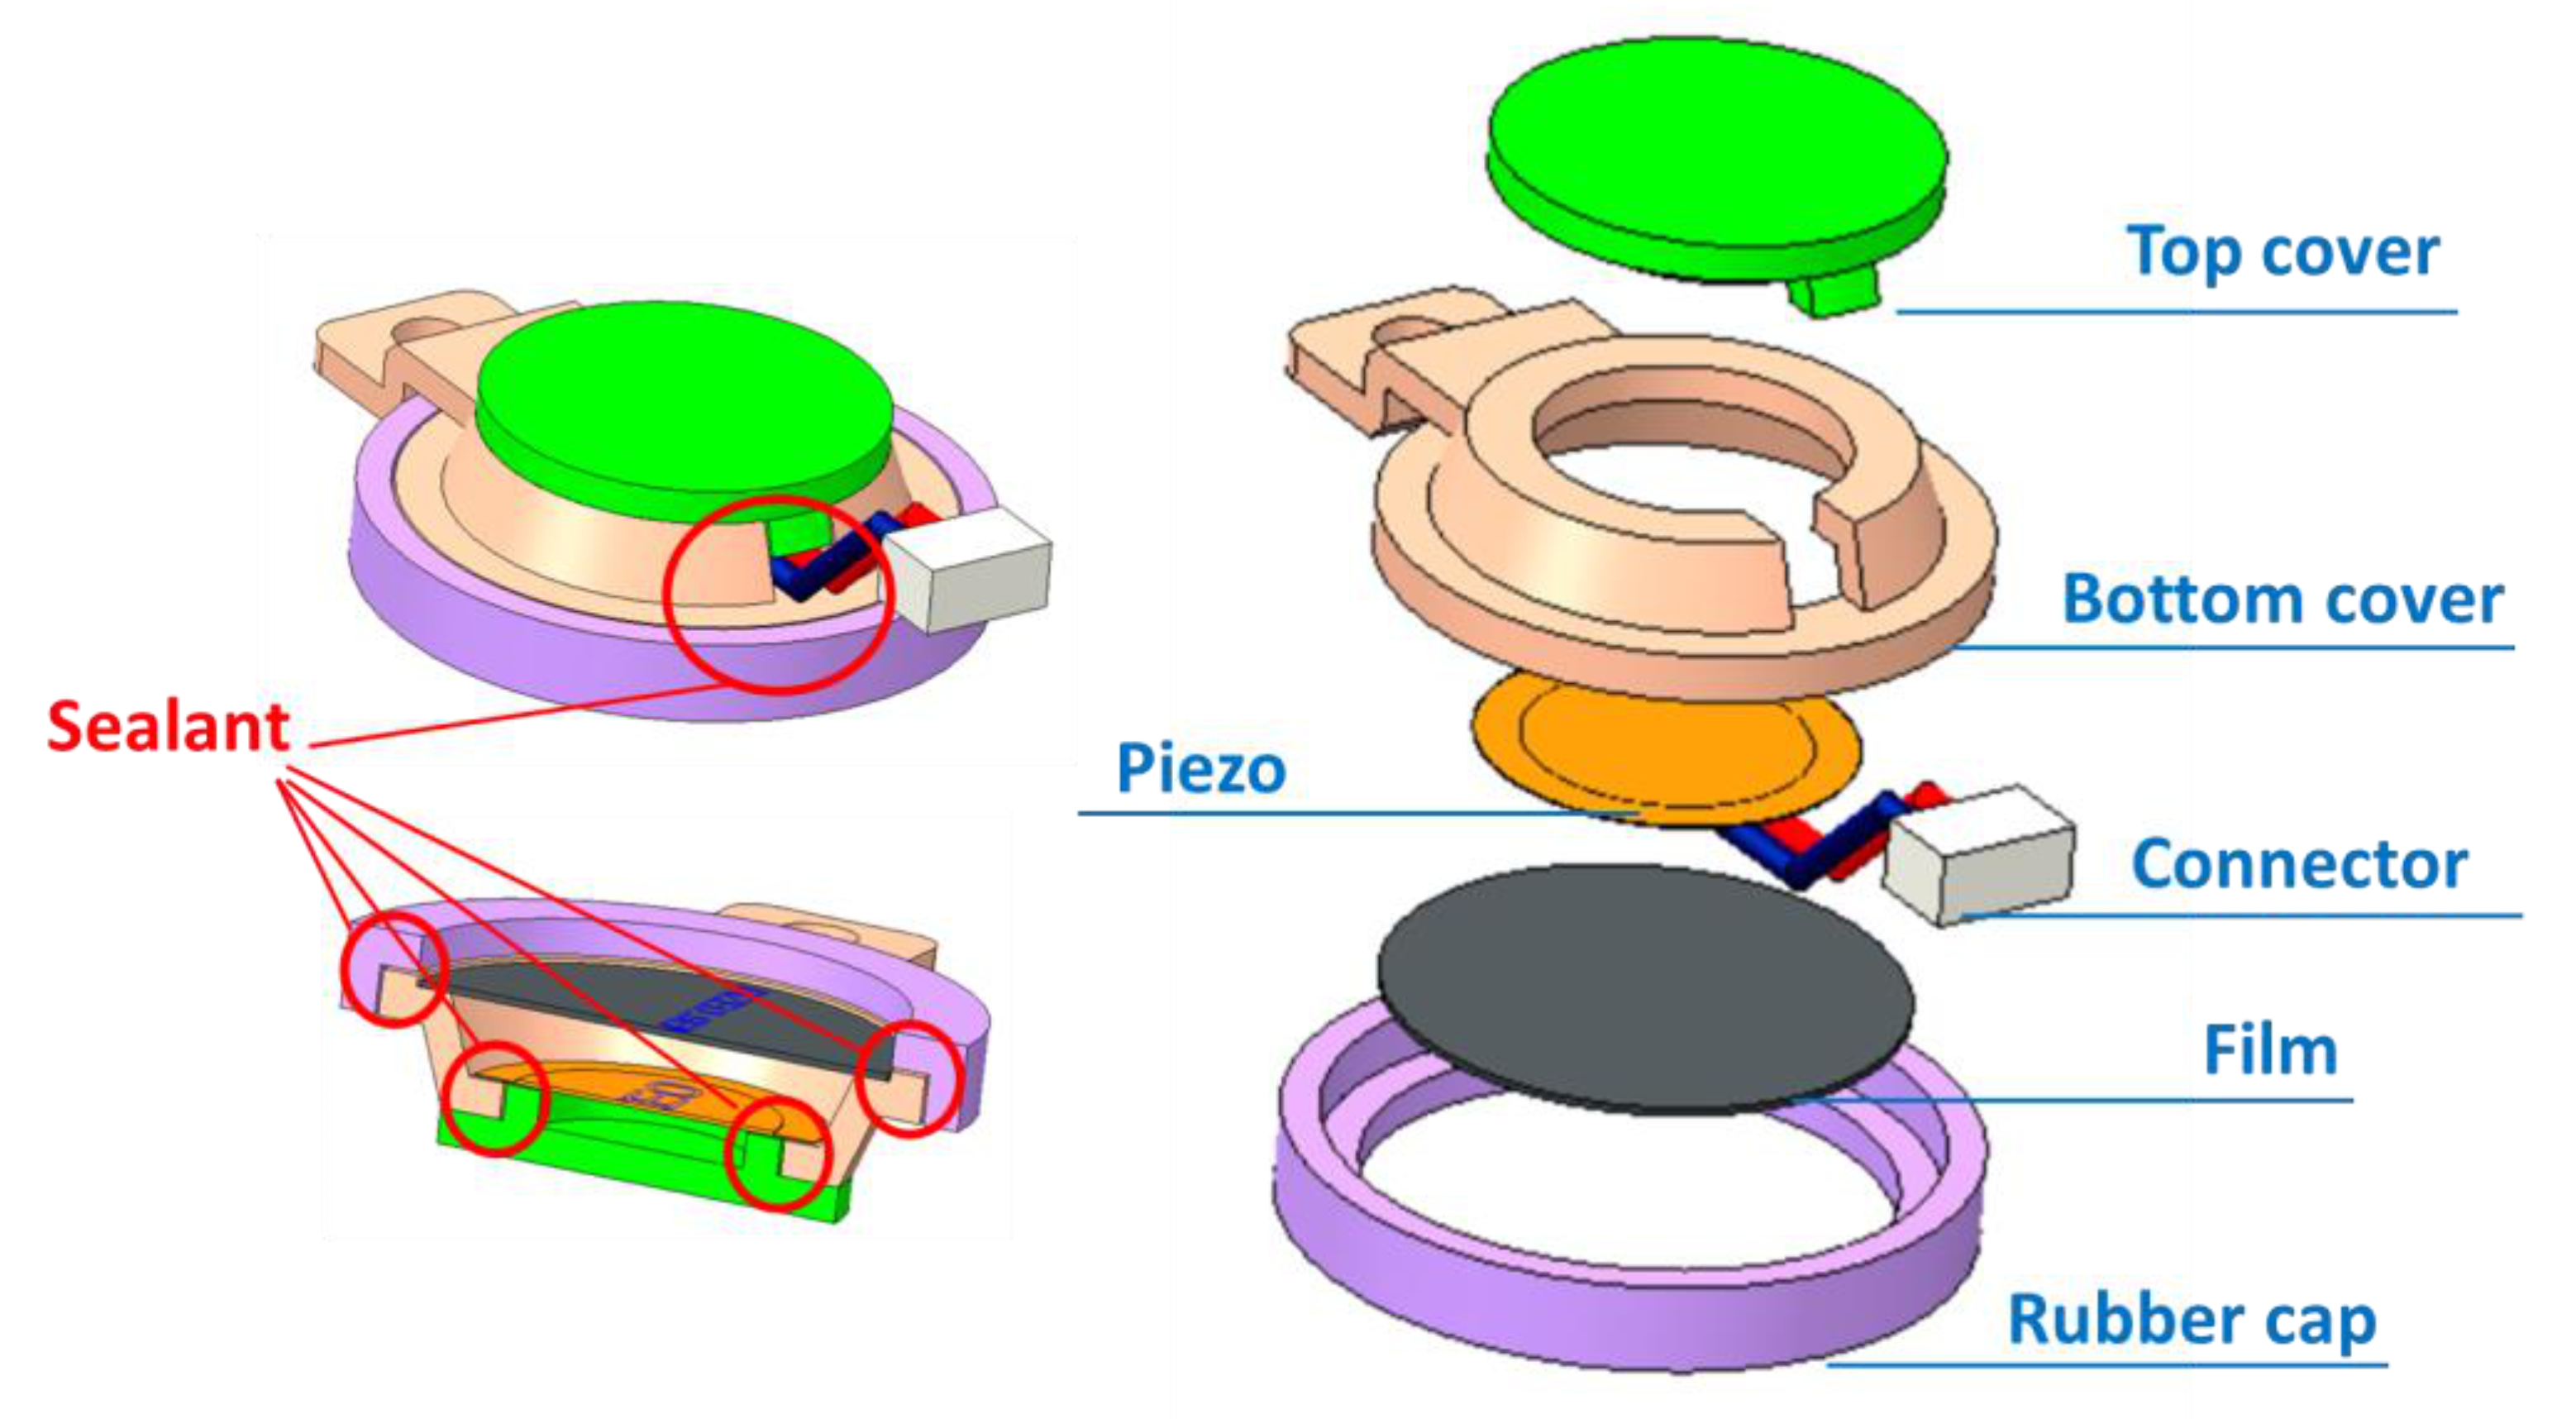
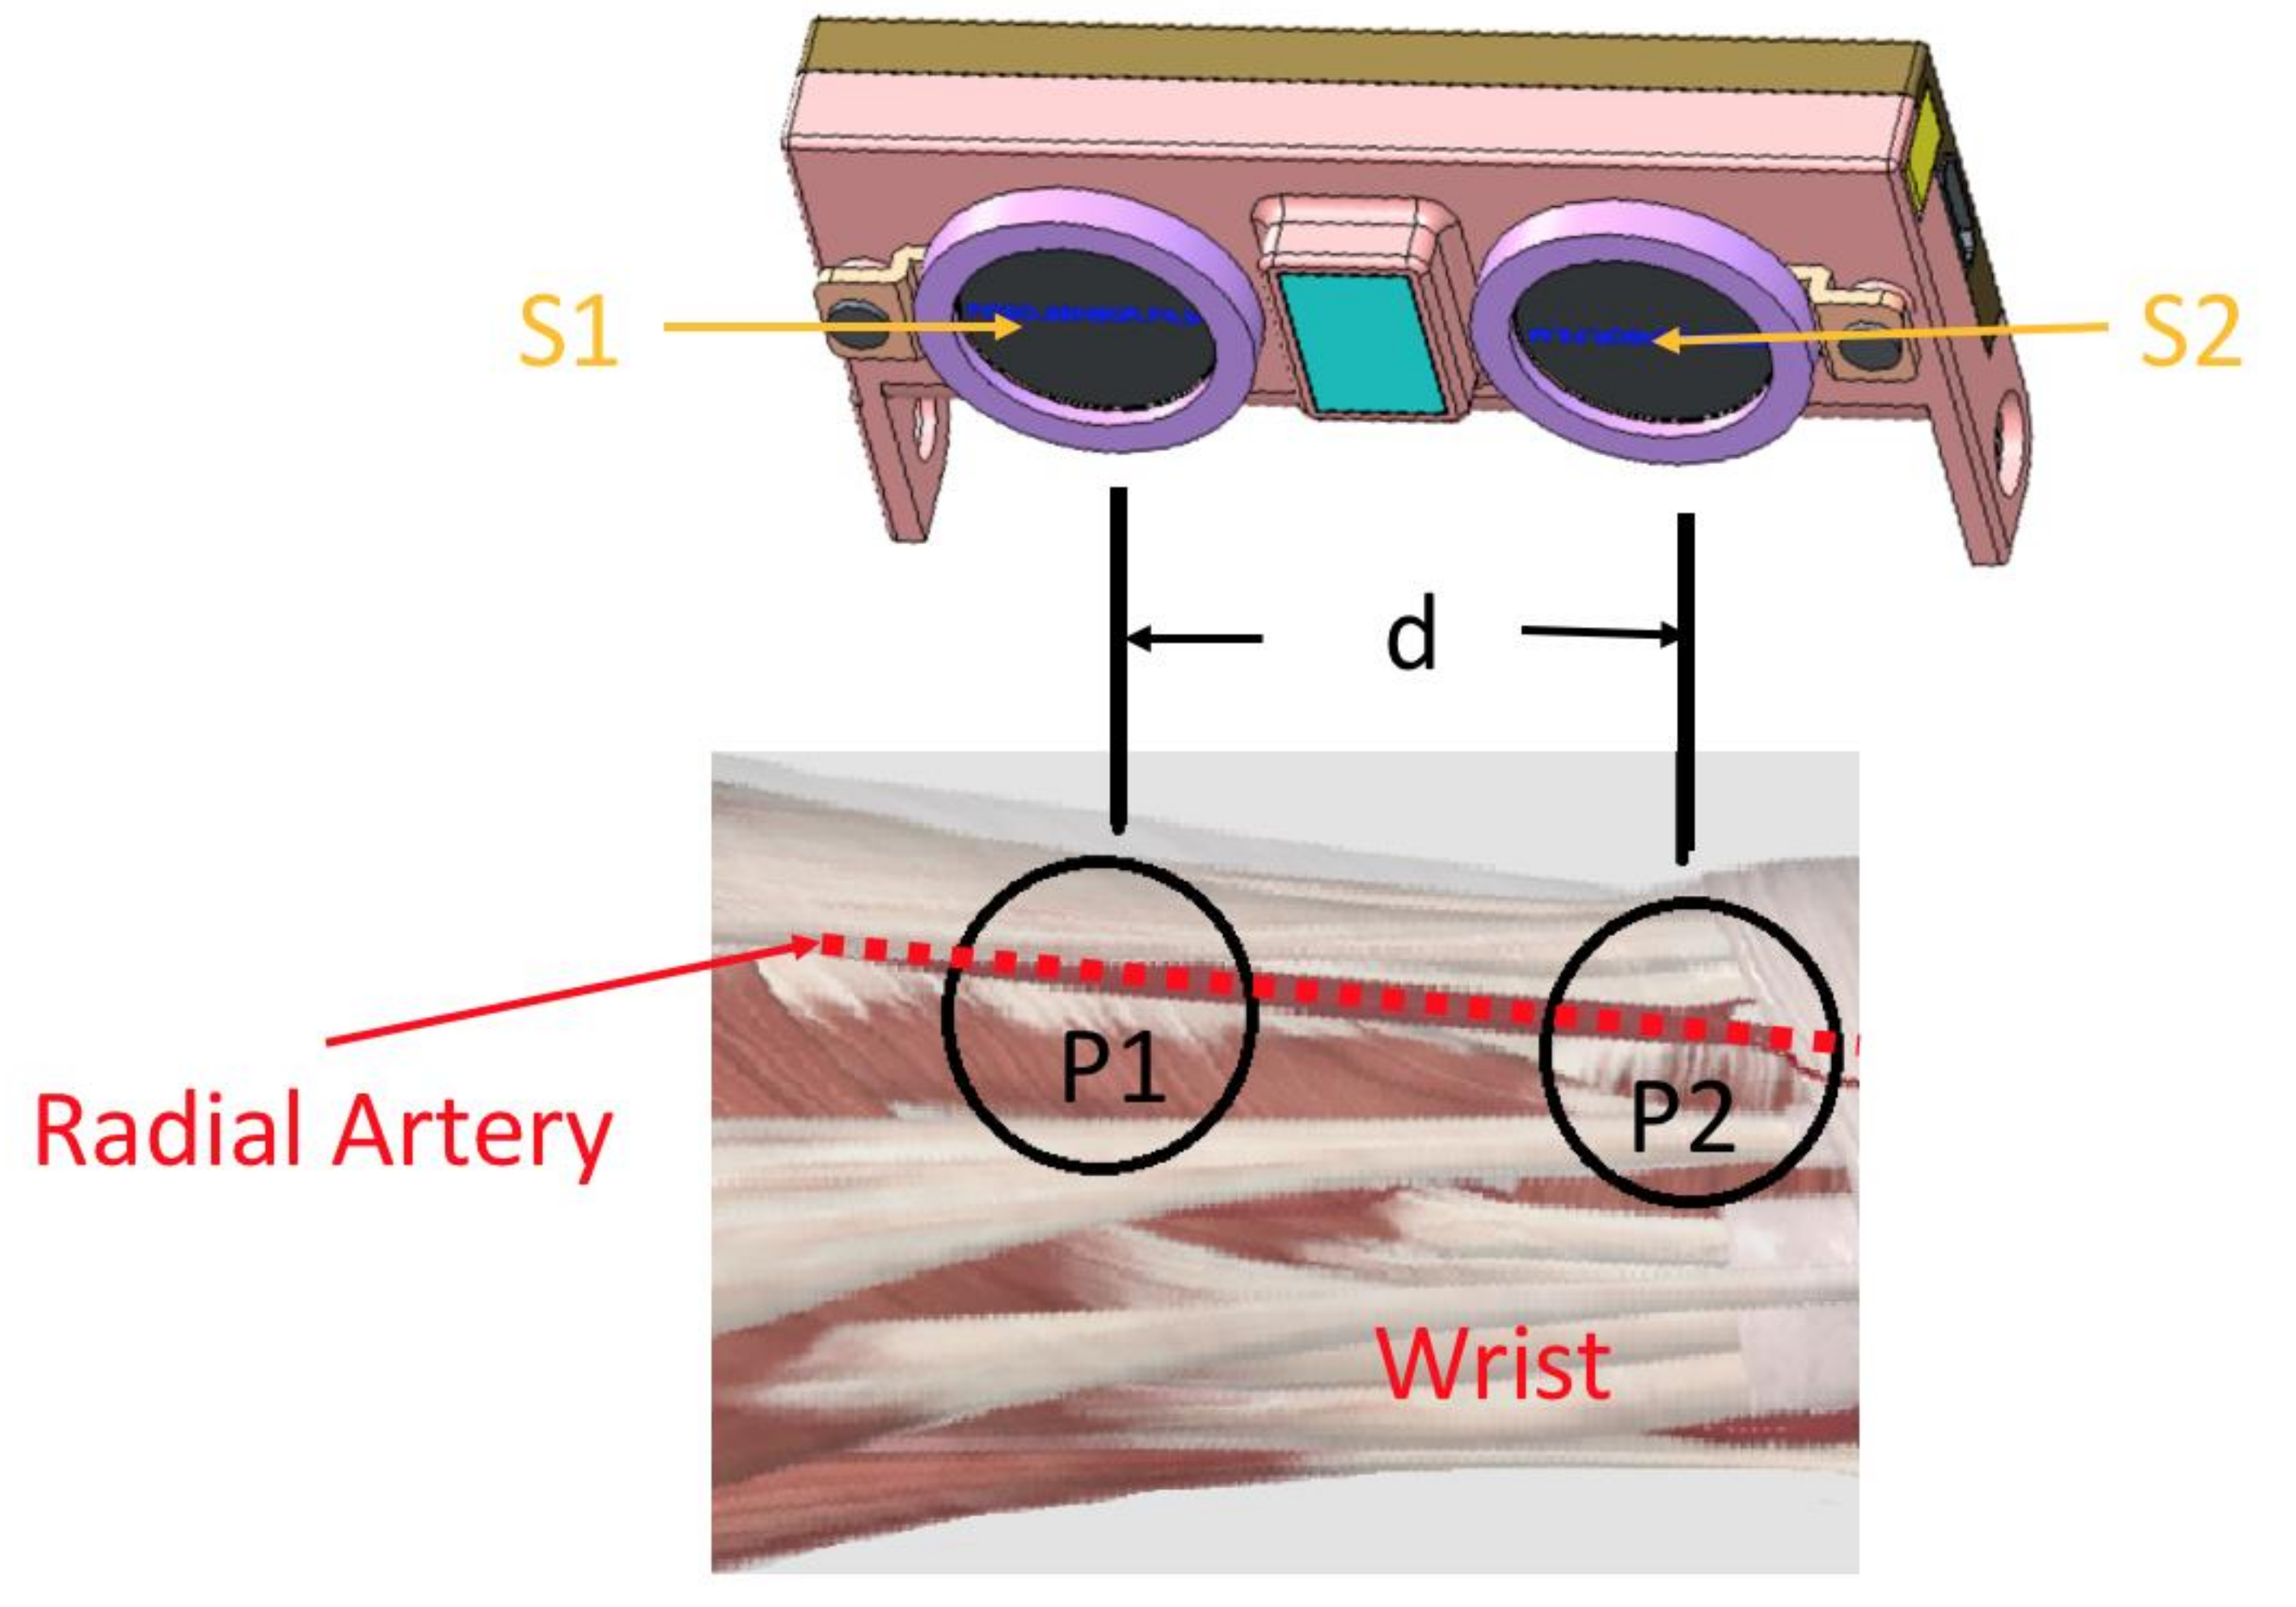
2.1. Mechanical Design
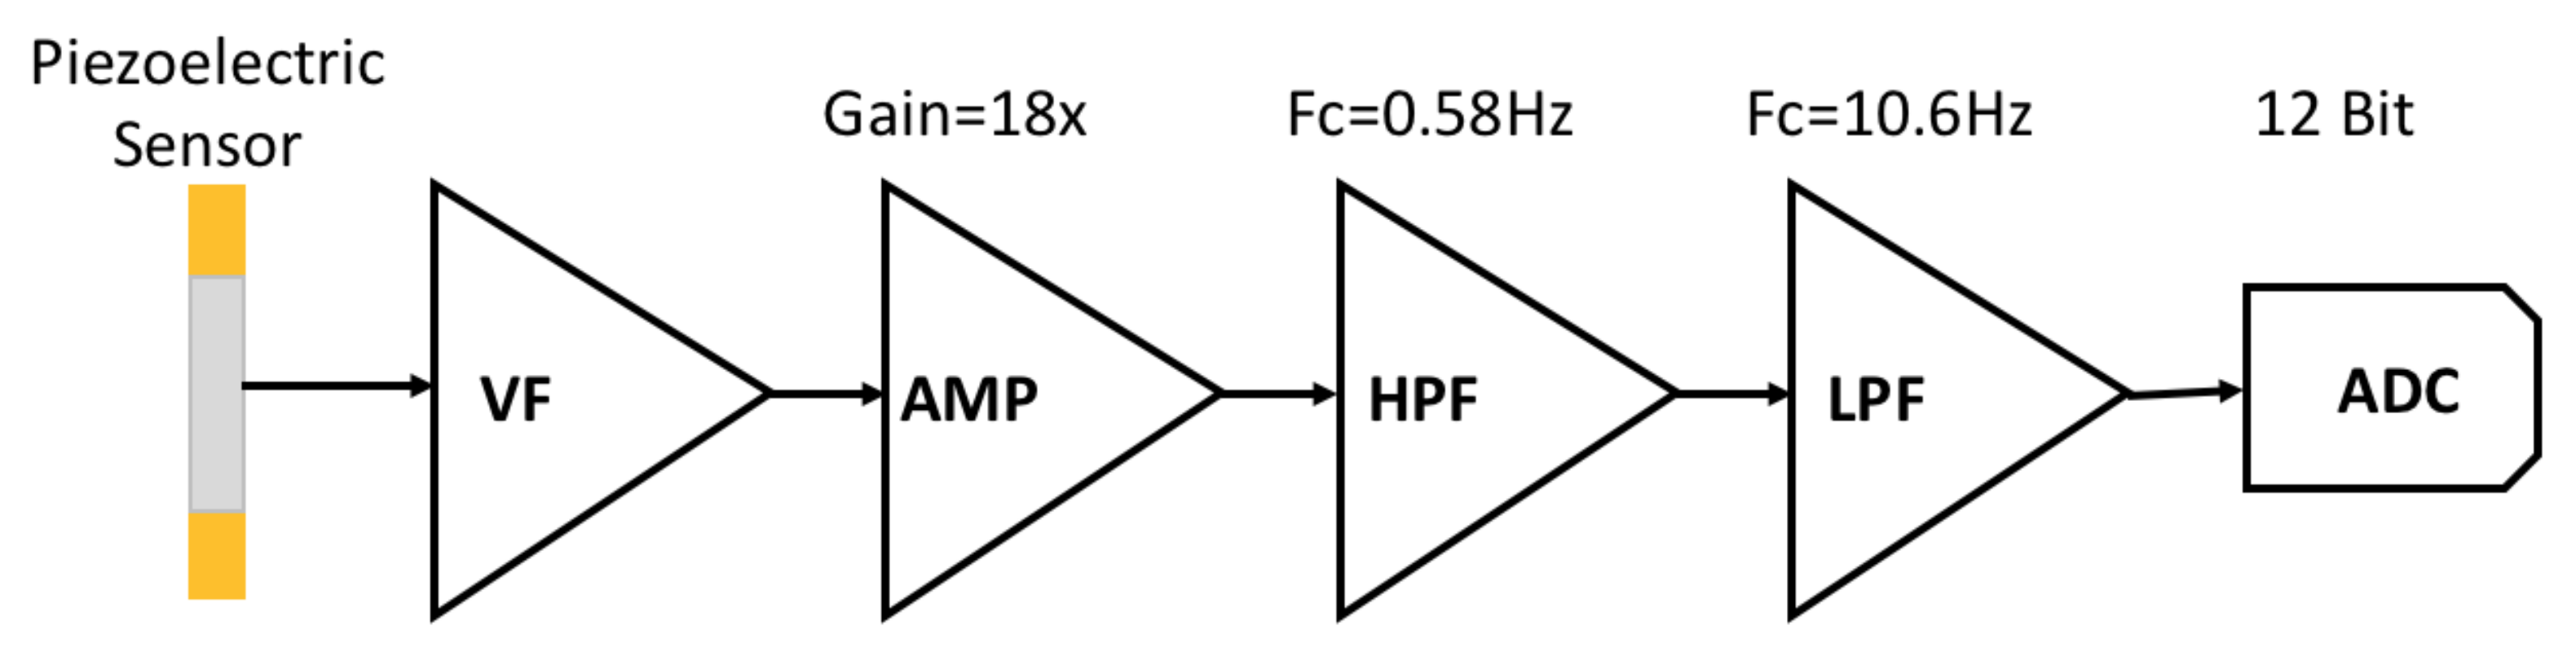
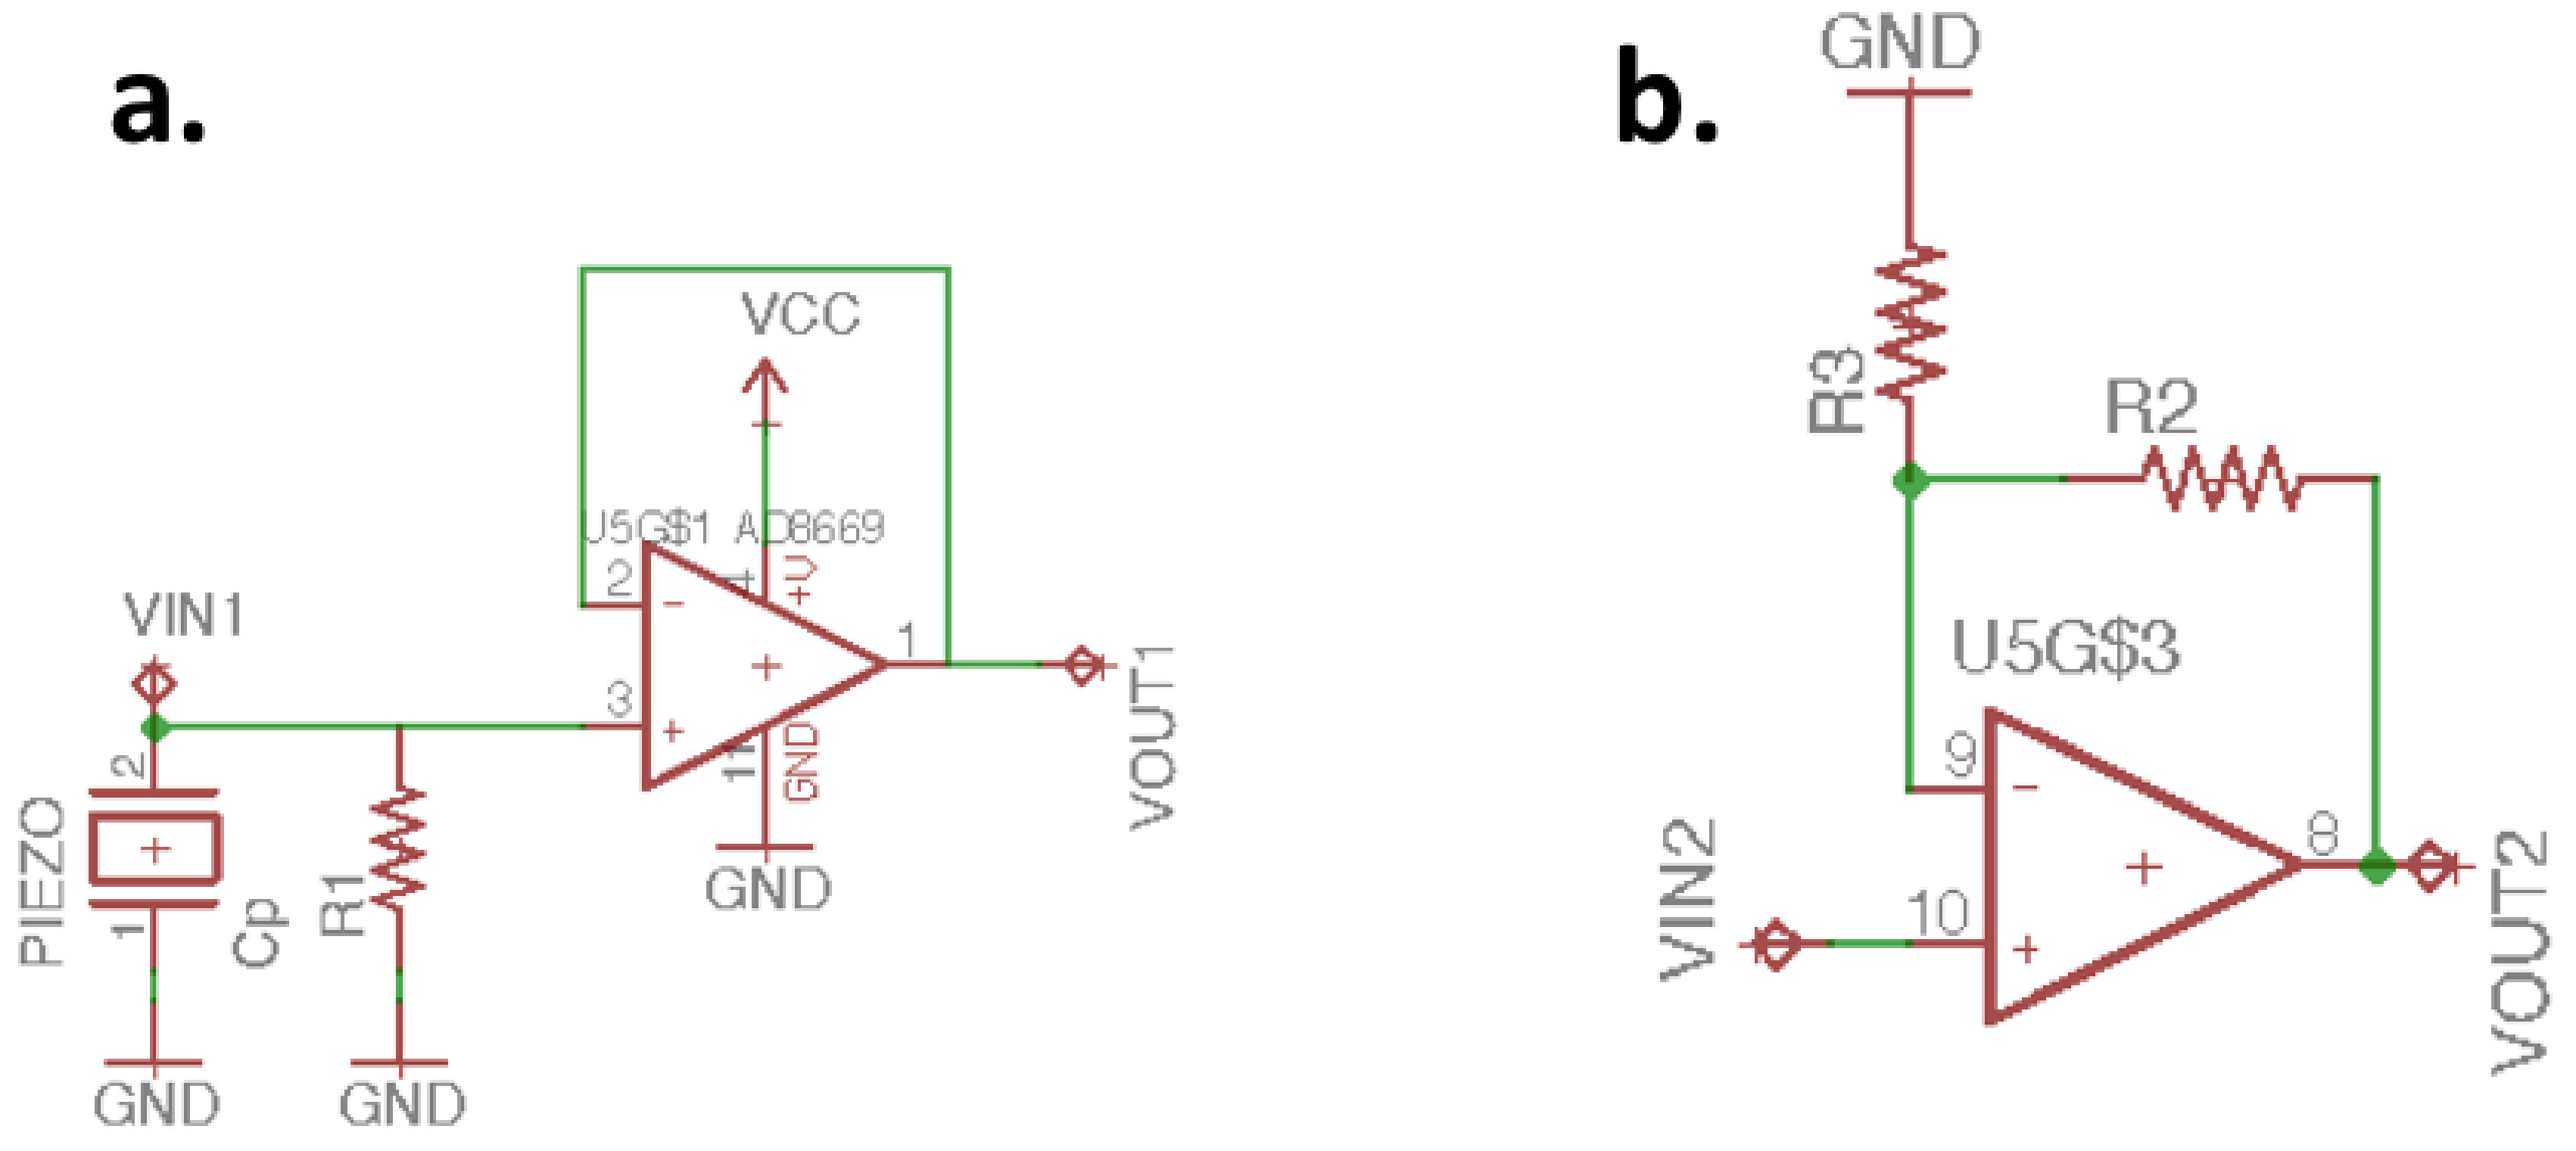
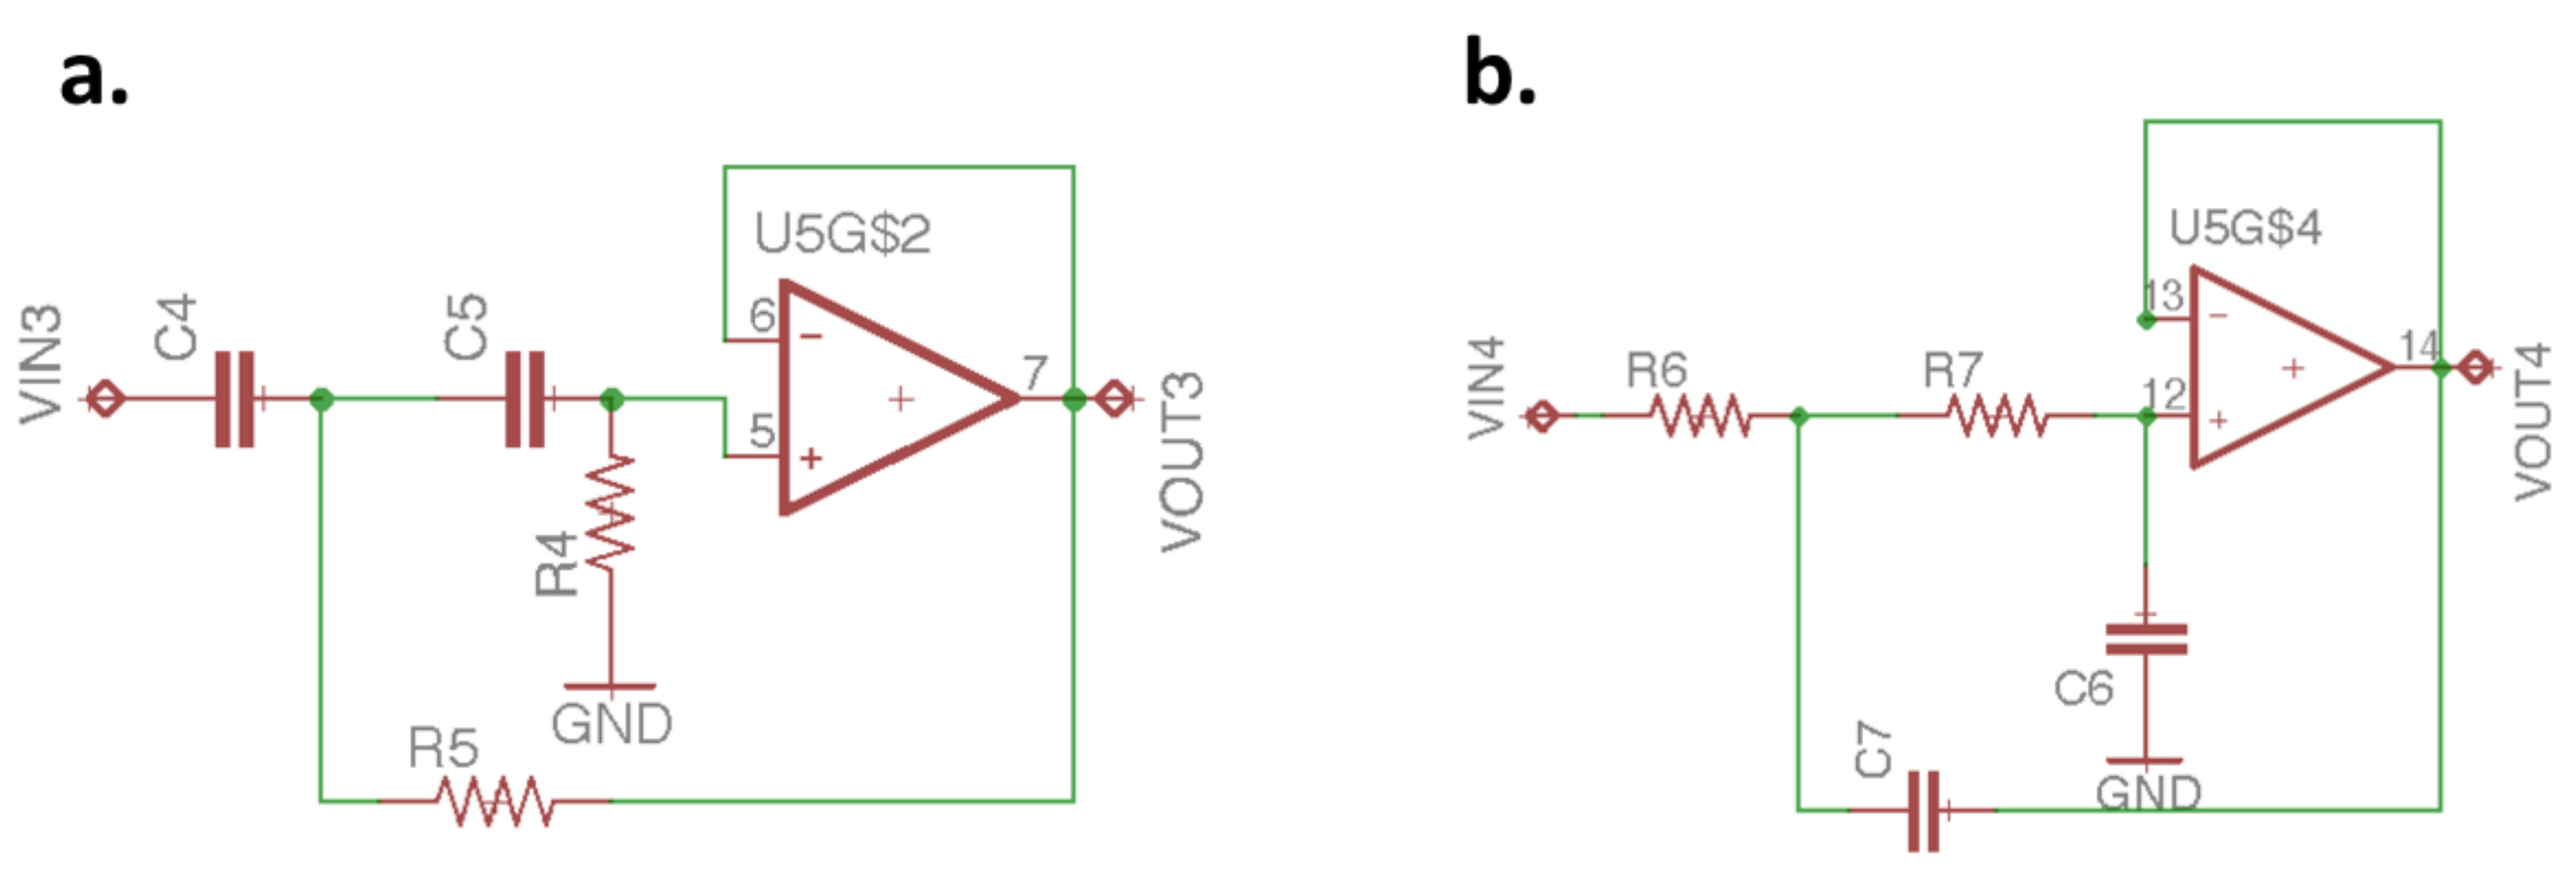
2.2. Analog Front End Design
3. Piezoelectric Sensor Signal Processing
3.1. Digital Filter Design
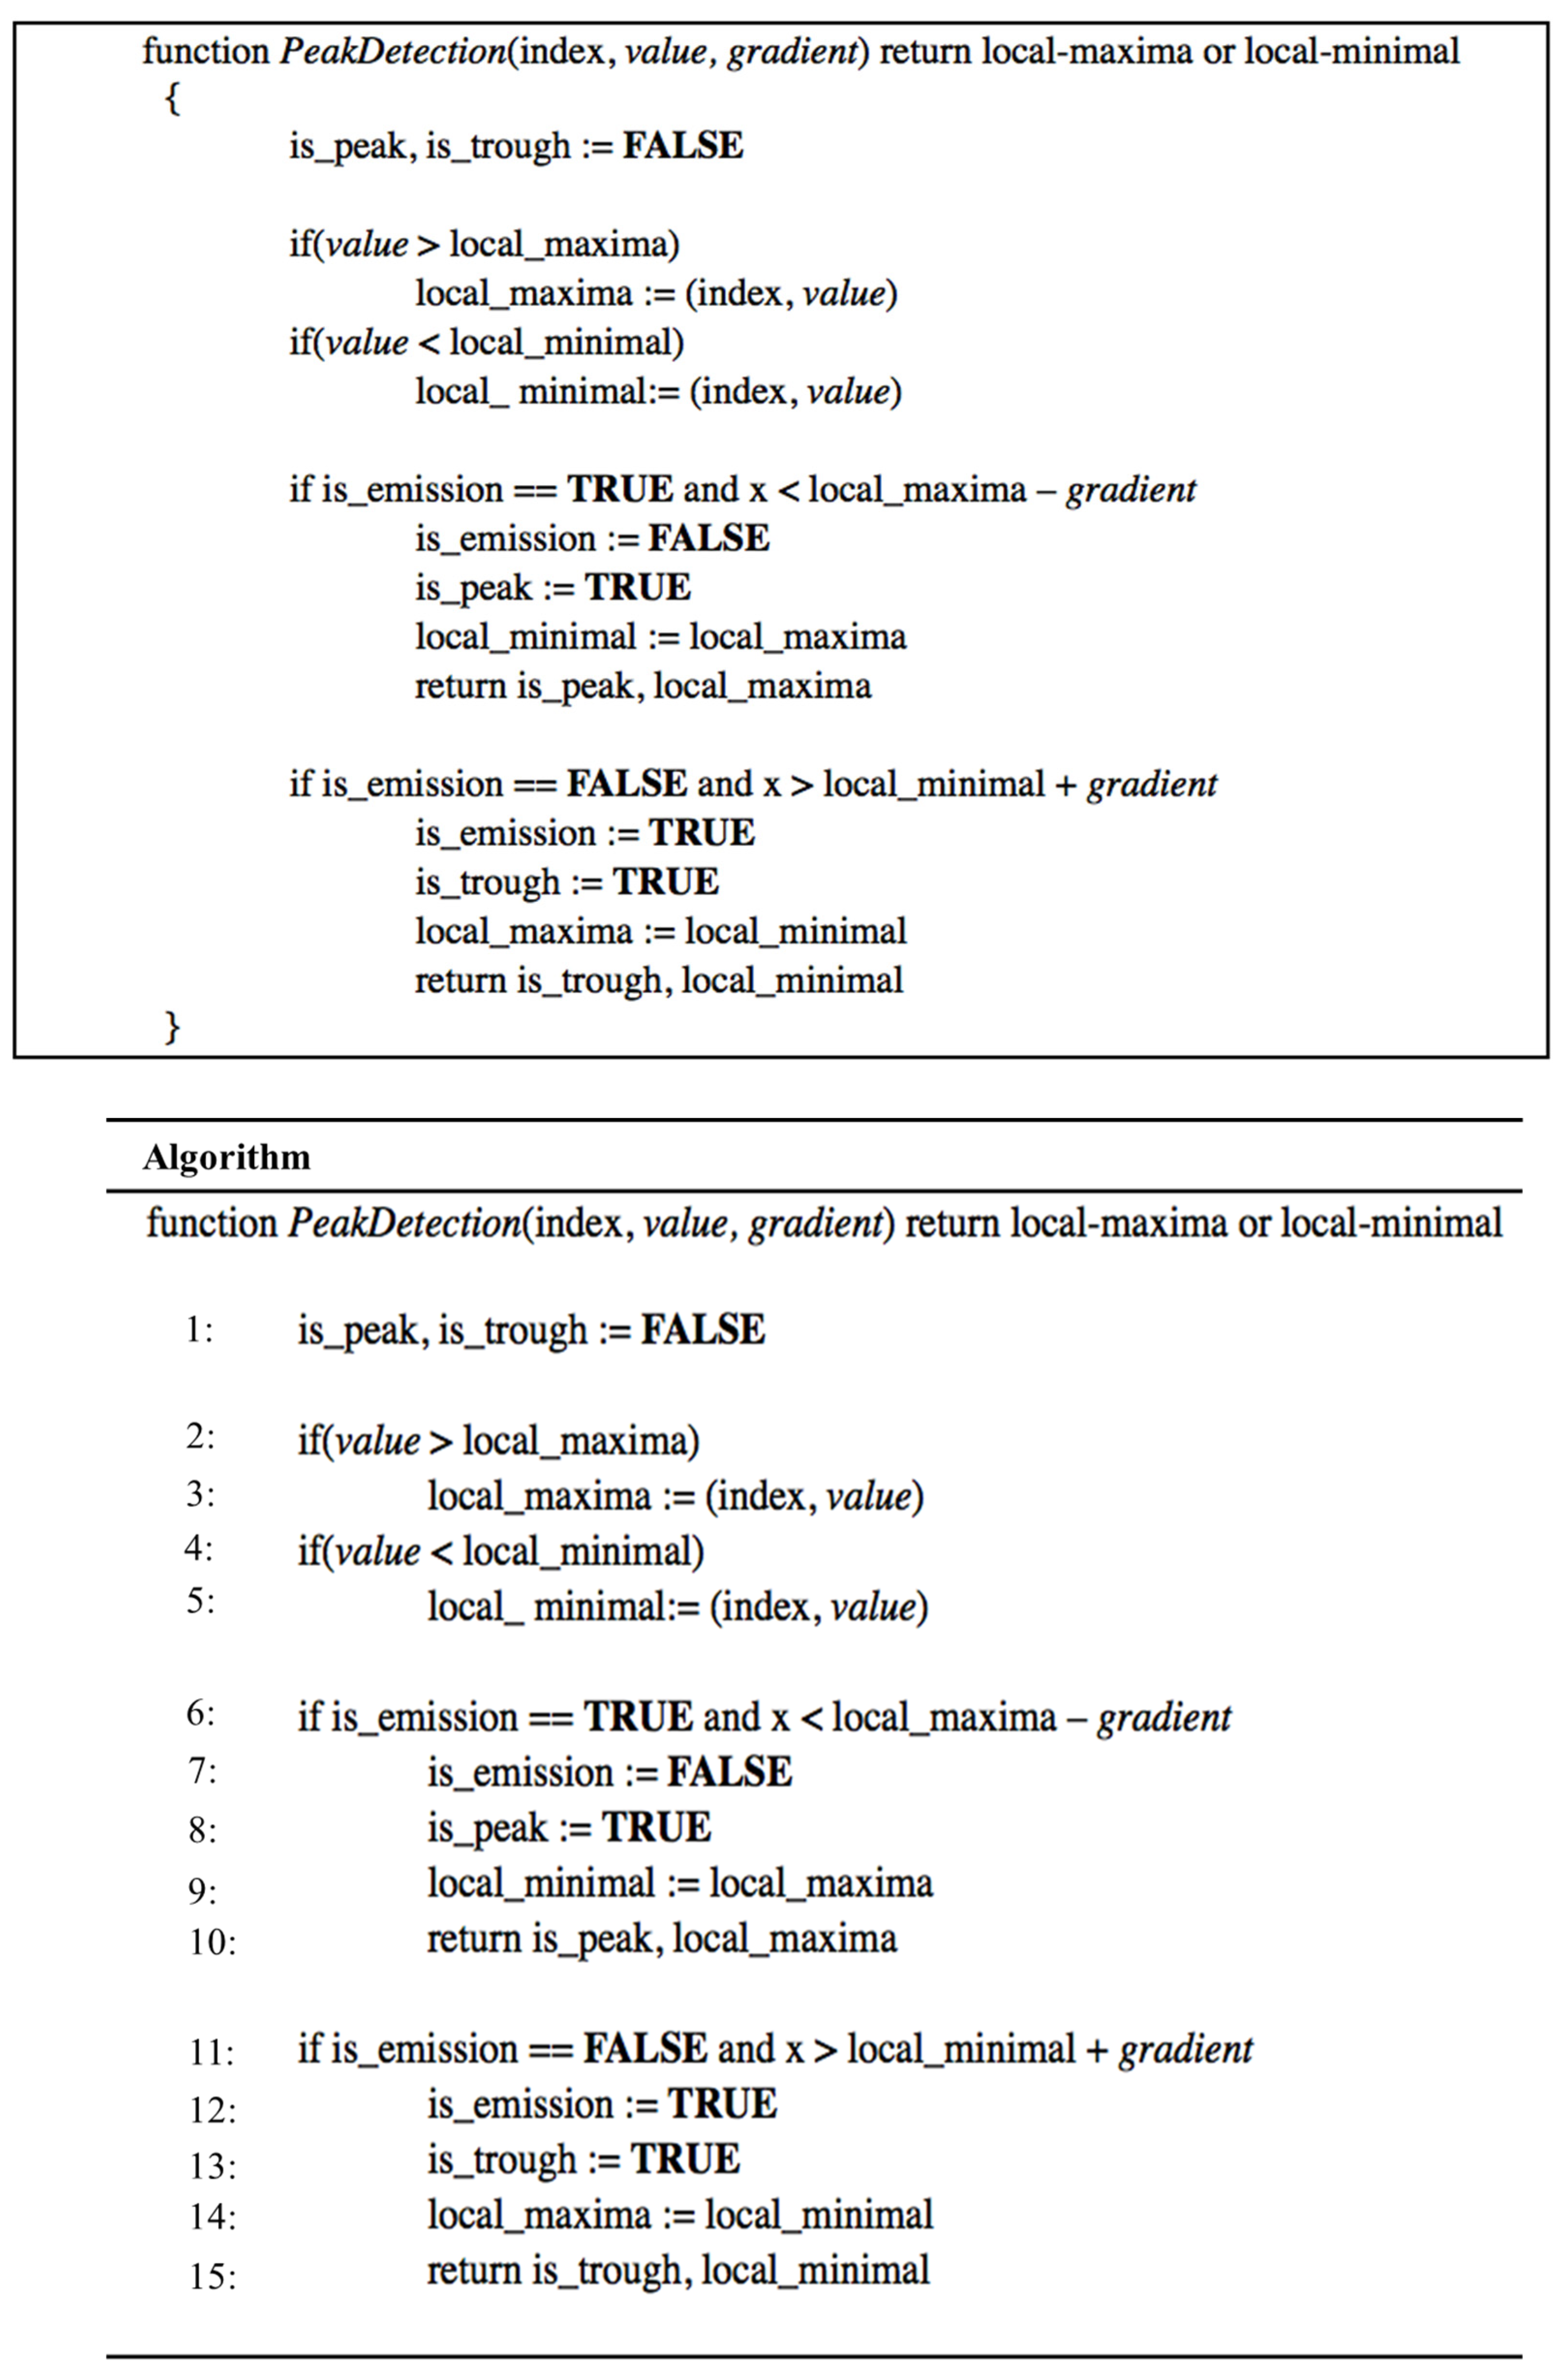
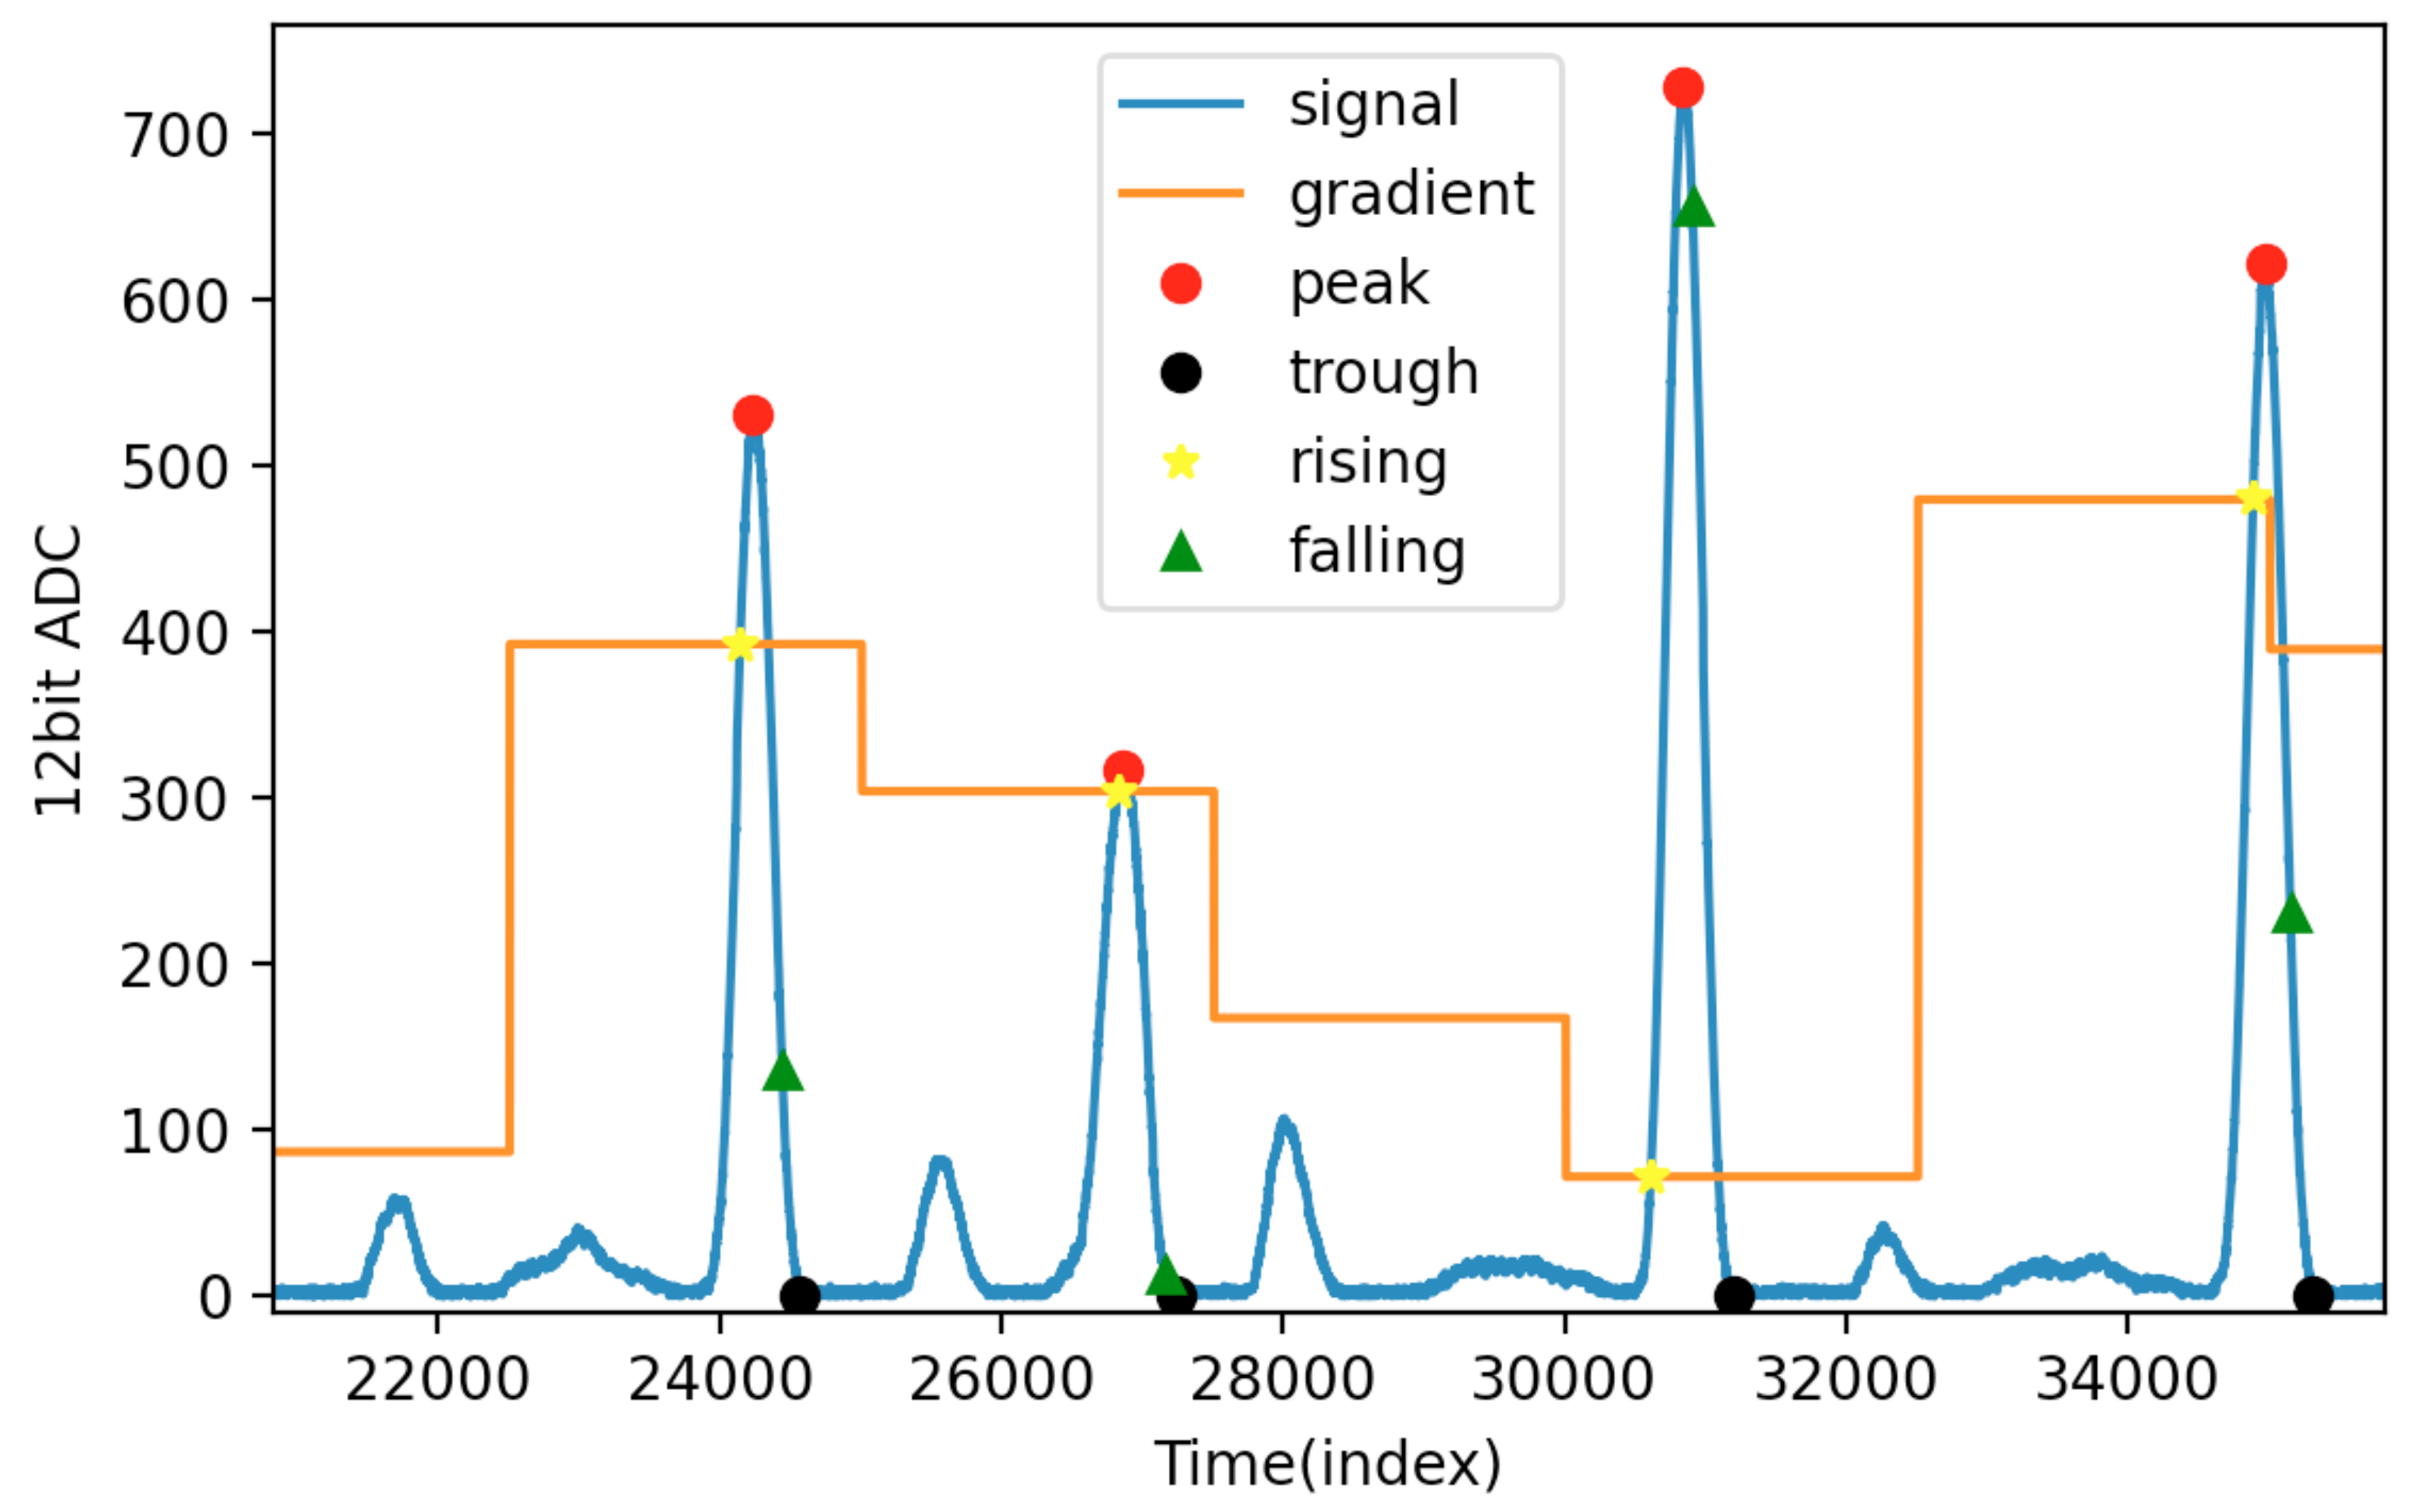
3.2. Adaptive Threshold and Peak Detection
4. Result and Analysis
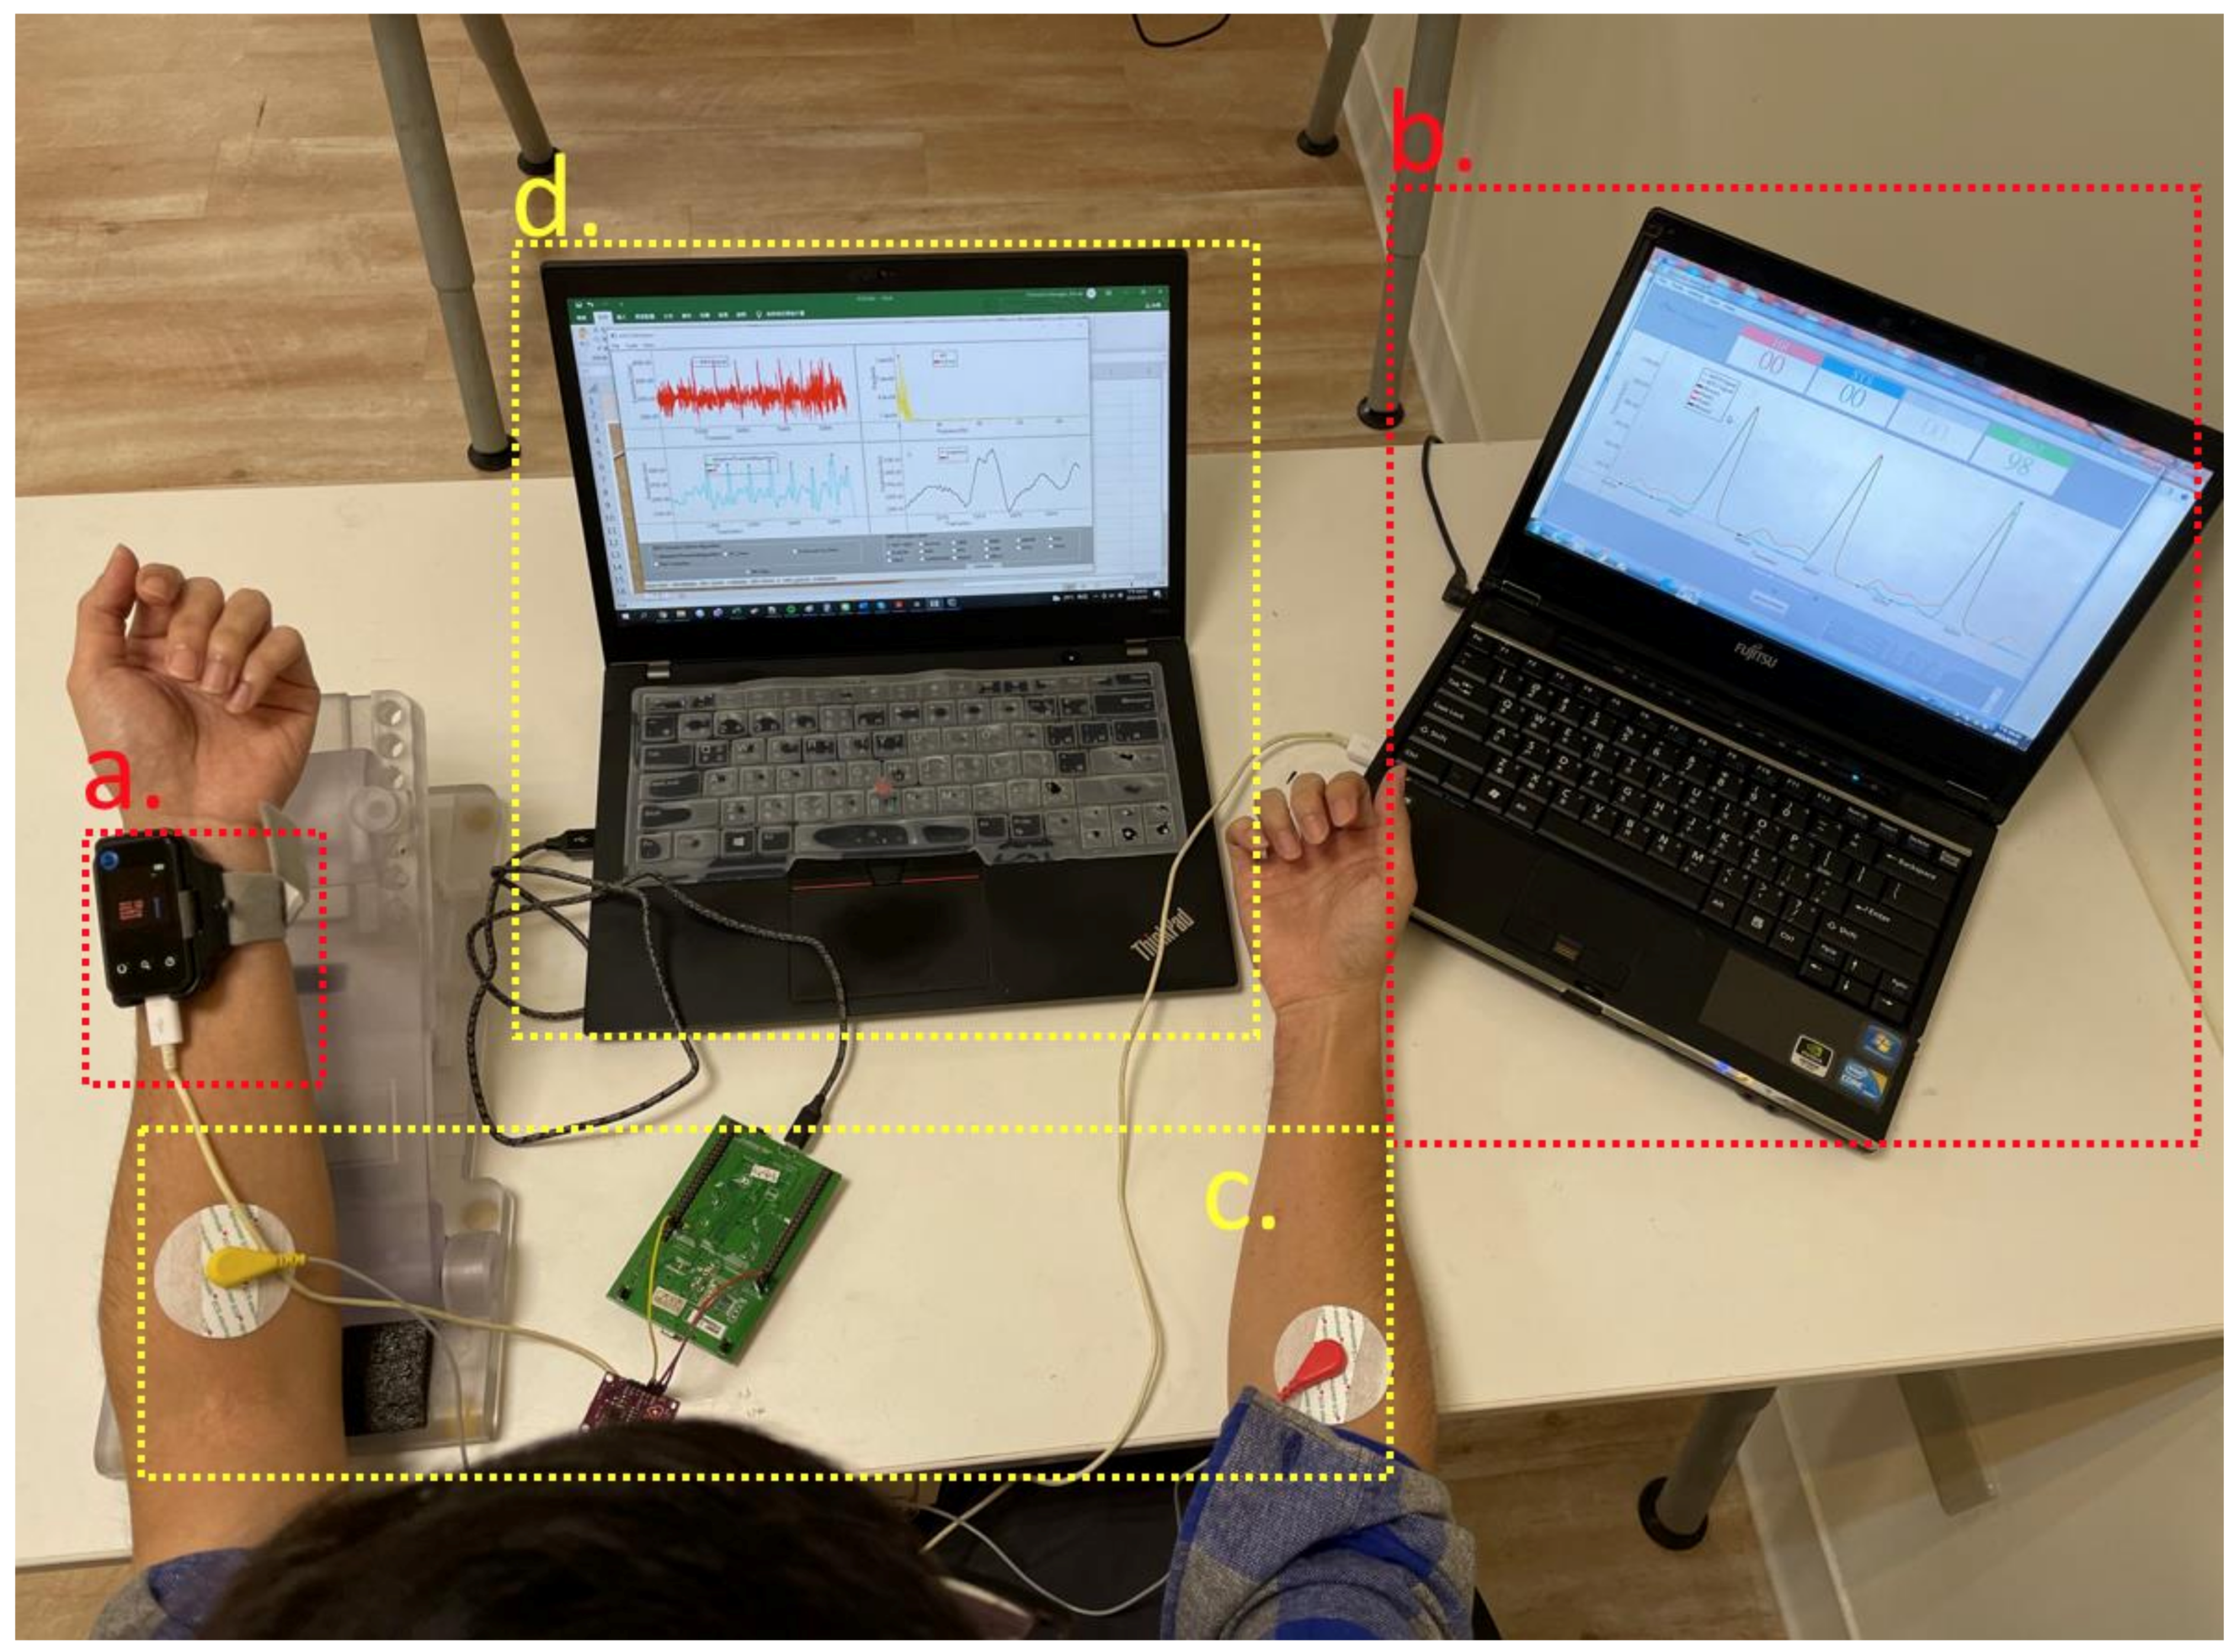
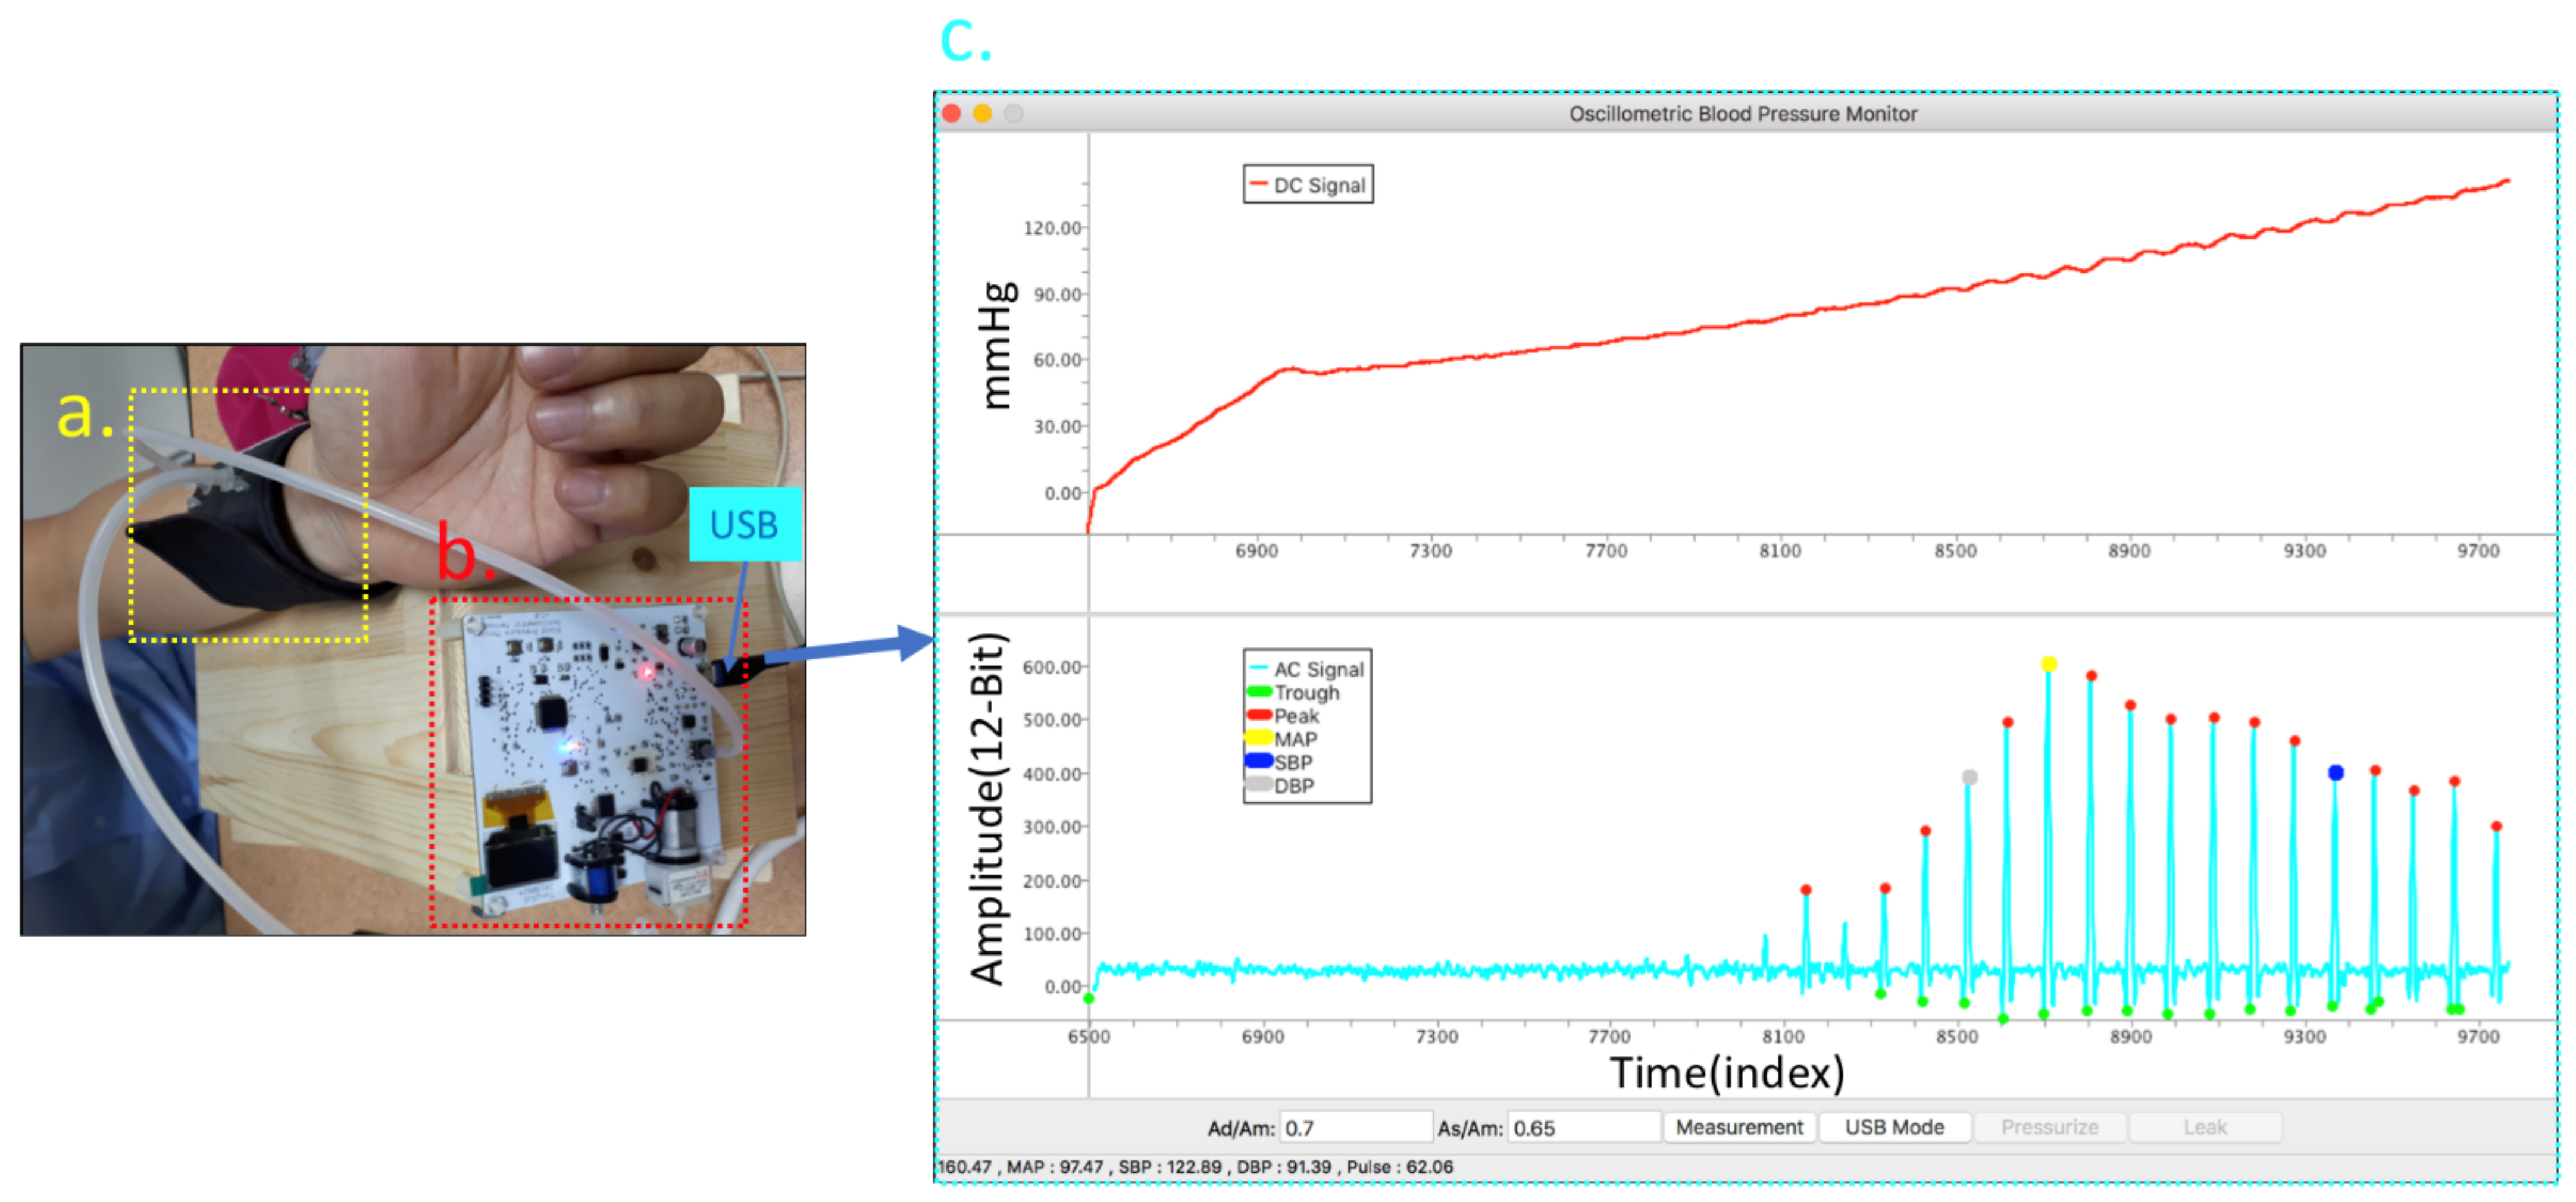
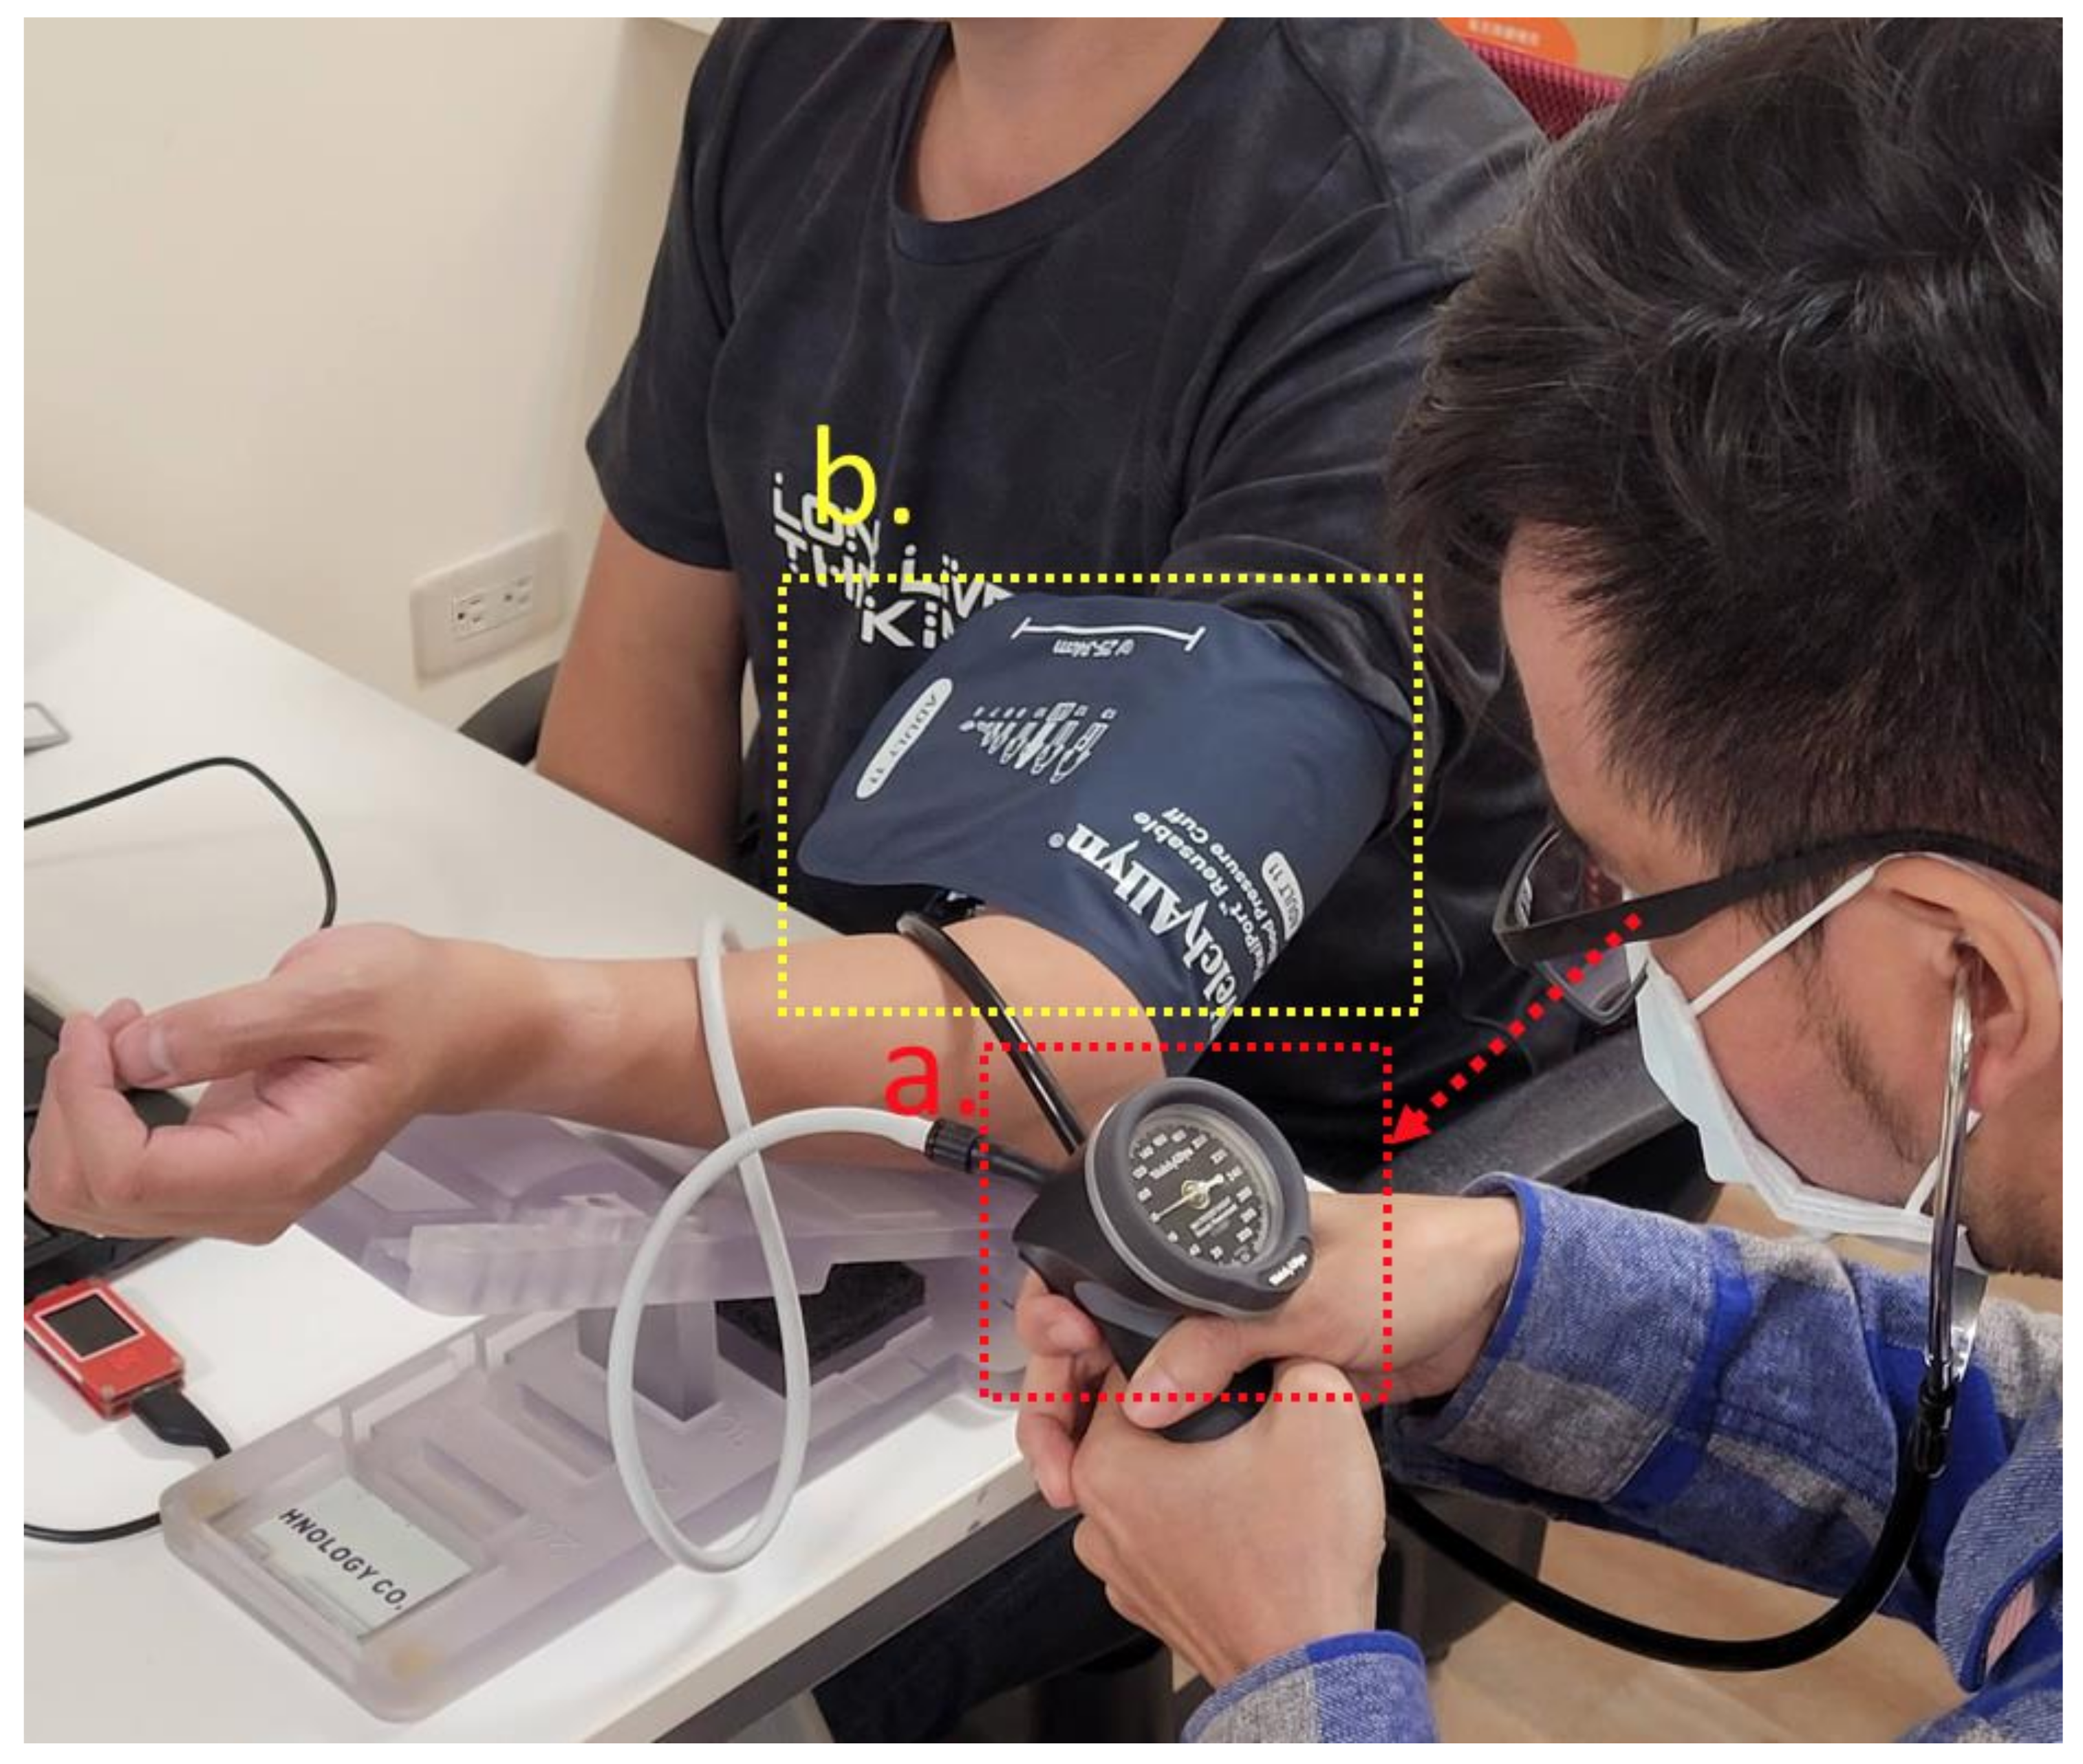
4.1. Experiment Equipment and Setup
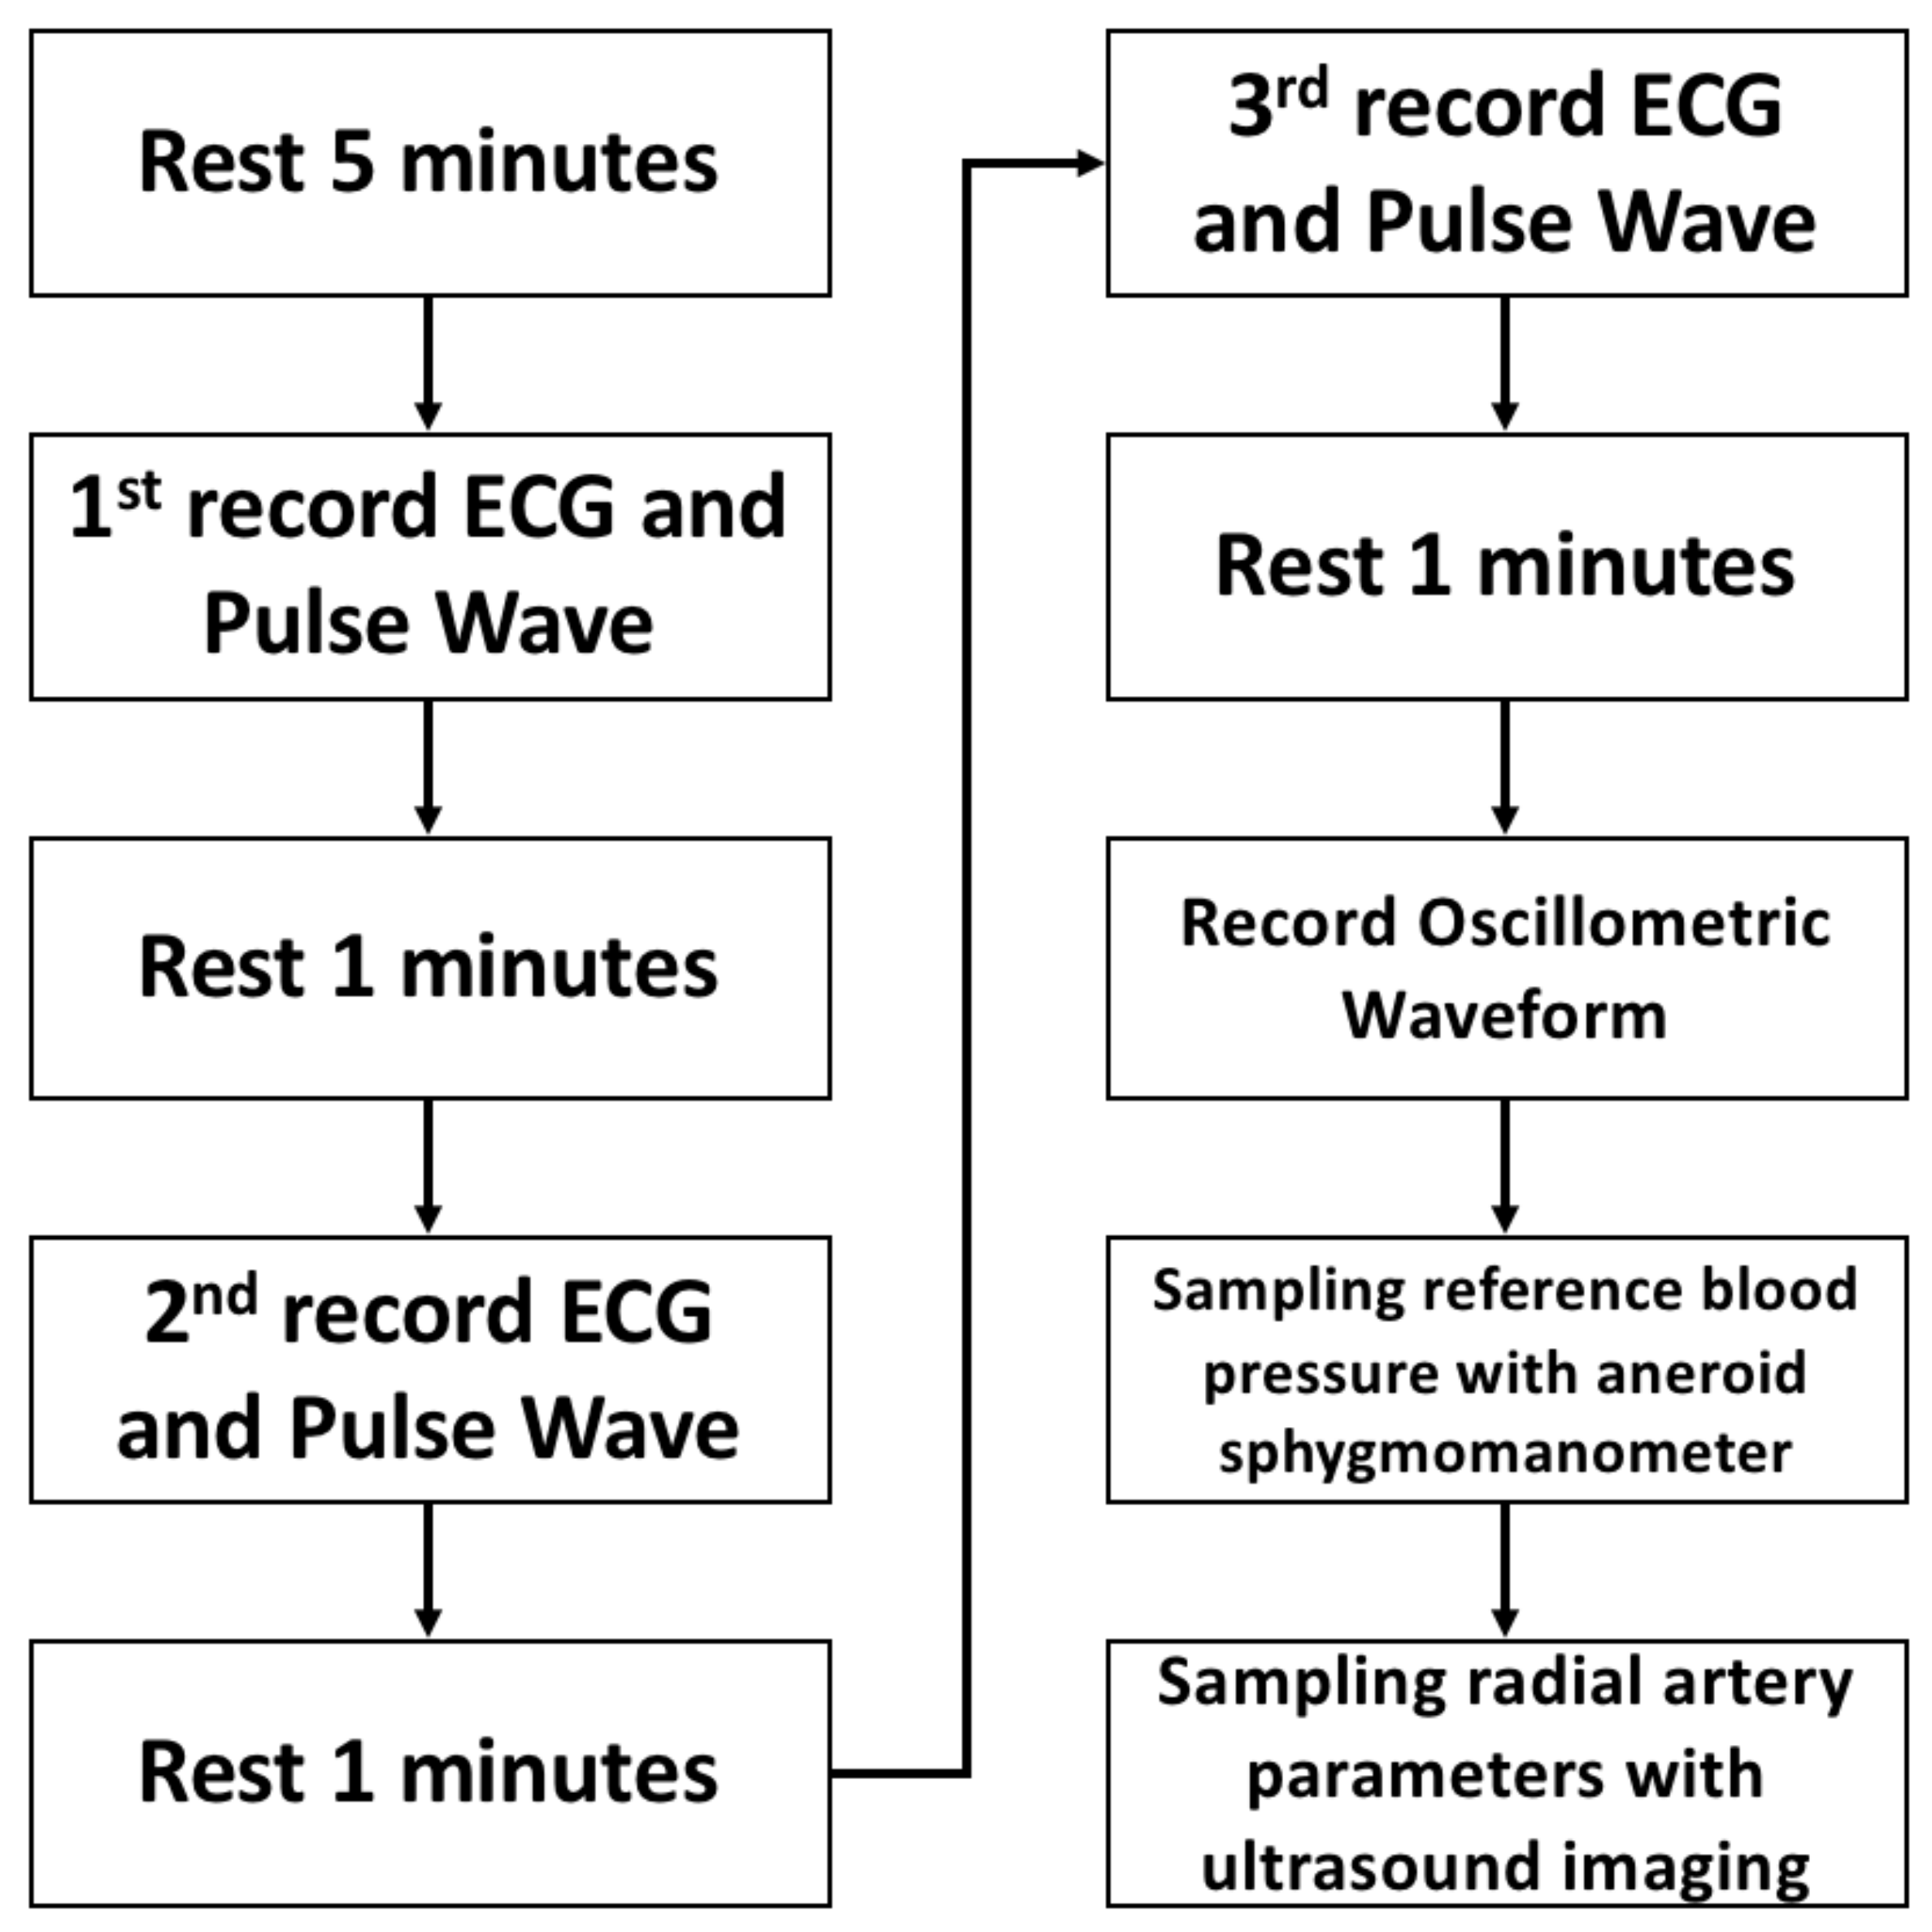
4.2. Protocol
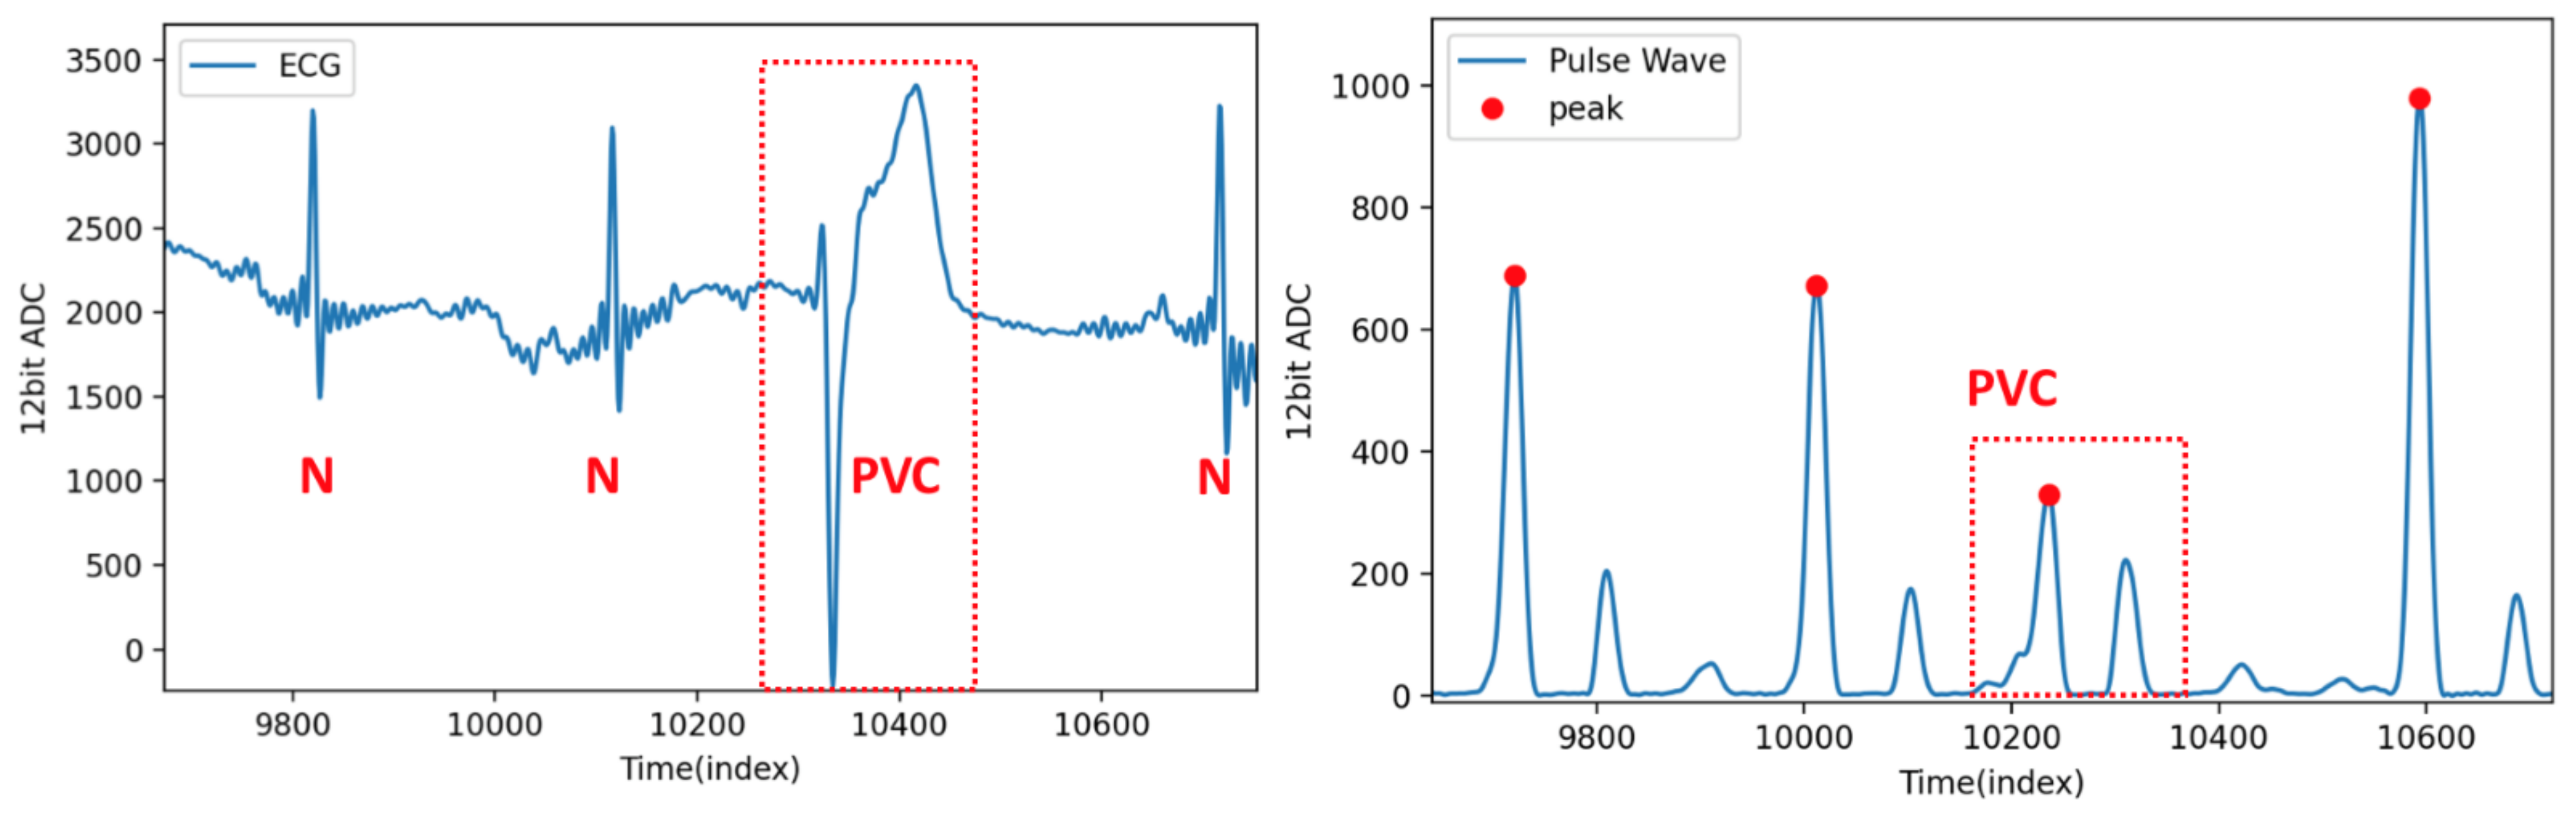
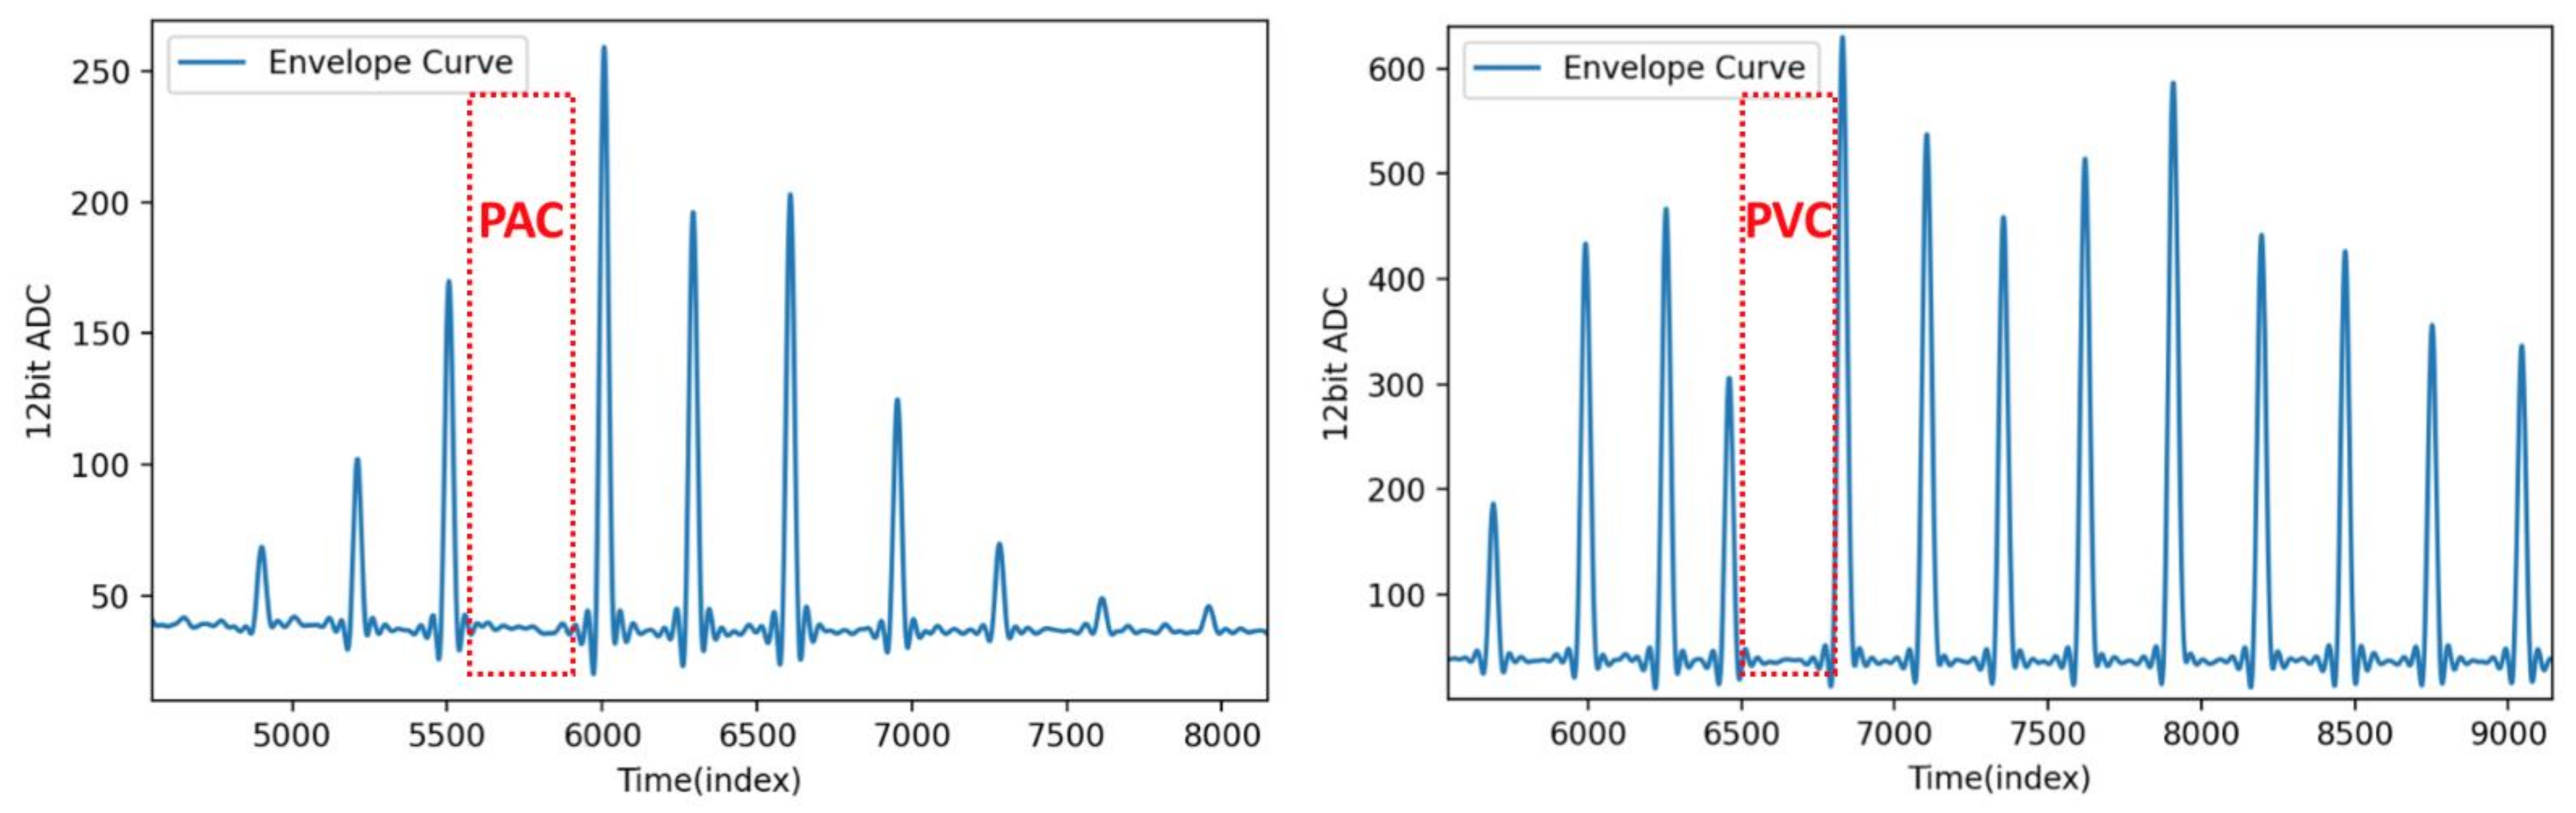
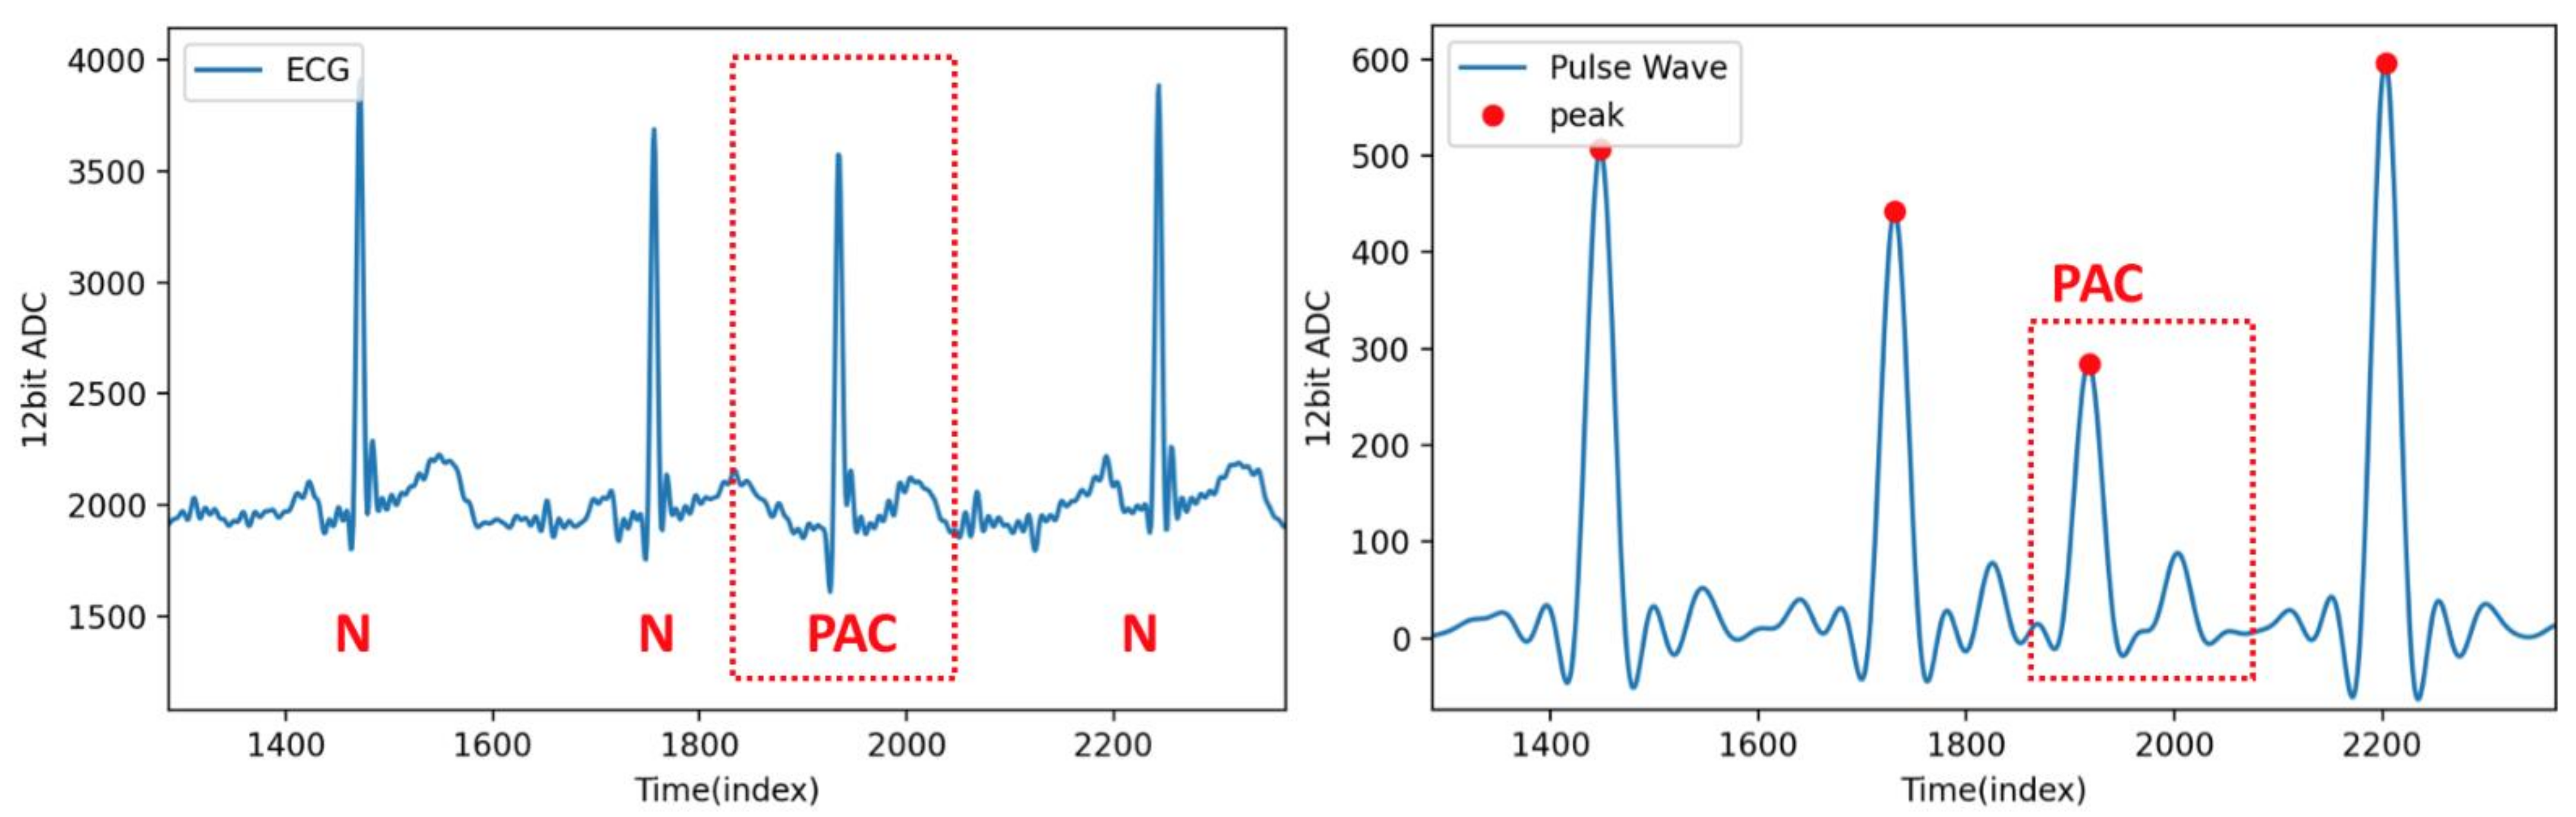
4.3. Pulse Wave Signal Analysis of Atrial Fibrillation
4.4. Results
5. Conclusions and Future Work
Author Contributions
Funding
Institutional Review Board Statement
Informed Consent Statement
Data Availability Statement
Conflicts of Interest
References
- Pagonas, N.; Schmidt, S.; Eysel, J.; Compton, F.; Hoffmann, C.; Seibert, F.; Hilpert, J.; Tschöpe, C.; Zidek, W.; Westhoff, T.H. Impact of Atrial Fibrillation on the Accuracy of Oscillometric Blood Pressure Monitoring. Hypertension 2013, 62, 579–584. [Google Scholar] [CrossRef]
- Beime, B.; Bramlage, C.; Krüger, R.; Deutsch, C.; van Mark, G.; Bramlage, P.; Botta, B. Validation of the Microlife BP B3 AFIB upper arm blood pressure monitor in adults and adolescents according to the ANSI/AAMI/ISO 81060-2:2019 protocol. Blood Press. Monit. 2021, 26, 299–304. [Google Scholar] [CrossRef] [PubMed]
- Hitsumoto, T. Clinical Significance of Arterial Velocity Pulse Index in Patients with Stage B Heart Failure With Preserved Ejection Fraction. Cardiol. Res. 2019, 10, 142–149. [Google Scholar] [CrossRef] [PubMed]
- Benjelloun, H.; Itti, R.; Philippe, L.; Lorgeron, J.-M.; Brochier, M. Beat-to-beat assessment of left ventricular ejection in atrial fibrillation. Eur. J. Nucl. Med. Mol. Imaging 1983, 8, 206–210. [Google Scholar] [CrossRef]
- Oster, J.; Clifford, G.D. Impact of the presence of noise on RR interval-based atrial fibrillation detection. J. Electrocardiol. 2015, 48, 947–951. [Google Scholar] [CrossRef] [PubMed]
- Lau, D.H.; Middeldorp, M.; Brooks, A.G.; Ganesan, A.; Roberts-Thomson, K.C.; Stiles, M.K.; Leong, D.P.; Abed, H.S.; Lim, H.S.; Wong, C.; et al. Aortic Stiffness in Lone Atrial Fibrillation: A Novel Risk Factor for Arrhythmia Recurrence. PLoS ONE 2013, 8, e76776. [Google Scholar] [CrossRef] [Green Version]
- Vlachopoulos, C.; O’Rourke, M.; Nichols, W.W. McDonald’s Blood Flow in Arteries: Theoretical, Experimental and Clinical Principles; CRC Press: Boca Raton, FL, USA, 2011. [Google Scholar]
- Bashar, S.K.; Han, D.; Zieneddin, F.; Ding, E.; Fitzgibbons, T.P.; Walkey, A.J.; McManus, D.D.; Javidi, B.; Chon, K.H. Novel Density Poincaré Plot Based Machine Learning Method to Detect Atrial Fibrillation from Premature Atrial/Ventricular Contractions. IEEE Trans. Biomed. Eng. 2021, 68, 448–460. [Google Scholar] [CrossRef]
- Langley, P.; Dewhurst, F.; Di Marco, L.; Adams, P.; Mwita, J.C.; Walker, R.; Murray, A. Accuracy of algorithms for detection of atrial fibrillation from short duration beat interval recordings. Med. Eng. Phys. 2012, 34, 1441–1447. [Google Scholar] [CrossRef]
- Cauwenberghs, N.; Heyrman, Y.; Thijs, L.; Yang, W.-Y.; Wei, F.-F.; Zhang, Z.-Y.; Staessen, J.A.; Kuznetsova, T. Flow-mediated slowing of brachial-radial pulse wave velocity: Methodological aspects and clinical determinants. Artery Res. 2018, 21, 29–37. [Google Scholar] [CrossRef]
- Nabeel, P.M.; Jayaraj, J.; Mohanasankar, S. Single-source PPG-based local pulse wave velocity measurement: A potential cuffless blood pressure estimation technique. Physiol. Meas. 2017, 38, 2122–2140. [Google Scholar] [CrossRef]
- Ibrahim, B.; Jafari, R. Cuffless Blood Pressure Monitoring from an Array of Wrist Bio-Impedance Sensors Using Subject-Specific Regression Models: Proof of Concept. IEEE Trans. Biomed. Circuits Syst. 2019, 13, 1723–1735. [Google Scholar] [CrossRef]
- Huynh, T.H.; Jafari, R.; Chung, W.-Y. Noninvasive Cuffless Blood Pressure Estimation Using Pulse Transit Time and Impedance Plethysmography. IEEE Trans. Biomed. Eng. 2019, 66, 967–976. [Google Scholar] [CrossRef]
- Arathy, R.; Nabeel, P.M.; Joseph, J.; Sivaprakasam, M.; Awasthi, V. An accelerometer probe for local pulse wave velocity measurement. In Proceedings of the 2017 IEEE International Symposium on Medical Measurements and Applications (MeMeA), Rochester, MN, USA, 7–10 May 2017; IEEE: Piscataway, NJ, USA, 2017; pp. 426–431. [Google Scholar]
- Katsuura, T.; Izumi, S.; Yoshimoto, M.; Kawaguchi, H.; Yoshimoto, S.; Sekitani, T. Wearable pulse wave velocity sensor using flexible piezoelectric film array. In Proceedings of the 2017 IEEE Biomedical Circuits and Systems Conference (BioCAS), Torino, Italy, 19–21 October 2017; IEEE: Piscataway, NJ, USA, 2017; pp. 1–4. [Google Scholar]
- Nguyen, T.-V.; Mizuki, Y.; Tsukagoshi, T.; Takahata, T.; Ichiki, M.; Shimoyama, I. MEMS-Based Pulse Wave Sensor Utilizing a Piezoresistive Cantilever. Sensors 2020, 20, 1052. [Google Scholar] [CrossRef] [Green Version]
- Shoev, G.V.; Ivanov, M.S. Numerical study of shock wave interaction in steady flows of a viscous heat-conducting gas with a low ratio of specific heats. Thermophys. Aeromech. 2016, 23, 343–354. [Google Scholar] [CrossRef]
- Nabeel, P.M.; Joseph, J.; Shah, M.I.; Sivaprakasam, M. Evaluation of Local Pulse Wave Velocity using an Image Free Ultrasound Technique. In Proceedings of the 2018 IEEE International Symposium on Medical Measurements and Applications (MeMeA), Rome, Italy, 11–13 June 2018; IEEE: Piscataway, NJ, USA, 2018; pp. 1–6. [Google Scholar]
- Bartolome, E. Signal conditioning for piezoelectric sensors. Texas Instrum. Analog Appl. J. 2010, 10, 24–31. [Google Scholar]
- Karki, J. Analysis of the Sallen-Key Architecture. Mixed Signal Products, Texas Instruments Application Report SLOA024B; Texas Instruments Incorporated: Dallas, TX, USA, 2002; Available online: https://www.ti.com/lit/an/sloa024b/sloa024b.pdf?ts=1634609982600&ref_url=https%253A%252F%252Fwww.google.com.hk%252F (accessed on 24 September 2021).
- Lim, Y.; Parker, S. FIR filter design over a discrete powers-of-two coefficient space. IEEE Trans. Acoust. Speech Signal Process. 1983, 31, 583–591. [Google Scholar] [CrossRef] [Green Version]
- Jinding, G.; Yubao, H.; Long, S. Design and FPGA Implementation of Linear FIR Low-pass Filter Based on Kaiser Window Function. In Proceedings of the 2011 Fourth International Conference on Intelligent Computation Technology and Automation, Shenzhen, China, 28–29 March 2011; IEEE: Piscataway, NJ, USA, 2011; Volume 2, pp. 496–498. [Google Scholar]
- Spachos, P.; Gao, J.; Hatzinakos, D. Feasibility study of photoplethysmographic signals for biometric identification. In Proceedings of the 2011 17th International Conference on Digital Signal Processing (DSP), Corfu, Greece, 6–8 July 2011; IEEE: Piscataway, NJ, USA, 2011; pp. 1–5. [Google Scholar]
- Prasad, A.S.; Kavanashree, N. ECG Monitoring System Using AD8232 Sensor. In Proceedings of the 2019 International Conference on Communication and Electronics Systems (ICCES), Coimbatore, India, 17–19 July 2019; pp. 976–980. [Google Scholar] [CrossRef]
- Pflugradt, M.; Geissdoerfer, K.; Goernig, M.; Orglmeister, R. A Fast Multimodal Ectopic Beat Detection Method Applied for Blood Pressure Estimation Based on Pulse Wave Velocity Measurements in Wearable Sensors. Sensors 2017, 17, 158. [Google Scholar] [CrossRef] [Green Version]
- Selvaraj, V.; Buhari, F.S. Ultrasound evaluation of effect of different degree of wrist extension on radial artery dimension at the wrist joint. Ann. Card. Anaesth. 2016, 19, 63–67. [Google Scholar] [CrossRef]
- Kuwabara, M.; Harada, K.; Ba, Y.H.; Kario, K. Validation of two watch-type wearable blood pressure monitors according to the ANSI/AAMI/ISO81060-2:2013 guidelines: Omron HEM-6410T-ZM and HEM-6410T-ZL. J. Clin. Hypertens. 2019, 21, 853–858. [Google Scholar] [CrossRef] [Green Version]
- Jensen, T.J.; Haarbo, J.; Pehrson, S.M.; Thomsen, B. Impact of Premature Atrial Contractions in Atrial Fibrillation. Pacing Clin. Electrophysiol. 2004, 27, 447–452. [Google Scholar] [CrossRef]
- Sayadi, O.; Shamsollahi, M.B.; Clifford, G.D. Robust Detection of Premature Ventricular Contractions Using a Wave-Based Bayesian Framework. IEEE Trans. Biomed. Eng. 2010, 57, 353–362. [Google Scholar] [CrossRef] [Green Version]
- Grumann, M.; Steigert, J.; Riegger, L.; Moser, I.; Enderle, B.; Riebeseel, K.; Urban, G.; Zengerle, R.; Ducrée, J. Sensitivity enhancement for colorimetric glucose assays on whole blood by on-chip beam-guidance. Biomed. Microdevices 2006, 8, 209–214. [Google Scholar] [CrossRef]
- Zheng, Y.-L.; Yan, B.P.; Zhang, Y.; Poon, C.C.Y. An Armband Wearable Device for Overnight and Cuff-Less Blood Pressure Measurement. IEEE Trans. Biomed. Eng. 2014, 61, 2179–2186. [Google Scholar] [CrossRef]
- Hughes, D.J.; Babbs, C.F.; Geddes, L.A.; Bourland, J.D. Measurements of Young’s modulus of elasticity of the canine aorta with ultrasound. Ultrason. Imaging 1979, 1, 356–367. [Google Scholar] [CrossRef] [Green Version]
- Wang, Q.; Cui, Y.; Lin, N.; Pang, S. Correlation of cardiomyocyte apoptosis with duration of hypertension, severity of hypertension and caspase-3 expression in hypertensive rats. Exp. Ther. Med. 2019, 17, 2741–2745. [Google Scholar] [CrossRef] [Green Version]


| Specification | Detail |
|---|---|
| Capacitance (pF, at 120 Hz) | 8000 ± 30% |
| Plate material | Brass |
| Plate material (mm) | Φ10 × 0.05 |
| Ceramic size (mm) | Φ7 × 0.07 |
| Weight (g) | 0.2 |
| Price (USD) | 0.35 |
| Pulse Wave Statistic | TB | TP | FN | Se (%) | Ac (%) |
|---|---|---|---|---|---|
| Normal | 187 | 186 | 1 | 99.4 | 99.4 |
| Abnormal | 19 | 17 | 2 | 89.4 | 89.4 |
| Pulse Wave Statistic | TB | TP | FN | Se (%) | Ac (%) |
|---|---|---|---|---|---|
| Normal | 195 | 195 | 0 | 100 | 100 |
| Abnormal | 14 | 12 | 2 | 85.7 | 85.7 |
| Subject Characteristics | Patient with PACs | Patient with PVCs |
|---|---|---|
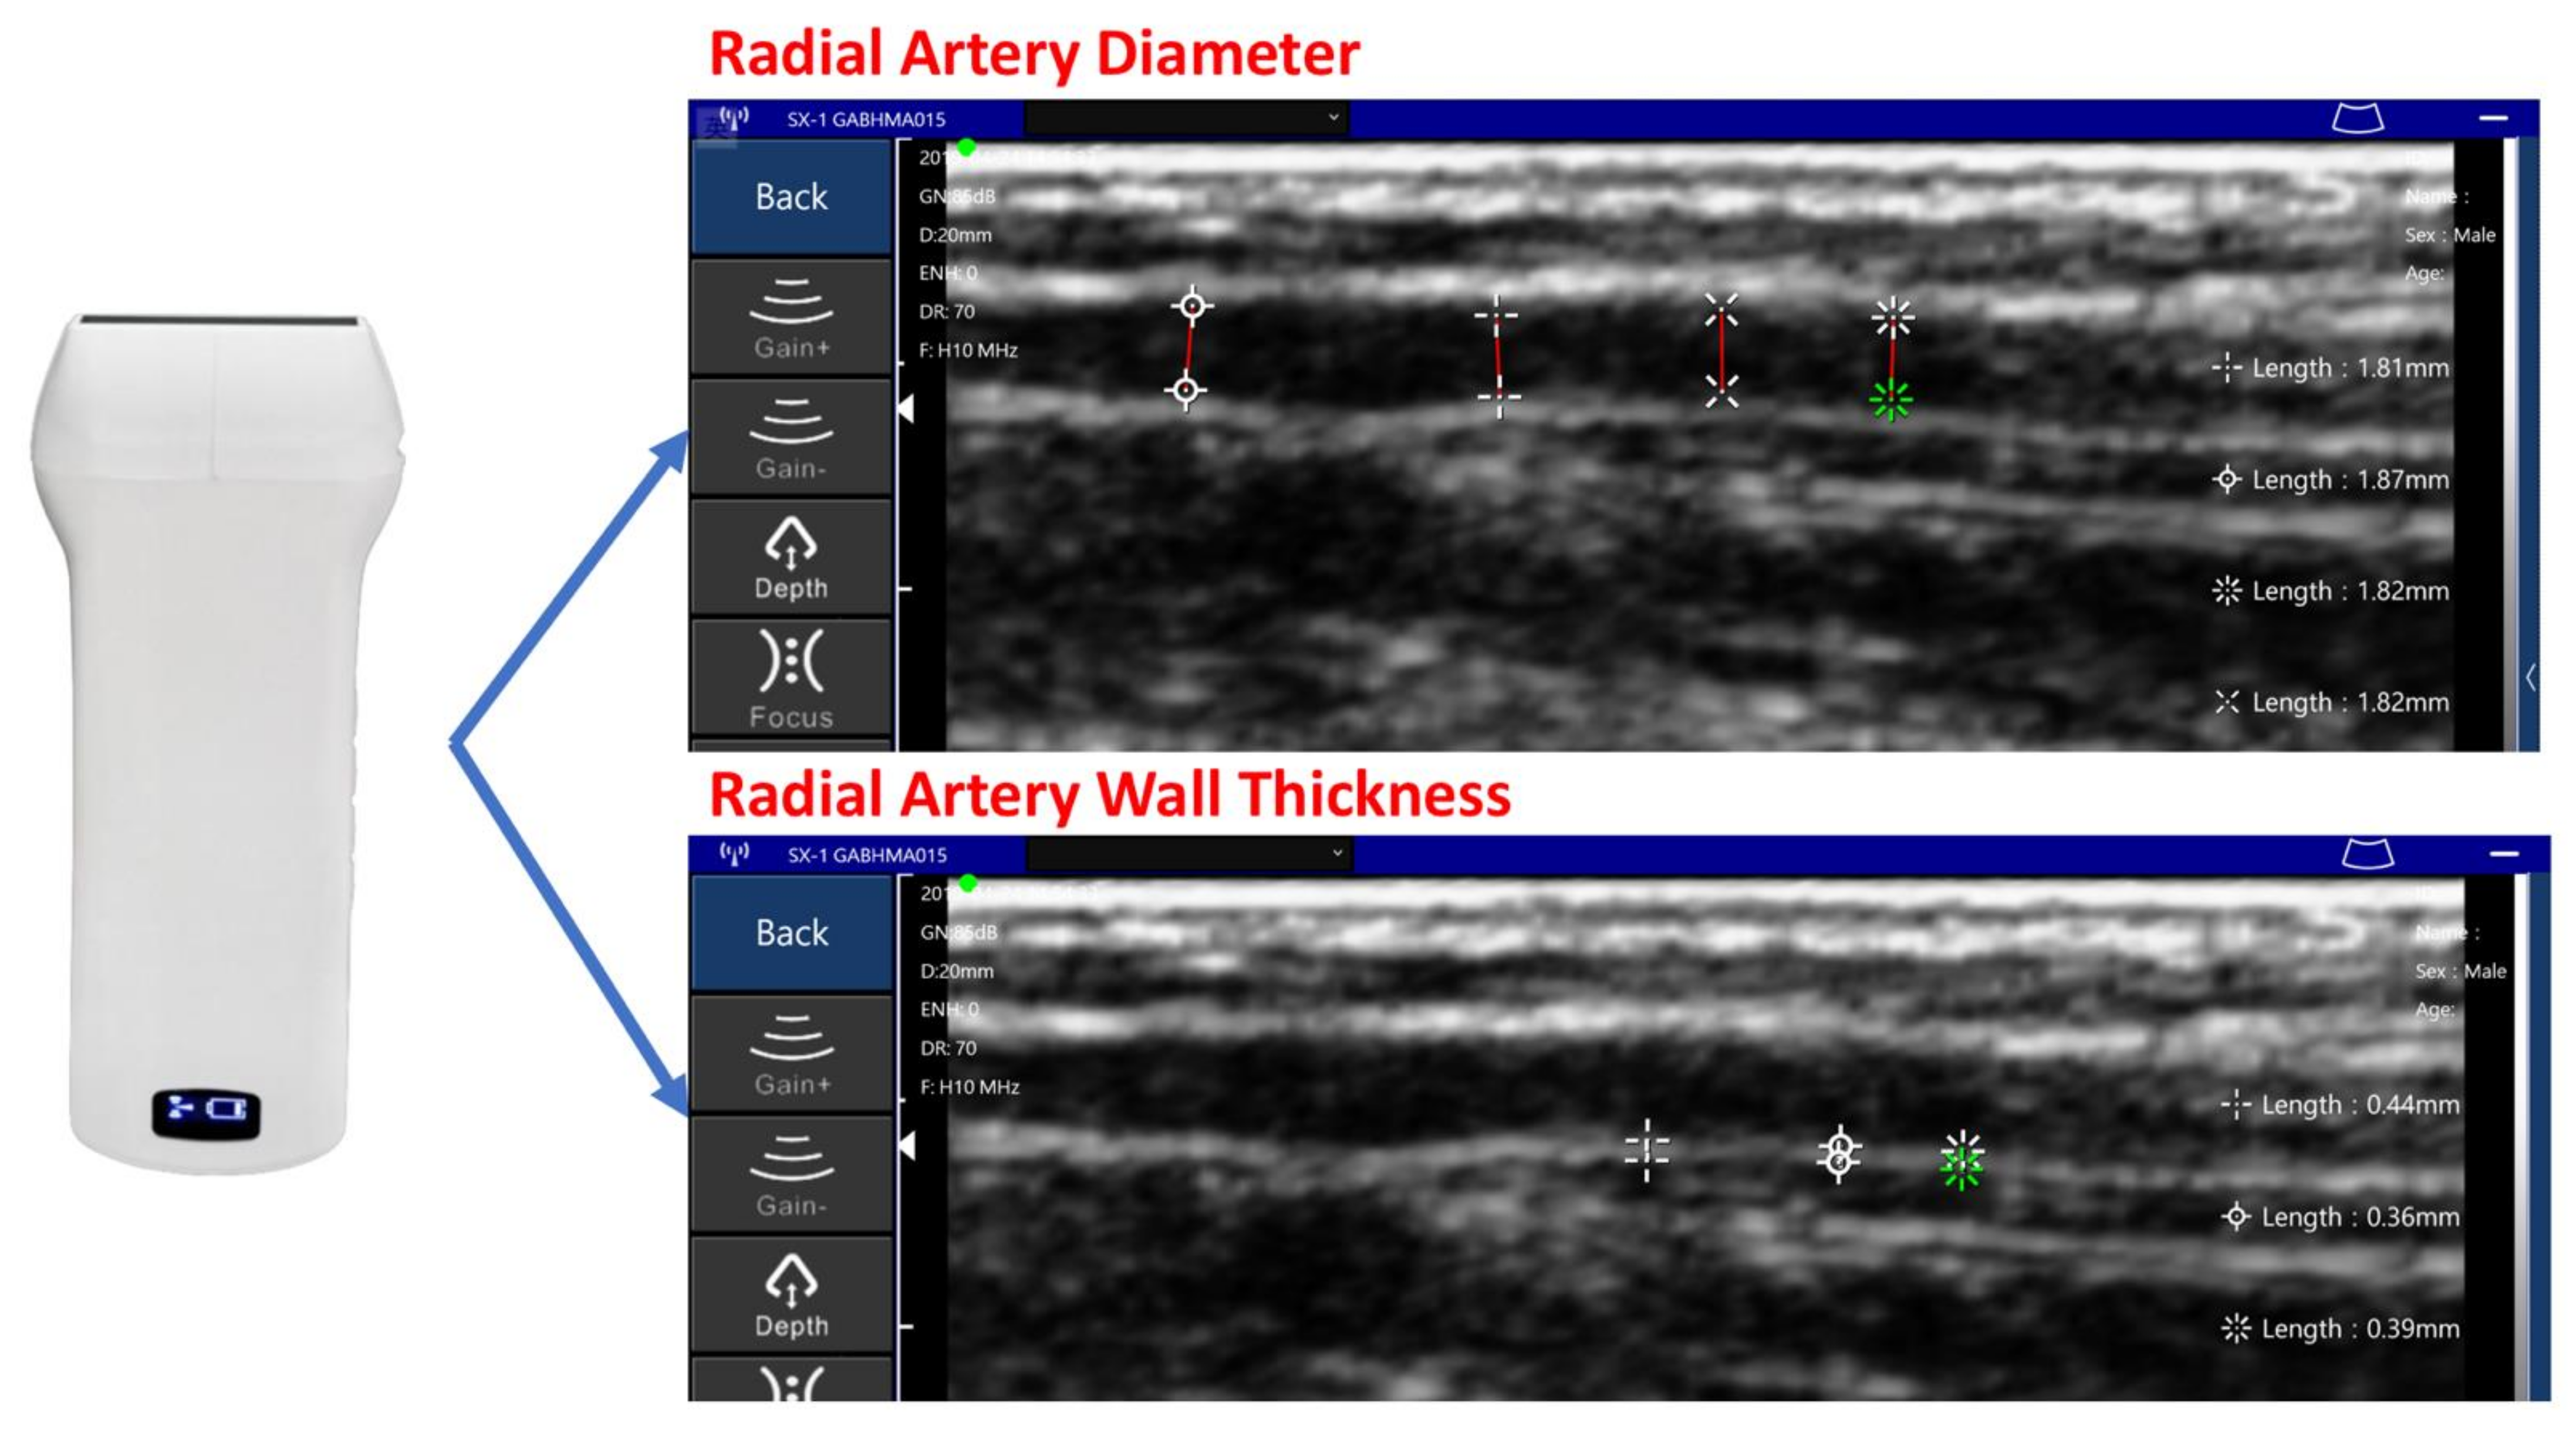
| Artery diameter (mm) | 1.75 | 2.35 |
| Artery wall thickness (mm) | 0.39 | 0.47 |
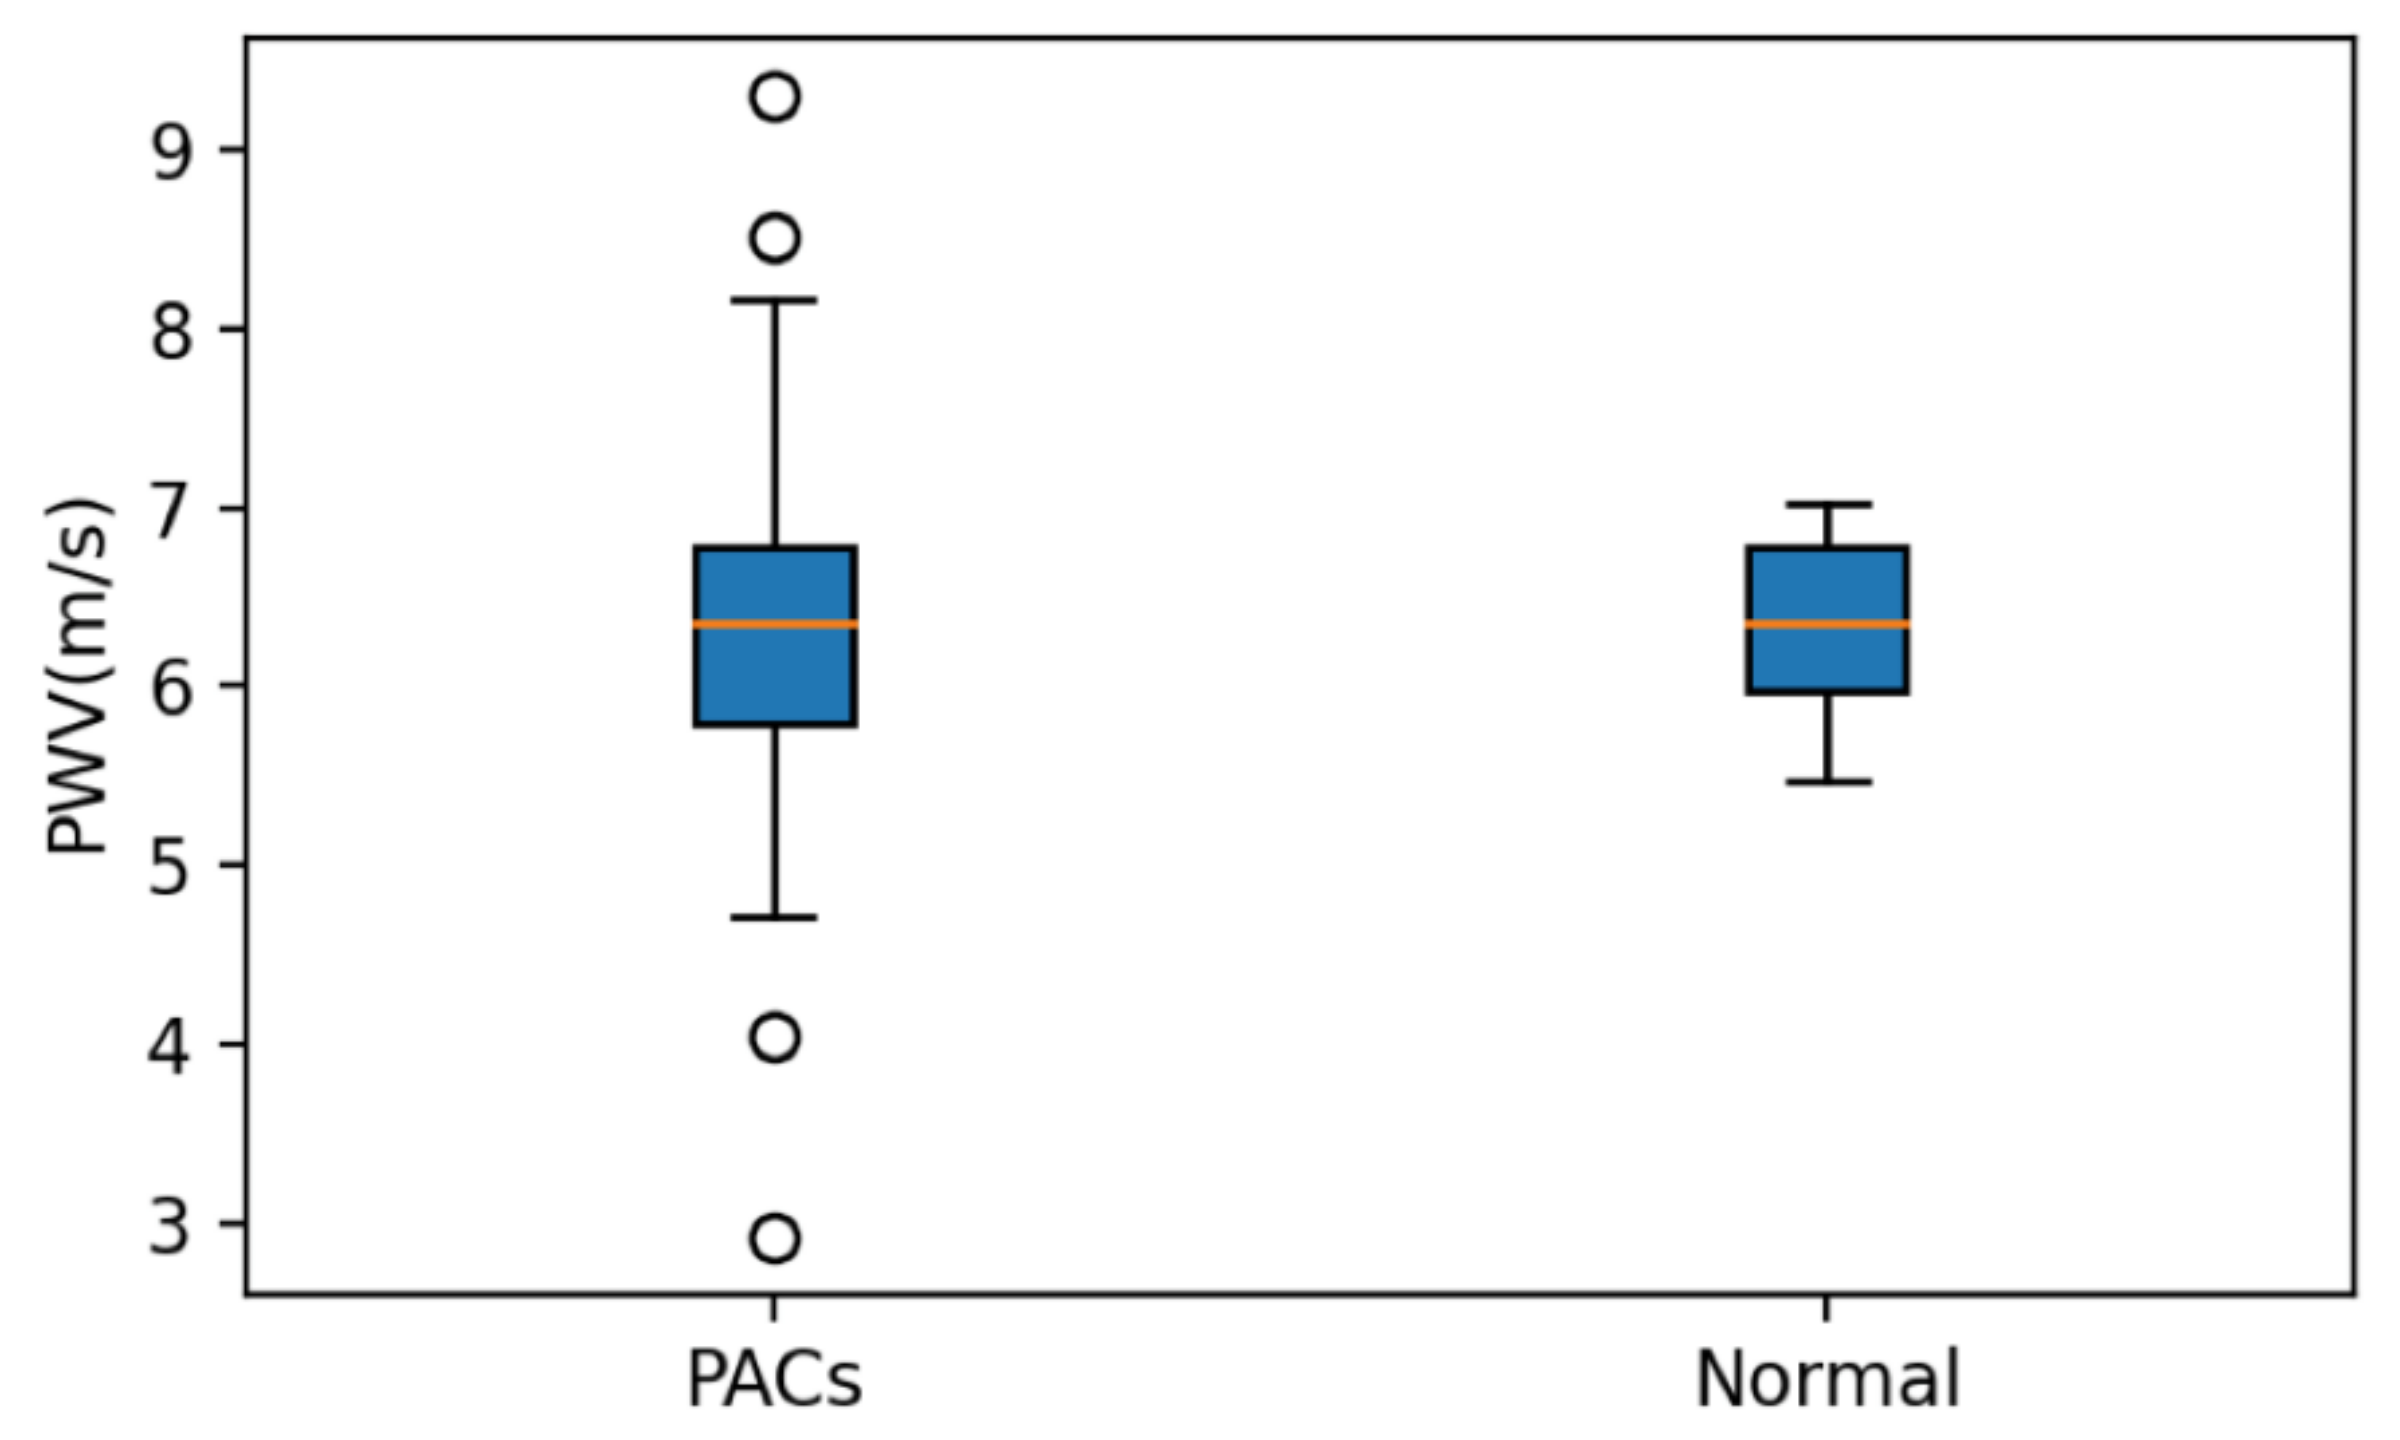
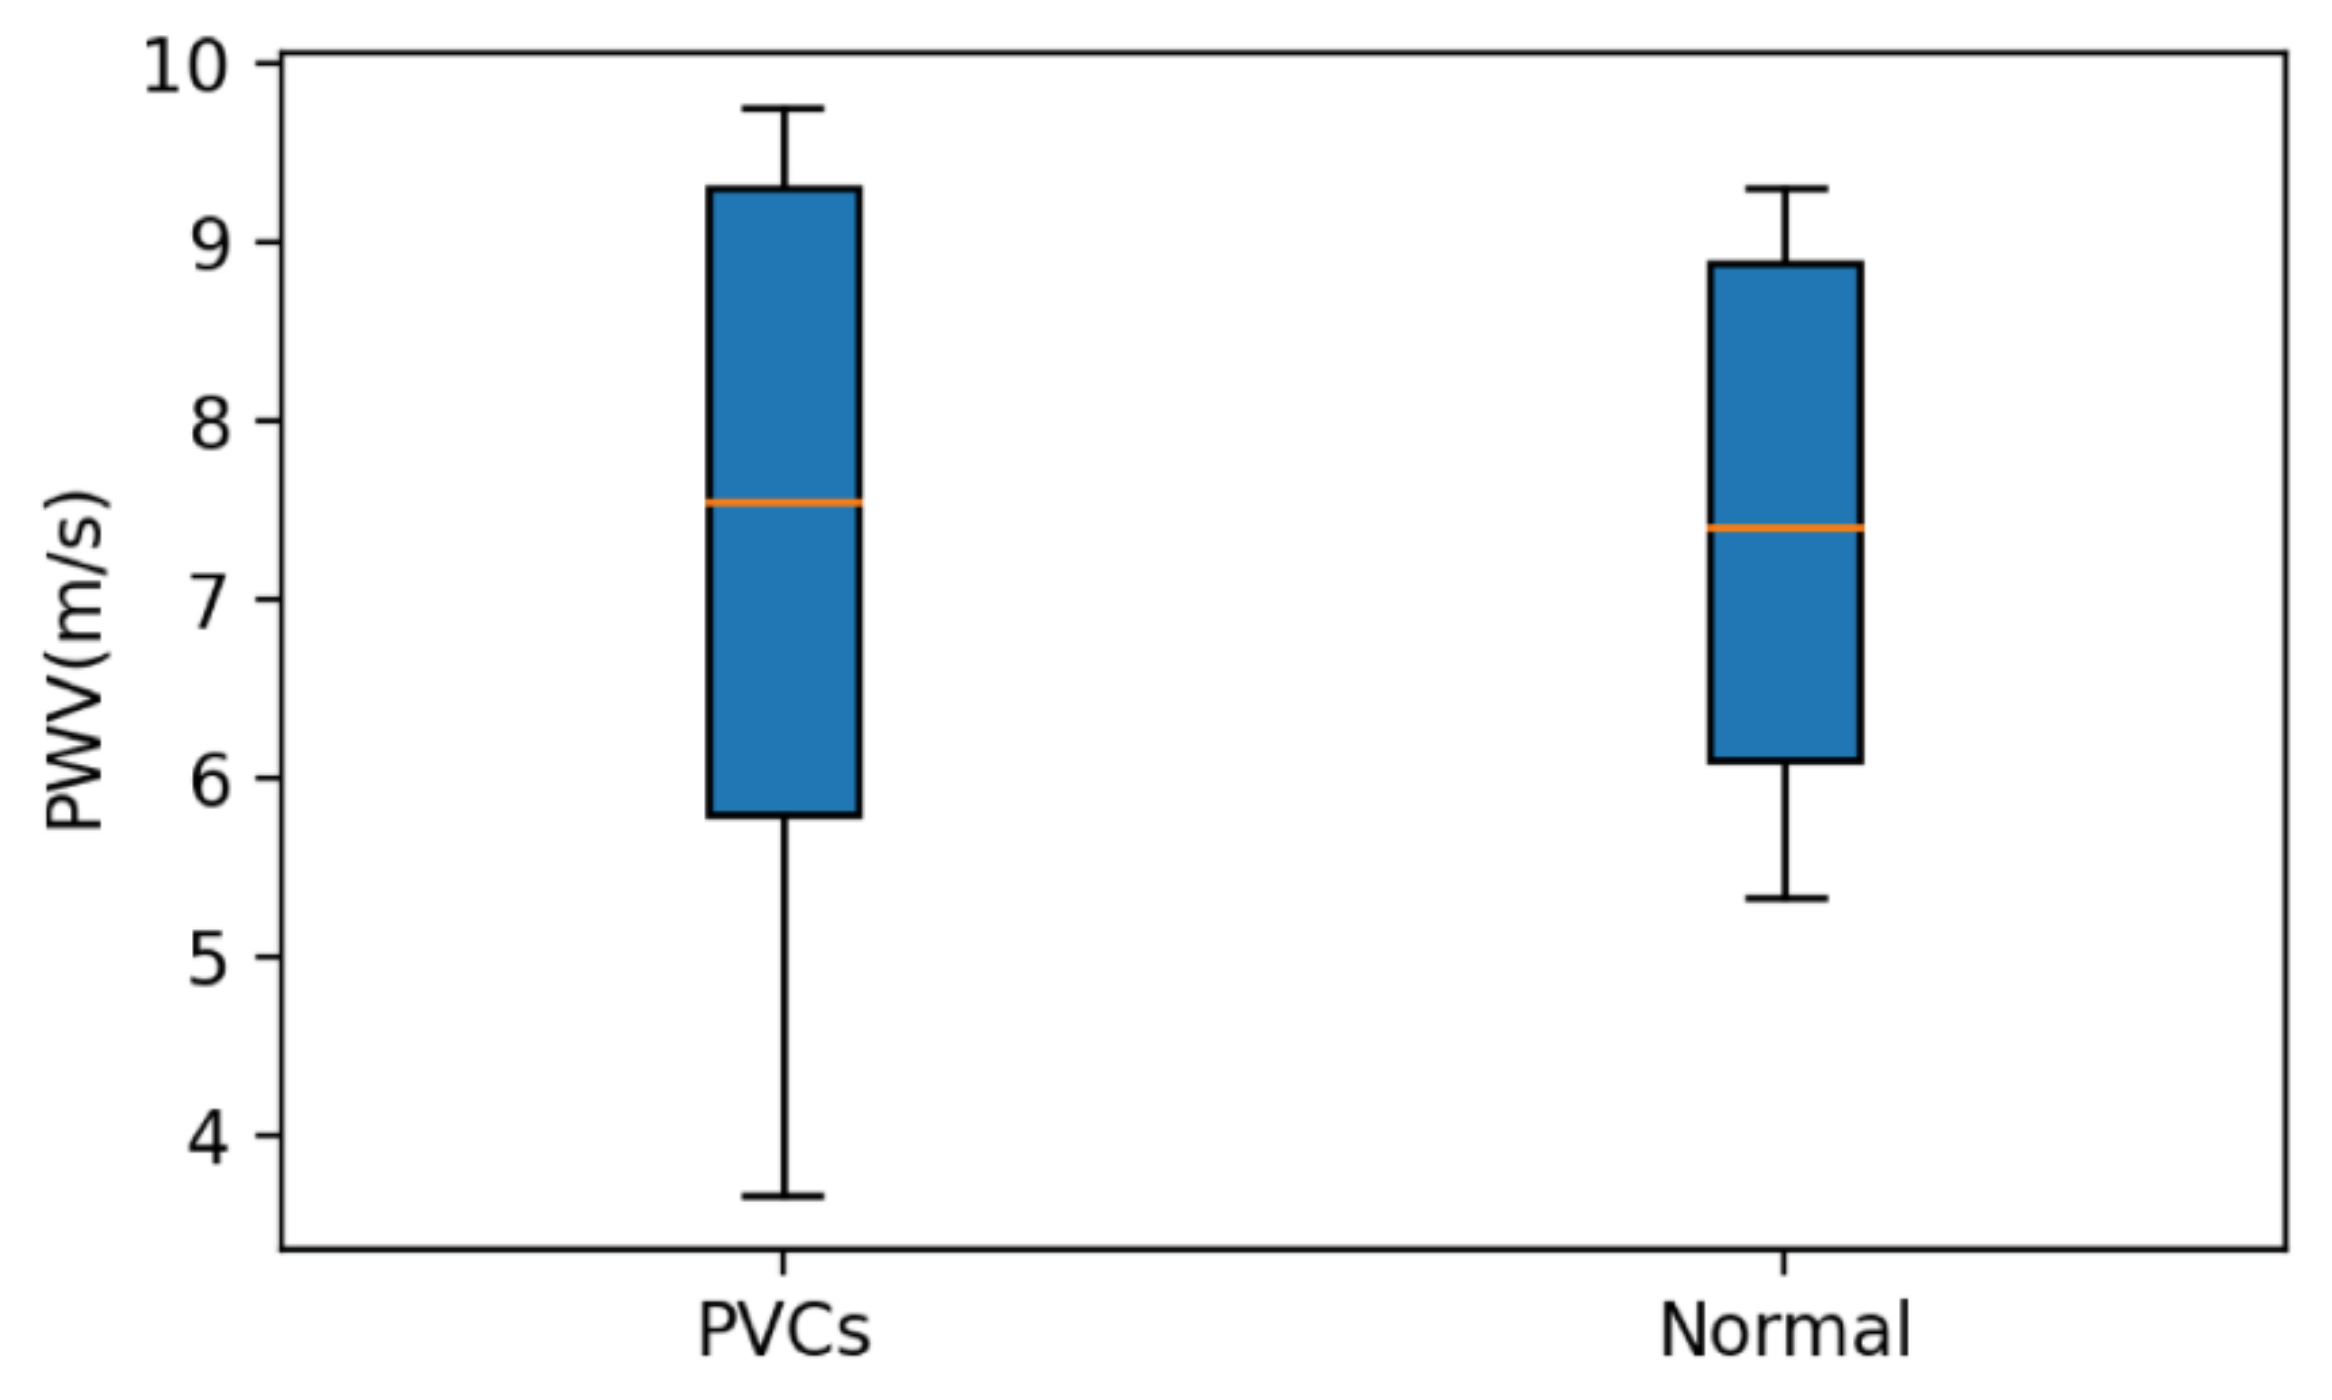
| Mean PWVArrhythmia (m/s) | 6.15 | 6.77 |
| Mean PWVNormal (m/s) | 6.34 | 7.14 |
| SBPReference (mmHg) | 112 | 126 |
| DBPReference (mmHg) | 74 | 86 |
| MAPReference (mmHg) | 86.54 | 99.2 |
| Mean MAPArrhythmia (mmHg) | 81.78 | 91.5 |
| Mean MAPNormal (mmHg) | 83.7 | 94.8 |
| MDReference−Arrhythmia (mmHg) | 4.76 | 7.7 |
| MDReference-Normal (mmHg) | 2.84 | 4.4 |
Publisher’s Note: MDPI stays neutral with regard to jurisdictional claims in published maps and institutional affiliations. |
© 2021 by the authors. Licensee MDPI, Basel, Switzerland. This article is an open access article distributed under the terms and conditions of the Creative Commons Attribution (CC BY) license (https://creativecommons.org/licenses/by/4.0/).
Share and Cite
Guo, C.-Y.; Wang, K.-J.; Hsieh, T.-L. Piezoelectric Sensor for the Monitoring of Arterial Pulse Wave: Detection of Arrhythmia Occurring in PAC/PVC Patients. Sensors 2021, 21, 6915. https://doi.org/10.3390/s21206915
Guo C-Y, Wang K-J, Hsieh T-L. Piezoelectric Sensor for the Monitoring of Arterial Pulse Wave: Detection of Arrhythmia Occurring in PAC/PVC Patients. Sensors. 2021; 21(20):6915. https://doi.org/10.3390/s21206915
Chicago/Turabian StyleGuo, Cheng-Yan, Kuan-Jen Wang, and Tung-Li Hsieh. 2021. "Piezoelectric Sensor for the Monitoring of Arterial Pulse Wave: Detection of Arrhythmia Occurring in PAC/PVC Patients" Sensors 21, no. 20: 6915. https://doi.org/10.3390/s21206915
APA StyleGuo, C.-Y., Wang, K.-J., & Hsieh, T.-L. (2021). Piezoelectric Sensor for the Monitoring of Arterial Pulse Wave: Detection of Arrhythmia Occurring in PAC/PVC Patients. Sensors, 21(20), 6915. https://doi.org/10.3390/s21206915