An Optimal Parameter Selection Method for MOMEDA Based on EHNR and Its Spectral Entropy


Abstract
1. Introduction
2. Theoretical Background
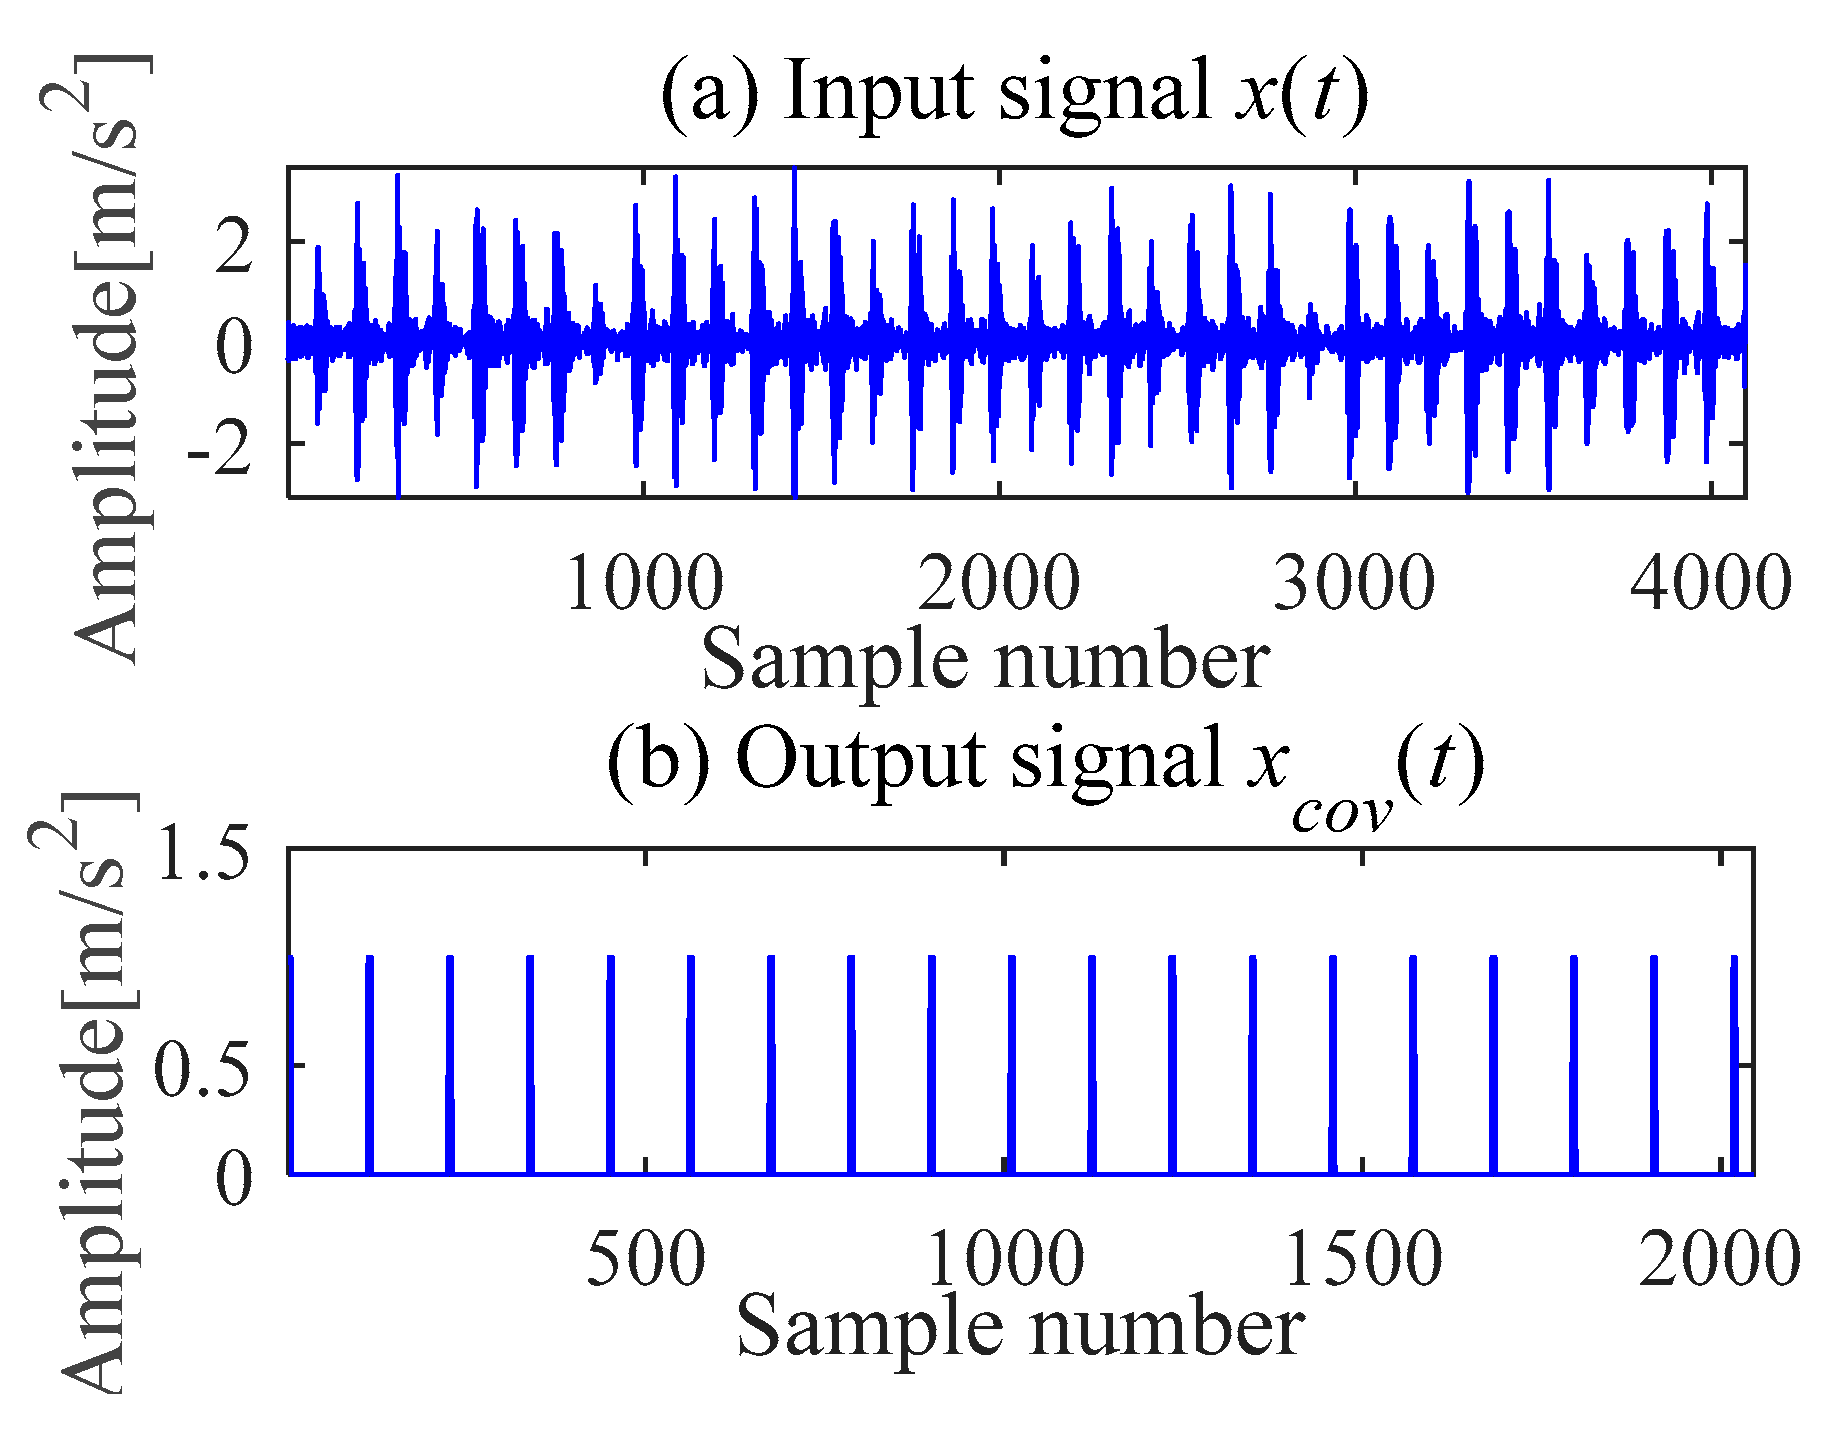
2.1. MOMEDA Method
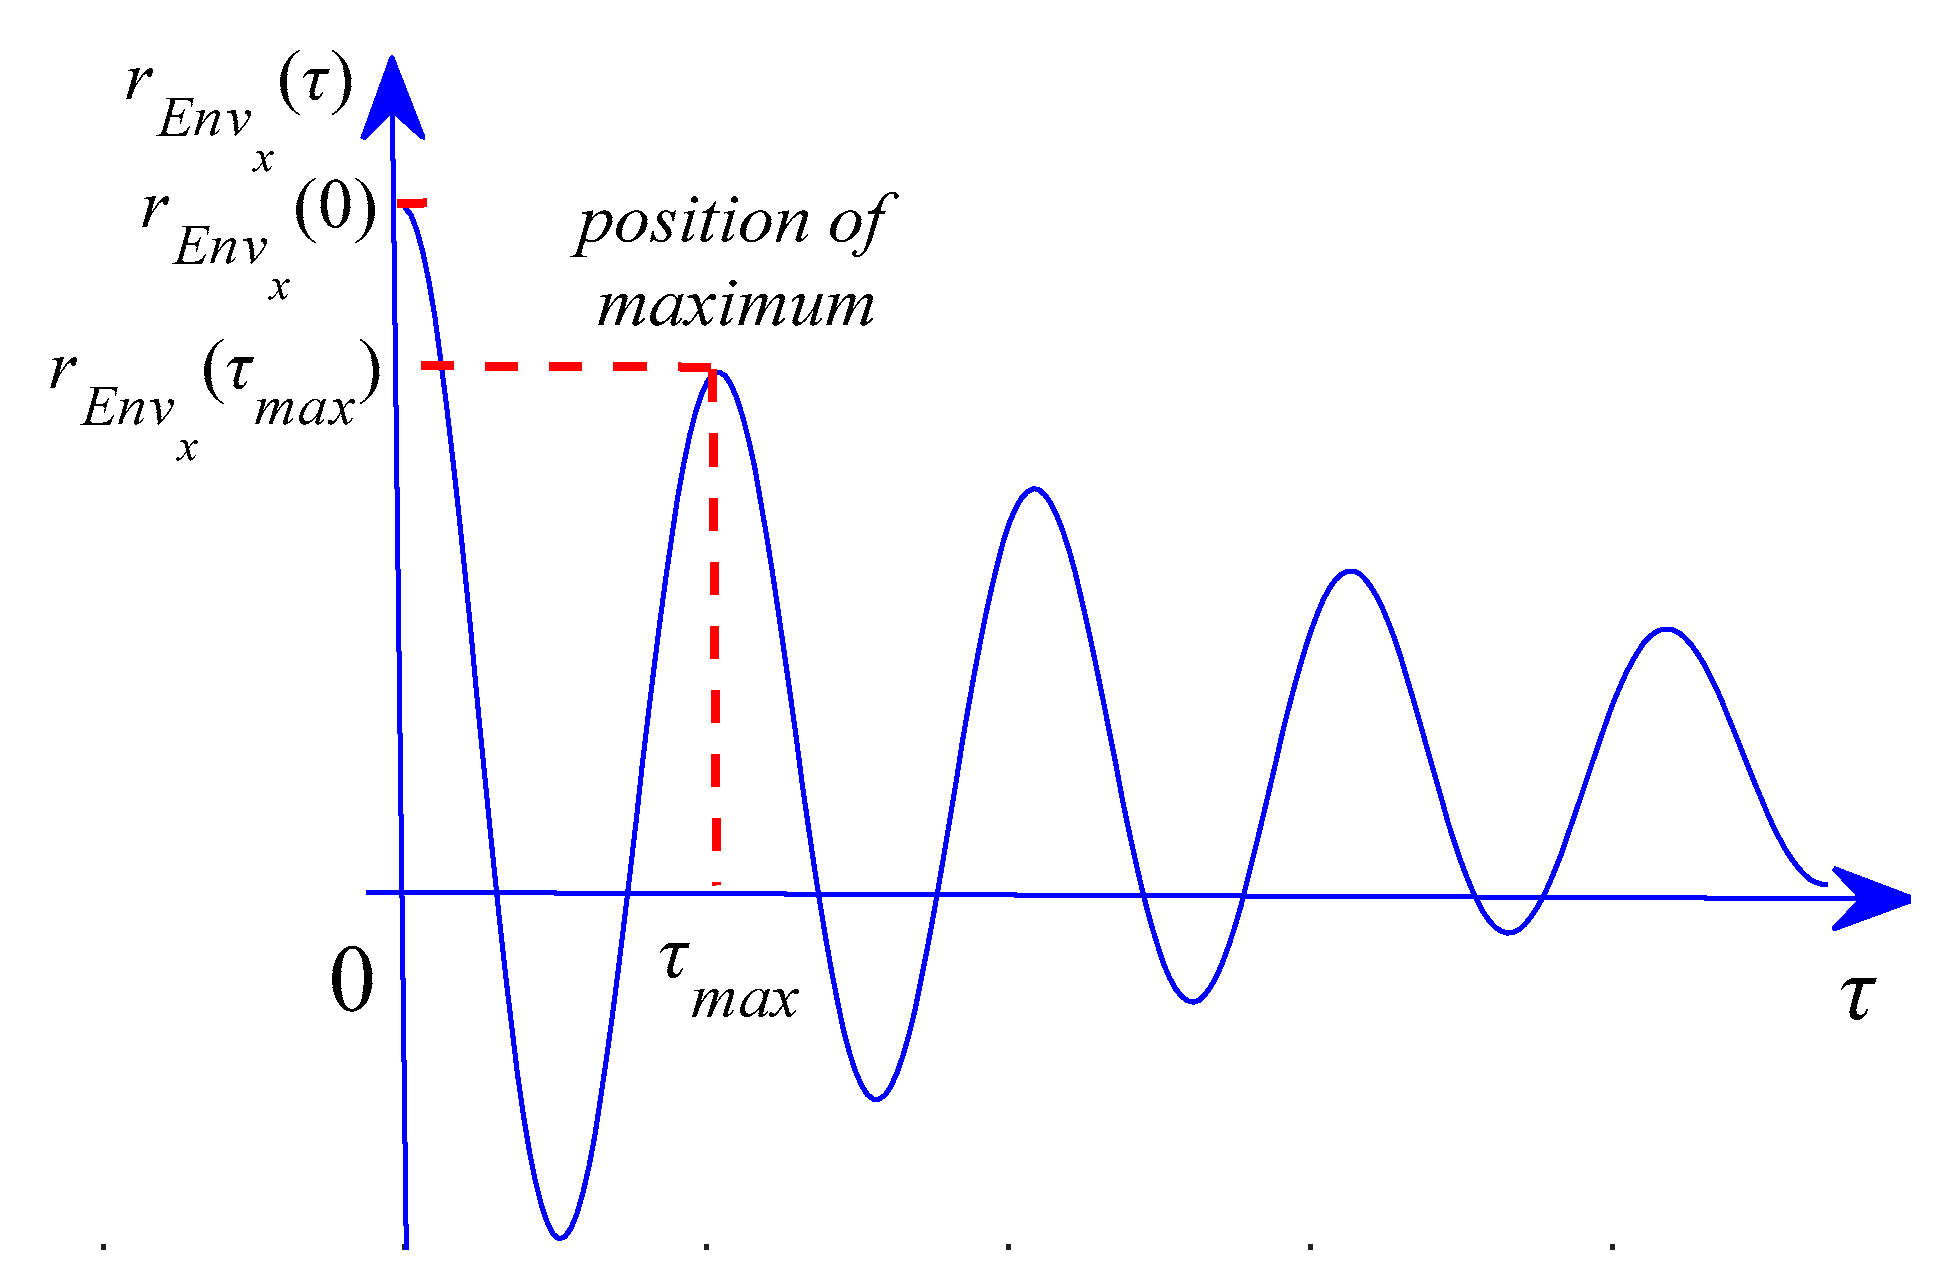
2.2. EHNR Principle
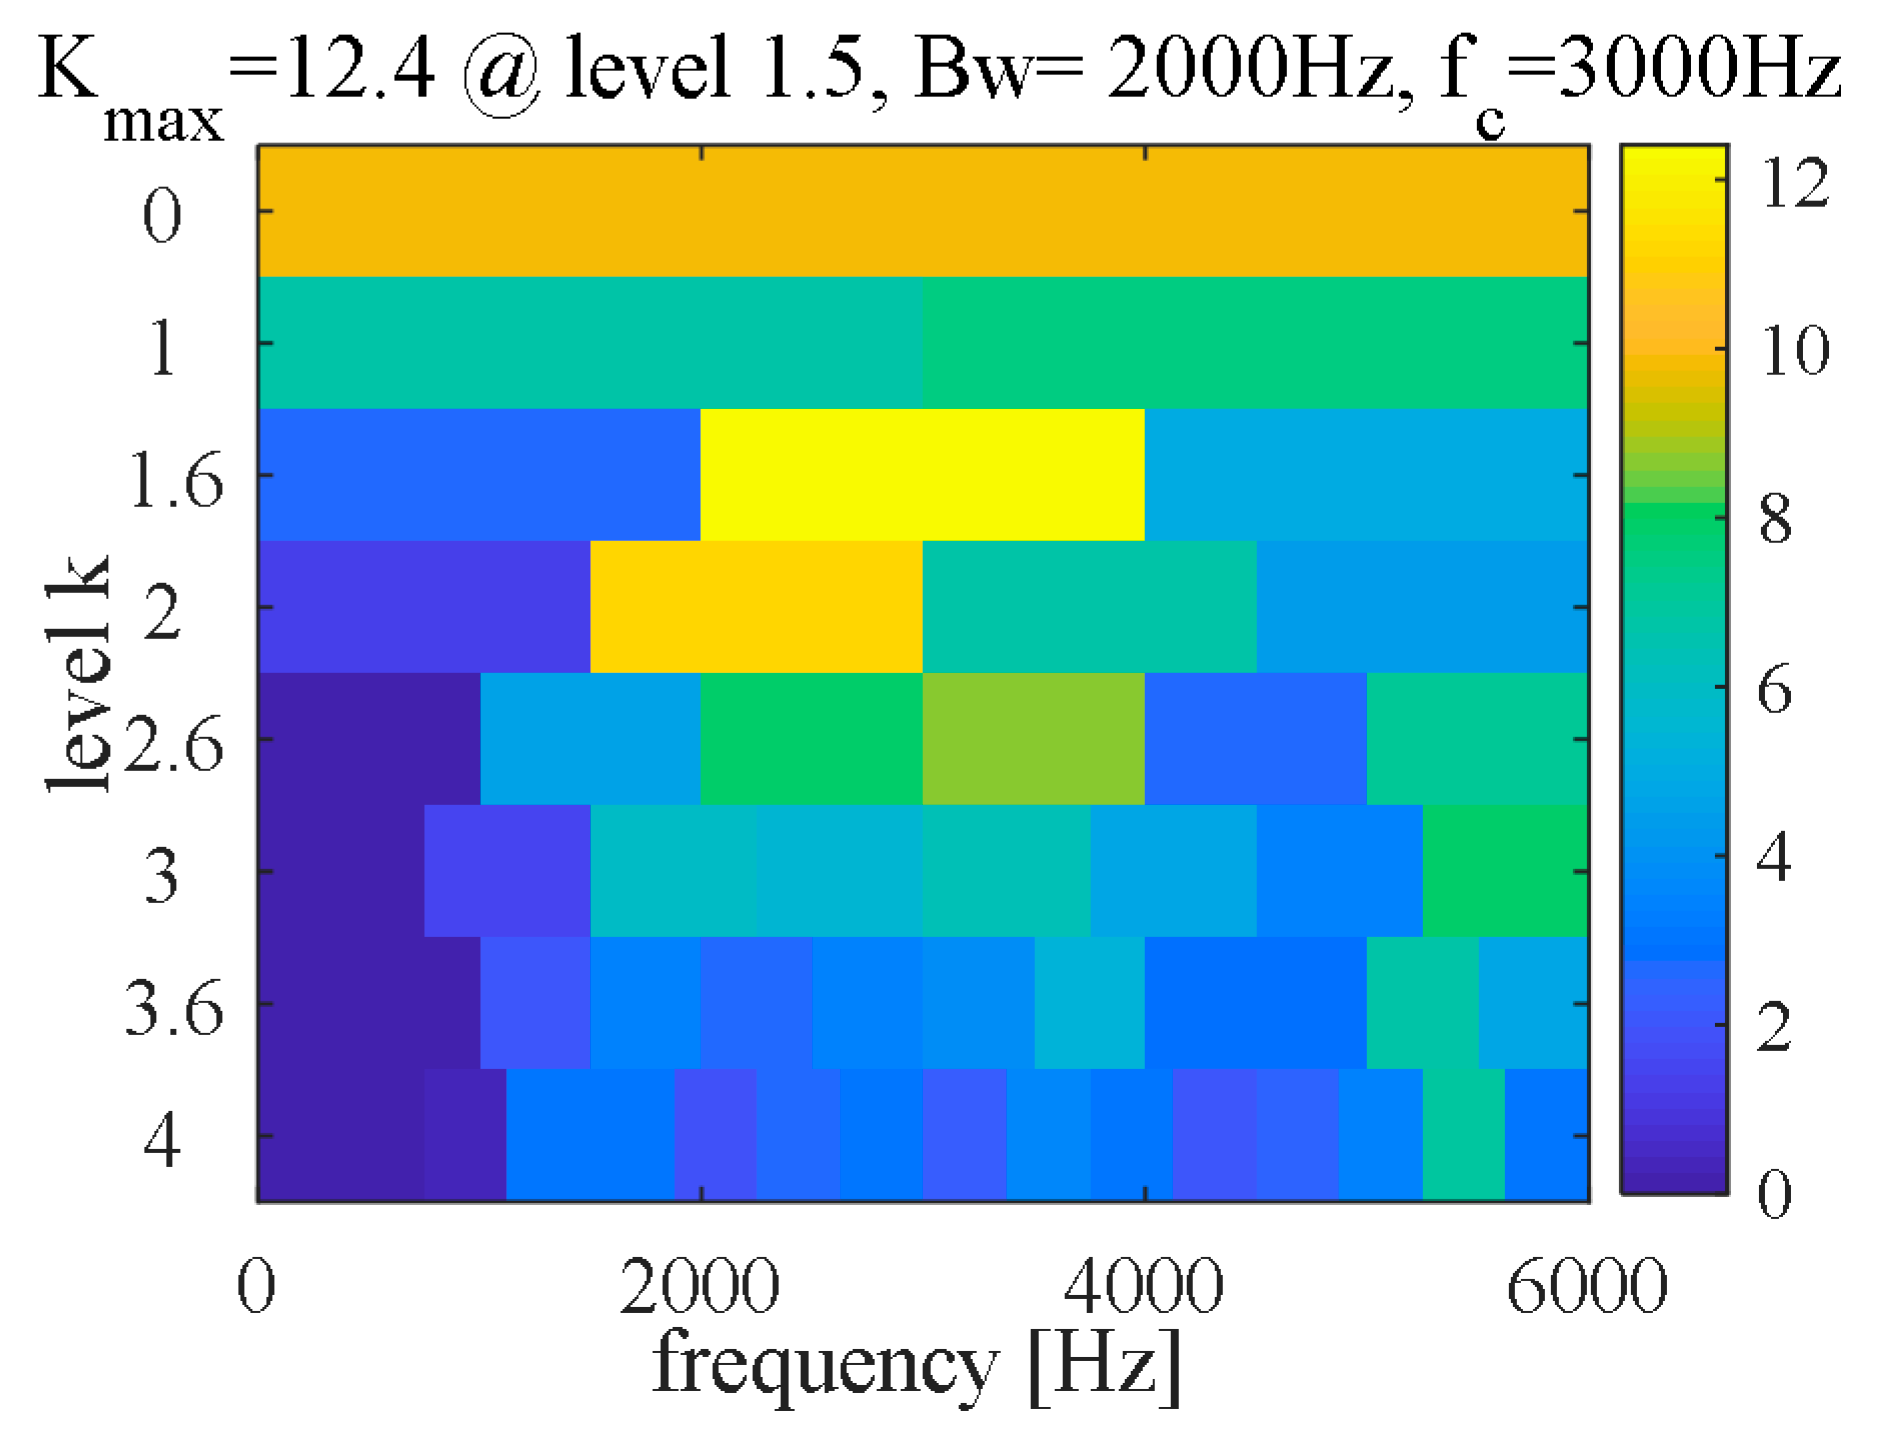
2.3. Setting Filter Length L Based on Grid Search Method
2.4. TKEO Algorithm
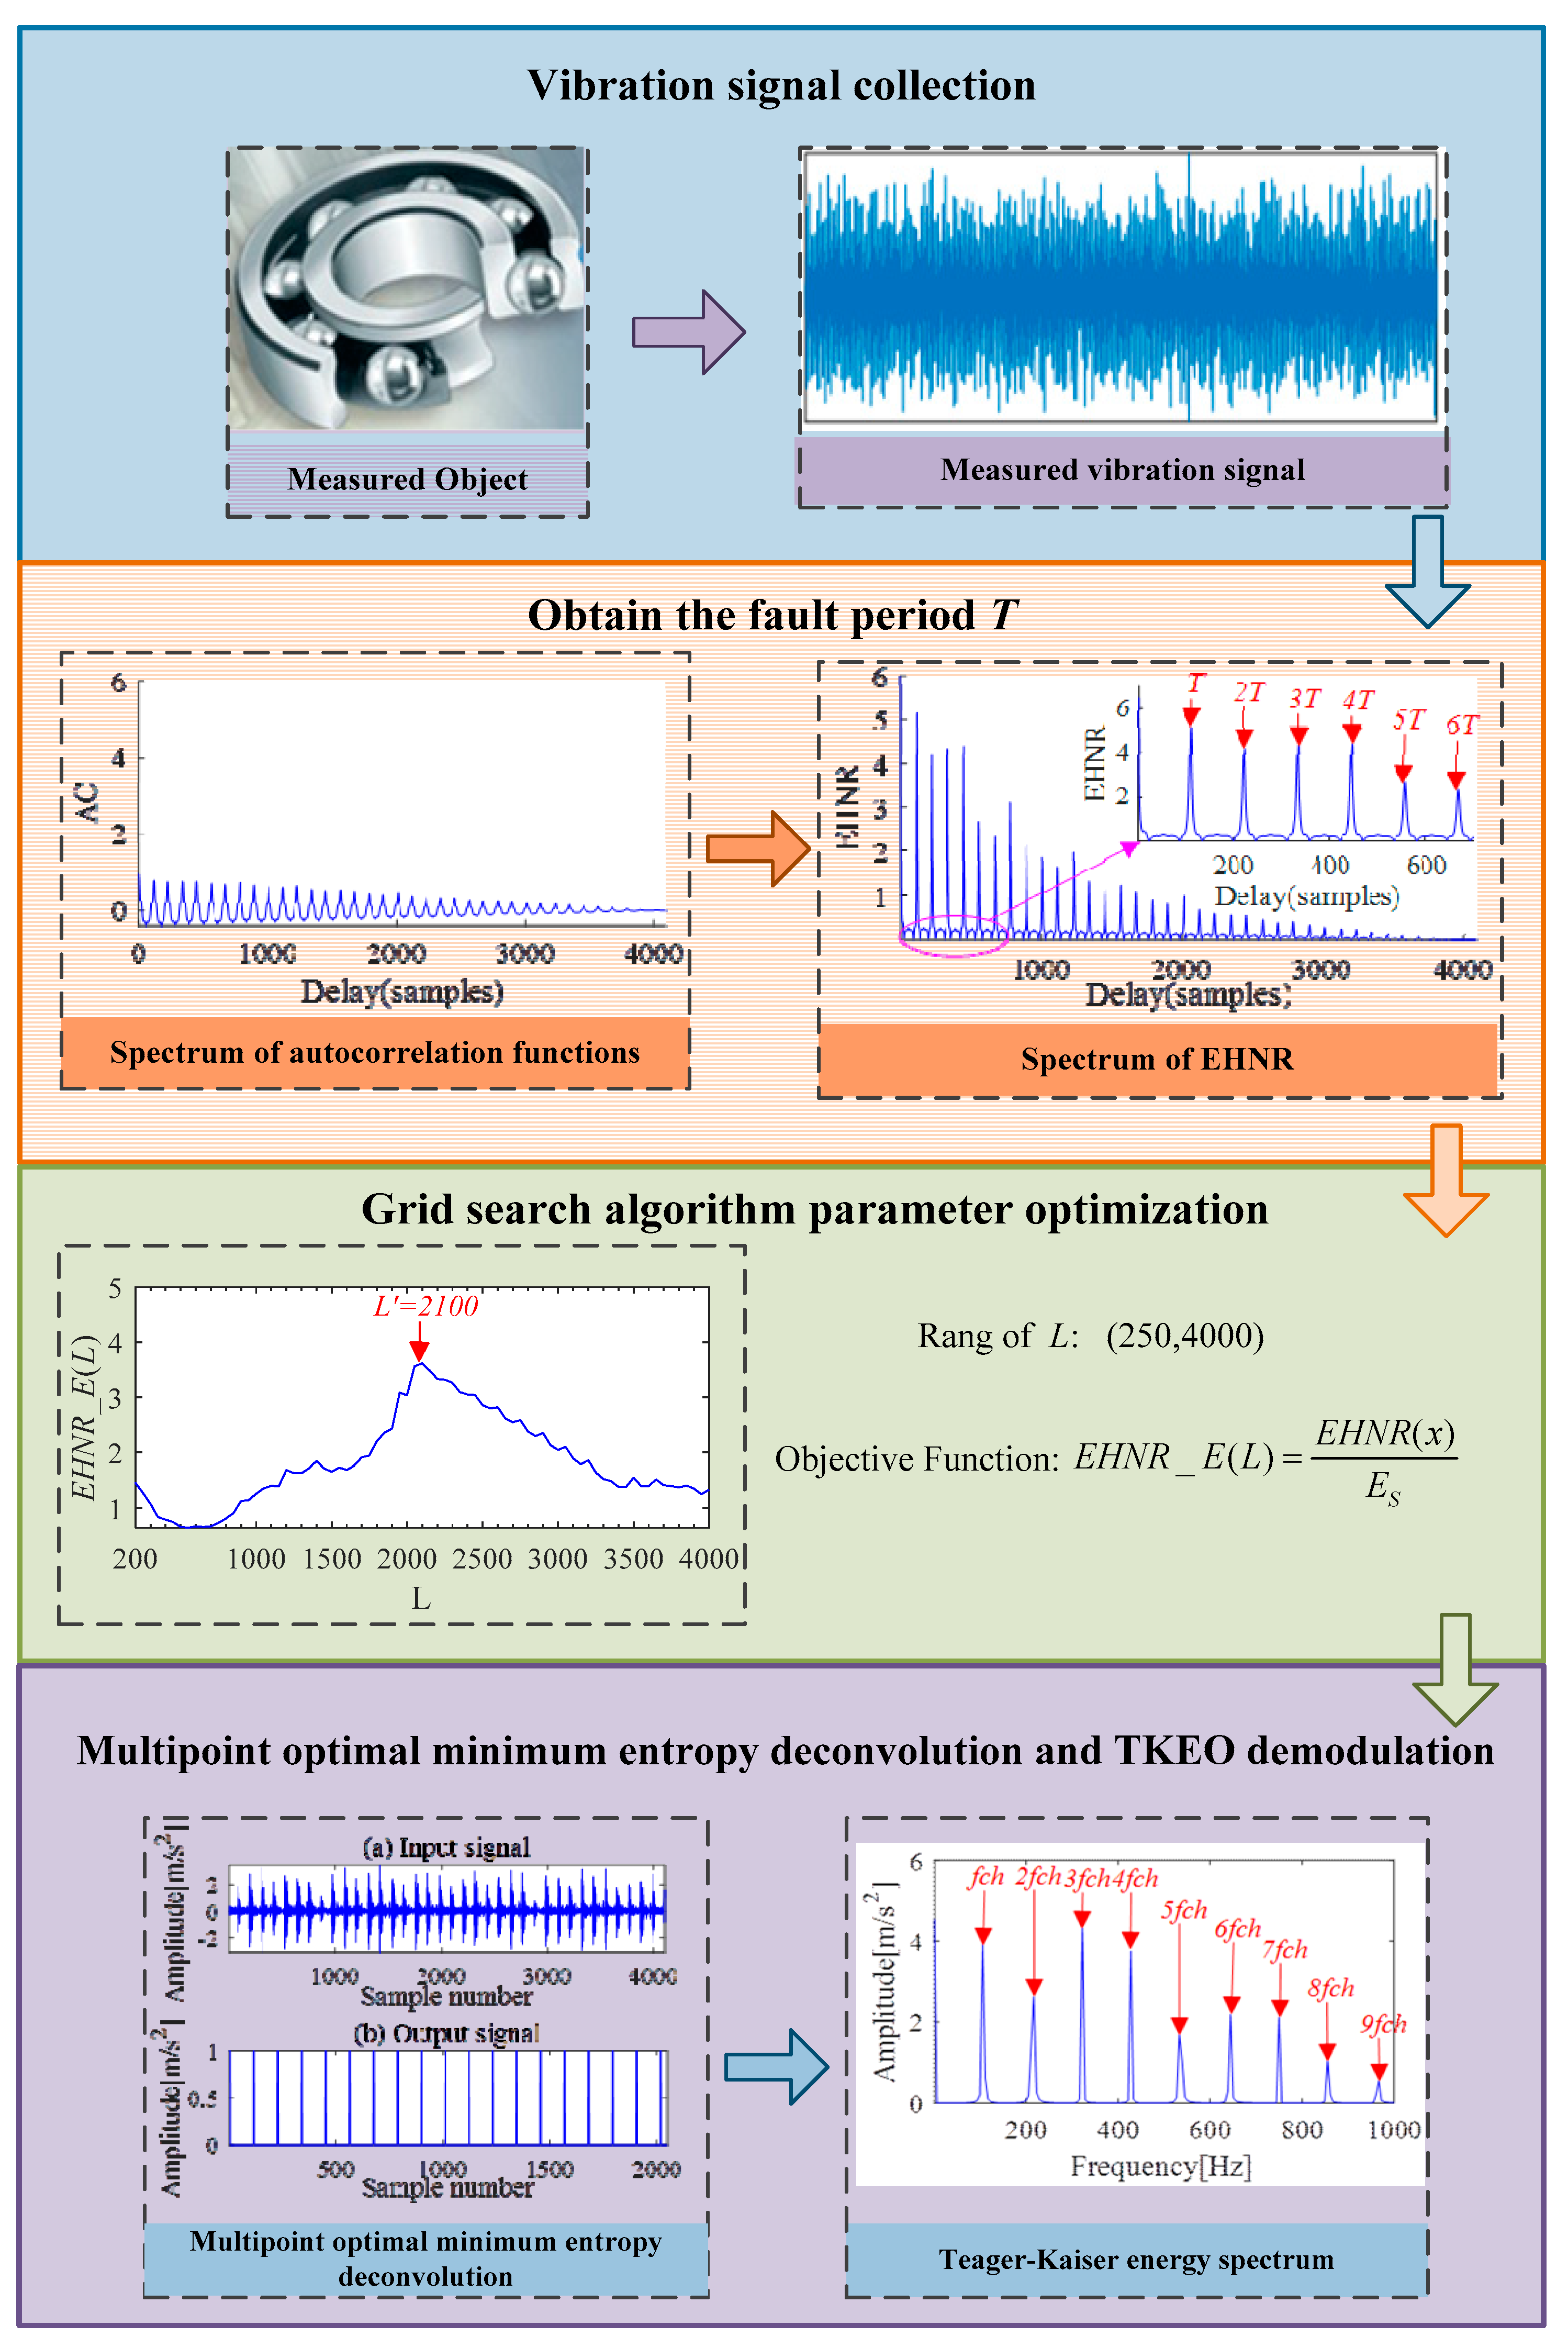
3. The Proposed Method
4. Experimental and Comparative Analysis
4.1. Case 1: CWRU Data Analysis
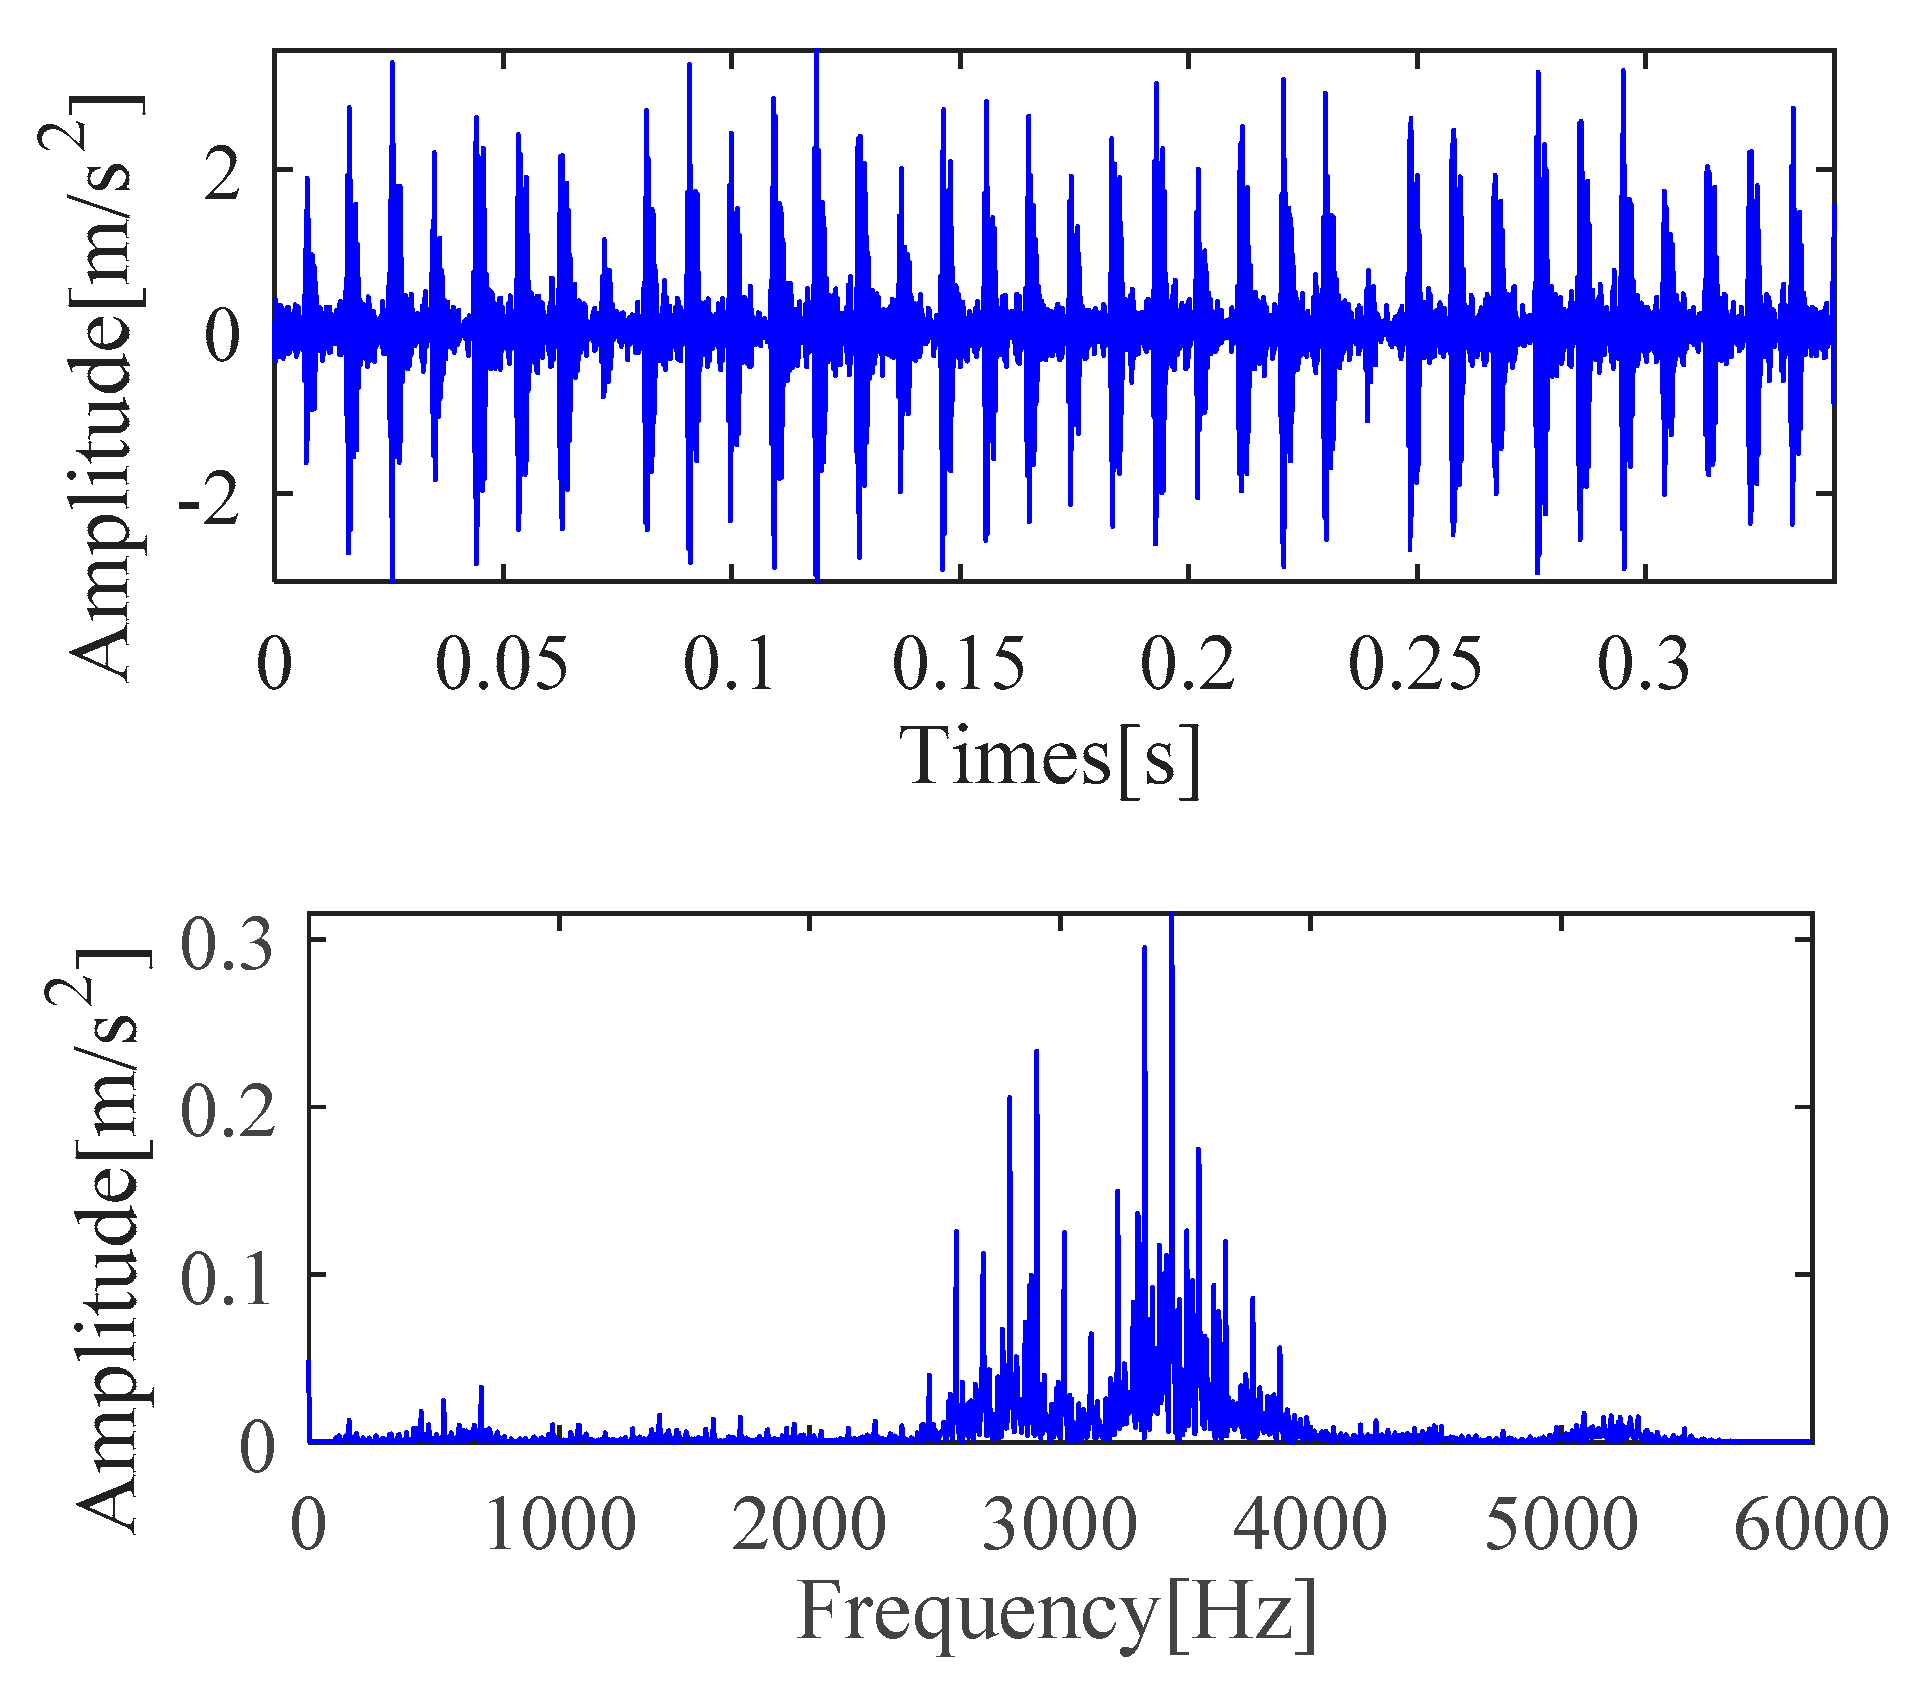
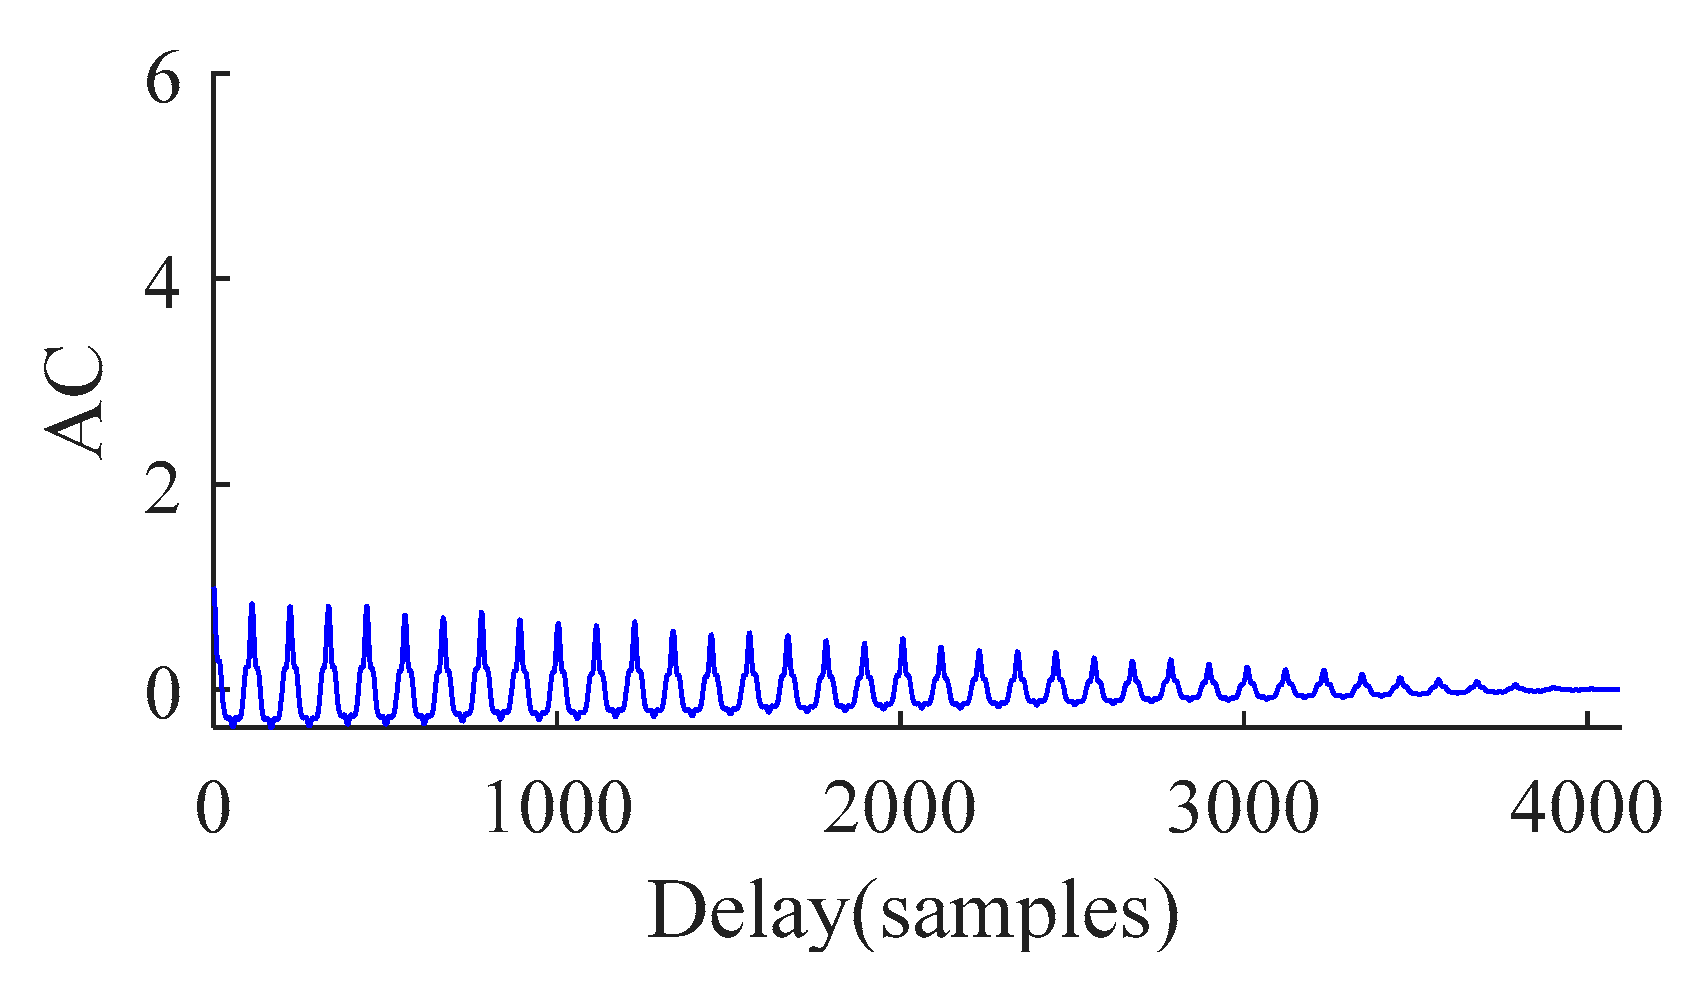
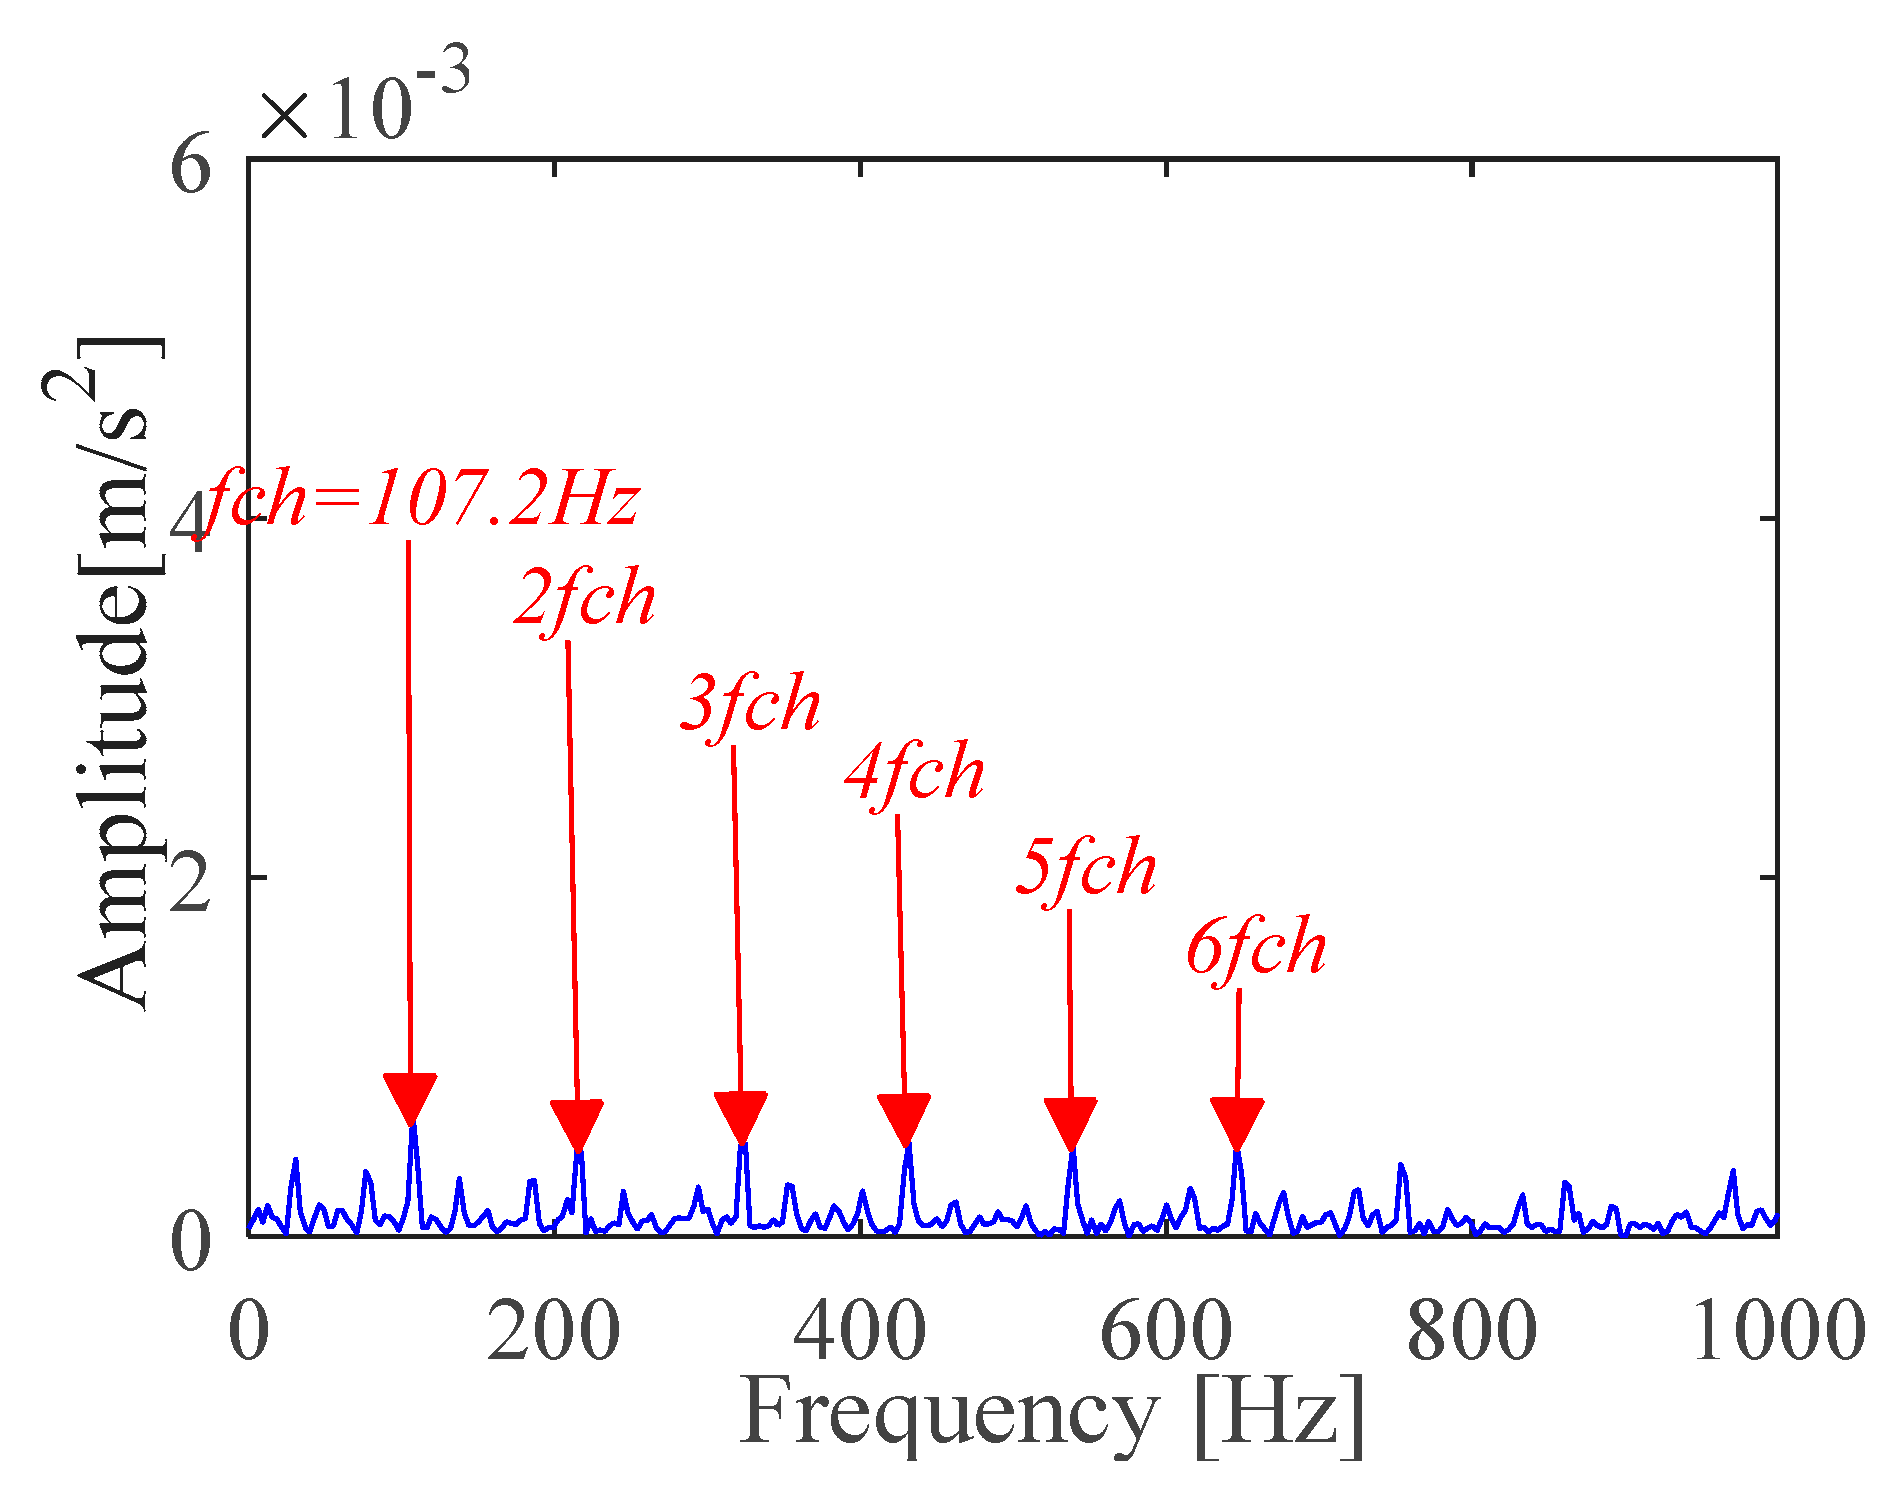
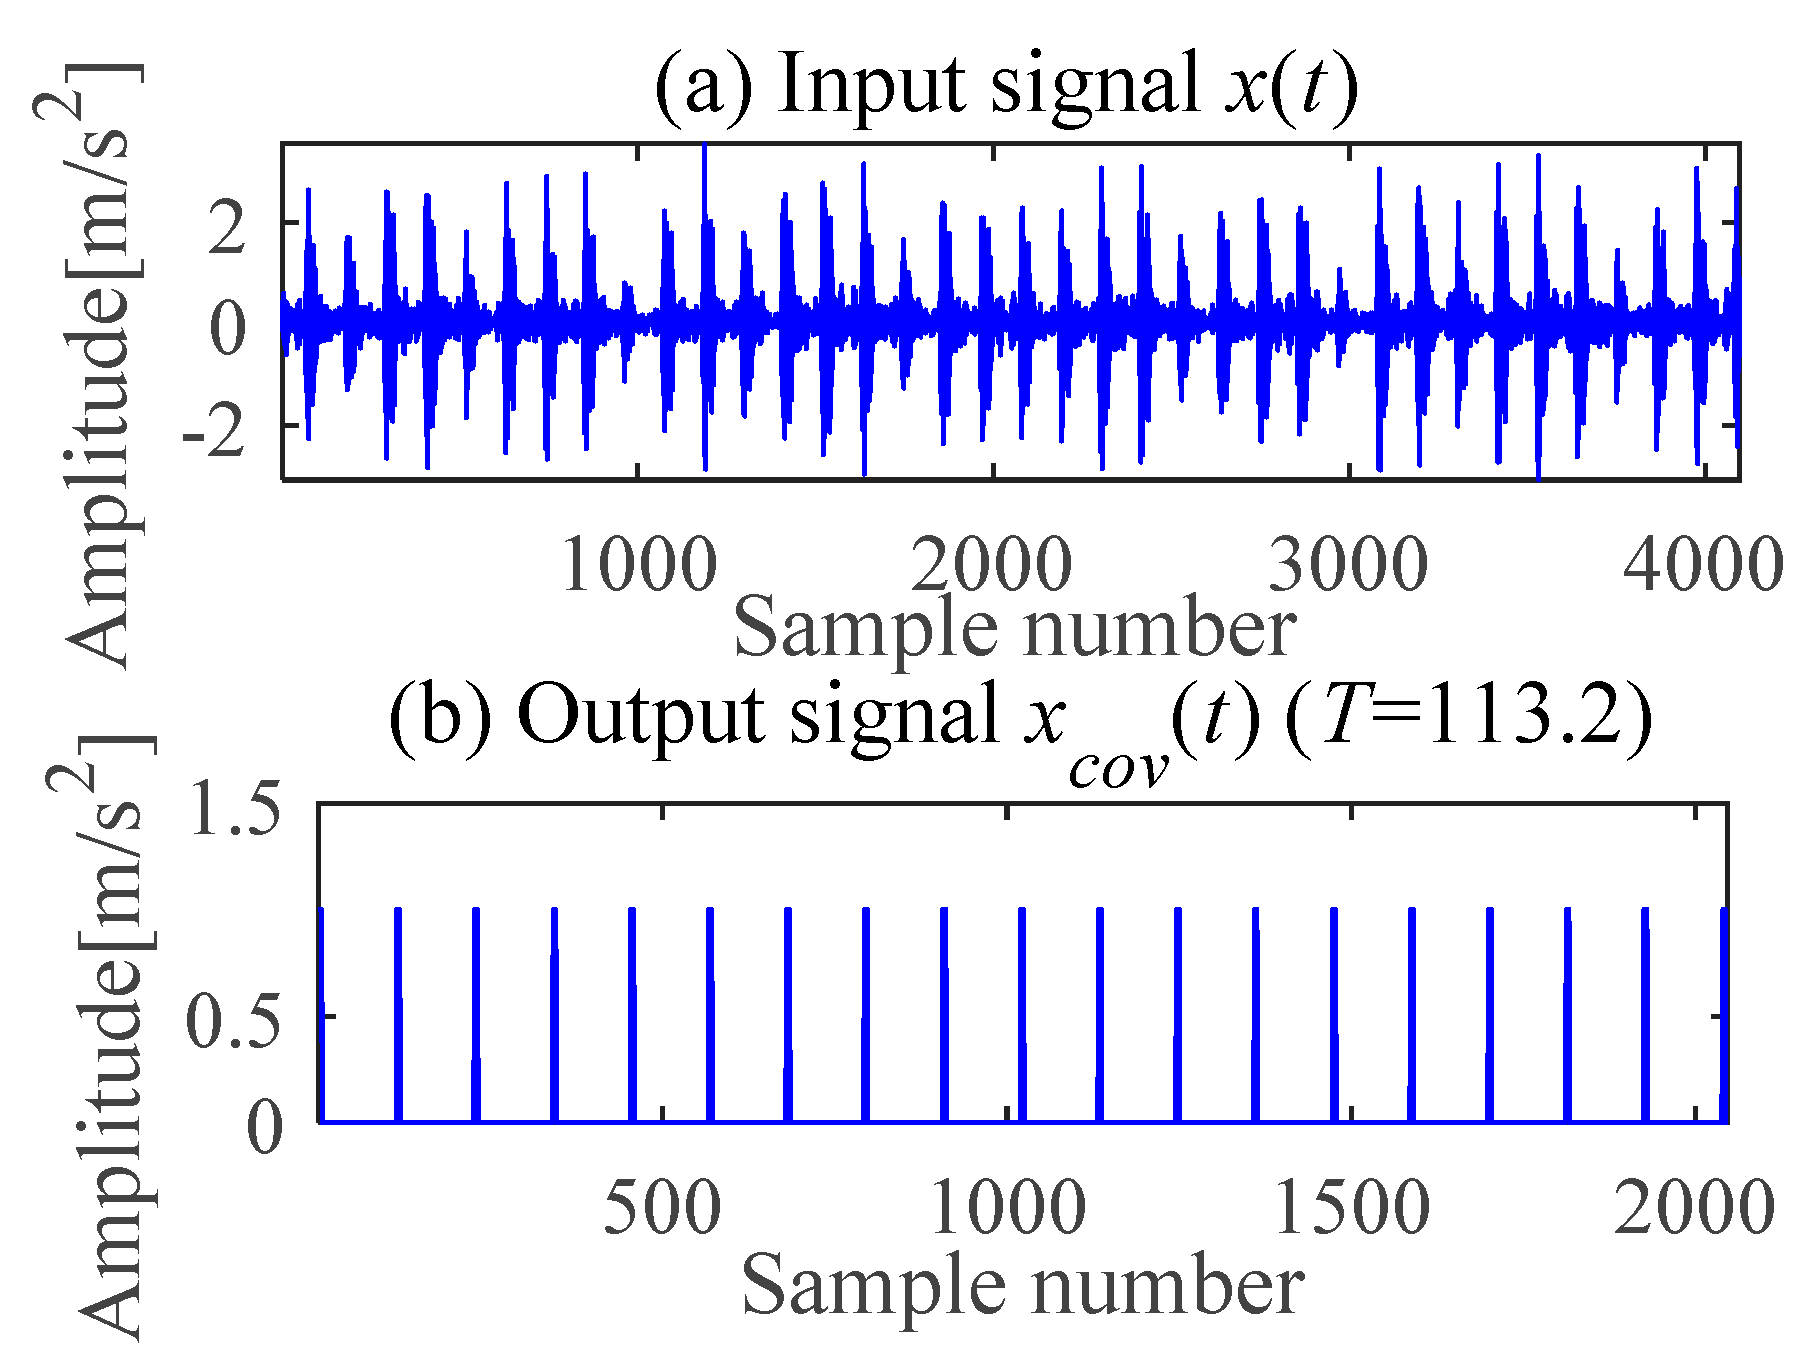
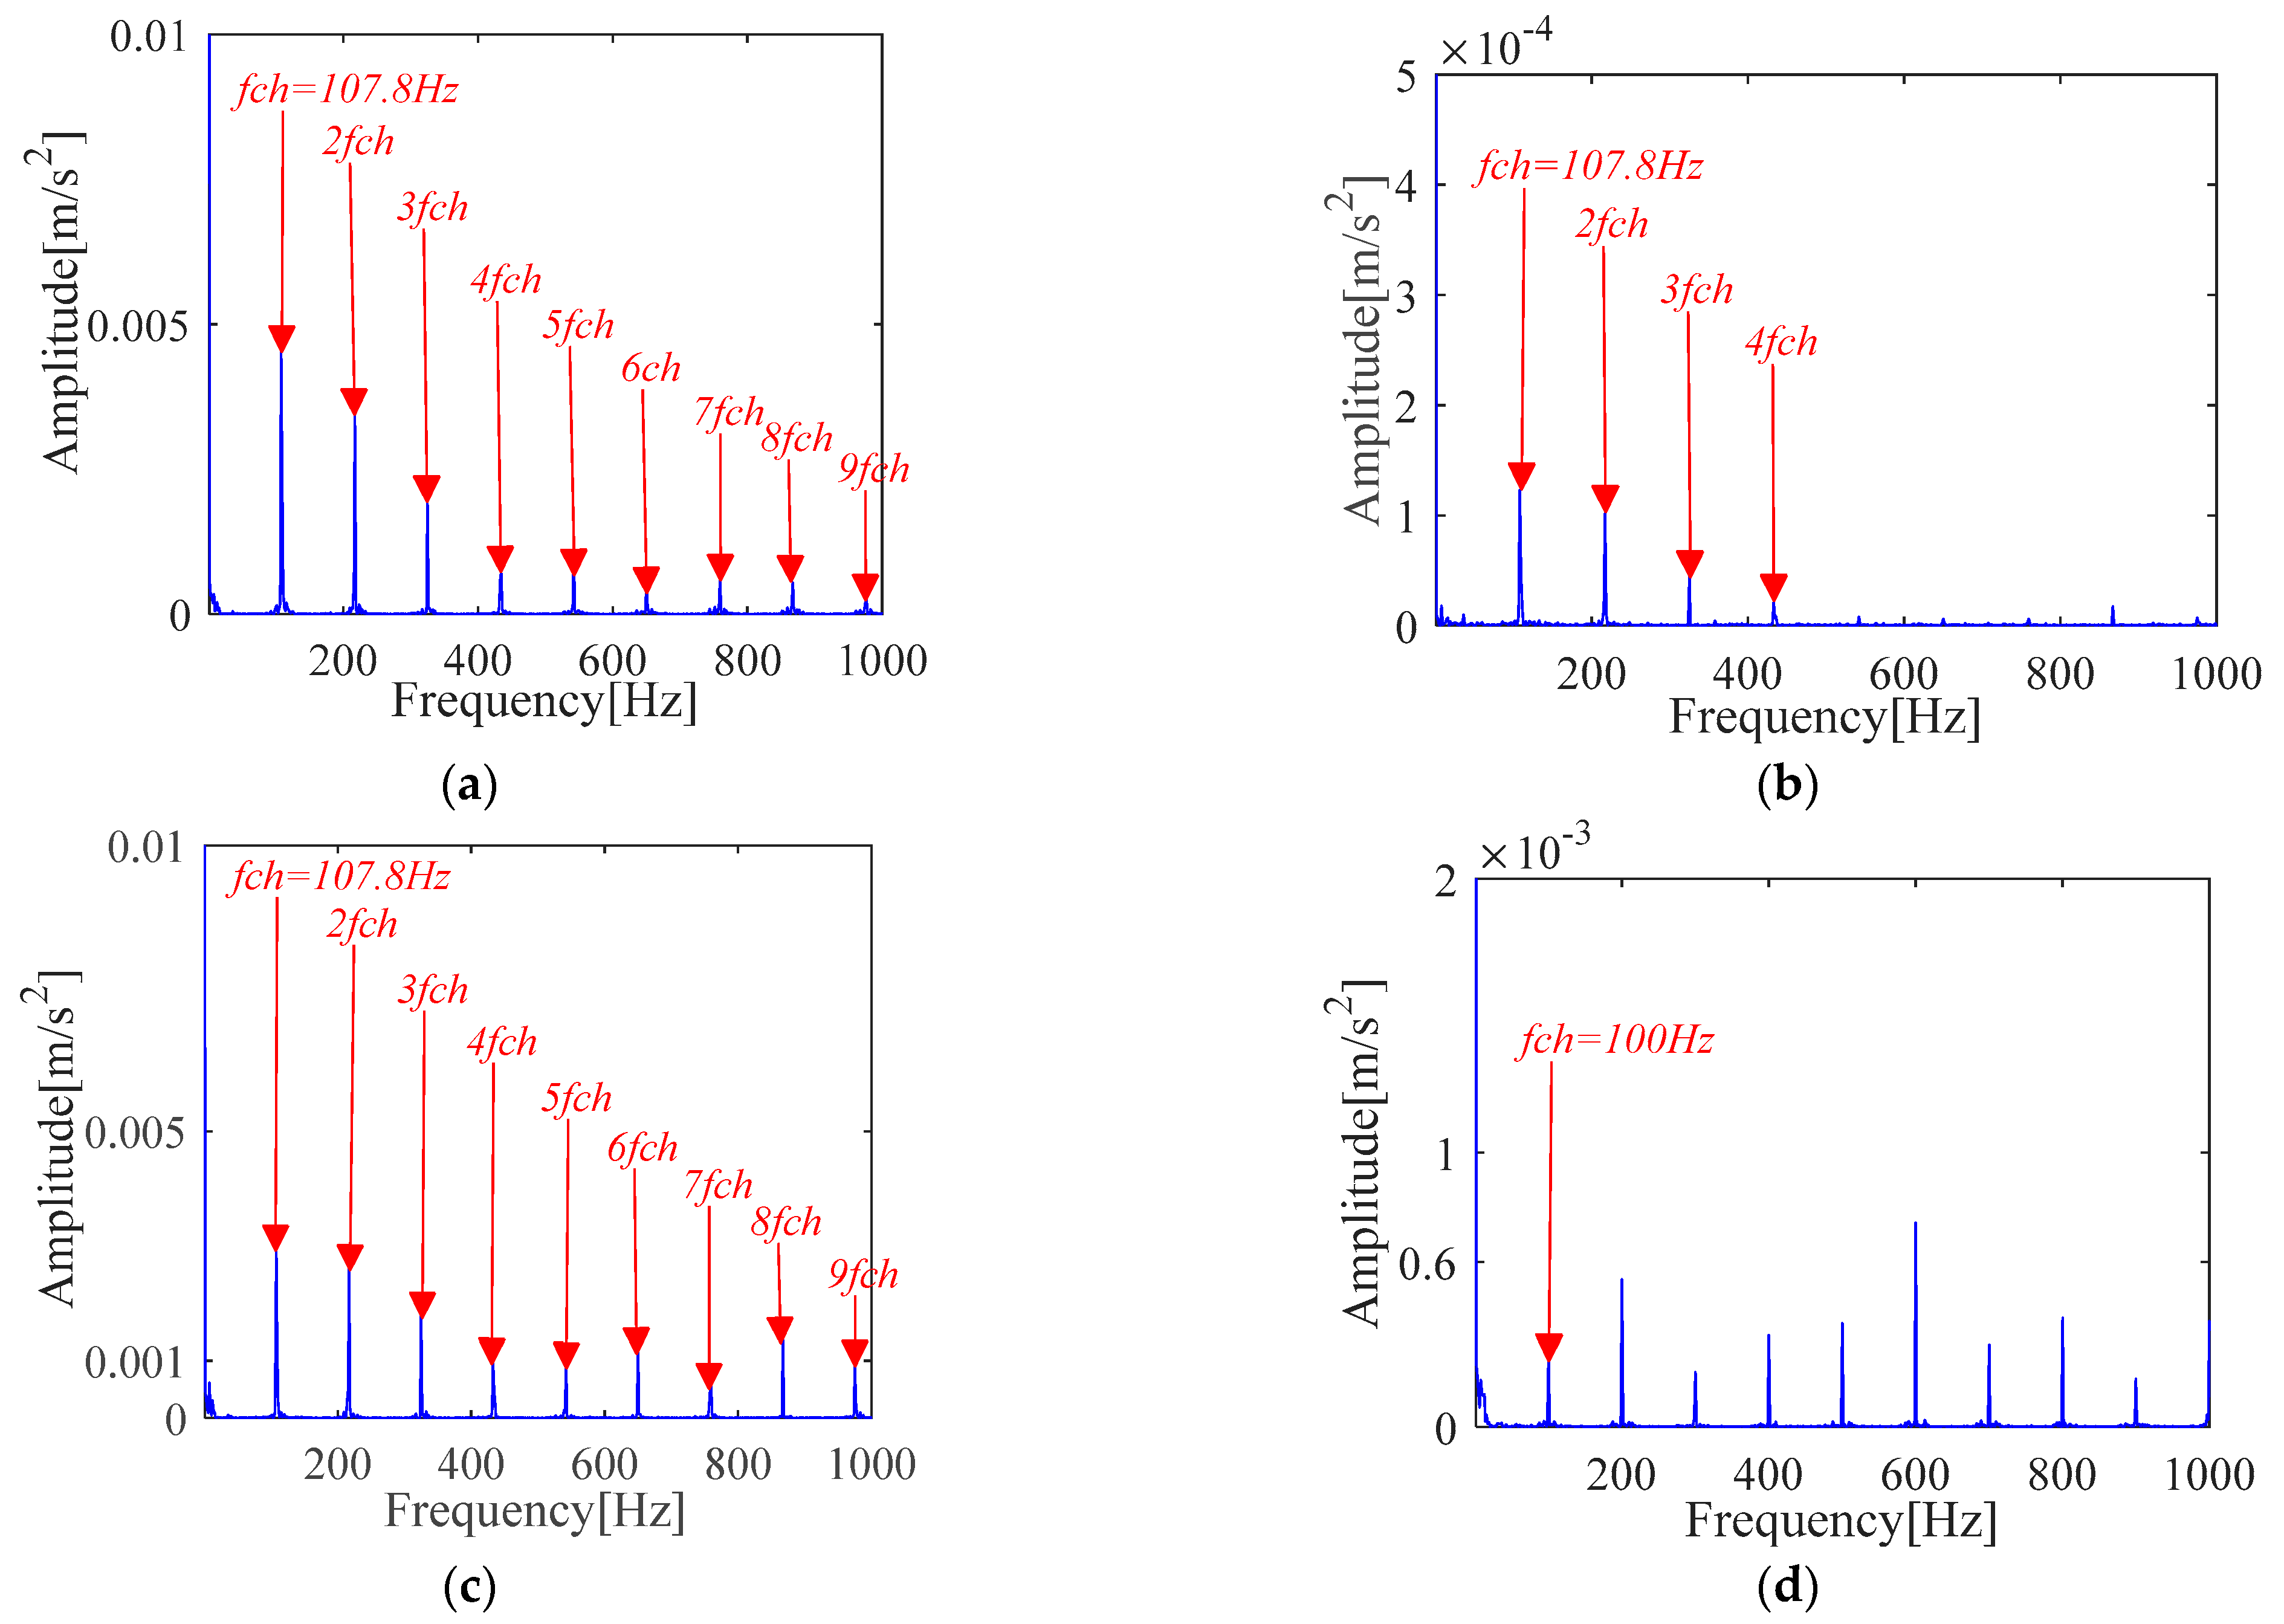
4.1.1. Outer Race Fault Feature Extraction
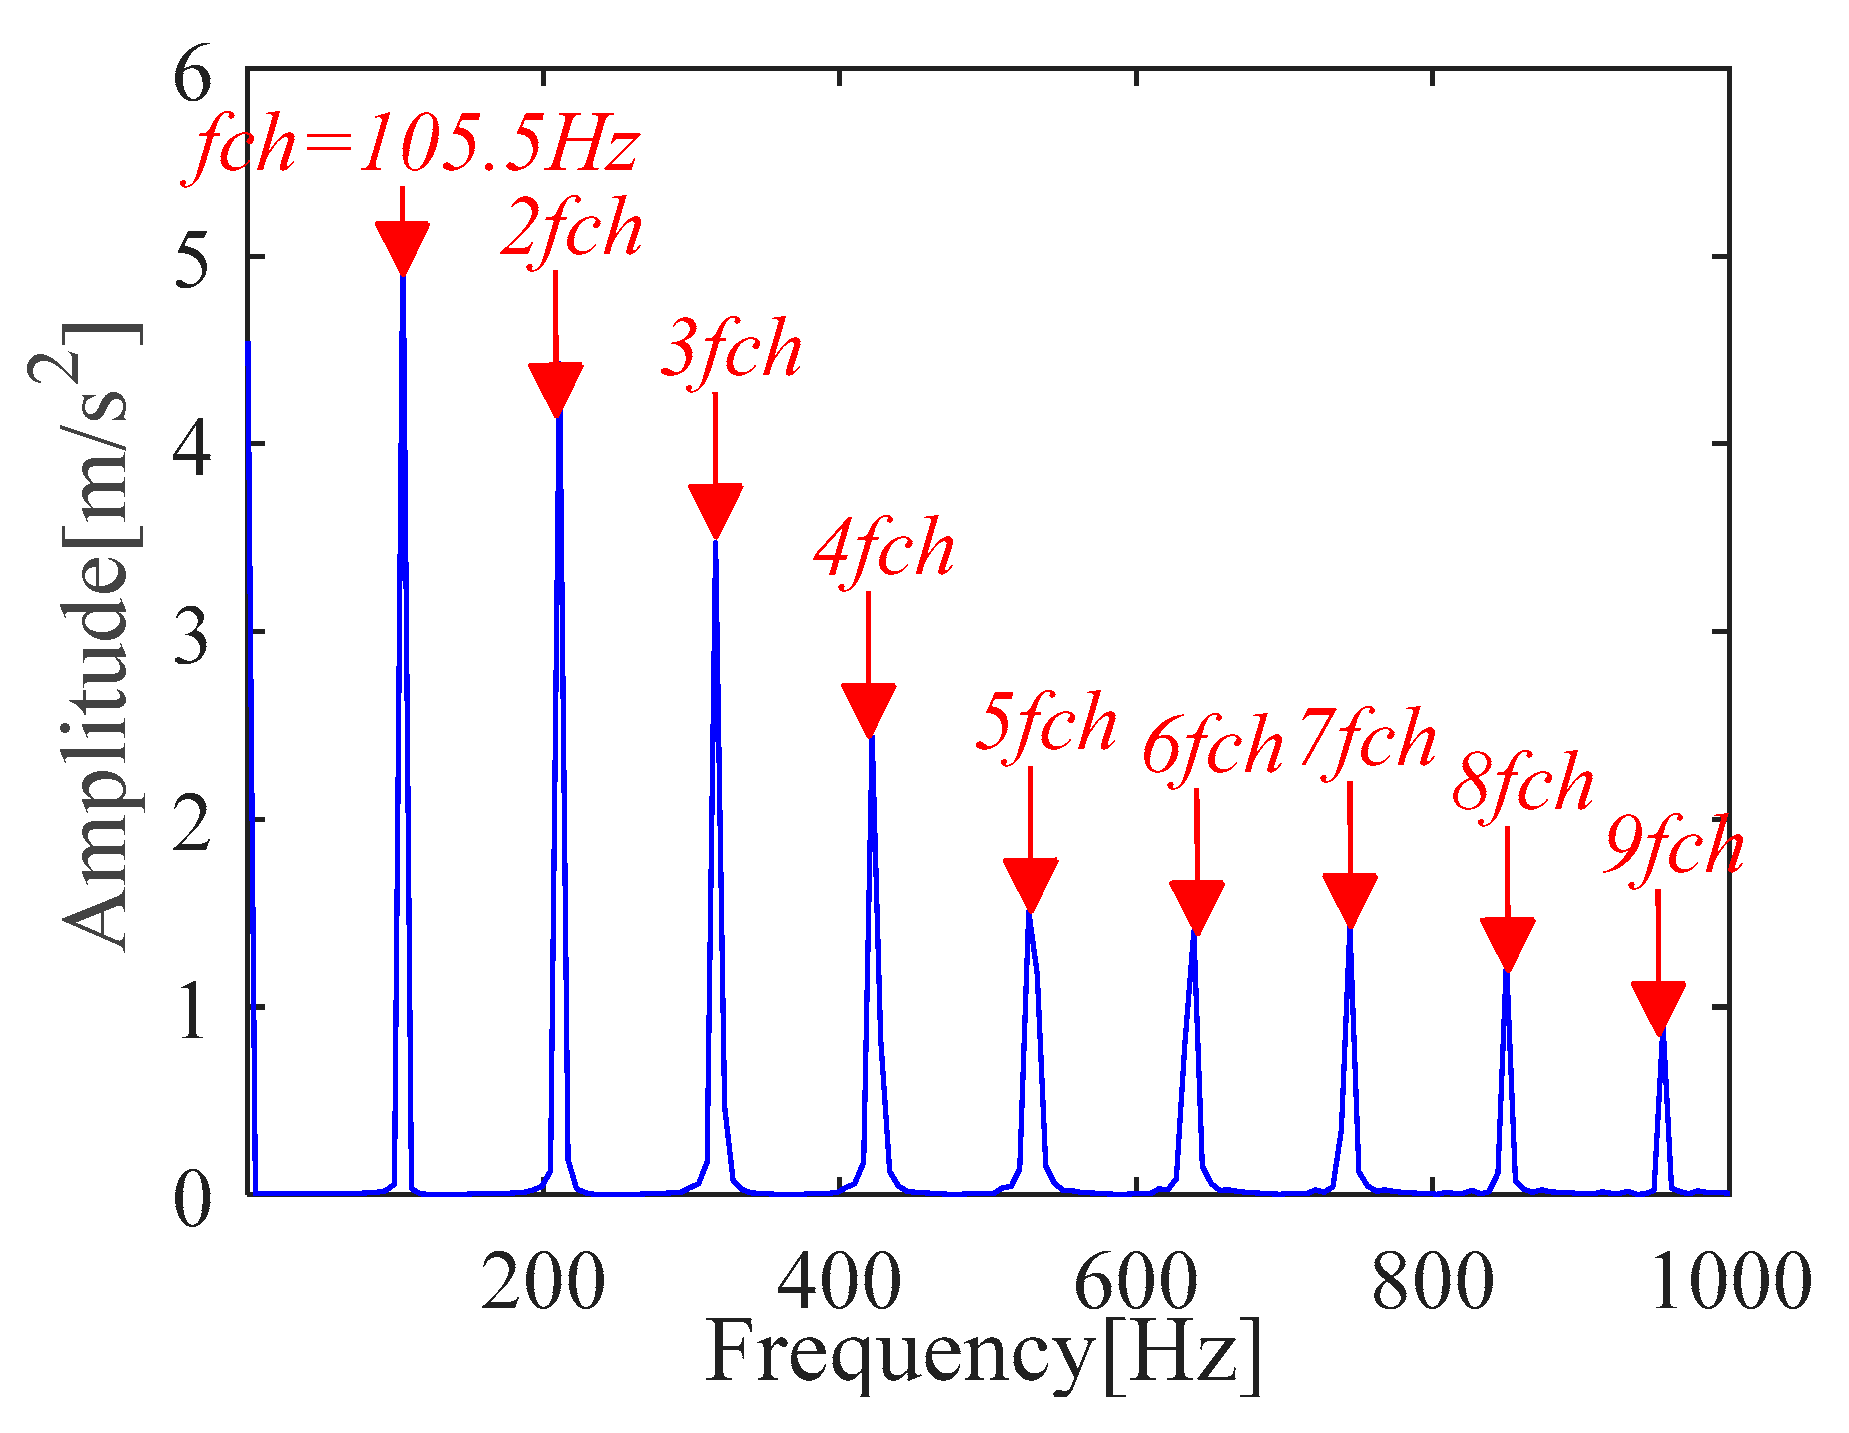
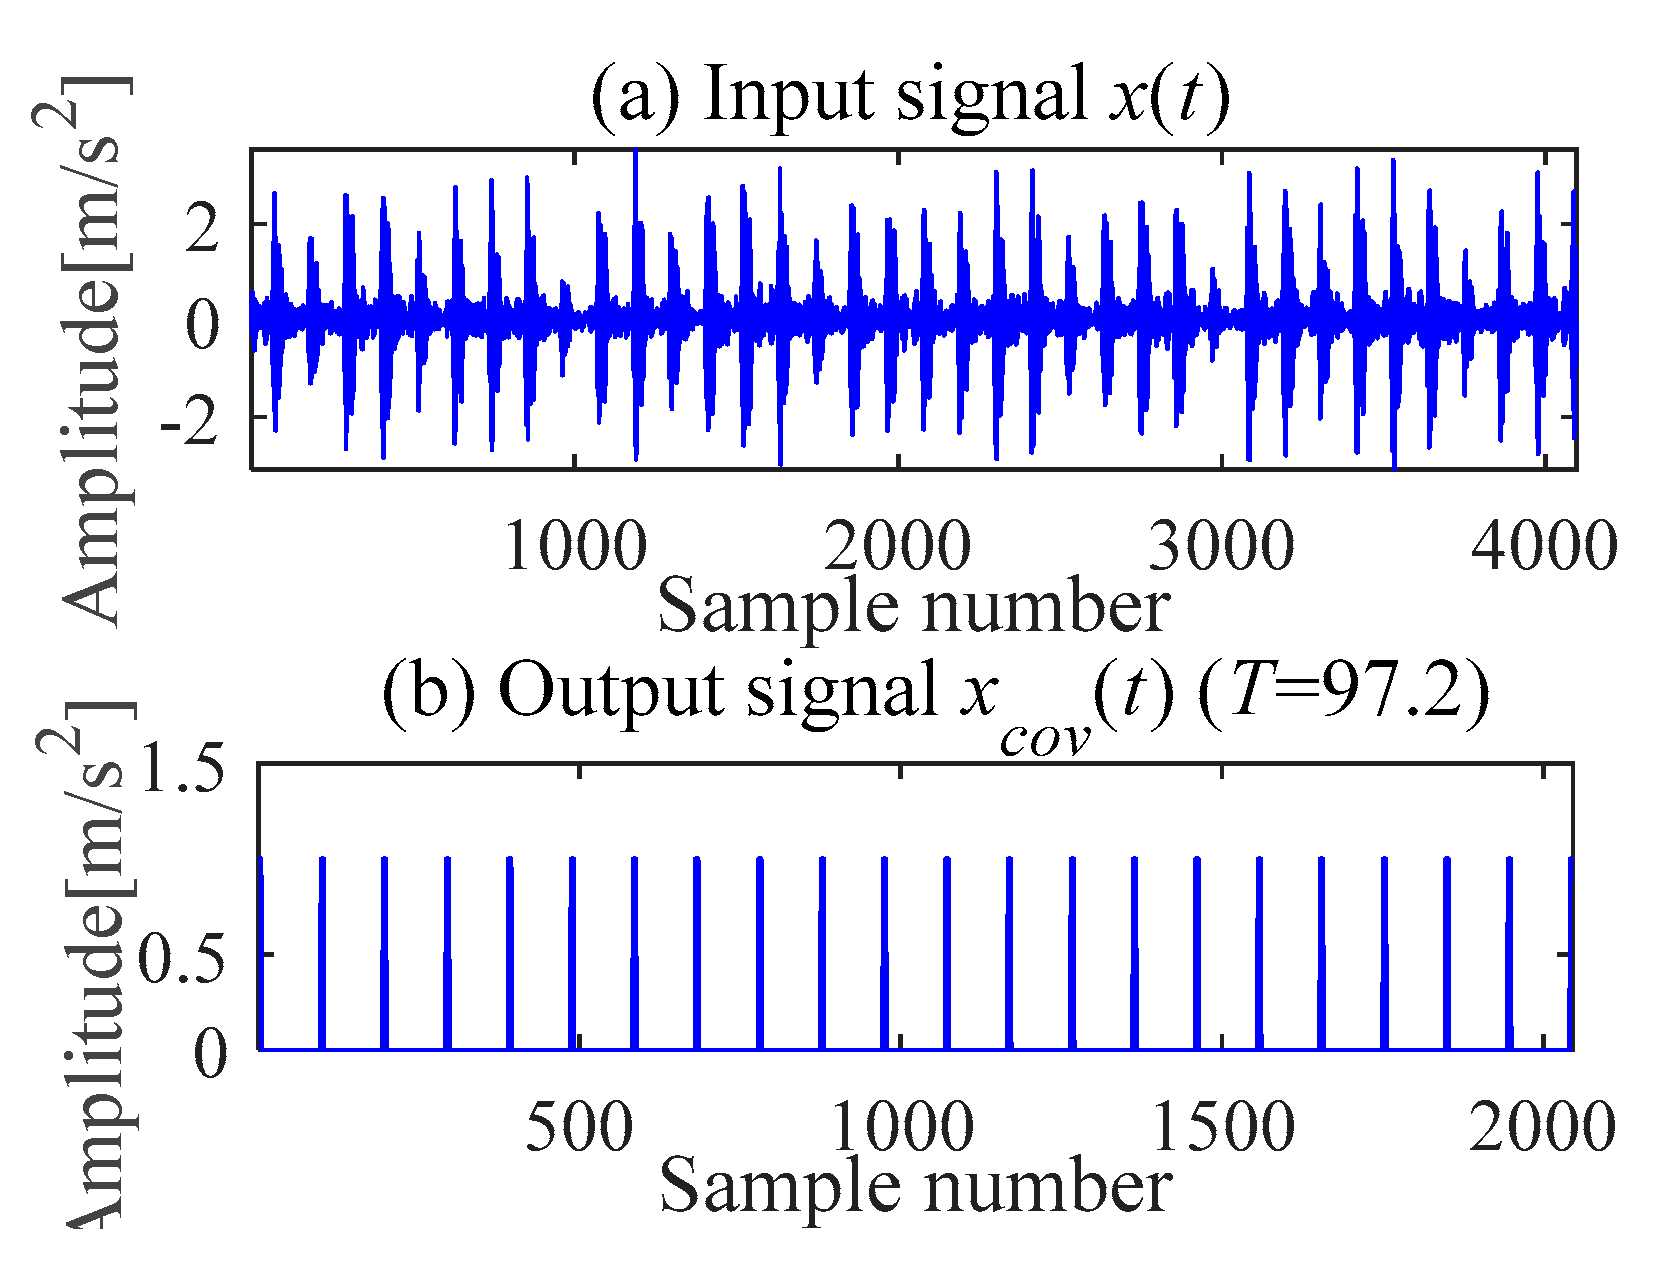
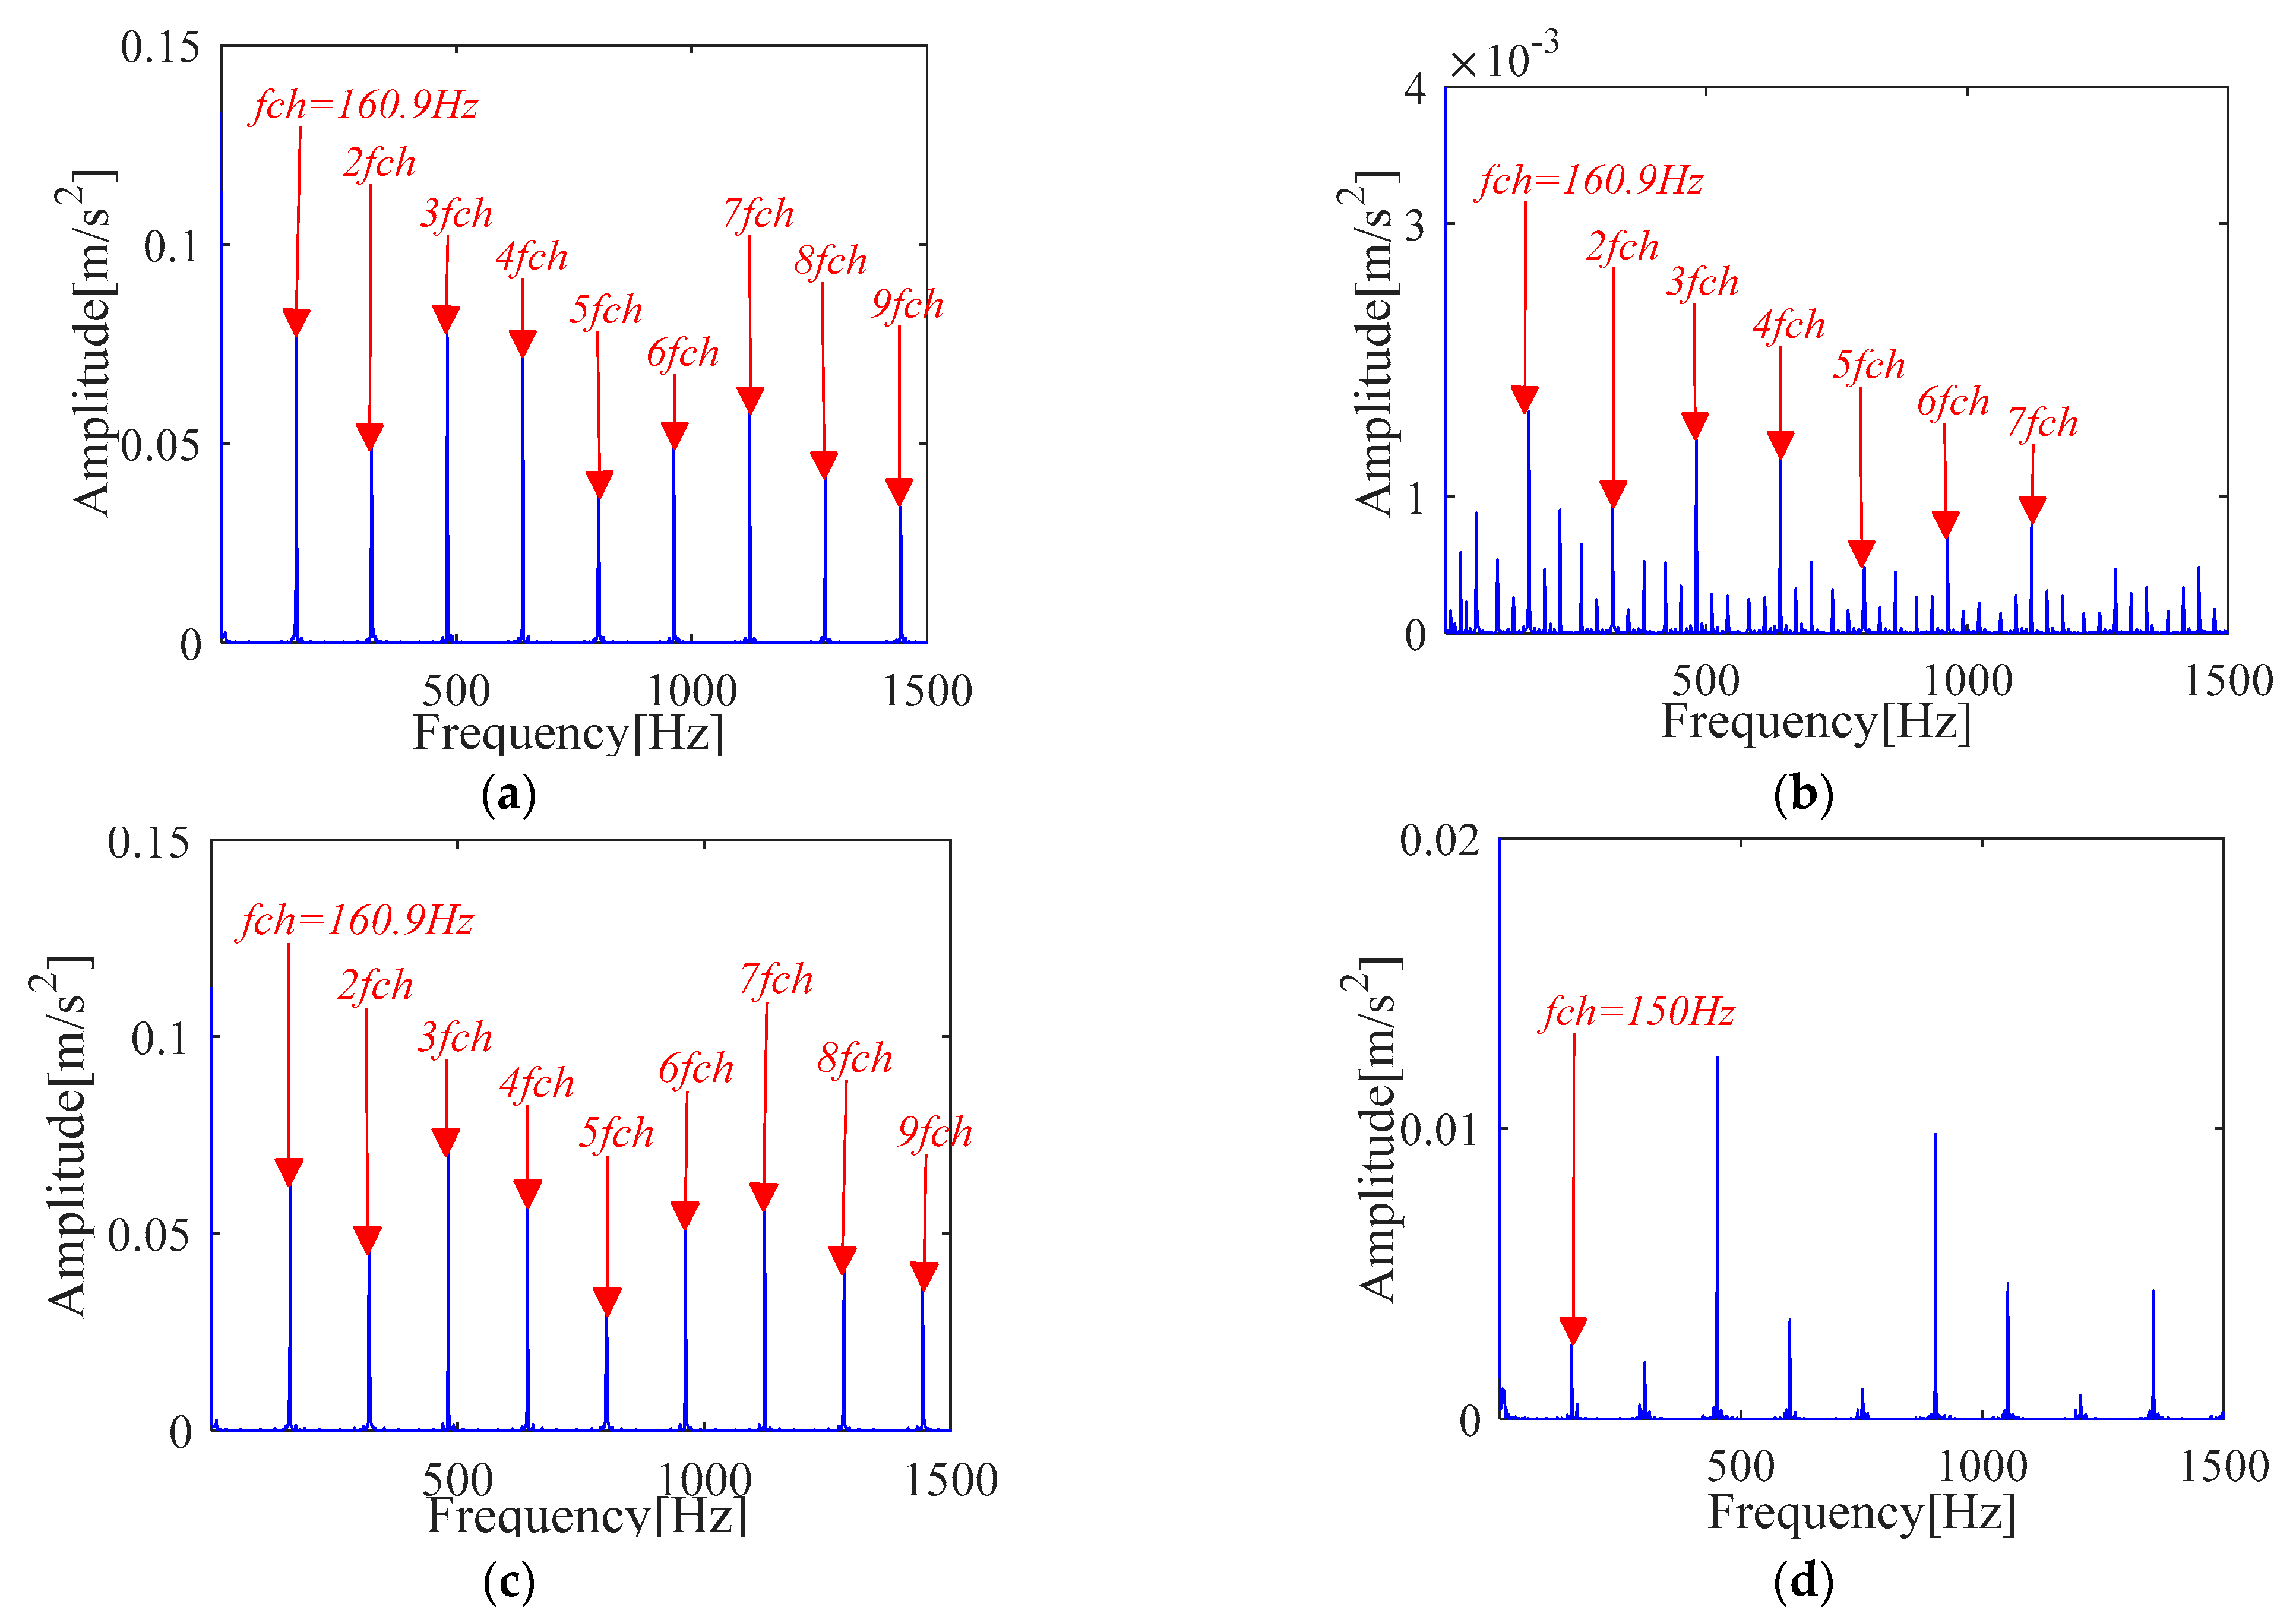
4.1.2. Inner Race Fault Feature Extraction
4.2. Case 2: NASA Data Analysis
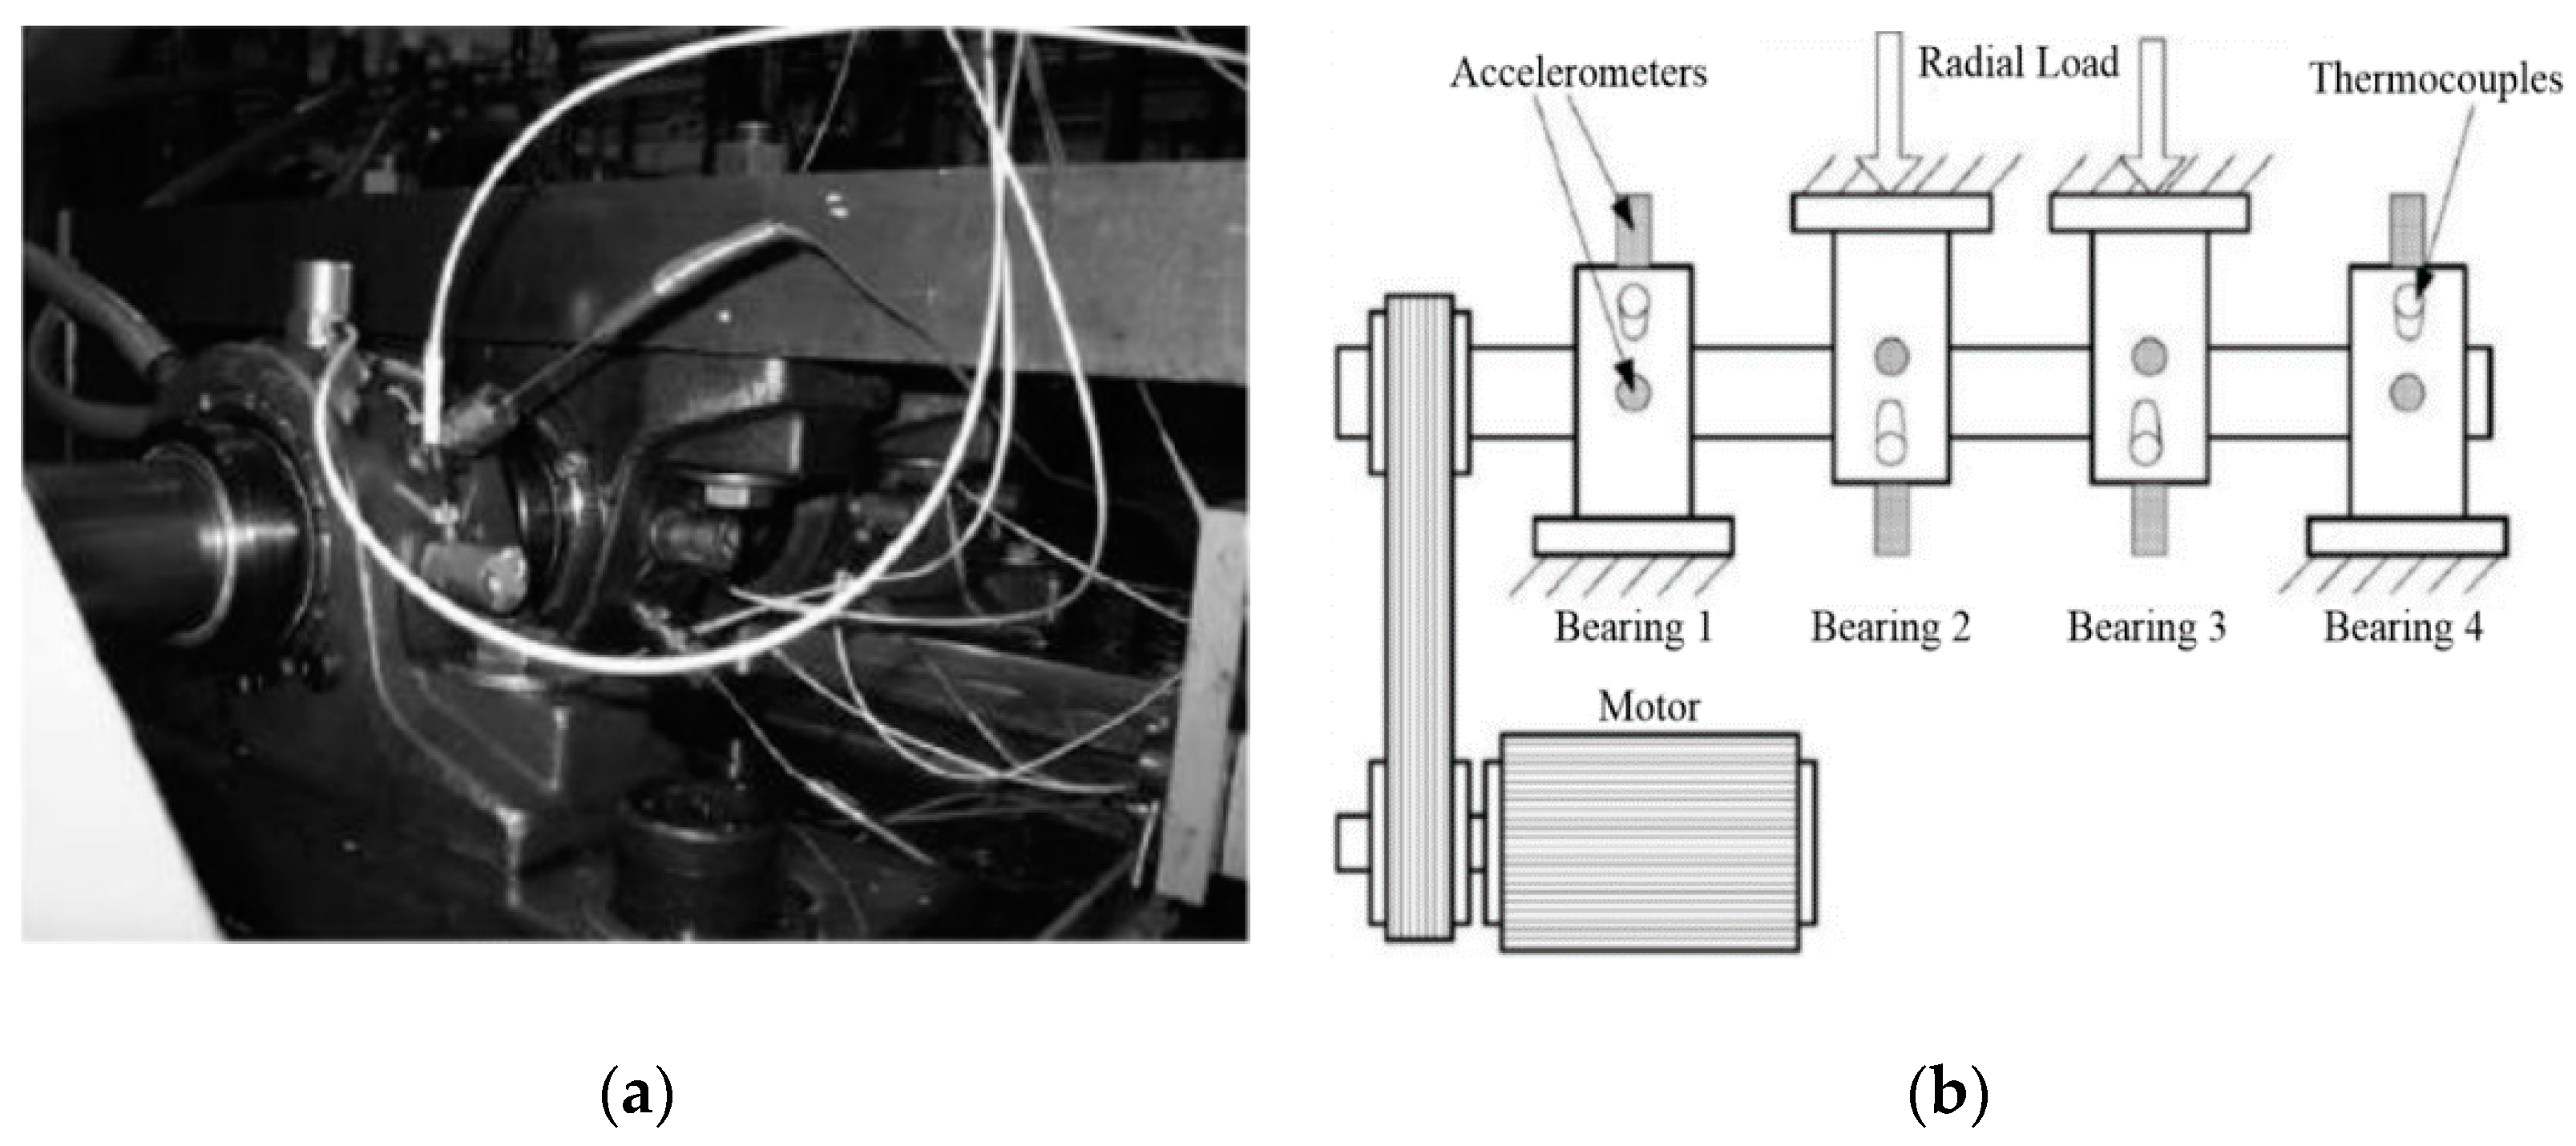
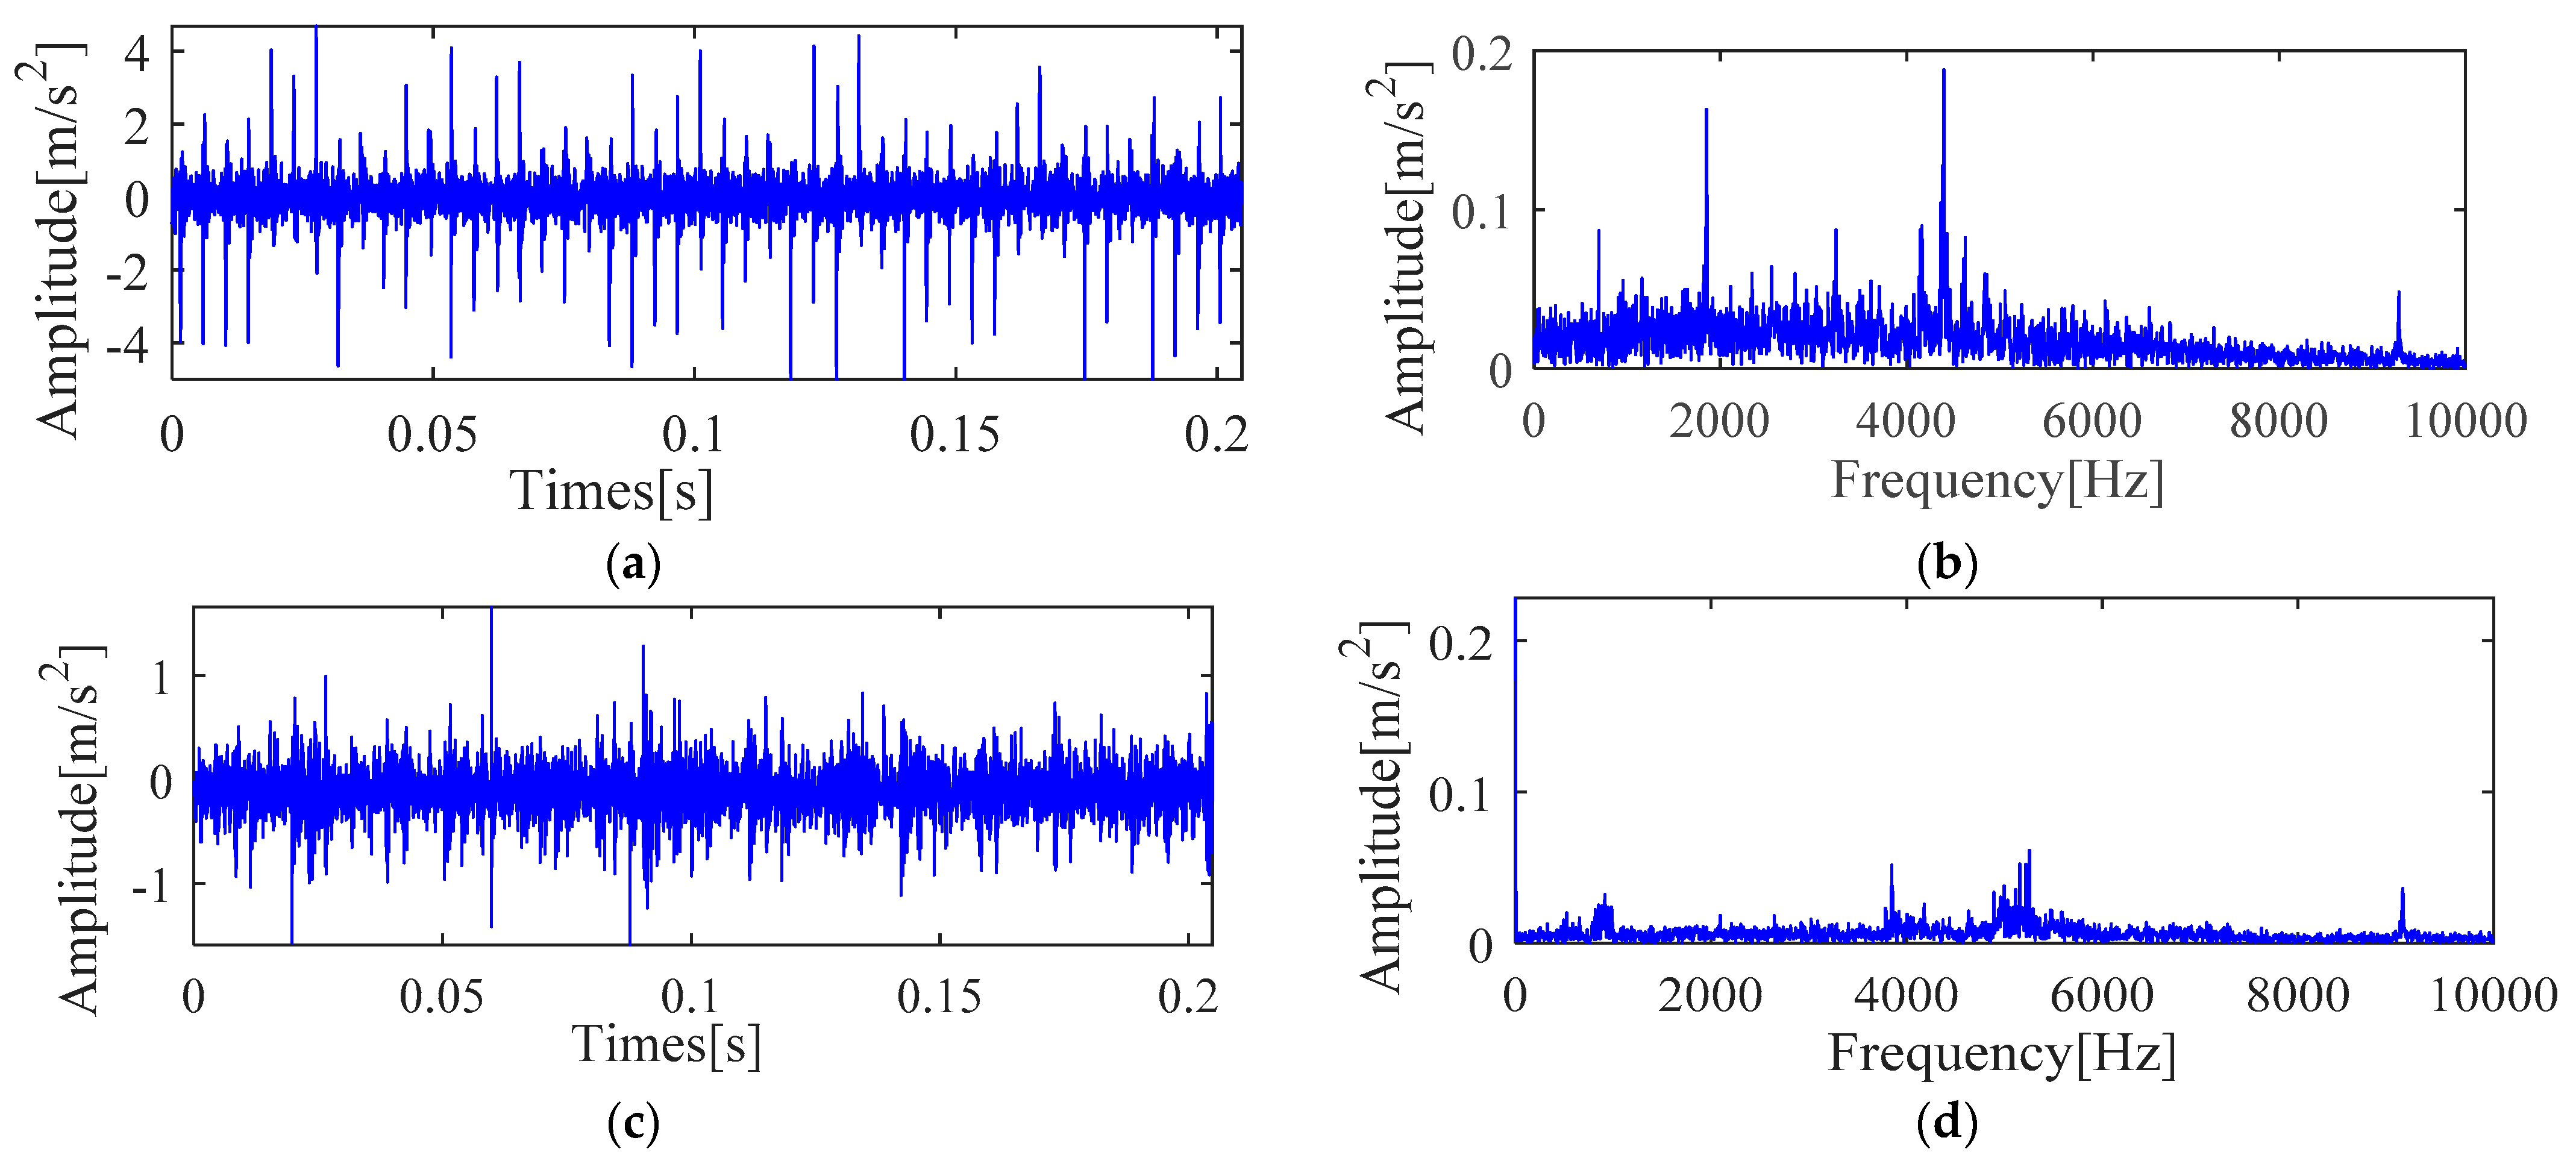
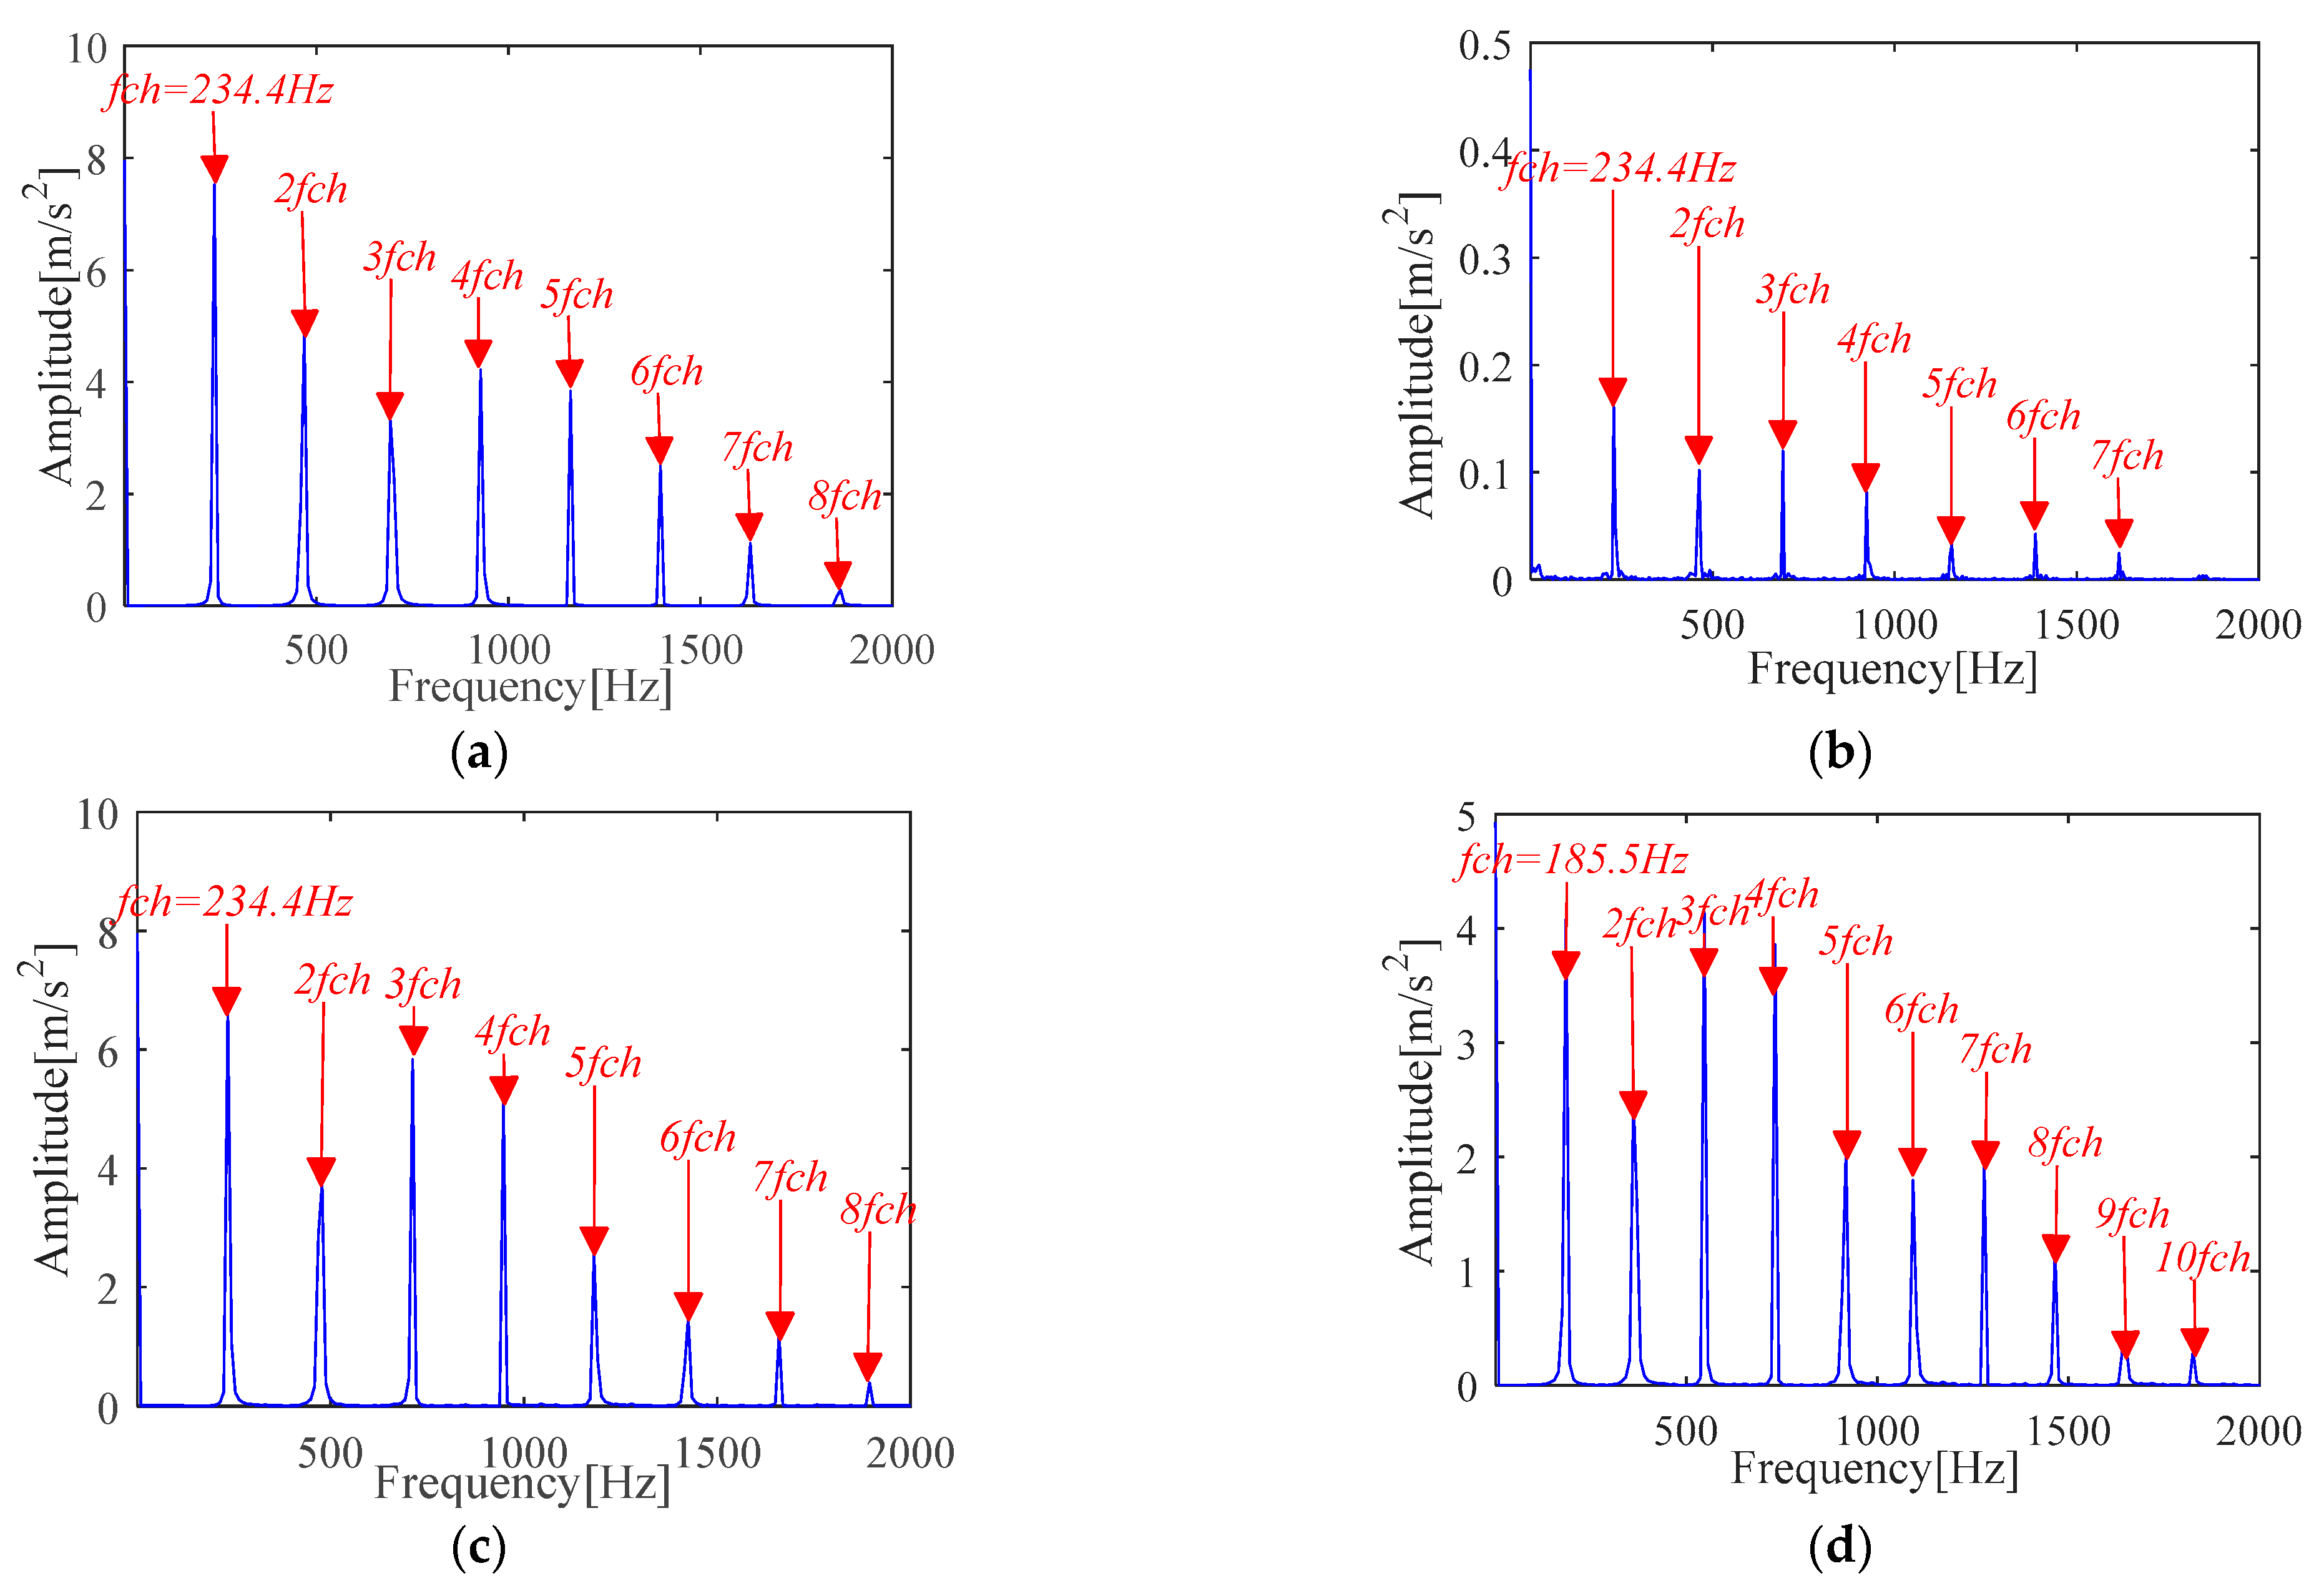
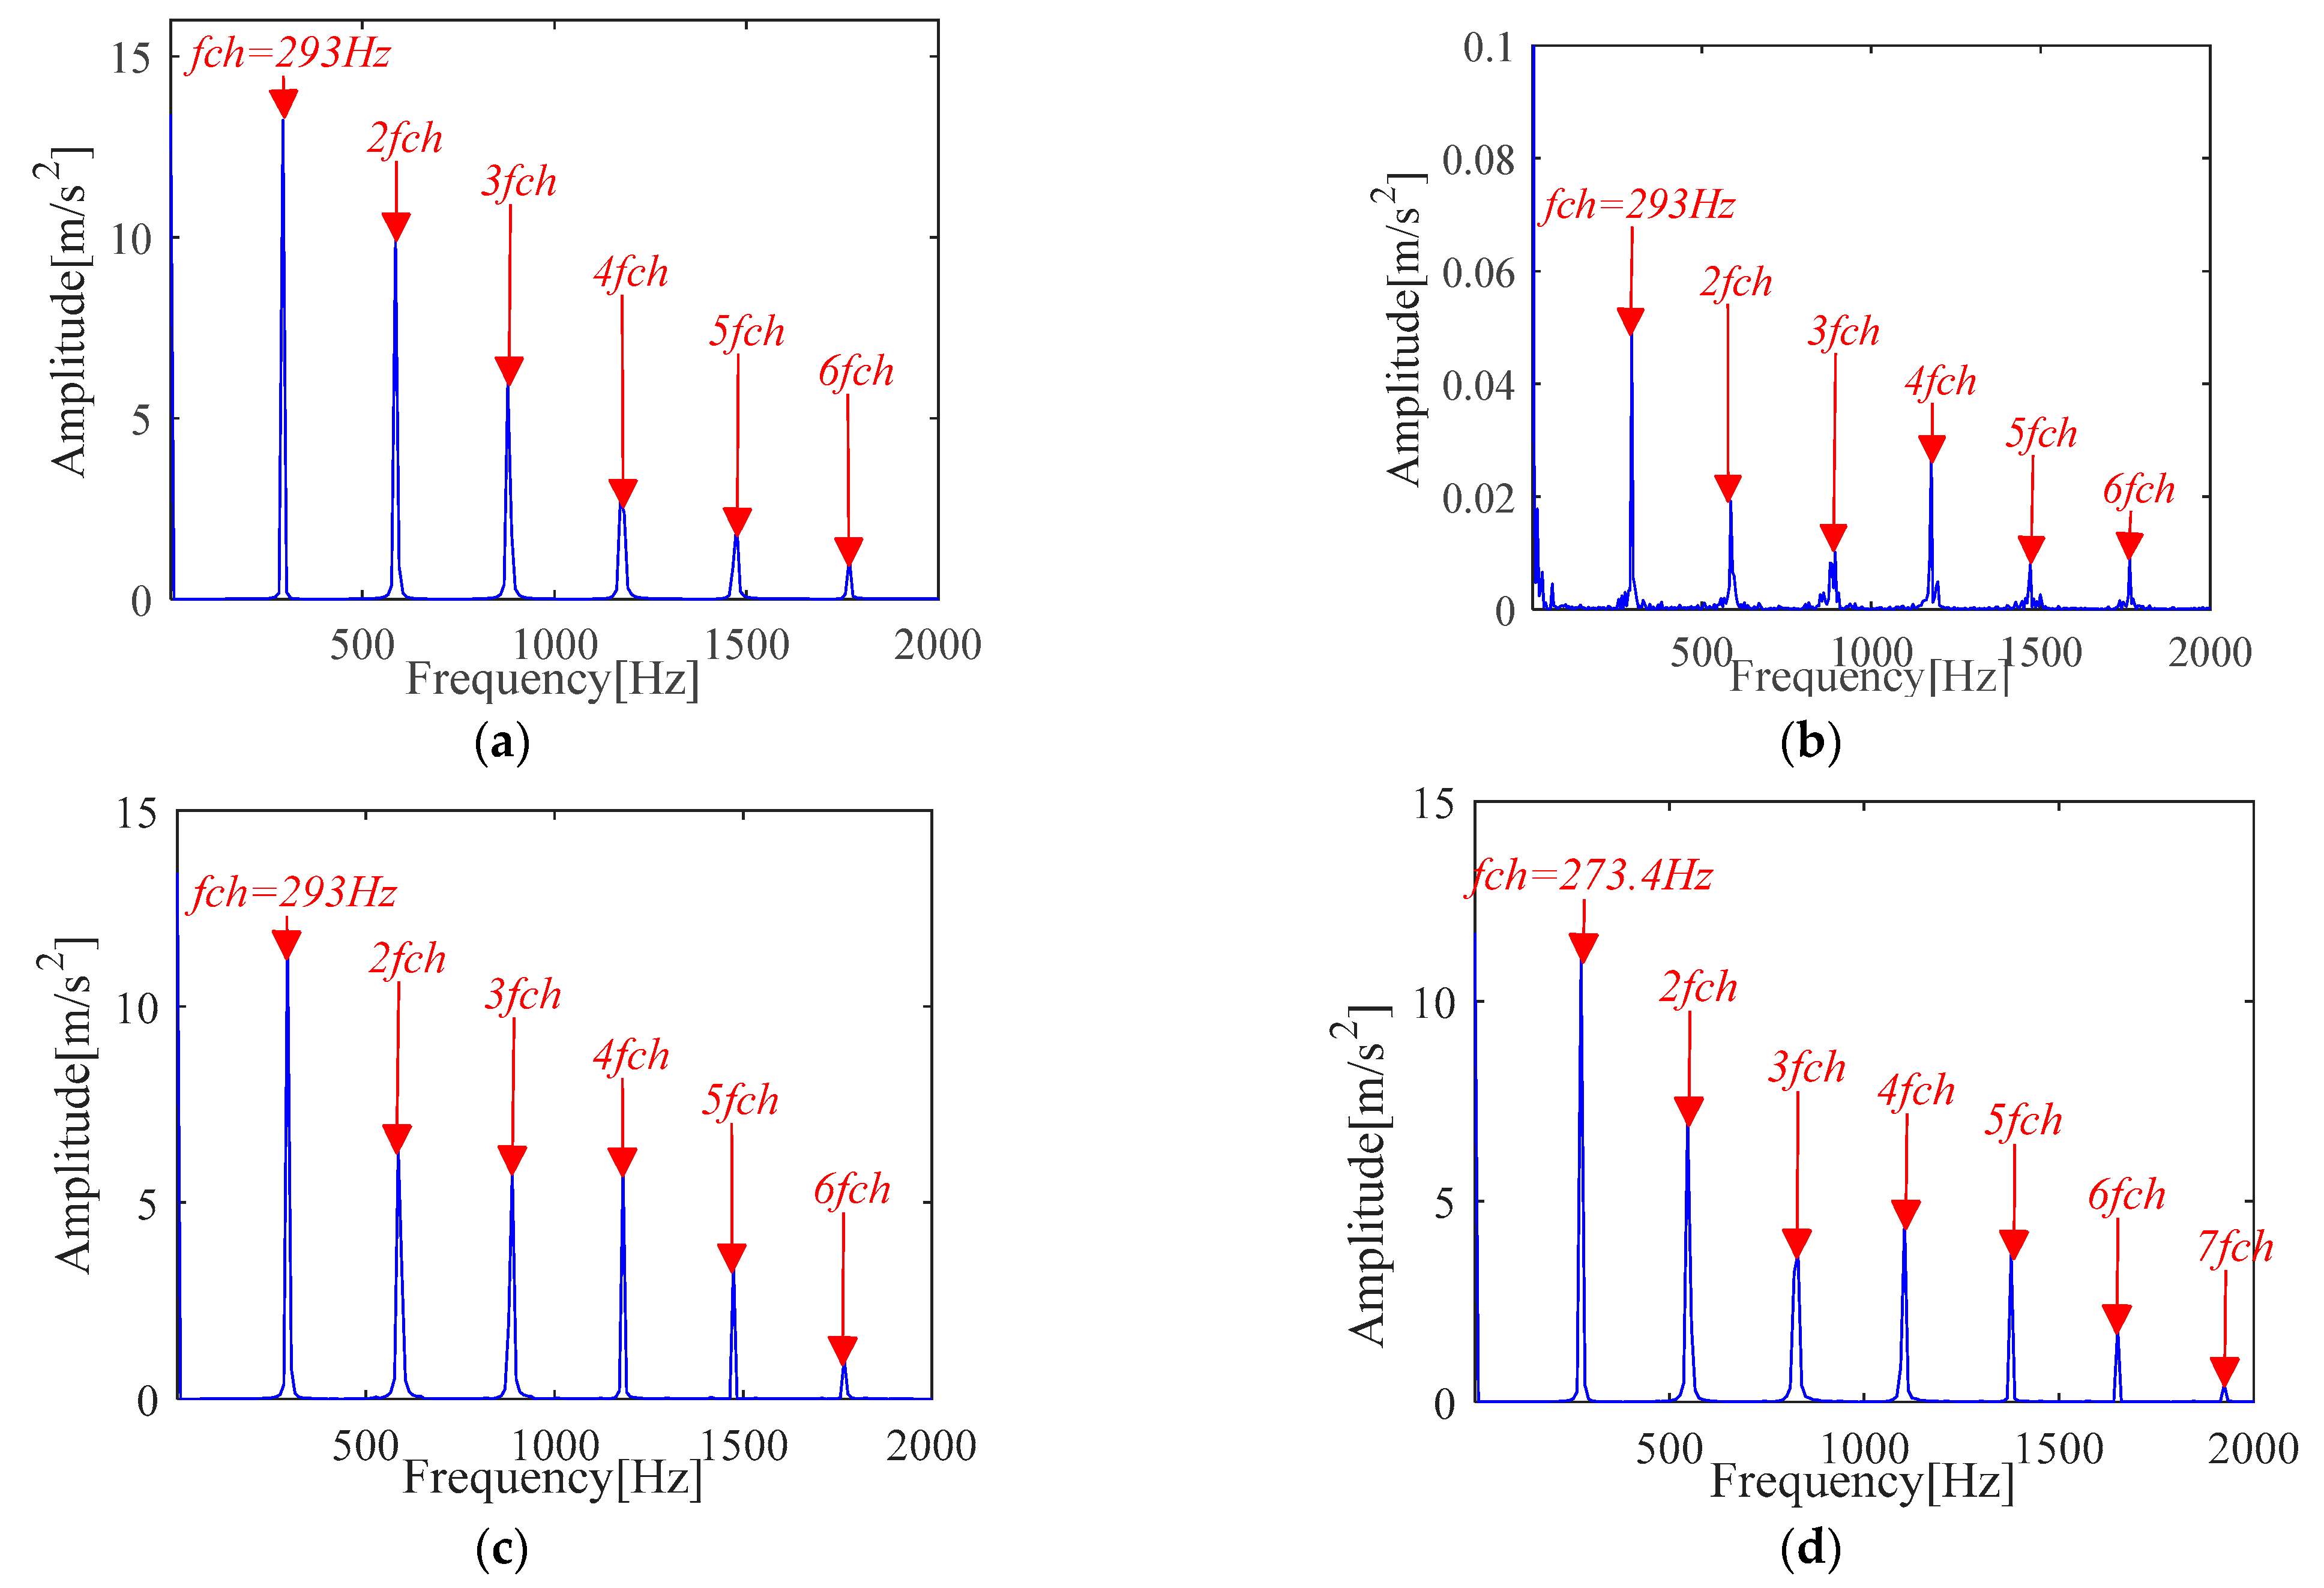
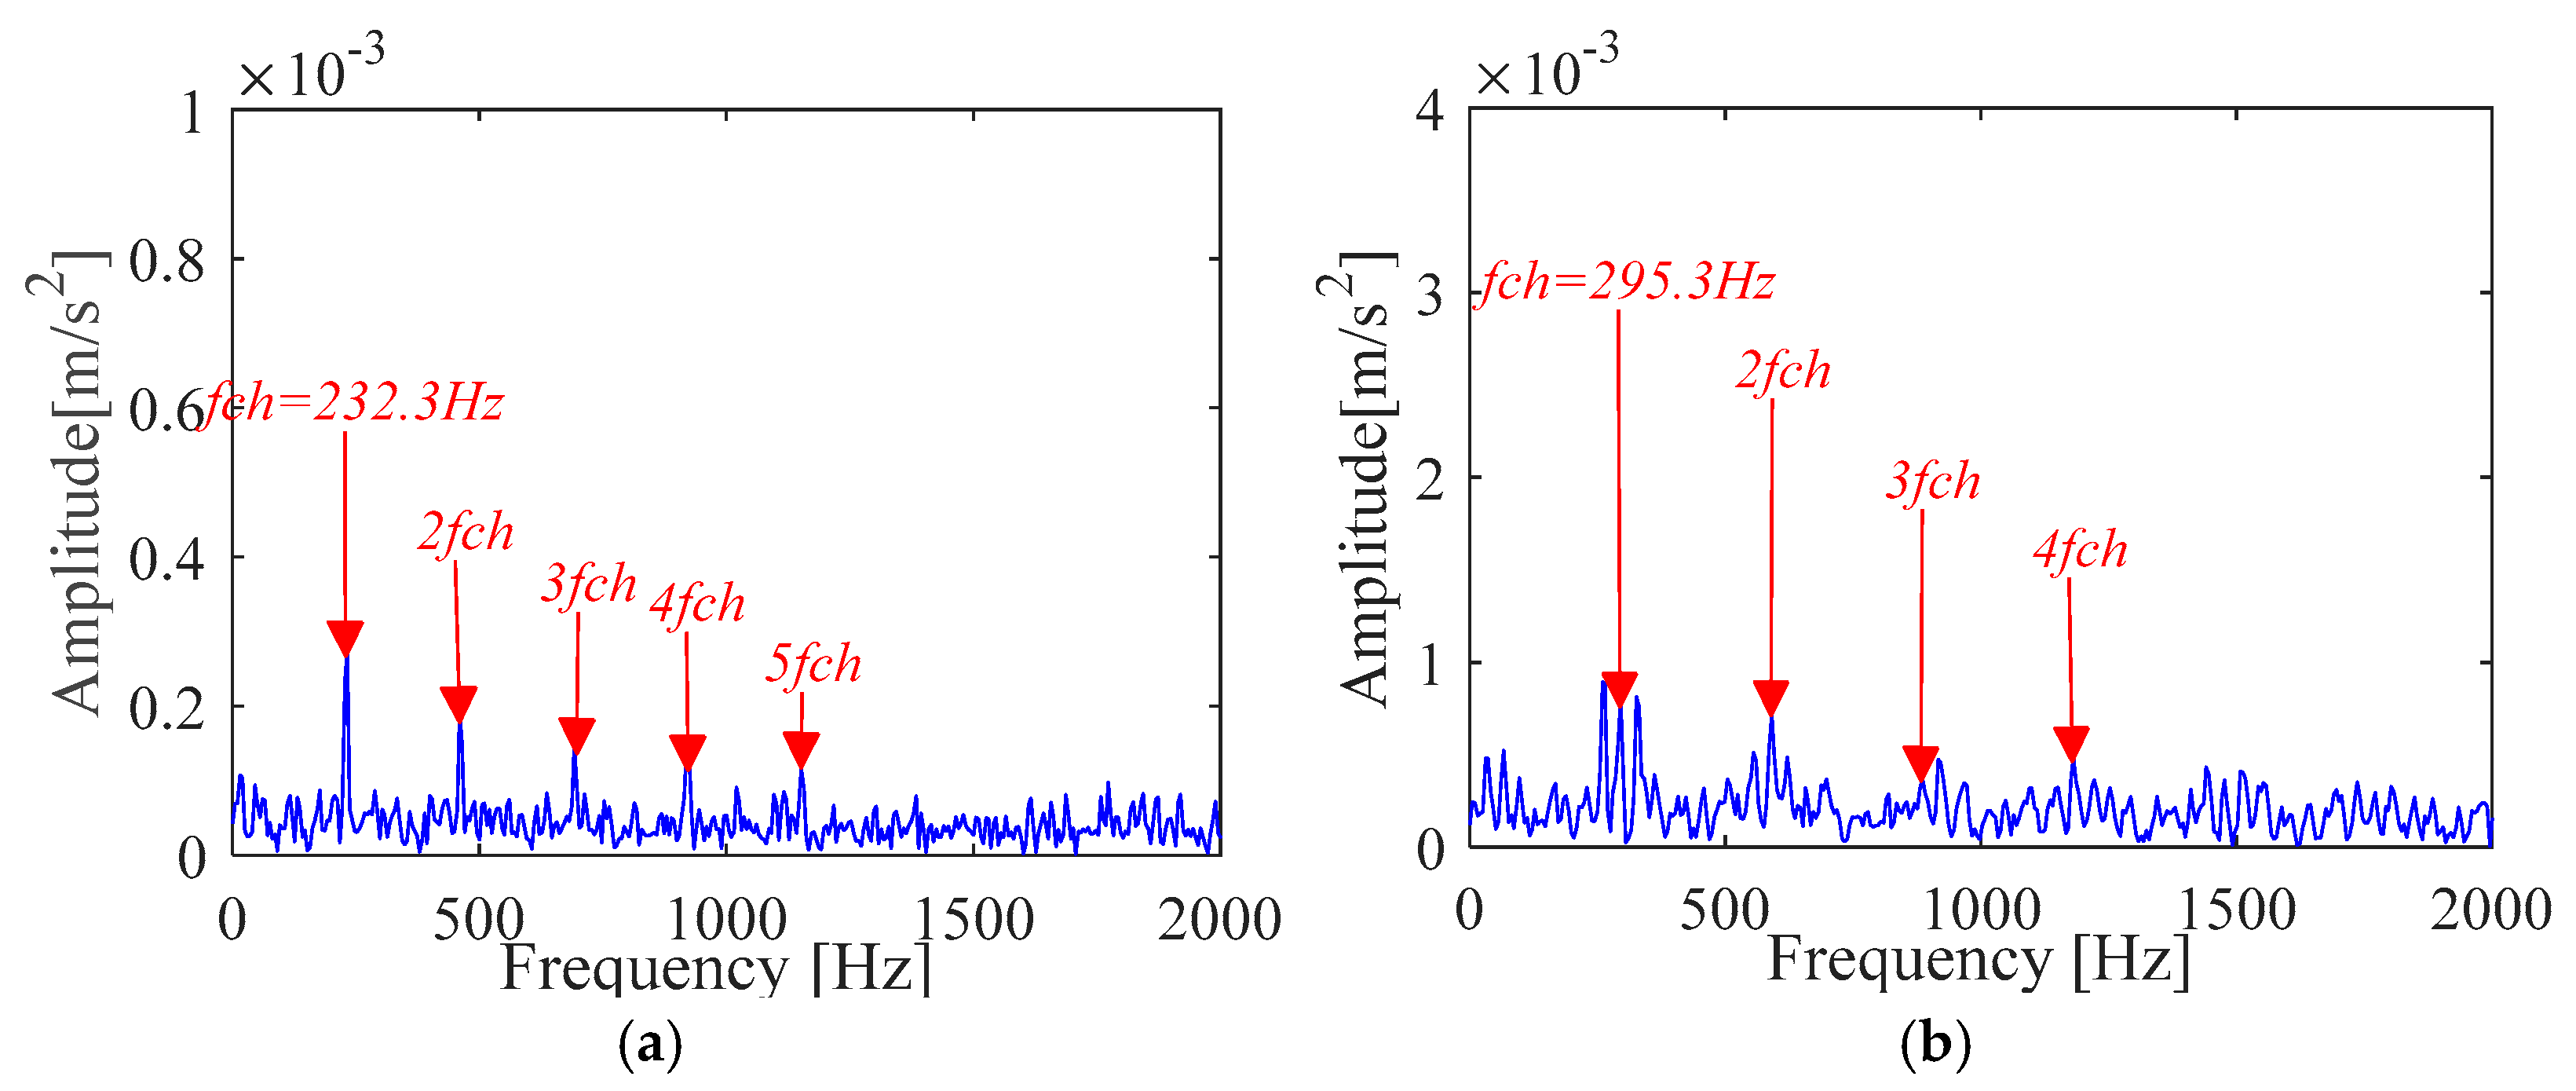
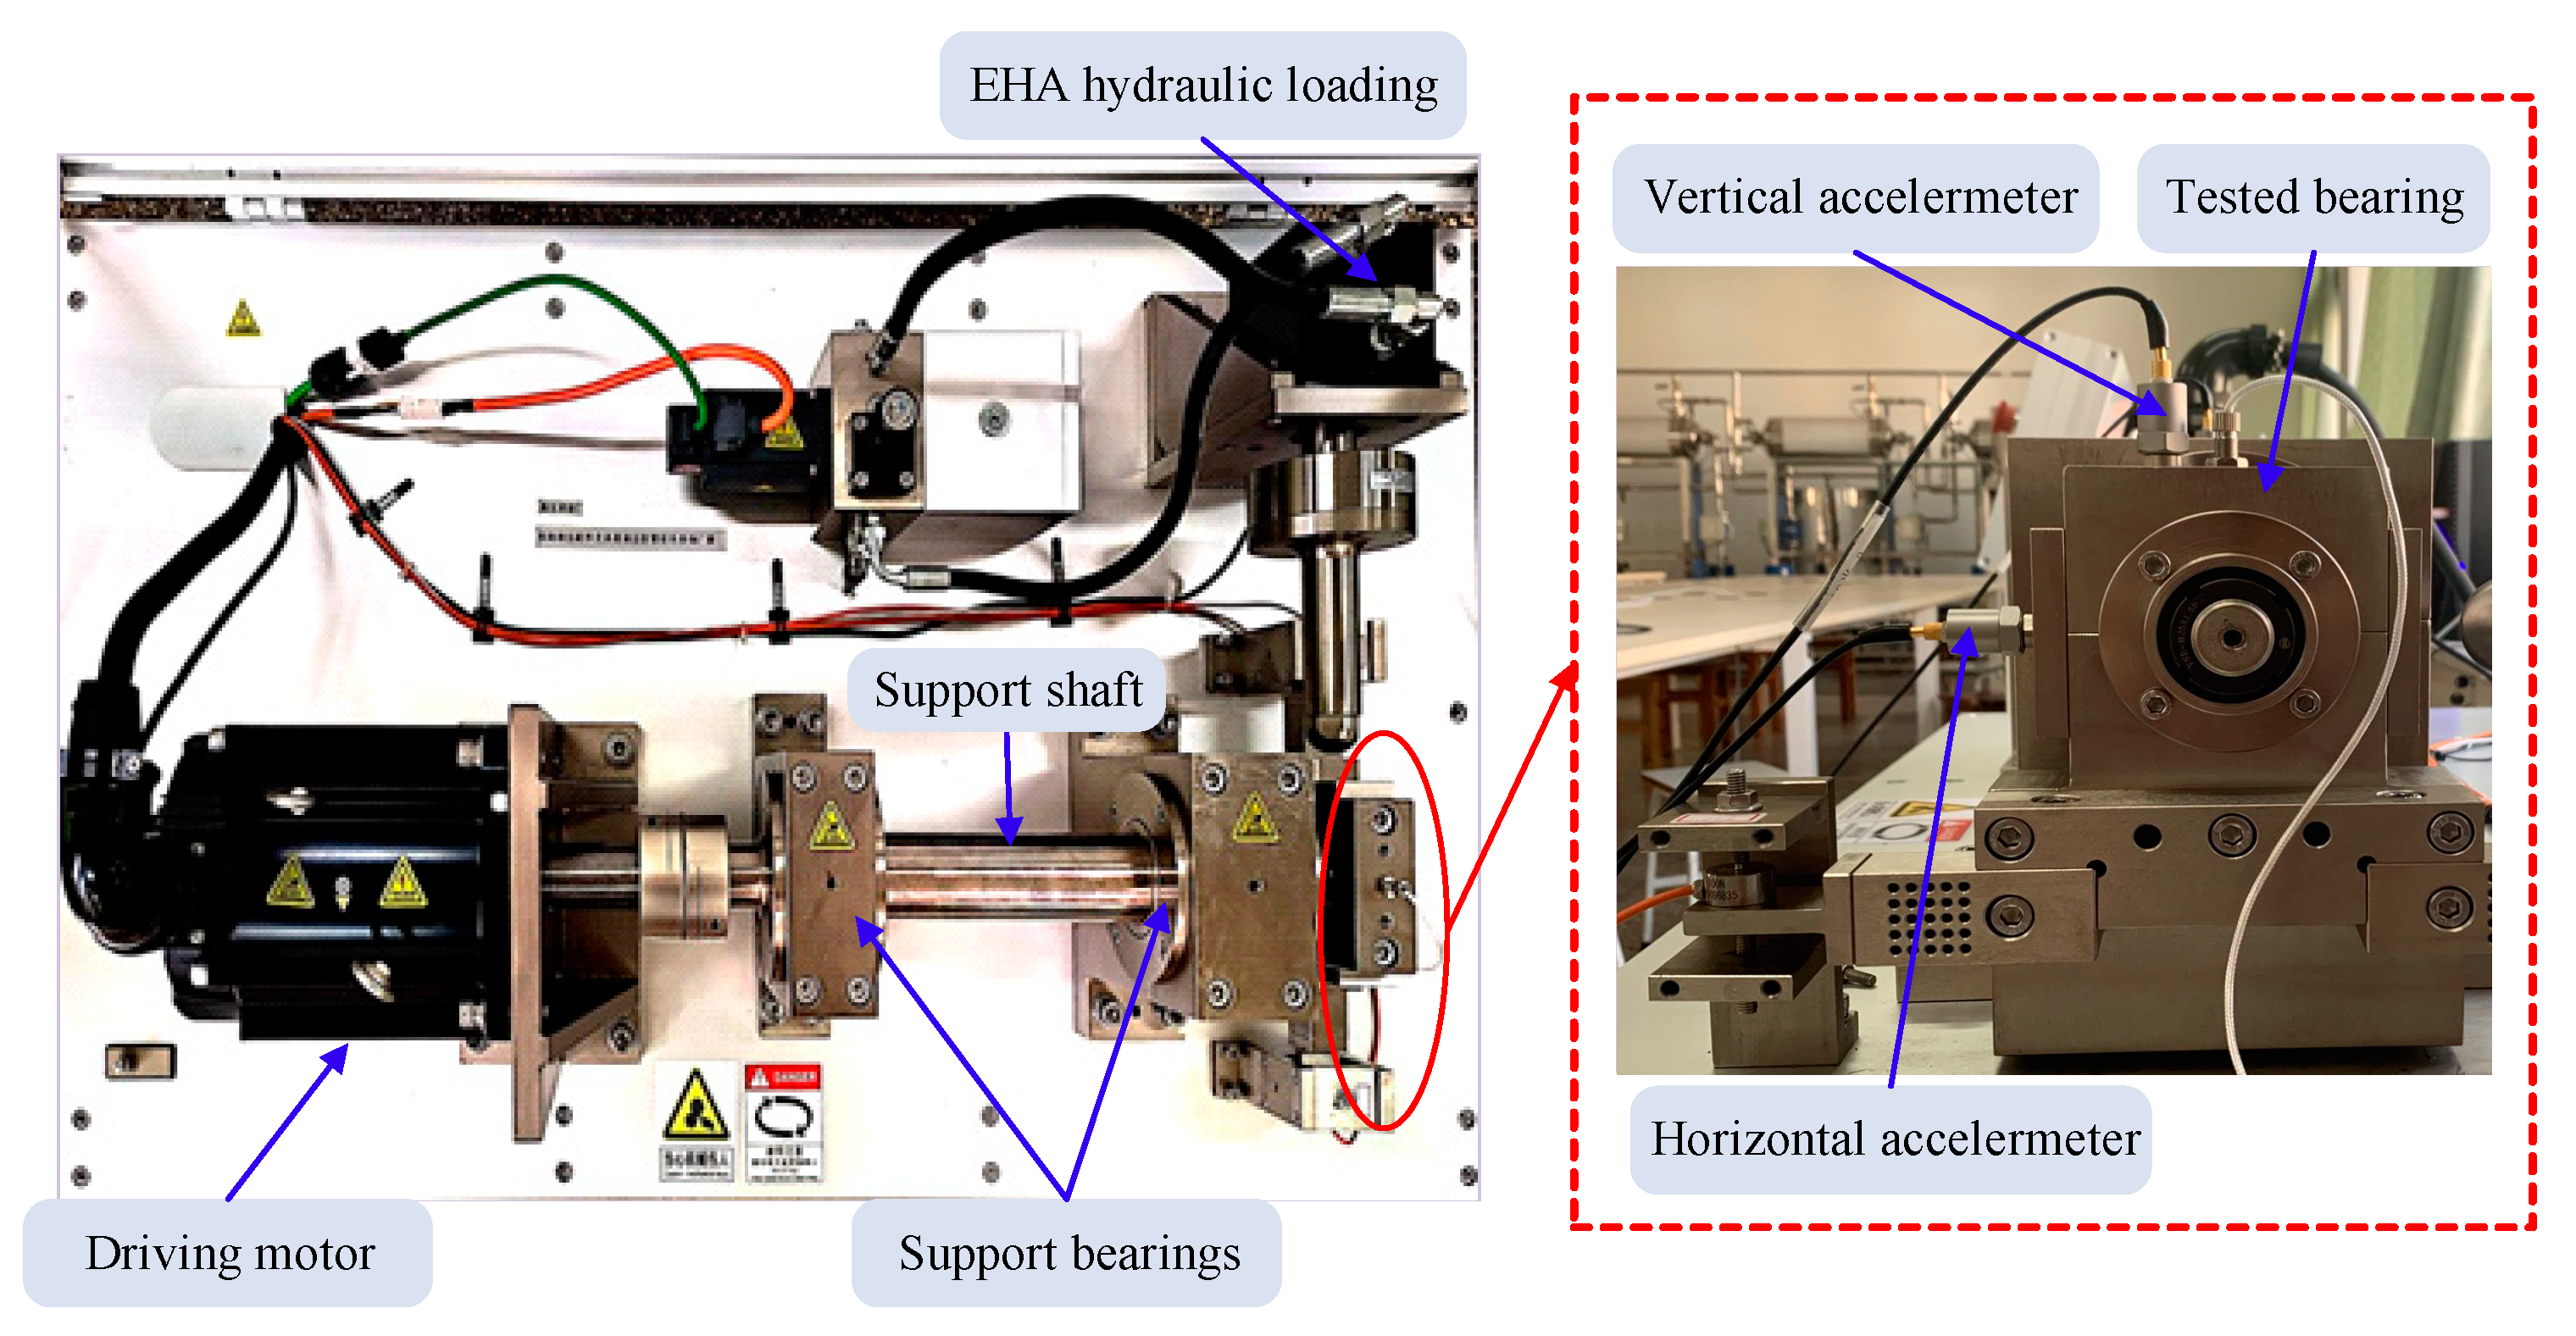
4.3. Application Testing
4.4. Comparative Analysis with Three Cases
5. Discussion
6. Conclusions
Author Contributions
Funding
Institutional Review Board Statement
Informed Consent Statement
Data Availability Statement
Acknowledgments
Conflicts of Interest
Abbreviations
| MOMEDA-multipoint optimal minimum entropy deconvolution adjusted | TFMSR-time-delayed feedback monostable stochastic resonance |
| IMOMEDA-improved MOMEDA | LSTM-long and short time memory |
| EHNR-envelope harmonic-to-noise ratio | PSO-particle swarm optimization |
| GOA-grasshopper optimization algorithm | CVS-continuous vibration separation |
| MED-minimum entropy deconvolution | ESK-envelope spectrum kurtosis |
| FK-fast kurtogram | STFT-Short Time Fourier Transform |
| MCKD-maximum correlation kurtosis deconvolution | NASA-National Aeronautics and Space Administration |
| AC-autocorrelation function | CWRU-Case Western Reserve University |
| TKEO-Teager-Kaiser energy operator | BPFO-Outer ring defect frequency |
| SNR-signal-to-noise ratio | BPFI-Inner ring defect frequency |
References
- Lei, Y.; Lin, J.; He, Z.; Zuo, M.J. A review on empirical mode decomposition in fault diagnosis of rotating machinery. Mech. Syst. Signal Process. 2013, 35, 108–126. [Google Scholar] [CrossRef]
- Cerrada, M.; Sánchez, R.-V.; Li, C.; Pacheco, F.; Cabrera, D.; De Oliveira, J.L.V.; Vásquez, R.E. A review on data-driven fault severity assessment in rolling bearings. Mech. Syst. Signal Process. 2018, 99, 169–196. [Google Scholar] [CrossRef]
- Bastami, A.R.; Vahid, S. A comprehensive evaluation of the effect of defect size in rolling element bearings on the statistical features of the vibration signal. Mech. Syst. Signal Process. 2021, 151, 1–20. [Google Scholar]
- Li, J.; Meng, Z.; Yin, N.; Pan, Z.; Cao, L.; Fan, F. Multi-source feature extraction of rolling bearing compression measurement signal based on independent component analysis. Measurement 2021, 172, 1–10. [Google Scholar] [CrossRef]
- Wang, H.; Ni, G.; Chen, J.; Qu, J. Research on rolling bearing state health monitoring and life prediction based on PCA and Internet of things with multi-sensor. Measurement 2020, 157, 1–9. [Google Scholar] [CrossRef]
- Rzeszucinski, P.; Orman, M.; Pinto, C.T.; Tkaczyk, A.; Sulowicz, M. Bearing Health Diagnosed with a Mobile Phone: Acoustic Signal Measurements Can be used to Test for Structural Faults in Motors. IEEE Ind. Appl. Mag. 2018, 24, 17–23. [Google Scholar] [CrossRef]
- Orman, M.; Rzeszucinski, P.; Tkaczyk, A.; Krishnamoorthi, K.; Pinto, C.T.; Sulowicz, M. Bearing fault detection with the use of acoustic signals recorded by a hand-held mobile phone. In Proceedings of the 2015 International Conference on Condition Assessment Techniques in Electrical Systems (CATCON), Bangalore, India, 10–12 December 2015; pp. 252–256. [Google Scholar]
- Wang, Q. Design and application of high-speed railway bearing vibration signal acquisition system based on ZigBee technology. Electron. Des. Eng. 2018, 26, 97–100. [Google Scholar]
- Gao, J.; Hao, L.; Li, Y.; Guo, H.; Hou, X. Development of Wireless Sensor Vibrating Signal Acquisition and Processing System Based on VC ++. Mach. Tool Hydraul. 2012, 40, 69–72. [Google Scholar]
- Chong, L.; Tianxi, J.; Qingbo, H.; Zhike, P. Smart metasurface shaft for vibration source identification with a single sensor. J. Sound Vib. 2021, 493, 1–18. [Google Scholar]
- Verstraete, D.; Droguett, E.L.; Modarres, M. A Deep Adversarial Approach Based on Multi-Sensor Fusion for Semi-Supervised Remaining Useful Life Prognostics. Sensors 2019, 20, 176. [Google Scholar] [CrossRef]
- Meng, X.S.; Li, H.Y.; Zhu, G.; Wang, Z.L. Fully enclosed bearing-structured self-powered rotation sensor based on electrification at rolling interfaces for multi-tasking motion measurement. Nano Energy 2015, 12, 606–611. [Google Scholar] [CrossRef]
- Huang, J.; Chen, G.; Shu, L.; Wang, S.; Zhang, Y. An Experimental Study of Clogging Fault Diagnosis in Heat Exchangers Based on Vibration Signals. IEEE Access 2016, 4, 1800–1809. [Google Scholar] [CrossRef]
- Howard, I.M. A Review of Rolling Element Bearing Vibration "Detection, Diagnosis and Prognosis"; NASA STI/Recon Technical Report N: Sydney, Australia, 1994; pp. 1–10.
- Radoslaw, Z.; Walter, B. Application of Adaptive Filtering for Weak Impulsive Signal Recovery for Bearings Local Damage Detection in Complex Mining Mechanical Systems Working under Condition of Varying Load. Solid State Phenom. 2011, 180, 250–257. [Google Scholar]
- Jérôme, A. The spectral kurtosis: A useful tool for characterising non-stationary signals. Mech. Syst. Signal Process. 2006, 20, 282–307. [Google Scholar]
- Tomasz, B.; Robert, B.R. Application of spectral kurtosis for detection of a tooth crack in the planetary gear of a wind turbine. Mech. Syst. Signal Process. 2009, 23, 1352–1365. [Google Scholar]
- Jimeng, L.; Hui, W.; Xiangdong, W.; Yungang, Z. Rolling bearing fault diagnosis based on improved adaptive parameterless empirical wavelet transform and sparse denoising. Measurement 2020, 152, 1–14. [Google Scholar]
- Ralph, A.W. Minimum entropy deconvolution. Geoexploration 1978, 16, 21–35. [Google Scholar]
- Endo, H.; Randall, R.B. Enhancement of autoregressive model based gear tooth fault detection technique by the use of minimum entropy deconvolution filter. Mech. Syst. Signal Process. 2007, 21, 906–919. [Google Scholar] [CrossRef]
- Chen, H.; Wang, J.; Tang, B.; Li, J. Helicopter rolling bearing hybrid faults diagnosis using minimum entropy deconvolution and Teager energy operator. J. Vib. Shock. 2017, 36, 45–50, 73. [Google Scholar]
- Cheng, Y.; Zhou, N.; Zhang, W.; Wang, Z. Application of an improved minimum entropy deconvolution method for railway rolling element bearing fault diagnosis. J. Sound Vib. 2018, 425, 53–69. [Google Scholar] [CrossRef]
- Zhang, L.; Hu, N. Fault diagnosis of sun gear based on continuous vibration separation and minimum entropy deconvolution. Measurement 2019, 141, 332–344. [Google Scholar] [CrossRef]
- Wang, Z.; Du, W.; Wang, J.; Zhou, J.; Han, X.; Zhang, Z.; Huang, L. Research and application of improved adaptive MOMEDA fault diagnosis method. Measurement 2019, 140, 63–75. [Google Scholar] [CrossRef]
- Mcdonald, G.L.; Zhao, Q.; Zuo, M.J. Maximum correlated Kurtosis deconvolution and application on gear tooth chip fault detection. Mech. Syst. Signal Process. 2012, 33, 237–255. [Google Scholar] [CrossRef]
- Ding, C.; Zhao, M.; Lin, J.; Jiao, J. Multi-objective iterative optimization algorithm based optimal wavelet filter selection for multi-fault diagnosis of rolling element bearings. ISA Trans. 2018, 82, 199–215. [Google Scholar] [CrossRef]
- Cheng, Y.; Wang, Z.; Zhang, W.; Huang, G. Particle swarm optimization algorithm to solve the deconvolution problem for rolling element bearing fault diagnosis. ISA Trans. 2019, 90, 244–267. [Google Scholar] [CrossRef]
- Hong, L.; Liu, X.; Zuo, H. Compound fault diagnosis of rotating machinery based on adaptive maximum correlated kurtosis deconvolution and customized multiwavelet transform. Mech. Syst. Signal Process. 2019, 146, 87–100. [Google Scholar] [CrossRef]
- Zhou, H.; Chen, J.; Dong, G. Application of maximum correlated kurtosis deconvolution on rolling element bearing fault diagnosis. Eng. Asset Manag. Syst. 2015, 159–172. [Google Scholar] [CrossRef]
- Mcdonald, G.L.; Zhao, Q. Multipoint Optimal Minimum Entropy Deconvolution and Convolution Fix: Application to vibration fault detection. Mech. Syst. Signal Process. 2016, 82, 461–477. [Google Scholar] [CrossRef]
- Cai, W.; Wang, Z. Application of an improved multipoint optimal minimum entropy deconvolution adjusted for gearbox composite fault diagnosis. Sensors 2018, 18, 2861. [Google Scholar] [CrossRef]
- Wang, Z.; Wang, J.; Zhao, Z.; Wang, R. A novel method for multi-fault feature extraction of a gearbox under strong background noise. Entropy 2018, 20, 10. [Google Scholar] [CrossRef]
- Ma, H.; Feng, Z. Planet bearing fault diagnosis using multipoint Optimal Minimum Entropy Deconvolution Adjusted. J. Sound Vib. 2019, 449, 235–273. [Google Scholar] [CrossRef]
- Li, Y.; Cheng, G.; Chen, X.; Pang, Y. Research on Bearing Fault Diagnosis Method Based on Filter Features of MOMLMEDA and LSTM. Entropy 2019, 21, 25. [Google Scholar] [CrossRef]
- Zhu, X.; Wang, Y. Fault diagnosis of rolling bearings based on the MOMEDA and Teager energy operator. J. Vib. Shock 2018, 37, 1–8. [Google Scholar]
- Deng, W. An effective improved co-evolution ant colony optimization algorithm with multi-strategies and its application. Int. J. Bio-Inspired Comput. 2020, 2020, 1–10. [Google Scholar]
- Li, J.; Jiang, J.; Fan, X.; Wang, H.; Song, L.; Liu, W.; Yang, J.; Chen, L. A New Method for Weak Fault Feature Extraction Based on Improved MED. Shock Vib. 2018, 2018, 1–11. [Google Scholar] [CrossRef]
- Wang, C.; Li, H.; Ou, J.; Hu, R.; Hu, S.; Liu, A. Identification of planetary gearbox weak compound fault based on parallel dual-parameter optimized resonance sparse decomposition and improved MOMEDA. Measurement 2020, 165, 1–18. [Google Scholar] [CrossRef]
- Zhou, C.; Ma, J.; Wu, J.; Feng, Z. A Parameter Adaptive MOMEDA Method Based on Grasshopper Optimization Algorithm to Extract Fault Features. Math. Probl. Eng. 2019, 2019, 1–12. [Google Scholar] [CrossRef]
- Xu, X.; Zhao, M.; Lin, J.; Lei, Y. Envelope harmonic-to-noise ratio for periodic impulses detection and its application to bearing diagnosis. Measurement 2016, 91, 385–397. [Google Scholar] [CrossRef]
- Li, Z.; Ma, J.; Wang, X.; Wu, J. MVMD-MOMEDA-TKEO model and its application in feature extraction for rolling bearings. Entropy 2019, 21, 1–25. [Google Scholar]
- Borghesani, P.; Pennacchi, P.; Chatterton, S. The relationship between kurtosis- and envelope-based indexes for the diagnostic of rolling element bearings. Mech. Syst. Signal Process. 2014, 43, 25–43. [Google Scholar] [CrossRef]
- Jonathan, A.W.; Paul, K.R. Optimizations of the energy grid search algorithm in continuous-energy Monte Carlo particle transport codes. Comput. Phys. Commun. 2015, 196, 134–142. [Google Scholar]
- Maragos, P.; Kaiser, J.; Quatieri, T. On amplitude and frequency demodulation using energy operators. IEEE Trans. Signal Process. 1993, 41, 1532–1550. [Google Scholar] [CrossRef]
- Miao, Y.; Zhao, M.; Lin, J.; Lei, Y. Application of an improved maximum correlated kurtosis deconvolution method for fault diagnosis of rolling element bearings. Mech. Syst. Signal Process. 2017, 92, 173–195. [Google Scholar] [CrossRef]
- Loparo, K. Bearings Vibration Data Set, Case Western Reserve University. Available online: http://csegroups.case.edu/bearingdatacenter/pages/download-data-file (accessed on 20 August 2020).
- Lee, J.; Qiu, H.; Yu, G.; Lin, J. Rexnord Technical Services. Ims. University of Cincinnati. “Bearing Data Set”, NASA Ames Prognostics Data Repository. Moffett Field, CA: NASA Ames Research Center; 2007. Available online: https://ti.arc.nasa.gov/tech/dash/groups/pcoe/prognostic-data-repository/ (accessed on 14 September 2020).
- Wang, L.; Liu, Z.; Miao, Q.; Zhang, X. Time frequency analysis based on ensemble local mean decomposition and fast kurtogram for rotating machinery fault diagnosis. Mech. Syst. Signal Process. 2018, 103, 60–75. [Google Scholar] [CrossRef]
- Wang, J.; He, Q.; Kong, F. Multiscale envelope manifold for enhanced fault diagnosis of rotating machines. Mech. Syst. Signal Process. 2015, 52–53, 376–392. [Google Scholar] [CrossRef]
- Jiang, X.; Cheng, X.; Shi, J.; Huang, W.; Shen, C.; Zhu, Z. A new l0-norm embedded MED method for roller element bearing fault diagnosis at early stage of damage. Measurement 2018, 127, 414–424. [Google Scholar] [CrossRef]


| Test | Algorithm | Parameters Optimization | Data Sets |
|---|---|---|---|
| Test 1 | IMOMEDA-TKEO | The EHNR spectrum is utilized to calculate fault period T and the improved grid search method base on EHNR spectral entropy is proposed to determine optimal filter length L. | (a) CWRU data sets (b) NASA data sets (c) KUST-SY data sets |
| Test 2 | MOMEDA-TKEO-class 1 | According to [38], set the default range of T is (0.8Tα,1.2Tα), Tα = fs/fcα,Where fs is sampling frequency and fcα is fault frequency. The default filter length L [30] is put to 500. | |
| Test 3 | MOMEDA-TKEO-class 2 | The value range of T is consistent with Test 2 and the method to determine L follows Test 1. | |
| Test 4 | Fast kurtogram | Spectral kurtosis is taken as the function of Short Time Fourier Transform (STFT) window width to search the optimal filter parameters. |
| Rolling Bearing-6205-2RSJEMSKF | Rolling Element Number (Z) | Inner Diameter (Inches) | Outer Diameter (Inches) | Rolling Element Diameter d (Inches) | Limiting Speed (rpm) |
| 9 | 0.9843 | 2.0472 | 0.3126 | 18,000 | |
| Contact angle (θ) | Pitch circle diameter D (inches) | Dynamic load rating (N) | Static load rating (N) | / | |
| 0° | 1.537 | 14,800 | 7800 | / |
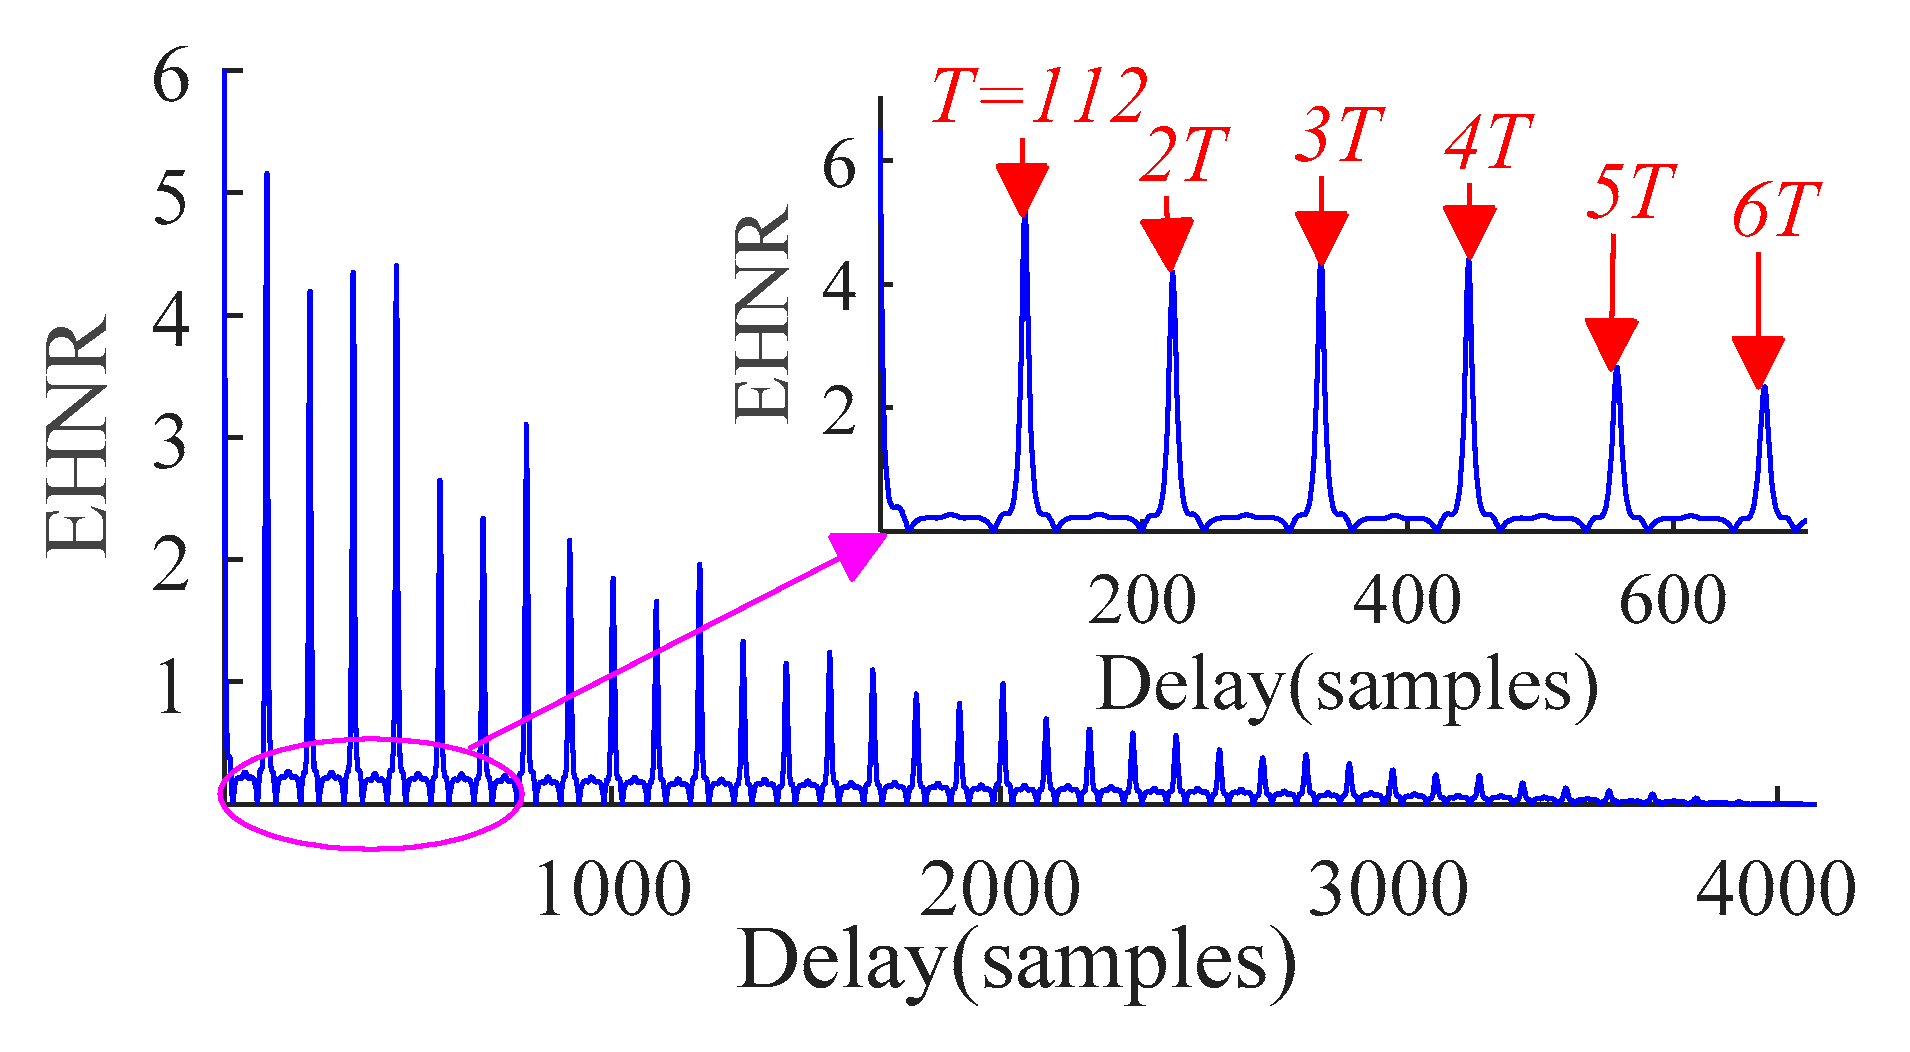
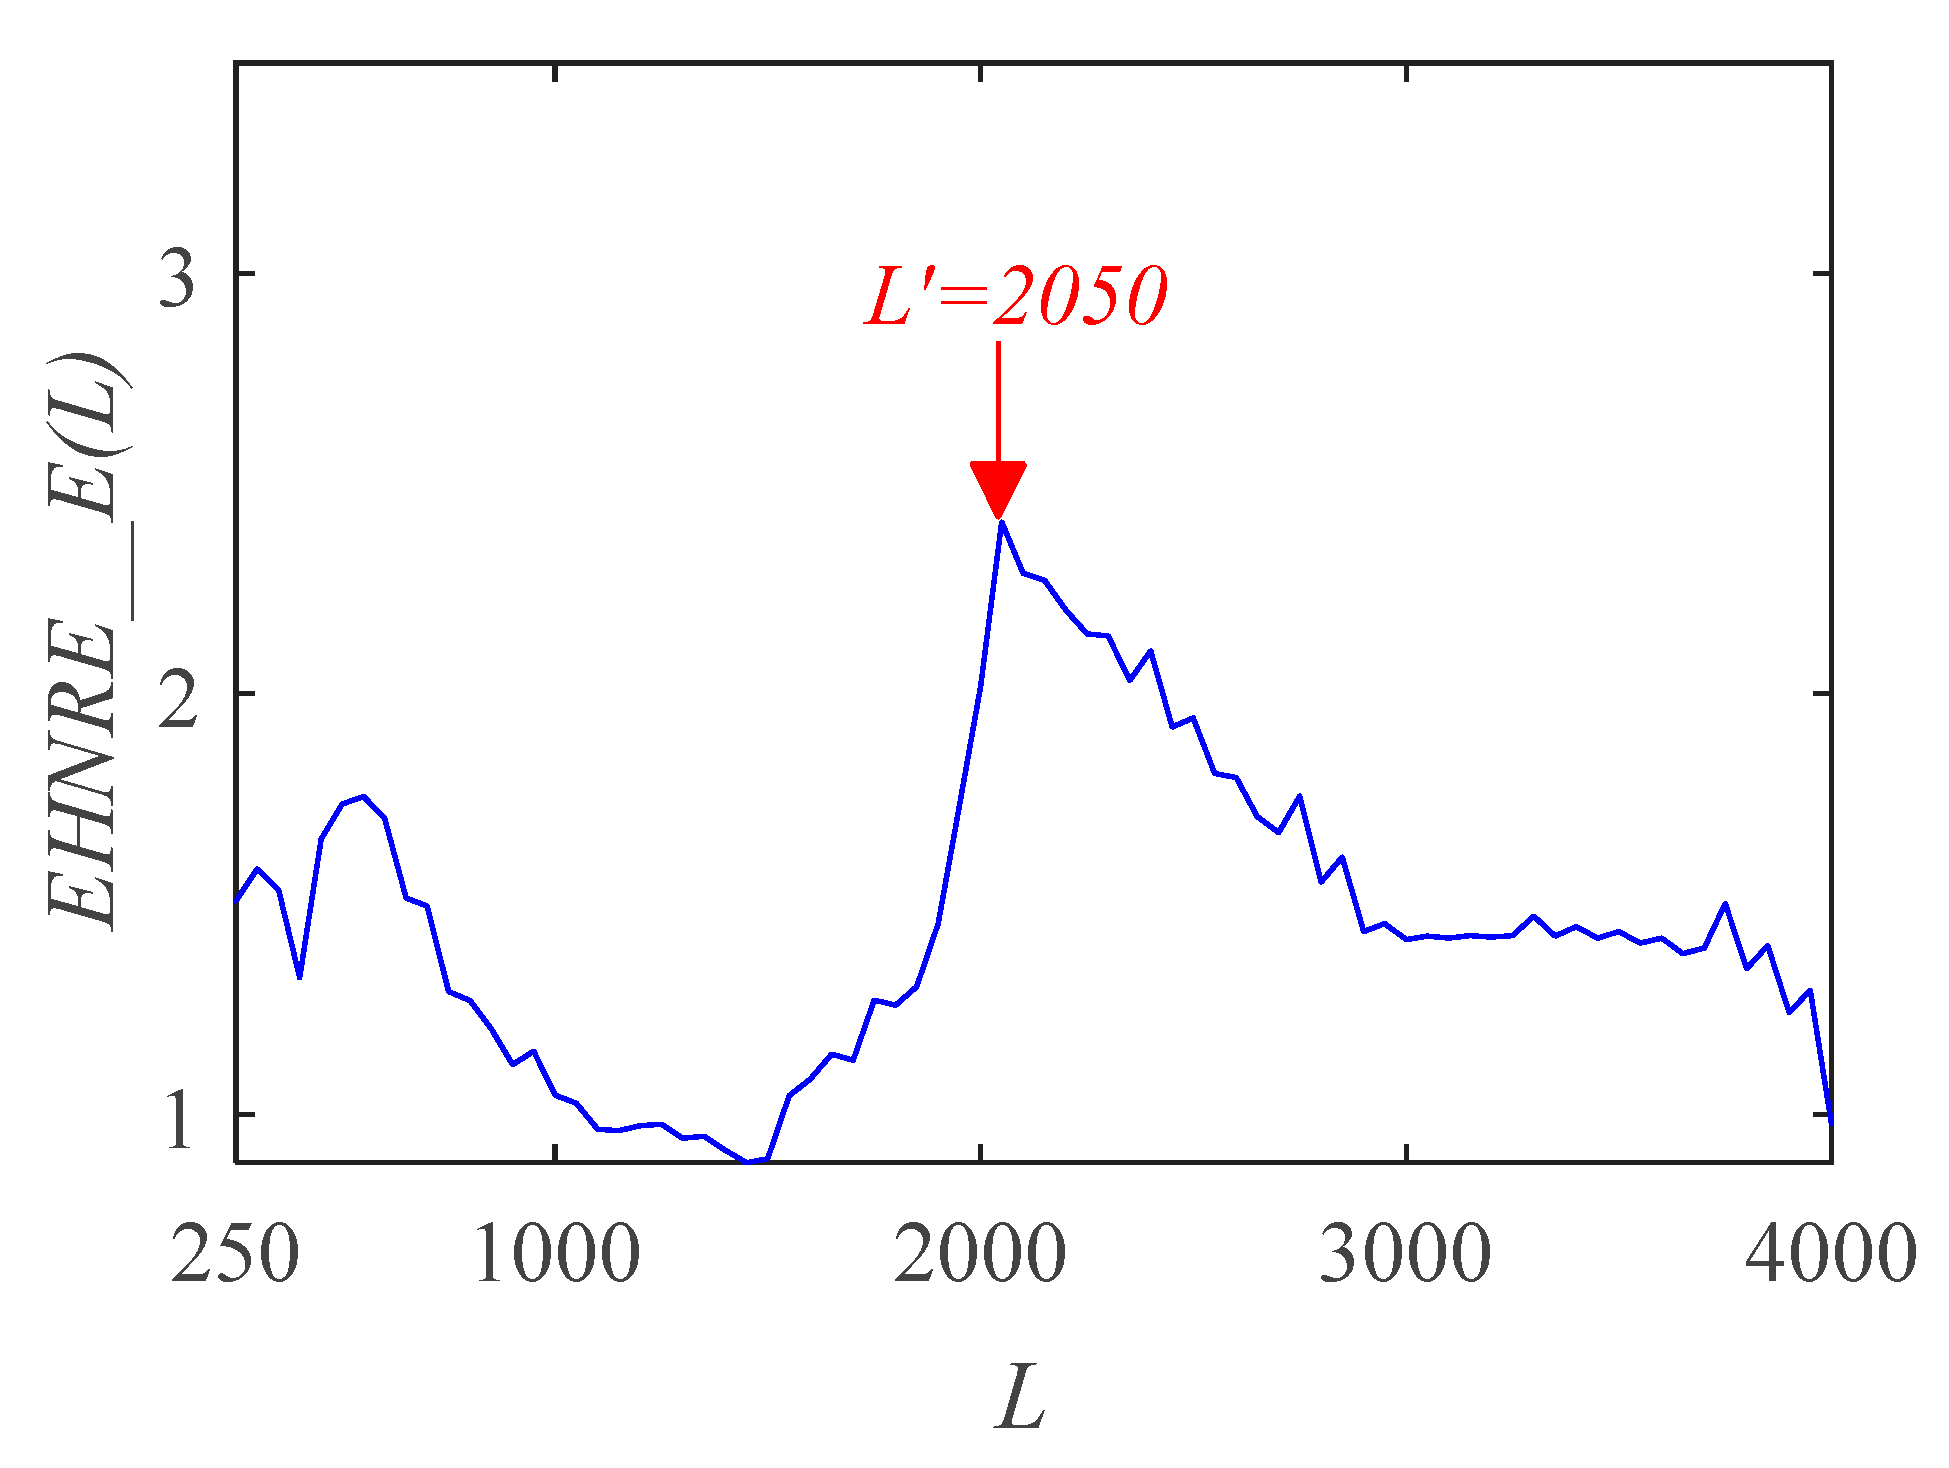
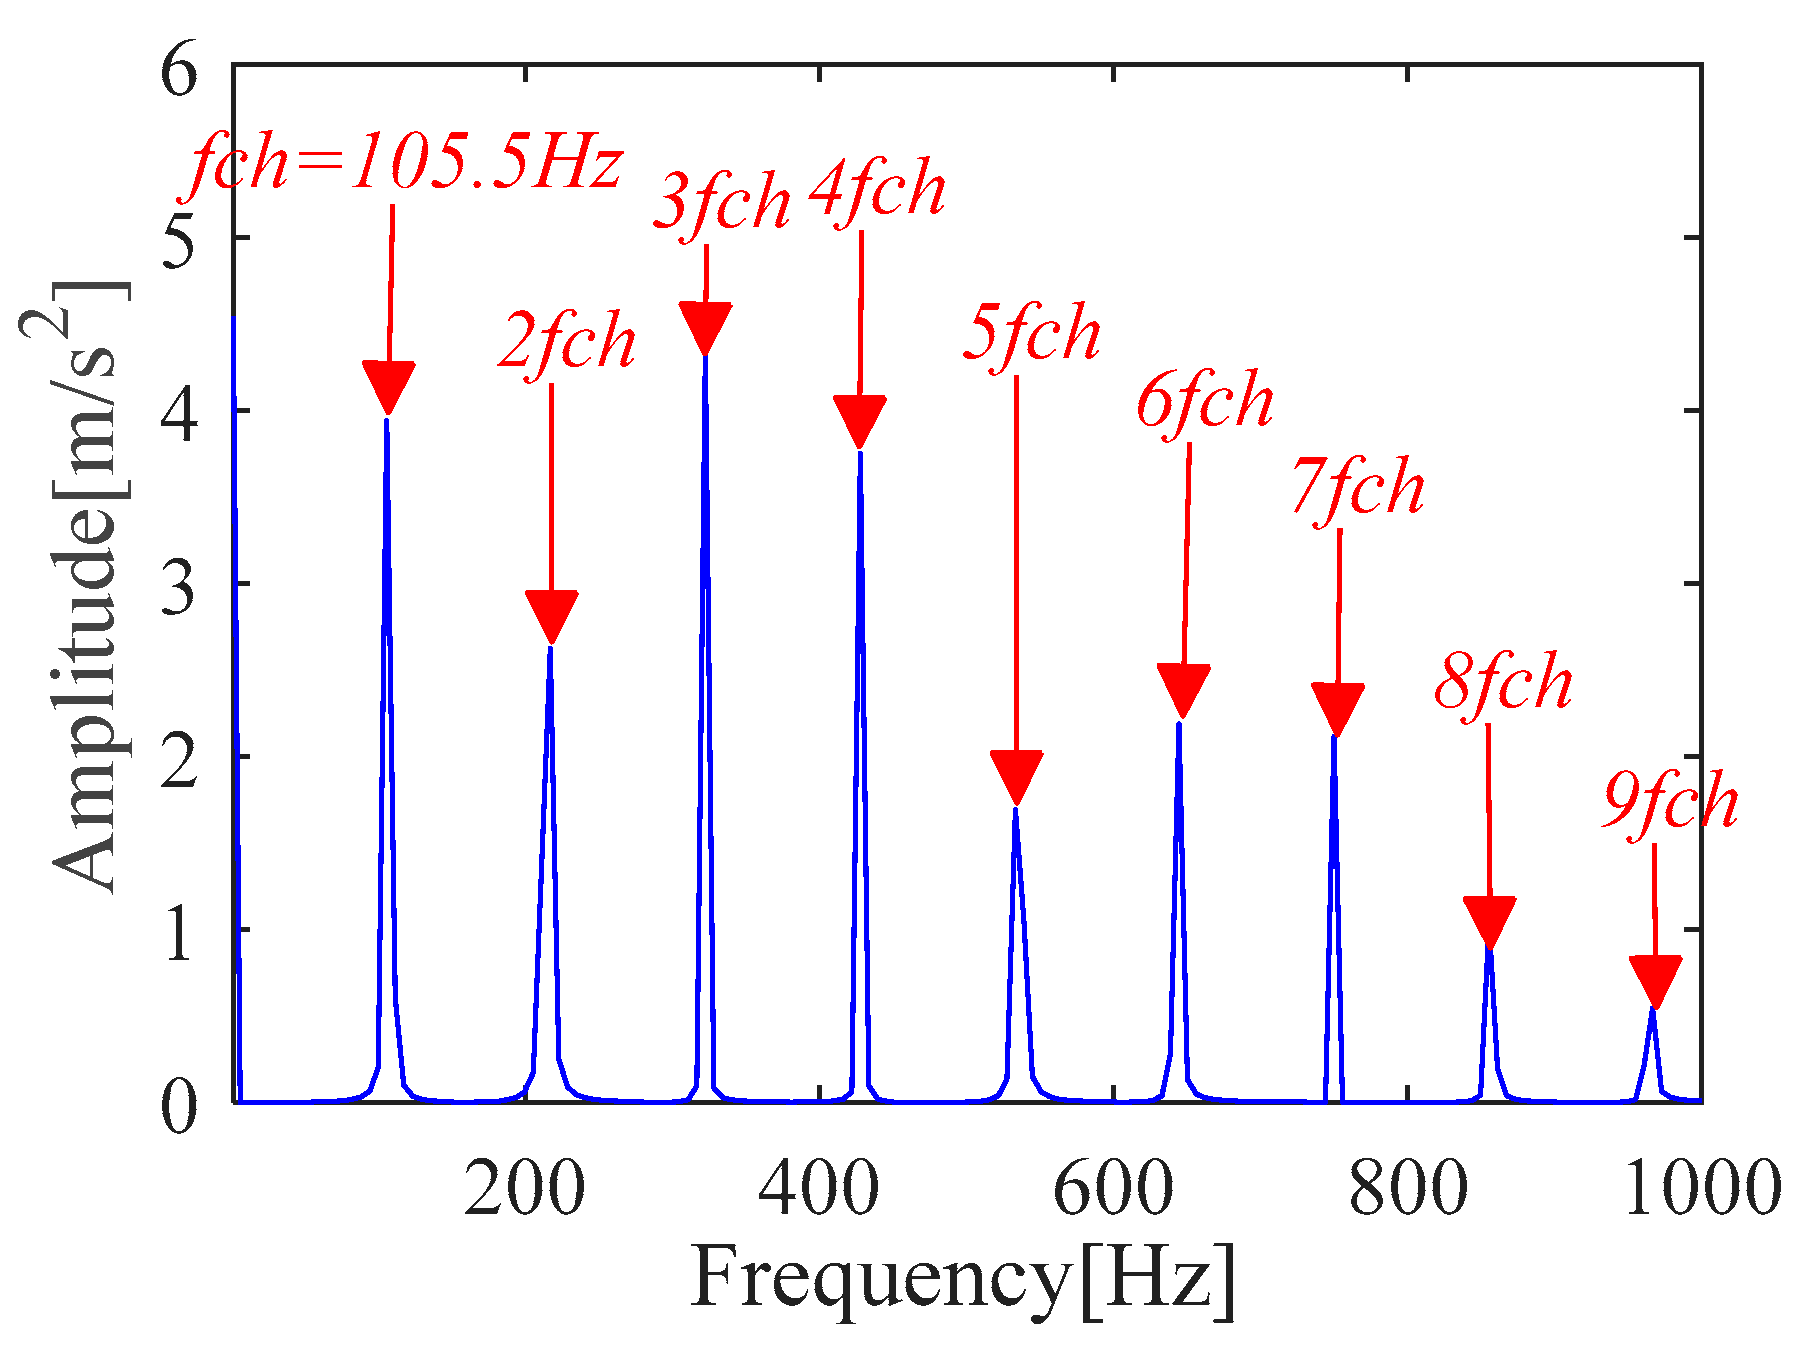
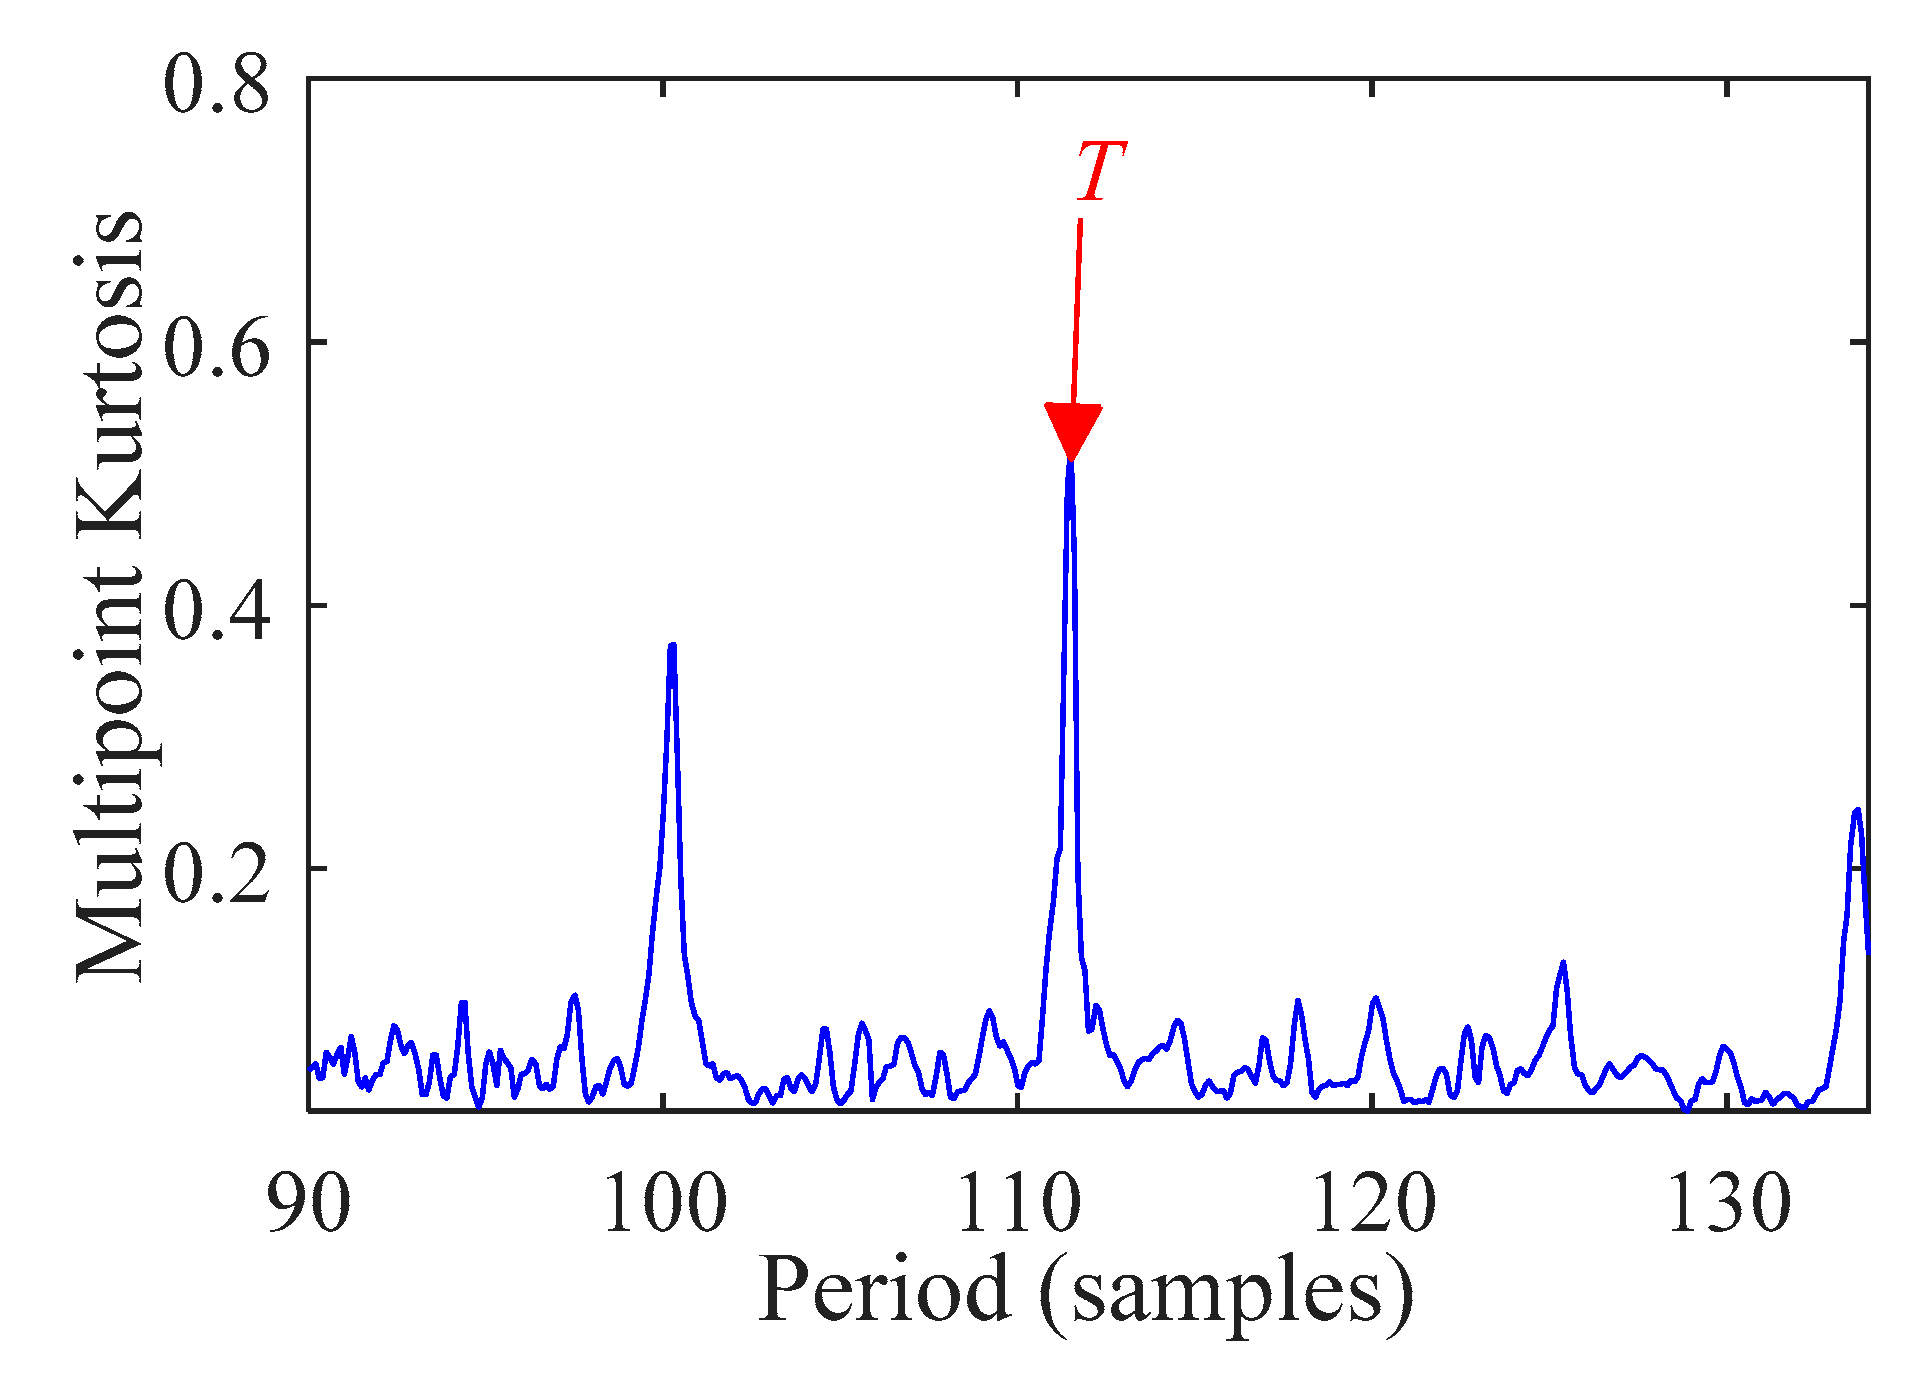
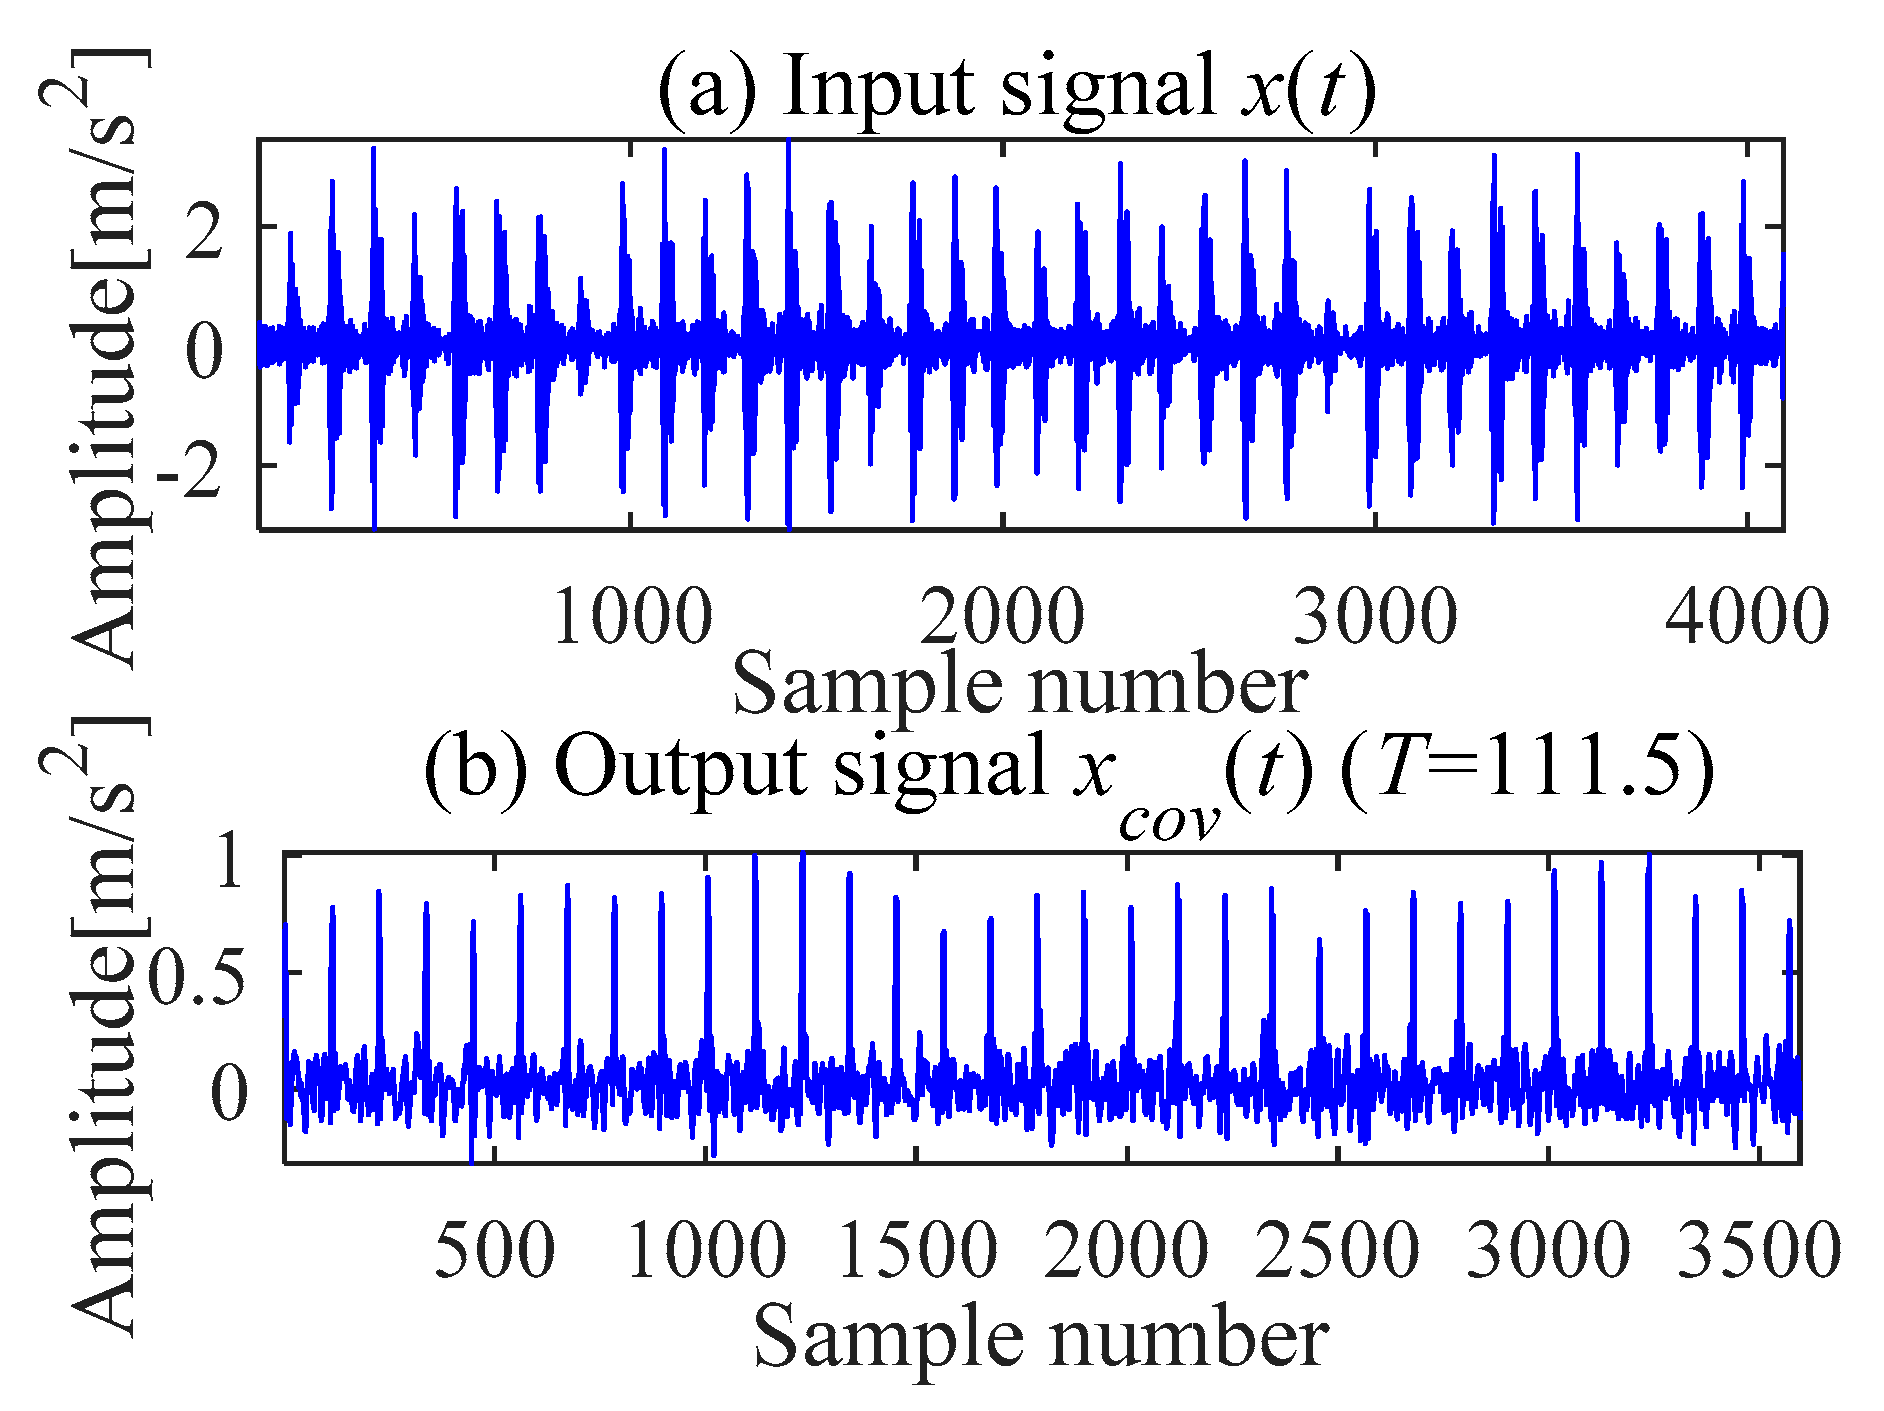
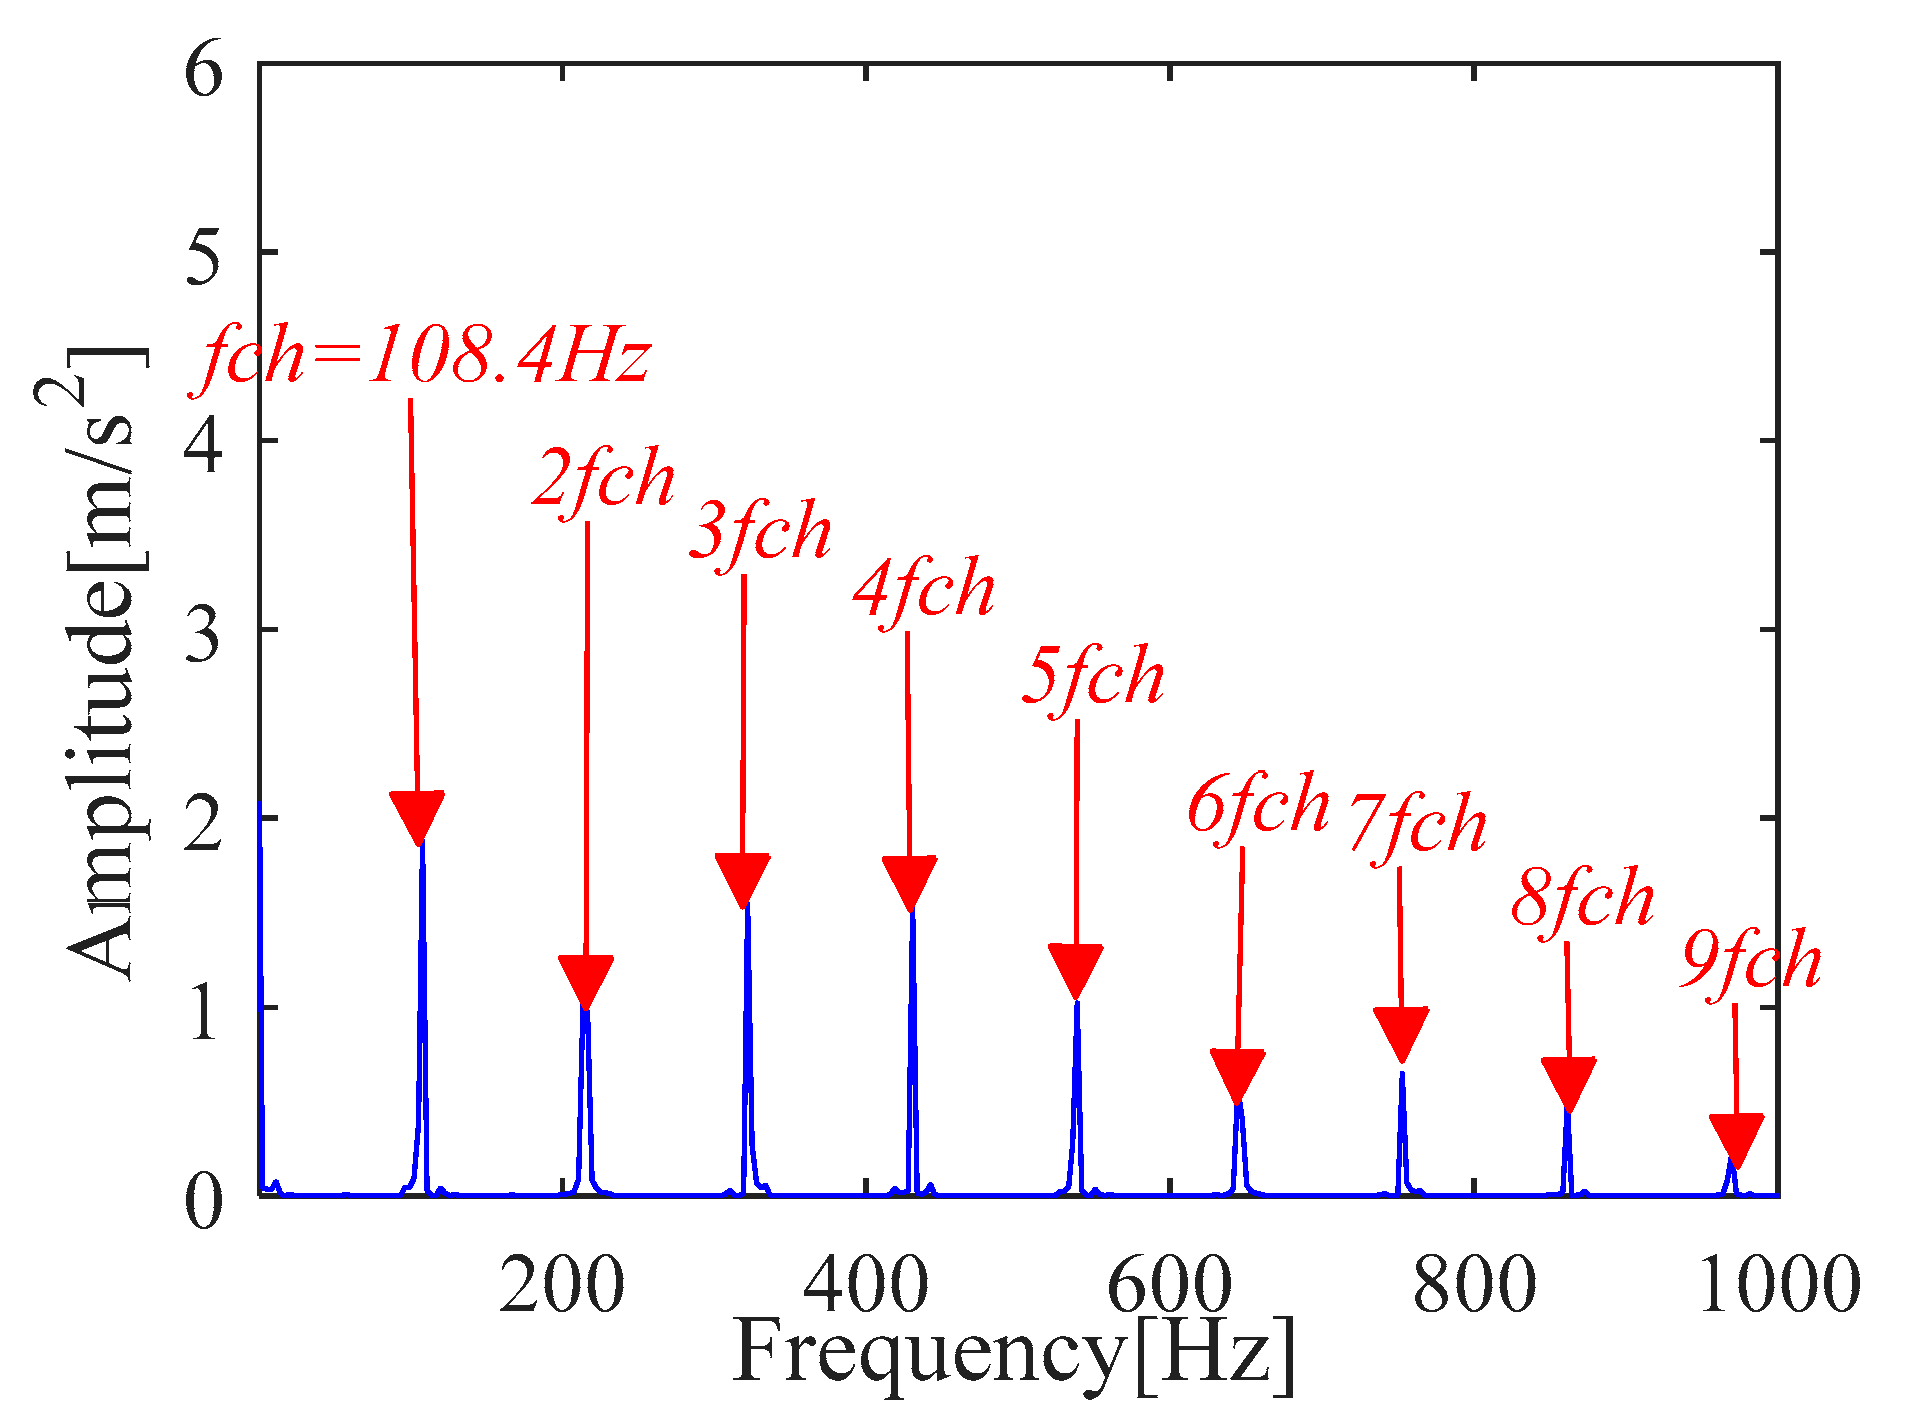
| Method | IMOMEDA-TKEO (T = 112; L = 2050) | MOMEDA-TKEO-Class 1 (T = (90,134); L = 500) | MOMEDA-TKEO-Class 2 (T = (90, 134); L = 2050) | Fast Kurtogram |
|---|---|---|---|---|
| Value of SNRfd | 2.6600 | 0.2352 | 2.5014 | 0.1784 |
| Method | IMOMEDA-TKEO (T = 75; L = 2100) | MOMEDA-TKEO-Class 1 (T = (59,88); L = 500) | MOMEDA-TKEO-Class 2 (T = (59, 88); L = 2100) | Fast Kurtogram |
|---|---|---|---|---|
| Value of SNRfd | 1.4538 | 0.7664 | 1.4200 | 0.3632 |
| Rolling Element Number (Z) | Contact Angle (θ) | Rolling Element Diameter d (mm) | Pitch Diameter D (mm) | Rotational Speed (rpm) | Dynamic Load Rating (N) | Static Load Rating (N) | Limiting Speed (rpm) |
|---|---|---|---|---|---|---|---|
| 16 | 15.17 | 0.331 | 2.815 | 2000 | 6500 | 7470 | 2500 |
| Outer race | Method | IMOMEDA-TKEO (T = 86; L = 2100) | MOMEDA-TKEO-class 1 (T = (68,102); L = 500) | MOMEDA-TKEO-class 2 (T = (68,102); L = 2100) | Fast kurtogram |
| Value of SNRfd | 1.9344 | 0.1675 | 1.8167 | 0.1139 | |
| Inner race | Method | IMOMEDA-TKEO (T = 69;L = 2050) | MOMEDA-TKEO-class 1 (T = (54,81); L = 500) | MOMEDA-TKEO-class 2 (T = (54,81); L = 2050) | Fast kurtogram |
| Value of SNRfd | 1.4221 | 0.1127 | 1.2527 | 0.1105 |
| Rolling Element Number (Z) | Contact Angle (θ) | Bearing Pitch Diameter (mm) | Roller Diameter (mm) | Dynamic Load Rating (N) | Static Load Rating (N) | Limiting Speed (rpm) |
|---|---|---|---|---|---|---|
| 9 | 0 | 39 | 8 | 14,800 | 7800 | 18,000 |
| Outer Race | Method | IMOMEDA-TKEO (T = 472; L = 2200) | MOMEDA-TKEO-class 1 (T = (382,573); L = 500) | MOMEDA-TKEO-class 2 (T = (382,573); L = 2200) | Fast kurtogram |
| Value of SNRfd | 2.8843 | 0.5228 | 1.1936 | 0.2830 | |
| Inner Race | Method | IMOMEDA-TKEO (T = 319; L = 2400) | MOMEDA-TKEO-class 1 (T = (252,378); L = 500) | MOMEDA-TKEO-class 2 (T = (252,378); L = 2400) | Fast kurtogram |
| Value of SNRfd | 2.9423 | 0.5179 | 1.6656 | 0.2961 |
| Fault Type | Algorithm | Fault Period T/Time | Fault Period T/Iterations | Filter Length L/Time | Filter Length L/Iterations |
|---|---|---|---|---|---|
| CWRU(outer) | IMOMEDA | 0.465s | 8 | 57.114s | 76 |
| CWRU(inner) | 0.751s | 9 | 57.950s | 77 | |
| NASA(outer) | 0.594s | 9 | 64.015s | 76 | |
| NASA(inner) | 0.690s | 9 | 57.617s | 77 | |
| KUST-SY(outer) | 0.744s | 6 | 81.343s | 61 | |
| KUST-SY(inner) | 0.756s | 6 | 92.087s | 67 |
| Datasets | CWRU (Outer) | CWRU (Inner) | NASA (Outer) | NASA (Inner) | KUST-SY (Outer) | KUST-SY (Inner) | |
|---|---|---|---|---|---|---|---|
| Algorithm | |||||||
| IMOMEDA | 65.385s | 63.792s | 68.859s | 61.770s | 83.616s | 102.741s | |
| (T = 112) | (T = 75) | (T = 86) | (T = 68) | (T = 472) | (T = 319) | ||
| (L = 2050) | (L = 2100) | (L = 2100) | (L = 2050) | (L = 2200) | (L = 2400) | ||
| MOMEDA-TKEO-class 1 | 1.127s | 1.334s | 1.181s | 1.171s | 10.179s | 7.389s | |
| (T = (90,134)) | (T = (59,88)) | (T = (68,102)) | (T = (54,81)) | (T = (382,573)) | (T = (252,378)) | ||
| (L = 500) | (L = 500) | (L = 500) | (L = 500) | (L = 500) | (L = 500) | ||
| MOMEDA-TKEO-class 2 | 4.221s | 4.357s | 4.685s | 4.562s | 21.490s | 22.958s | |
| (T = (90,134)) | (T = (59,88)) | (T = (68,102)) | (T = (54,81)) | (T = (382,573)) | (T = (252,378)) | ||
| (L = 2050) | (L = 2100) | (L = 2100) | (L = 2050) | (L = 2400) | (L = 2000) | ||
| FK | 0.809s | 0.763s | 0.825s | 0.837s | 9.543s | 8.906s | |
Publisher’s Note: MDPI stays neutral with regard to jurisdictional claims in published maps and institutional affiliations. |
© 2021 by the authors. Licensee MDPI, Basel, Switzerland. This article is an open access article distributed under the terms and conditions of the Creative Commons Attribution (CC BY) license (http://creativecommons.org/licenses/by/4.0/).
Share and Cite
Li, Z.; Ma, J.; Wang, X.; Li, X. An Optimal Parameter Selection Method for MOMEDA Based on EHNR and Its Spectral Entropy. Sensors 2021, 21, 533. https://doi.org/10.3390/s21020533
Li Z, Ma J, Wang X, Li X. An Optimal Parameter Selection Method for MOMEDA Based on EHNR and Its Spectral Entropy. Sensors. 2021; 21(2):533. https://doi.org/10.3390/s21020533
Chicago/Turabian StyleLi, Zhuorui, Jun Ma, Xiaodong Wang, and Xiang Li. 2021. "An Optimal Parameter Selection Method for MOMEDA Based on EHNR and Its Spectral Entropy" Sensors 21, no. 2: 533. https://doi.org/10.3390/s21020533
APA StyleLi, Z., Ma, J., Wang, X., & Li, X. (2021). An Optimal Parameter Selection Method for MOMEDA Based on EHNR and Its Spectral Entropy. Sensors, 21(2), 533. https://doi.org/10.3390/s21020533