1. Introduction
Multiple blind sound source localization is an enabling technology for many practical applications such as indoor localization [
1,
2], radar sensing [
3], and robotic navigation [
4]. The typical underlying techniques for source localization is Angle of Arrival (AoA) estimation algorithms (hereafter, we will use AoA estimation to denote source localization as well) such as MUSIC [
5,
6], ESPRIT [
7,
8], SAGE [
9], beamforming [
10] or over-determined source separation and localization method [
11]. Despite their success in obtaining correct AoA information even in the present of multiple sound sources, these common solutions have a important limitation: they can only locate a number of sources less than the number of microphones in an array. Meanwhile, these algorithms can only achieve sufficient resolution when the input sources have limited signal bandwidth. Otherwise, the performance would be significantly degraded. Using spectral weighting is a feasible approach to improve accuracy, which however, is vulnerable to interference [
12].
Considering above limitations, another category of methods use binaural localization cues combined with Time-Frequency (T-F) masking for source separation which allows the separation of more number of input sources than the number of microphones. Motivated by the ability of 3D sound source localization via human ear, the authors of [
13] present an algorithm for binaural localization with only two microphones. This algorithm process the mixture with Head Related Transfer Functions followed by a clustering technique, being able to locate multiple concurrent sound sources in both azimuth and elevation directions. However, this algorithm requires a prior knowledge on the number of input sources. In [
14], the authors propose to use Interaural Time/Phase Differences (ILD and IPD) for separating and localizing multiple sound sources. However, the computational requirement for this algorithm is too high. A deep learning oriented mask based source separation algorithm is proposed in [
15] while its performance is heavily dependent on the amount of training data, which makes the system relatively difficult to implement. In [
16], a single channel based source separation algorithm is presented but only report satisfactory results at a limited number of input sources.
To this end, in this paper, we propose a novel joint Source seParation and BeamForming algorithm (SPBF) for multiple blind source localization. Our algorithm is based on a novel microphone layout design shown in
Figure 1. This layout design contains two groups of microphone arrays. One microphone array is on the top of another and the distance between these two arrays is kept small. The closest two microphones between two array groups make a pair and are used for source separation. Since the arrival time is preserved after source separation, we then individually exploit these de-separated signals for AoA estimation via delay-and-sum beamforming. Such separation-first-then-localization strategy allows to minimize mutual interference from different sound sources, therefore enabling finer AoA estimation. To further obtain accurate beamforming result, we introduce a new spectral weighting function, allowing to get a sharper beam pattern and thus not only provides better AoA estimation resolution but also higher SNR. The major contributions of this paper are summarized as follows:
We design a new microphone array layout. With appropriate signal processing design, it allows to locate a number of sources larger than the number of microphones.
We propose an new weighting function which can largely sharpen correlation peak hence finer AoA estimation resolution and higher SNR.
The rest of the paper is organized as follows. In
Section 2, we describe our microphone array layout design consideration in details.
Section 3 presents algorithm design. Simulation results are exhibited in
Section 4. Finally,
Section 5 concludes this paper.
2. Design of Microphone Layout
The structure of our proposed array layout is shown in
Figure 1. It contains two groups of microphone arrays each has the same identical microphone layout. The closest distance between each microphone in an array group is denoted by
and between two groups is
. The microphones in each array group are in the same plane. The two distances
and
should be properly configured so as to achieve the best performance.
The appropriate distance
is determined by the bandwidth of input signals. More specifically, to avoid spatial aliasing, the following requirement should be satisfied [
17]:
where
is the minimum wavelength for the signal of interest. Considering human hearing frequency range is 20 Hz∼20 kHz [
18,
19,
20], the maximum distance between sensors should approximately be:
, where
c is the sound speed,
is the maximum frequency present in the sources. The above equation determines the upper bound for
.
The lower bound for is limited by beamforming algorithm. The accuracy of beamforming-based AoA estimation relies on the resolution of Time-Difference-of-Arrival (TDoA) among different microphones. This implies that should be as large as possible so as to maximize TDoA. Otherwise, high sampling rate would be needed, which however, requires computational resources and memory bandwidth, making it unsuitable for resource-constraints IoT devices. In particular, the observed sample sequences from two microphones that have the maximum distance in an array should have time delay no less than one sample. This implies that , where denotes the time delay incurred by one sample and denotes the maximum sampling rate. For instance, on a circular array with 6 microphones working at 16 kHz, cm, so cm. This constraint can also help to obtain the maximum operational sampling rate for a given array.
The distance affects the performance for source separation. In our design, we utilize Degenerate Unmixing Estimation Technique (DUET) algorithm that only requires two microphones whose distance should be as small as possible so as to prevent phase-warping. To this end, should be minimized to its physical limitation. Under this case, the source separation algorithm can achieve optimal performance and preserve as much spatial information for each source as possible.
3. Robust Source Localization
Our robust source localization involves two steps: blind source separation and beamforming based localization.
3.1. Blind Source Separation
To separate mixed signals, we utilize Degenerate Unmixing Estimation Technique (DUET) algorithm [
21]. DUET is able to blindly separate an arbitrary number of sources given just two anechoic mixtures namely, two microphones, provided that the time– frequency representations of sources are
disjoint [
21,
22] or non-overlapped entirely, which is true under most cases [
21,
23]. The demixing processing can thereby be deemed as a partitioning in time-frequency plane.
In DUET, the received mixed signals by two microphones in the time-frequency domain can be written in a simple form as:
where
denotes the time-frequency representation of the first microphone,
is original source signals without delay and attenuation. In the above equation, the subscript
j, known as the active index
j, indicates which source dominates current frame. The core principle behind DUET is that the ratio of the time–frequency representations can fully characterize the mixing parameters:
where
. The mixing parameters, namely the local attenuation estimator
and the local delay estimator
, can be calculated based on the active source component:
The above equation helps to label the current active source. Therefore, in the following steps, we can demix the mixture via binary masking constructed on these mixing parameters. To accomplish this task, for each active index
j, an indicator functions is built:
At this step, we can demix the sources now:
To further enhance the performance, clustering techniques are applied on the estimated attenuation and delay parameters. The number of clusters is the estimated number of sources and the cluster centres are often deemed as the optimal estimation of the mixing parameters for each source. At the last step, we can reconstruct the sources from the time–frequency representations by converting back into the time domain.
3.2. Beamforming and Localization
After demixing multiple sources, we utilize beamforming method to locate their angle-of-arrival.
3.2.1. Beamforming Process
The delay-and-sum (hereafter, we will call it vanilla) beamforming [
17,
24] finds the incident angle by searching the maximal energy over a spherical grid when using a circular array (hereafter, we assume we adopt a circular array). Supposing there are M-microphones, a beamformer output can be defined as:
where
is the signal from the
mth microphone and
is the respective arrival time delay. The energy of beamformer output over a frame window of
N is thus formulated as:
Using Equations (
8) and (
9) can be expanded as:
where the term
can be regarded as a constant since
is relatively small, and
denotes cross-correlation between microphone
and
. Since
can be parameterized by incident angle
, the problem of AoA estimation via beamforming can thus be formulated as:
where
is the estimated optimal incident angle.
The afore-mentioned optimization problem is often solved by a greedy search that often leads to excesive computation power. To reduce computational energy, the solution space is often discretized and a lookup table between
and
is constructed so as to efficiently obtain
. The relation between
and
is calculated based on far-field assumption:
where
and
are the positions of the
ith and
jth microphones, respectively,
is the unit vector indicating the direction of a point source,
is the sampling rate, and
c is the speed of sound in air.
3.2.2. Problem of Vanilla Beamforming Algorithm
The performance of vanilla beamforming algorithm largely depends on cross-correlation. If an incident source has good compression properties [
25] where its correlation peak is sharp, the algorithm would get narrow beam width hence better estimation resolution and high SNR. However, in most cases, the sources do not hold such properties, making the beam rather wide hence subject to background interference.
3.2.3. Spectral Weighting Function
Spectral weighting are common approaches to sharpen the beam width, among which GCC-PHAT [
26] is the most popular one. However, in GCC-PHAT, each frequency bin of the spectrum contributes equally to the final correlation, making it sensitive to interference.
To balances the contribution of each frequency bin to correlation results, we propose a new weighting function.
where
,
is the mean spectral power of noise, estimated in the absence of source signals,
is a coefficient quantify how conservative the estimated noise power is (default to 0.9),
is normally set to 0.4.
is Wiener function of
prior SNR
, given by:
where
, and the super script
n here refers to
nth time frame. The numerator
in
could be estimated using decision-directed approach [
27]:
where
is a constant and normally is set to 0.9.
4. Simulation
We conduct extensive simulations to evaluate the performance of our proposed algorithm.
4.1. Setup
We evaluate the performance in a typical indoor room with a size of 10 × 10 × 3 m
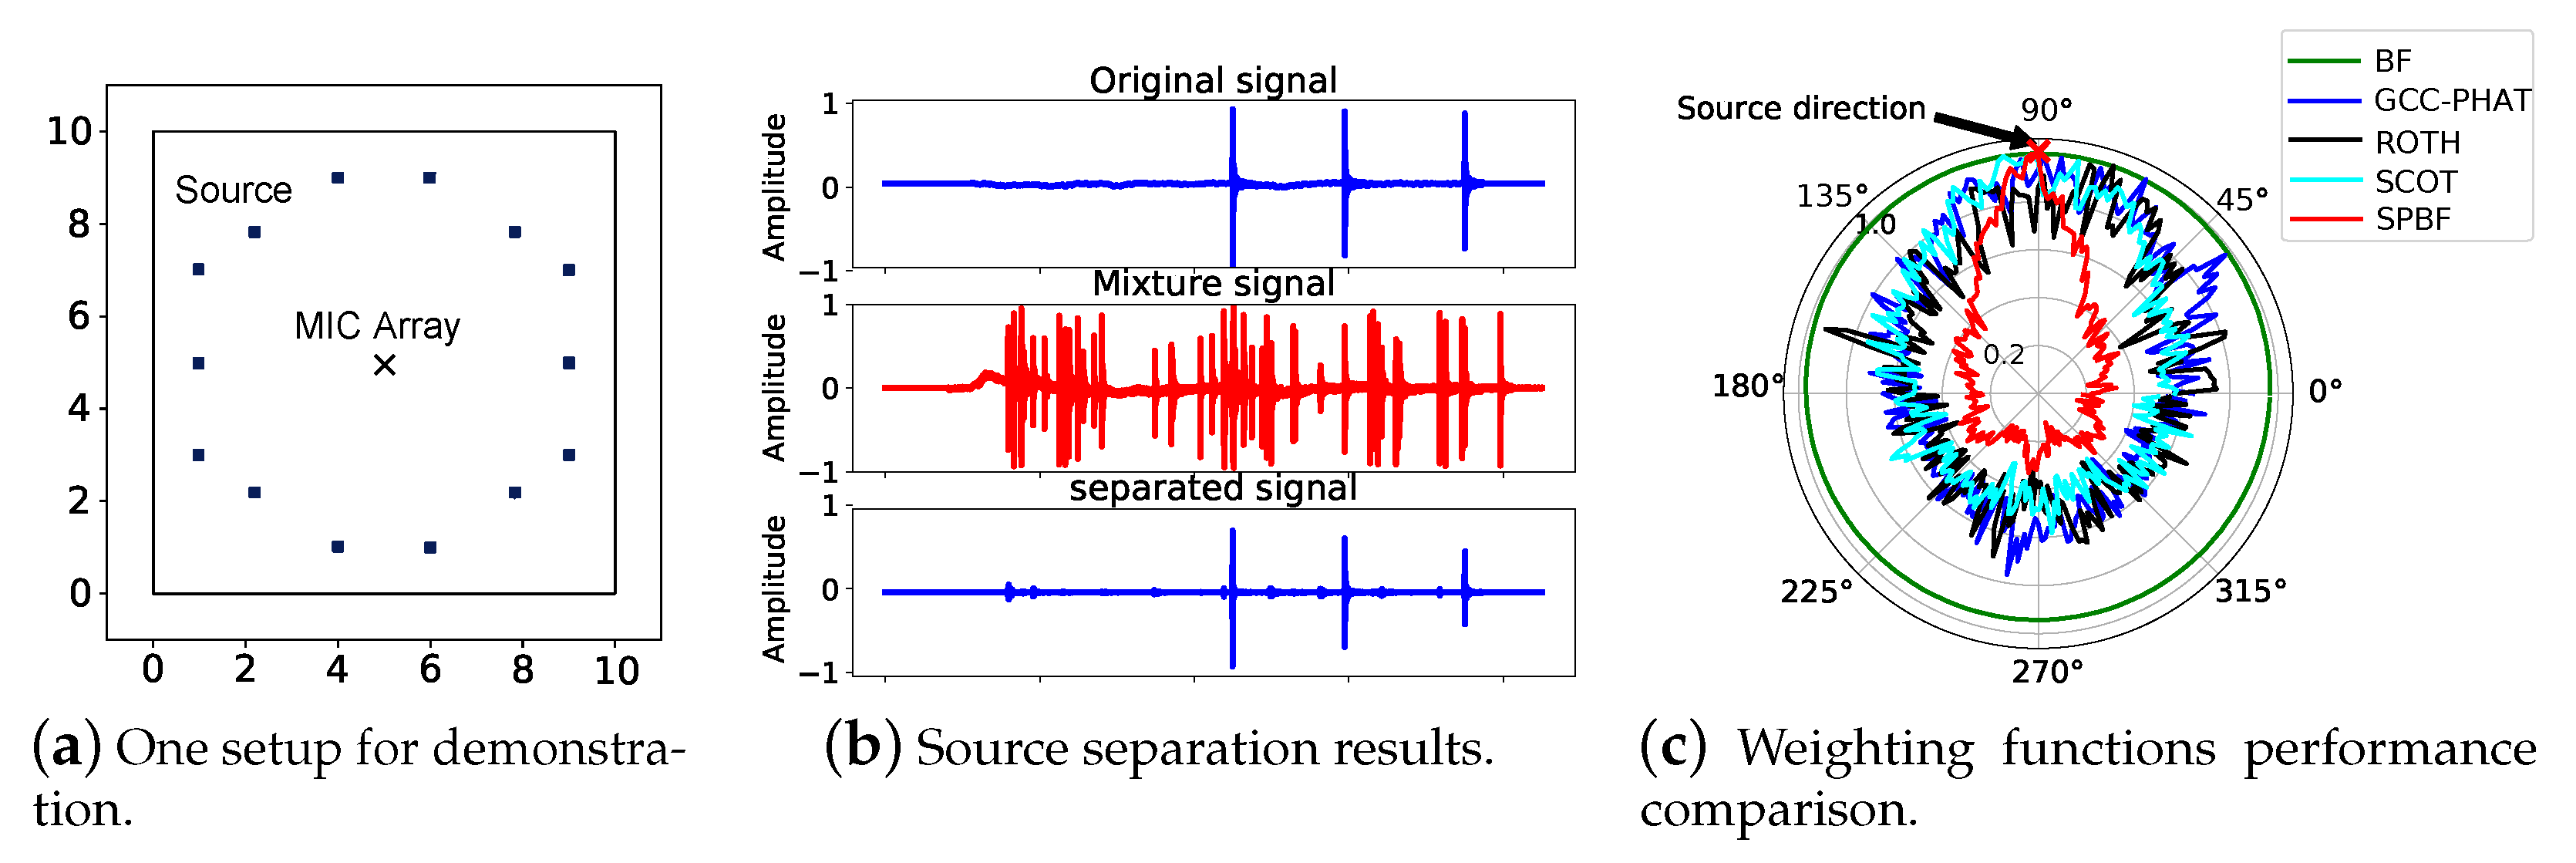
and simulate the multipath signals via ray tracing technique as shown in
Figure 2a.
Figure 2a depicts a simple setup for demonstration where fourteen types of real-recorded footstep sounds are emitted from different locations as source signals and we place our microphone array in the center of the room. The signal duration is between 20∼50 ms and they are triggered simultaneously. This microphone array contains two cascaded circular sub-arrays as shown in
Figure 1. The microphone distance in each group is configured as
cm and for each pair is 1 cm. Therefore, our array has a total of twelve microphones.
4.2. Results
We first demonstrate the performance of each component in SPBF. To start with, we show that DUET is feasible to decompose multiple sound sources with only two microphones and the results are shown in
Figure 2b. The results reveal that the demixed signal is highly consistent with the original one. We then inspect the impacts of our proposed weighting function on the beamforming algorithm. In this experiment, we utilize only one sound source (footstep sounds). For comparison, we also implement GCC-PHAT [
28] along with several other existing work including ROTH [
29] and Smoothed coherence transform(SCOT) [
30], the results are shown in
Figure 2c. It is observable that our algorithm cannot only locate the ground truth AoA but also exhibit a rather narrow beam pattern, making it noise-resilient. While in comparison, GCC-PHAT, ROTH, and SCOT have many noisy peaks, making it infeasible to correctly locate even a single sound source. Vanilla beamforming algorithm though can identify the correct AoA but have rather wide beam patterns, making it vulnerable to interference. The results clearly demonstrate the effectiveness of our weighting function.
We next check the beamforming results with common algorithms including GCC-PHAT, ROTH, and SCOT in
Figure 3a and our SPBF in
Figure 3b. It is obersevable that AoA spectrum of SPBF is sharper and has less side lobes than other algorithms, indicating the effectiveness of our proposed algorithm. We have also extensively evaluate the localization performance between vanilla beamforming, GCC-PHAT, SCOT, ROTH, and SPBF. The results presented in
Figure 3c demonstrates that the 80-percentile error of SPBF is at least
improvements over other algorithms. The results clearly demonstrate the superior performance of our proposed algorithm. In the following experiment, we explore the impact of the number of samples on the localization performance and the results are shown in
Figure 4a. It is observable that the number of samples or equivalently the duration of signals impose negligible impacts on the localization performance. Since our algorithm can effectively work at a minimal of 500 samples (equivalently 10 ms given a sampling rate of 48 kHz), it is robust to the Doppler effect. We then conduct experiments when the number of sources is larger than the number of microphones and the results are shown in
Figure 4b. The results reveal that the number of sources does not impose significant impacts on beamforming results. SPBF can achieve a median accuracy of
and a 80-percentile of
. The maximum error does not exceed
. We also conduct experiments using a linear array. The results in
Figure 4c reveal that the performance of circular array is slightly better than that of linear array due to more microphones.
We explore the impact of multipath effect by operating the source localization algorithms in different room size and the results are shown in
Figure 5a. It is observable that the multipath effect can affect the source localization performance as the localization errors increase when the room size becomes smaller, equivalent more severe multipath effect. We next explore the results when multiple sources transmit non-overlapped (non-concurrently) and overlapped (concurrently). The results shown in
Figure 5b reveal that when the sources are overlapped, the performance experience no obvious performance drop, indicating the robustness of our algorithm. We finally perform localization using different types of souce signals including footstep, speech, and whistle and the results are shown in
Figure 5c. It can be observed that different types of source inputs can have a large impact on the final performance. As we can see from
Figure 5c, the localization performance of footstep and whistle are significantly better than speech. This is due to the fact that footstep and whistle have much more sharp auto-correlation peaks than speech, making the final localization performance much better.
4.3. Runtime Performance
We have explored the time cost of each module of our proposed algorithm and report the results in
Table 1. The results are obtained on Intel(R) Core(TM) i7-6700HQ CPU @2.60 GHz with 8 GB RAM. The code is implemented in C language. The time overhead for each module in
Table 1 is the average result of 100 trials. The source separation module that consumes 262.59 ms dominates the overhead of the proposed algorithm. The time cost for spectral weighting and beamforming is 11.68 ms and 95.76 ms, respectively. Therefore, the total time overhead is 370 ms, which achieves satisfactory runtime performance. We believe that when involving more advanced code optimization technique or hardware architecture such as GPU, the runtime performance can be further improved.
5. Conclusions
In this paper, we propose to first separate mixed sources and then utilize beamforming with proposed spectral weighting function to locate multiple sources. In particular, we design a new microphone layout that enables top locate more number of sources than the number of microphones in an array. Simulation results demonstrate that the proposed algorithm can achieve significantly better performance than existing solutions.
Author Contributions
H.P. and C.C. They did quite a lot of implementation work. M.H. and T.D. complete the paper draft. R.Z. and J.L. help to revise the paper.All authors have read and agreed to the published version of the manuscript.
Funding
This research received no external funding.
Institutional Review Board Statement
The study was conducted according to the guidelines of the Declaration of Helsinki, and approved by the Ethics Committee of Huazhong University of Science and Technology (protocol code 44162684-2).
Informed Consent Statement
Informed consent was obtained from all subjects involved in the study.
Data Availability Statement
Data available on request due to privacy restrictions.
Conflicts of Interest
The authors declare no conflict of interest.
Abbreviations
The following abbreviations are used in this manuscript:
| SPBF | Source seParation and BeamForming |
| AoA | Angle of Arrival |
| MUSIC | MUltiple SIgnal Classification |
| ESPRIT | Estimation of Signal Parameters via Rational Invariance Techniques |
| SAGE | Space-alternating Generalized Expectation-maximization |
| SNR | Signal-to-noise Ratio |
| TDoA | Time-Difference-of-Arrival |
| DUET | Degenerate Unmixing Estimation Technique |
| GCC-PHAT | Generalized Cross-correlation with Phase Transform |
| SCOT | Smoothed coherence transform |
References
- Valin, J.; Michaud, F.; Rouat, J.; Letourneau, D. Robust sound source localization using a microphone array on a mobile robot. In Proceedings of the 2003 IEEE/RSJ International Conference on Intelligent Robots and Systems (IROS 2003) (Cat. No.03CH37453), Las Vegas, NV, USA, 27–31 October 2003; Volume 2, pp. 1228–1233. [Google Scholar]
- Choi, J.; Kim, J.; Kim, N.S. Robust Time-Delay Estimation for Acoustic Indoor Localization in Reverberant Environments. IEEE Signal Proc. Lett. 2017, 24, 226–230. [Google Scholar] [CrossRef]
- Kotus, J. Application of passive acoustic radar to automatic localization, tracking and classification of sound sources. In Proceedings of the 2010 2nd International Conference on Information Technology, (2010 ICIT), Gdansk, Poland, 28–30 June 2010; pp. 67–70. [Google Scholar]
- Rascon, C.; Meza, I. Localization of sound sources in robotics: A review. Robot. Autonom. Syst. 2017, 96, 184–210. [Google Scholar] [CrossRef]
- Schmidt, R. Multiple emitter location and signal parameter estimation. IEEE Trans. Antennas Propag. 1986, 34, 276–280. [Google Scholar] [CrossRef]
- Belouchrani, A.; Amin, M.G. Time-frequency MUSIC. IEEE Signal Proc. Lett. 1999, 6, 109–110. [Google Scholar] [CrossRef]
- Roy, R.; Kailath, T. ESPRIT-estimation of signal parameters via rotational invariance techniques. IEEE Trans. Acoust. Speech Signal Proc. 1989, 37, 984–995. [Google Scholar] [CrossRef]
- Gao, F.; Gershman, A.B. A generalized ESPRIT approach to direction-of-arrival estimation. IEEE Signal Proc. Lett. 2005, 12, 254–257. [Google Scholar] [CrossRef]
- Fessler, J.A.; Hero, A.O. Space-alternating generalized expectation-maximization algorithm. IEEE Trans. Signal Proc. 1994, 42, 2664–2677. [Google Scholar] [CrossRef]
- Van Veen, B.D.; Buckley, K.M. Beamforming: A versatile approach to spatial filtering. IEEE ASSP Mag. 1988, 5, 4–24. [Google Scholar] [CrossRef]
- Wang, L.; Reiss, J.D.; Cavallaro, A. Over-Determined Source Separation and Localization Using Distributed Microphones. IEEE/ACM Trans. Audio Speech Lang. Proc. 2016, 24, 1573–1588. [Google Scholar] [CrossRef]
- Chen, L.; Liu, Y.; Kong, F.; He, N. Acoustic Source Localization Based on Generalized Cross-correlation Time-delay Estimation. Proc. Eng. 2011, 15, 4912–4919. [Google Scholar] [CrossRef]
- Keyrouz, F.; Maier, W.; Diepold, K. Robotic Localization and Separation of Concurrent Sound Sources using Self-Splitting Competitive Learning. In Proceedings of the 2007 IEEE Symposium on Computational Intelligence in Image and Signal Processing, Honolulu, HI, USA, 1–5 April 2007; pp. 340–345. [Google Scholar] [CrossRef]
- Mandel, M.I.; Weiss, R.J.; Ellis, D.P.W. Model-Based Expectation-Maximization Source Separation and Localization. IEEE Trans. Audio Speech Lang. Proc. 2010, 18, 382–394. [Google Scholar] [CrossRef]
- Yu, Y.; Han, P. Localization based stereo speech source separation using probabilistic time-frequency masking and deep neural networks. EURASIP J. Audio Speech Music Proc. 2016, 2016. [Google Scholar] [CrossRef]
- Mika, D.; Budzik, G.; Józwik, J. Single Channel Source Separation with ICA-Based Time-Frequency Decomposition. Sensors 2020, 20, 2019. [Google Scholar] [CrossRef] [PubMed]
- Mccowan, I. Microphone Arrays: A Tutorial. Ph.D. Thesis, Queensland University of Technology, Brisbane, Australia, April 2001. [Google Scholar]
- Cai, C.; Chen, Z.; Pu, H.; Ye, L.; Hu, M.; Luo, J. AcuTe: Acoustic Thermometer Empowered by a Single Smartphone. In Proceedings of the 18th Conference on Embedded Networked Sensor Systems, Yokohama, Japan, 16–19 November 2020; pp. 28–41. [Google Scholar]
- Cai, C.; Zheng, R.; Li, J.; Zhu, L.; Pu, H.; Hu, M. Asynchronous Acoustic Localization and Tracking for Mobile Targets. IEEE Internet Things J. 2020, 7, 830–845. [Google Scholar] [CrossRef]
- Cai, C.; Pu, H.; Hu, M.; Zheng, R.; Luo, J. SST: Software Sonic Thermometer on Acoustic-enabled IoT Devices. IEEE Trans. Mob. Comput. 2020, 1–14. [Google Scholar] [CrossRef]
- Yilmaz, O.; Rickard, S. Blind separation of speech mixtures via time-frequency masking. IEEE Trans. Signal Proc. 2004, 52, 1830–1847. [Google Scholar] [CrossRef]
- Krim, H.; Viberg, M. Two decades of array signal processing research: The parametric approach. IEEE Signal Proc. Mag. 1996, 13, 67–94. [Google Scholar] [CrossRef]
- Takeda, K.; Kameoka, H.; Sawada, H.; Araki, S.; Miyabe, S.; Yamada, T.; Makino, S. Underdetermined BSS with multichannel complex NMF assuming W-disjoint orthogonality of source. In Proceedings of the TENCON 2011-2011 IEEE Region 10 Conference, Bali, Indonesia, 21–24 November 2011. [Google Scholar]
- Adel, H.; Souad, M.; Alaqeeli, A.; Hamid, A. Beamforming Techniques for Multichannel audio Signal Separation. arXiv 2012, arXiv:1212.6080. [Google Scholar]
- Ramp, H.O.; Wingrove, E.R. Principles of Pulse Compression. IRE Trans. Mil. Electron. 1961, MIL-5, 109–116. [Google Scholar] [CrossRef]
- Kwon, B.; Park, Y.; Park, Y. Analysis of the GCC-PHAT technique for multiple sources. In Proceedings of the ICCAS, Gyeonggi-do, Korea, 27–30 October 2010; pp. 2070–2073. [Google Scholar]
- Cohen, I. On the decision-directed estimation approach of Ephraim and Malah. In Proceedings of the 2004 IEEE International Conference on Acoustics, Speech, and Signal Processing, Montreal, QC, Canada, 17–21 May 2004; Volume 1, pp. 1–293. [Google Scholar] [CrossRef]
- Knapp, C.; Carter, G. The generalized correlation method for estimation of time delay. IEEE Trans. Acous. Speech Signal Proc. 1976, 24, 320–327. [Google Scholar] [CrossRef]
- Roth, P.R. Effective measurements using digital signal analysis. IEEE Spectr. 1971, 8, 62–70. [Google Scholar] [CrossRef]
- Carter, G.C.; Nuttall, A.H.; Cable, P.G. The smoothed coherence transform. Proc. IEEE 1973, 61, 1497–1498. [Google Scholar] [CrossRef]
| Publisher’s Note: MDPI stays neutral with regard to jurisdictional claims in published maps and institutional affiliations. |
© 2021 by the authors. Licensee MDPI, Basel, Switzerland. This article is an open access article distributed under the terms and conditions of the Creative Commons Attribution (CC BY) license (http://creativecommons.org/licenses/by/4.0/).


