
Estimation of Various Walking Intensities Based on Wearable Plantar Pressure Sensors Using Artificial Neural Networks

 ,
,  ,
, 
 ,
,  and
and 
Abstract
:1. Introduction
2. Materials and Methods
2.1. Participants
2.2. Procedures
2.3. Labeling
2.4. Pre-Processing of Training Model
2.5. Artificial Neural Network (ANN)
2.6. Evaluation
3. Results
4. Discussion
5. Conclusions
Author Contributions
Funding
Institutional Review Board Statement
Informed Consent Statement
Data Availability Statement
Acknowledgments
Conflicts of Interest
References
- Brognara, L.; Navarro-Flores, E.; Iachemet, L.; Serra-Catalá, N.; Cauli, O. Beneficial Effect of Foot Plantar Stimulation in Gait Parameters in Individuals with Parkinson’s Disease. Brain Sci. 2020, 10, 69. [Google Scholar] [CrossRef] [Green Version]
- Piercy, K.L.; Troiano, R.P.; Ballard, R.M.; Carlson, S.A.; Fulton, J.E.; Galuska, D.A.; George, S.M.; Olson, R.D. The Physical Activity Guidelines for Americans. JAMA 2018, 320, 2020–2028. [Google Scholar] [CrossRef]
- Middleton, A.; Fritz, S.L.; Lusardi, M. Walking Speed: The Functional Vital Sign. J. Aging Phys. Act. 2015, 23, 314–322. [Google Scholar] [CrossRef]
- Liao, F.; An, R.; Pu, F.; Burns, S.; Shen, S.; Jan, Y.K. Effect of Exercise on Risk Factors of Diabetic Foot Ulcers A Systematic Review and Meta-Analysis. Am. J. Phys. Med. Rehabil. 2019, 98, 103–116. [Google Scholar] [CrossRef]
- Patry, J.; Belley, R.; Côté, M.; Chateau-Degat, M.L. Plantar pressures, plantar forces, and their influence on the pathogenesis of diabetic foot ulcers: A review. J. Am. Podiatr. Med. Assoc. 2013, 103, 322–332. [Google Scholar] [CrossRef] [PubMed]
- Veves, A.; Murray, H.J.; Young, M.J.; Boulton, A.J.M. The risk of foot ulceration in diabetic patients with high foot pressure: A prospective study. Diabetologia 1992, 35, 660–663. [Google Scholar] [CrossRef] [PubMed]
- Lung, C.W.; Wu, F.L.; Zhang, K.; Liau, B.Y.; Townsend, R.; Jan, Y.K. Using Elastographic Ultrasound to Assess Plantar Tissue Stiffness after Walking at Different Speeds and Durations. Appl. Sci. 2020, 10, 7498. [Google Scholar] [CrossRef]
- Jan, Y.-K.; Lung, C.-W.; Cuaderes, E.; Rong, D.; Boyce, K. Effect of viscoelastic properties of plantar soft tissues on plantar pressures at the first metatarsal head in diabetics with peripheral neuropathy. Physiol. Meas. 2013, 34, 53–66. [Google Scholar] [CrossRef] [PubMed]
- Lung, C.-W.; Hsiao-Wecksler, E.T.; Burns, S.; Lin, F.; Jan, Y.-K. Quantifying Dynamic Changes in Plantar Pressure Gradient in Diabetics with Peripheral Neuropathy. Front. Bioeng. Biotechnol. 2016, 4, 54. [Google Scholar] [CrossRef] [PubMed] [Green Version]
- Wang, L.; Jones, D.; Chapman, G.J.; Siddle, H.J.; Russell, D.A.; Alazmani, A.; Culmer, P.; Nodeh, A.A. A Review of Wearable Sensor Systems to Monitor Plantar Loading in the Assessment of Diabetic Foot Ulcers. IEEE Trans. Biomed. Eng. 2019, 67, 1989–2004. [Google Scholar] [CrossRef]
- Bautista, J.A.R.; Zavala, A.H.; Chaparro-Cárdenas, S.L.; Huerta-Ruelas, J.A. Review on plantar data analysis for disease diagnosis. Biocybern. Biomed. Eng. 2018, 38, 342–361. [Google Scholar] [CrossRef]
- Zulkifli, S.S.; Loh, W.P. A state-of-the-art review of foot pressure. Foot Ankle Surg. 2020, 26, 25–32. [Google Scholar] [CrossRef] [PubMed]
- Pereiro-Buceta, H.; Becerro-de-Bengoa-Vallejo, R.; Losa-Iglesias, M.; López-López, D.; Navarro-Flores, E.; Martínez-Jiménez, E.; Martiniano, J.; Calvo-Lobo, C. The Effect of Simulated Leg-Length Discrepancy on the Dynamic Parameters of the Feet during Gait—Cross-Sectional Research. Healthcare 2021, 9, 932. [Google Scholar] [CrossRef] [PubMed]
- Armstrong, D.G.; Lavery, L.A.; Bushman, T.R. Peak foot pressures influence the healing time of diabetic foot ulcers treated with total contact casts. J. Rehabil. Res. Dev. 1998, 35, 1–5. [Google Scholar] [PubMed]
- Lung, C.W.; Jan, Y.K. Soft Tissue Biomechanics of Diabetic Foot Ulcers. In Soft Tissue: Composition, Mechanisms of Injury and Repair; Ruiz, A.J.C., Mendoza, J.M.A., Eds.; Nova Science Publishers: Hauppauge, NY, USA, 2012; pp. 1–32. [Google Scholar]
- Ramirez-Bautista, J.A.; Huerta-Ruelas, J.A.; Kóczy, L.T.; Hatwágner, M.F.; Chaparro-Cárdenas, S.L.; Hernández-Zavala, A. Classification of plantar foot alterations by fuzzy cognitive maps against multi-layer perceptron neural network. Biocybern. Biomed. Eng. 2020, 40, 404–414. [Google Scholar] [CrossRef]
- Chhoeum, V.; Kim, Y.; Min, S.-D. Estimation of Knee Joint Angle Using Textile Capacitive Sensor and Artificial Neural Network Implementing with Three Shoe Types at Two Gait Speeds: A Preliminary Investigation. Sensors 2021, 21, 5484. [Google Scholar] [CrossRef]
- Agatonovic-Kustrin, S.; Beresford, R. Basic concepts of artificial neural network (ANN) modeling and its application in pharmaceutical research. J. Pharm. Biomed. Anal. 2000, 22, 717–727. [Google Scholar] [CrossRef]
- Rupérez, M.; Martín-Guerrero, J.; Monserrat, C.; Alcañiz, M. Artificial neural networks for predicting dorsal pressures on the foot surface while walking. Expert Syst. Appl. 2012, 39, 5349–5357. [Google Scholar] [CrossRef]
- Joo, S.-B.; Oh, S.E.; Sim, T.; Kim, H.; Choi, C.H.; Koo, H.; Mun, J.H. Prediction of gait speed from plantar pressure using artificial neural networks. Expert Syst. Appl. 2014, 41, 7398–7405. [Google Scholar] [CrossRef]
- Bowling, F.L.; Metcalfe, S.A.; Wu, S.; Boulton, A.J.M.; Armstrong, D.G. Liquid Silicone to Mitigate Plantar Pedal Pressure: A Literature Review. J. Diabetes Sci. Technol. 2010, 4, 846–852. [Google Scholar] [CrossRef] [Green Version]
- Xia, K.; Haung, J.; Wang, H. LSTM-CNN Architecture for Human Activity Recognition. IEEE Access 2020, 8, 56855–56866. [Google Scholar] [CrossRef]
- Krizhevsky, A.; Sutskever, I.; Hinton, G.E. Imagenet classification with deep convolutional neural networks. Adv. Neural Inf. Process. Syst. 2012, 25, 1097–1105. [Google Scholar] [CrossRef]
- Purushothama, G.; Narendranath, A.; Thukaram, D.; Parthasarathy, K. ANN applications in fault locators. Int. J. Electr. Power Energy Syst. 2001, 23, 491–506. [Google Scholar] [CrossRef]
- Huang, G.-B. Learning capability and storage capacity of two-hidden-layer feedforward networks. IEEE Trans. Neural Netw. 2003, 14, 274–281. [Google Scholar] [CrossRef] [Green Version]
- Buldt, A.K.; Forghany, S.; Landorf, K.B.; Levinger, P.; Murley, G.S.; Menz, H.B. Foot posture is associated with plantar pressure during gait: A comparison of normal, planus and cavus feet. Gait Posture 2018, 62, 235–240. [Google Scholar] [CrossRef]
- Liau, B.-Y.; Wu, F.-L.; Li, Y.; Lung, C.-W.; Mohamed, A.A.; Jan, Y.-K. Effect of Walking Speeds on Complexity of Plantar Pressure Patterns. Complexity 2021, 2021, 6571336. [Google Scholar] [CrossRef]
- Bohannon, R.W.; Andrews, A.W. Normal walking speed: A descriptive meta-analysis. Physiotherapy 2011, 97, 182–189. [Google Scholar] [CrossRef] [PubMed]
- Wu, F.-L.; Wang, W.T.-J.; Liao, F.; Elliott, J.; Jain, S.; Jan, Y.-K. Effects of walking speeds and durations on plantar skin blood flow responses. Microvasc. Res. 2020, 128, 103936. [Google Scholar] [CrossRef] [PubMed]
- Goyal, M.; Reeves, N.D.; Davison, A.K.; Rajbhandari, S.; Spragg, J.; Yap, M.H. DFUNet: Convolutional Neural Networks for Diabetic Foot Ulcer Classification. IEEE Trans. Emerg. Top. Comput. Intell. 2018, 4, 728–739. [Google Scholar] [CrossRef] [Green Version]
- Stefenon, S.F.; Branco, N.W.; Nied, A.; Bertol, D.W.; Finardi, E.C.; Sartori, A.; Meyer, L.H.; Grebogi, R.B. Analysis of training techniques of ANN for classification of insulators in electrical power systems. IET Gener. Transm. Distrib. 2020, 14, 1591–1597. [Google Scholar] [CrossRef]
- Okinda, C.; Nyalala, I.; Korohou, T.; Okinda, C.; Wang, J.; Achieng, T.; Wamalwa, P.; Mang, T.; Shen, M. A review on computer vision systems in monitoring of poultry: A welfare perspective. Artif. Intell. Agric. 2020, 4, 184–208. [Google Scholar]
- Yang, H.; Long, M.; Tai, H.-M. Region-of-interest image coding based on EBCOT. IEE Proc. Vision Image Signal Process. 2005, 152, 590–596. [Google Scholar] [CrossRef]
- Talebi, H.; Milanfar, P. Learning to Resize Images for Computer Vision Tasks. arXiv 2021, arXiv:2103.09950. [Google Scholar]
- Al-Sammarraie, N.A.; Al-Mayali, Y.M.H.; El-Ebiary, Y.A.B. Classification and diagnosis using back propagation Artificial Neural Networks (ANN). In Proceedings of the 2018 International Conference on Smart Computing and Electronic Enterprise (ICSCEE), Shah Alam, Malaysia, 11–12 July 2018. [Google Scholar]
- Kim, M. Supervised learning-based DDoS attacks detection: Tuning hyperparameters. ETRI J. 2019, 41, 560–573. [Google Scholar] [CrossRef]
- Kingma, D.P.; Ba, J. Adam: A method for stochastic optimization. arXiv 2014, arXiv:1412.6980. [Google Scholar]
- Chae, J.; Kang, Y.-J.; Noh, Y. A Deep-Learning Approach for Foot-Type Classification Using Heterogeneous Pressure Data. Sensors 2020, 20, 4481. [Google Scholar] [CrossRef] [PubMed]
- Taylor, A.J.; Menz, H.B.; Keenan, A.-M. The influence of walking speed on plantar pressure measurements using the two-step gait initiation protocol. Foot 2004, 14, 49–55. [Google Scholar] [CrossRef]
- Segal, A.; Rohr, E.; Orendurff, M.; Shofer, J.; O’Brien, M.; Sangeorzan, B. The Effect of Walking Speed on Peak Plantar Pressure. Foot Ankle Int. 2004, 25, 926–933. [Google Scholar] [CrossRef] [PubMed]
- Burnfield, J.; Few, C.D.; Mohamed, O.S.; Perry, J. The influence of walking speed and footwear on plantar pressures in older adults. Clin. Biomech. 2004, 19, 78–84. [Google Scholar] [CrossRef]
- Pataky, T.C.; Caravaggi, P.; Savage, R.; Parker, D.; Goulermas, J.Y.; Sellers, W.; Crompton, R. New insights into the plantar pressure correlates of walking speed using pedobarographic statistical parametric mapping (pSPM). J. Biomech. 2008, 41, 1987–1994. [Google Scholar] [CrossRef]
- Bhatt, T.; Wening, J.; Pai, Y.-C. Influence of gait speed on stability: Recovery from anterior slips and compensatory stepping. Gait Posture 2005, 21, 146–156. [Google Scholar] [CrossRef] [PubMed]
- Young, P.M.M.; Dingwell, J. Voluntarily changing step length or step width affects dynamic stability of human walking. Gait Posture 2012, 35, 472–477. [Google Scholar] [CrossRef] [Green Version]
- Rosenbaum, D.; Becker, H.-P. Plantar pressure distribution measurements. Technical background and clinical applications. Foot Ankle Surg. 1997, 3, 1–14. [Google Scholar] [CrossRef]
- Hayafune, N.; Jacob, H. Pressure and force distribution characteristics under the normal foot during the push-off phase in gait. Foot 1999, 9, 88–92. [Google Scholar] [CrossRef]
- Tanaka, T.; Hashimoto, N.; Nakata, M.; Ito, T.; Ino, S.; Ifukube, T. Analysis of Toe Pressures Under the Foot While Dynamic Standing on One Foot in Healthy Subjects. J. Orthop. Sports Phys. Ther. 1996, 23, 188–193. [Google Scholar] [CrossRef] [PubMed] [Green Version]
- Nandikolla, V.K.; Bochen, R.; Meza, S.; Garcia, A. Experimental Gait Analysis to Study Stress Distribution of the Human Foot. J. Med. Eng. 2017, 2017, 3432074. [Google Scholar] [CrossRef] [PubMed] [Green Version]
- Chou, S.-W.; Cheng, H.-Y.K.; Chen, J.-H.; Ju, Y.-Y.; Lin, Y.-C.; Wong, A.M.-K. The role of the great toe in balance performance. J. Orthop. Res. 2009, 27, 549–554. [Google Scholar] [CrossRef] [PubMed]
- Anwary, A.R.; Yu, H.; Vassallo, M. An Automatic Gait Feature Extraction Method for Identifying Gait Asymmetry Using Wearable Sensors. Sensors 2018, 18, 676. [Google Scholar] [CrossRef] [Green Version]
- Begg, R.; Kamruzzaman, J. Neural networks for detection and classification of walking pattern changes due to ageing. Australas. Phys. Eng. Sci. Med. 2006, 29, 188–195. [Google Scholar] [CrossRef]
- Chen, H.C.; Jan, Y.K.; Liau, B.Y.; Lin, C.Y.; Tsai, J.Y.; Li, C.T.; Lung, C.W. Using Deep Learning Methods to Predict Walking Intensity from Plantar Pressure Images. In International Conference on Applied Human Factors and Ergonomics; Springer: Berlin/Heidelberg, Germany, 2021. [Google Scholar]
- Razak, A.H.A.; Zayegh, A.; Begg, R.K.; Wahab, Y. Foot Plantar Pressure Measurement System: A Review. Sensors 2012, 12, 9884–9912. [Google Scholar] [CrossRef] [Green Version]
- Chen, H.-C.; Putra, K.T.; Tseng, S.-S.; Chen, C.-L.; Lin, J.C.-W. A spatiotemporal data compression approach with low transmission cost and high data fidelity for an air quality monitoring system. Future Gener. Comput. Syst. 2020, 108, 488–500. [Google Scholar] [CrossRef]
- Sabottke, C.F.; Spieler, B.M. The Effect of Image Resolution on Deep Learning in Radiography. Radiol. Artif. Intell. 2020, 2, e190015. [Google Scholar] [CrossRef] [PubMed]


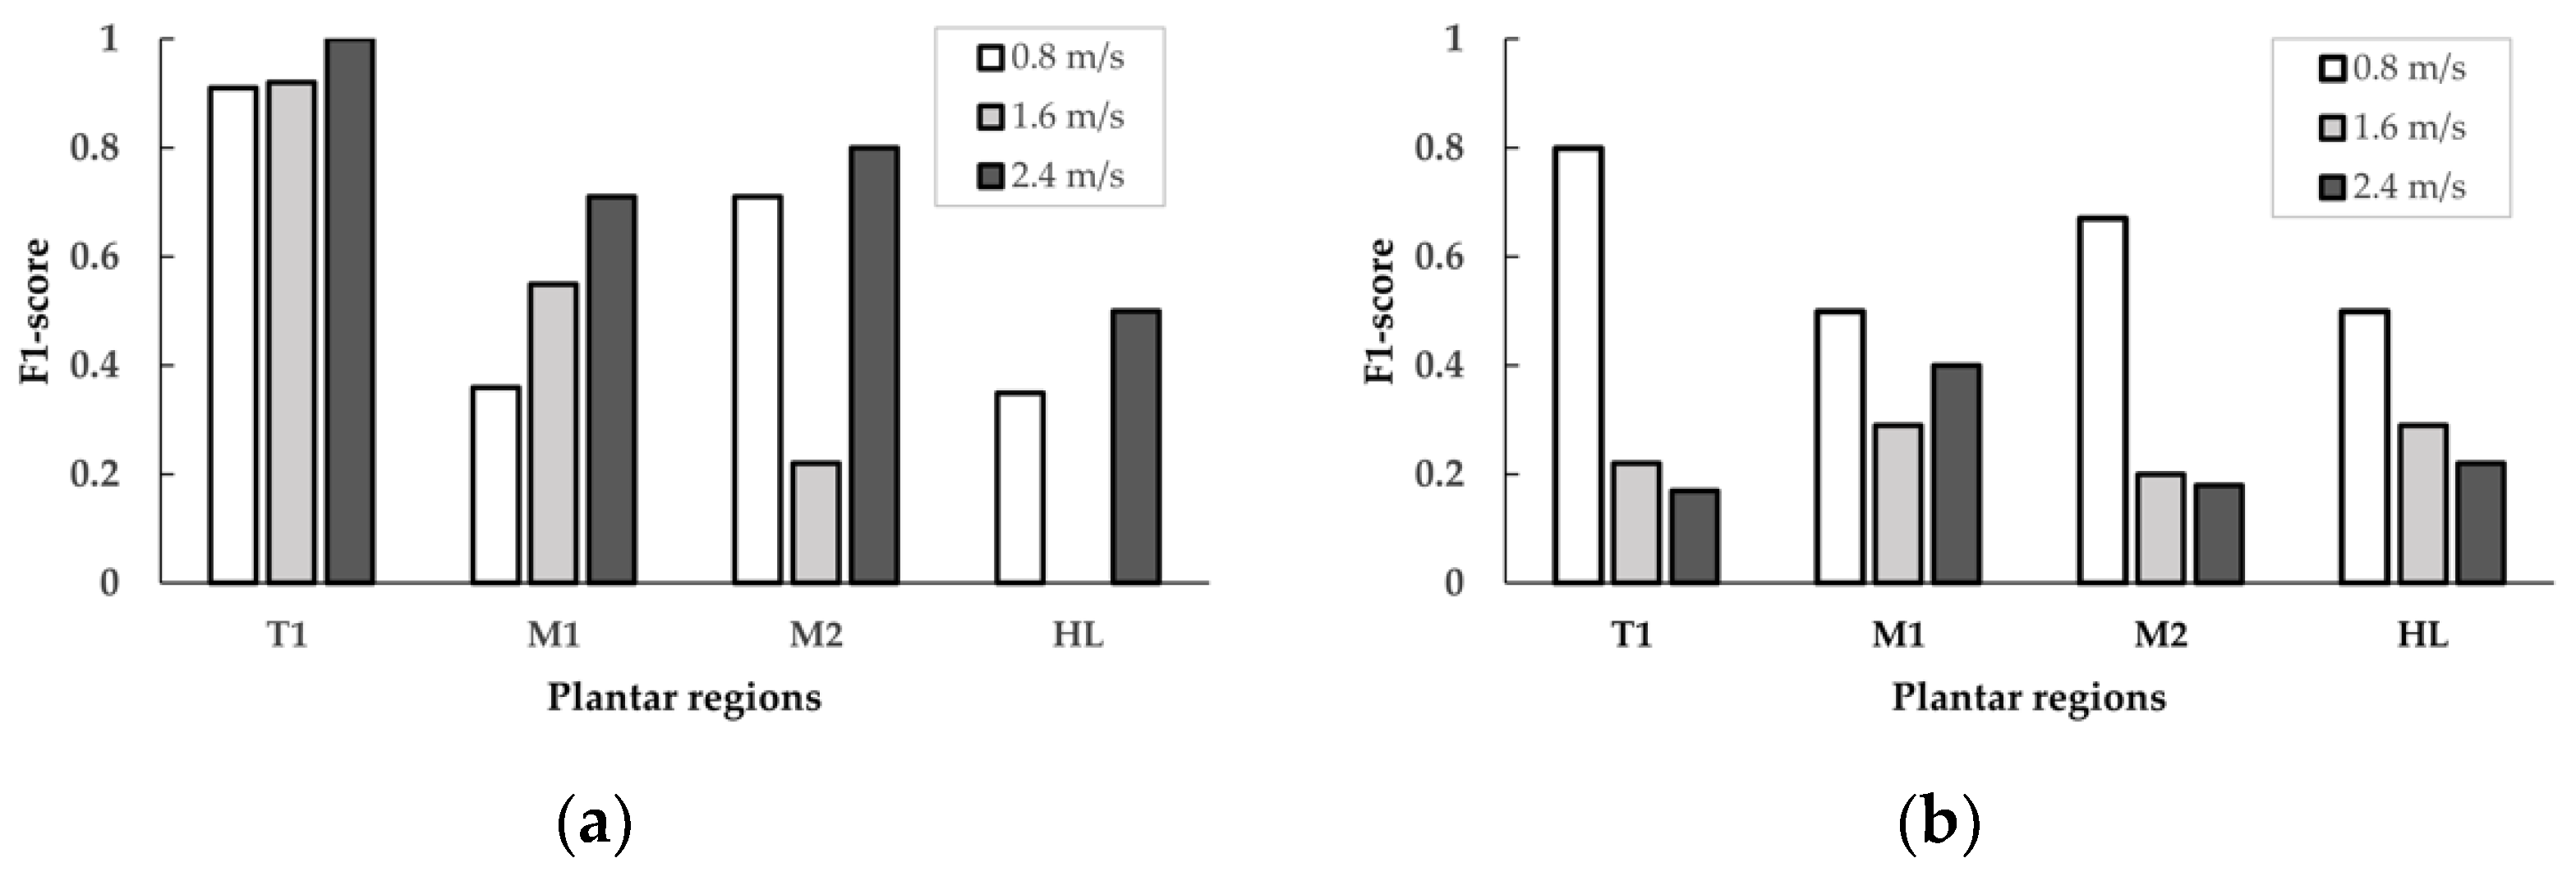
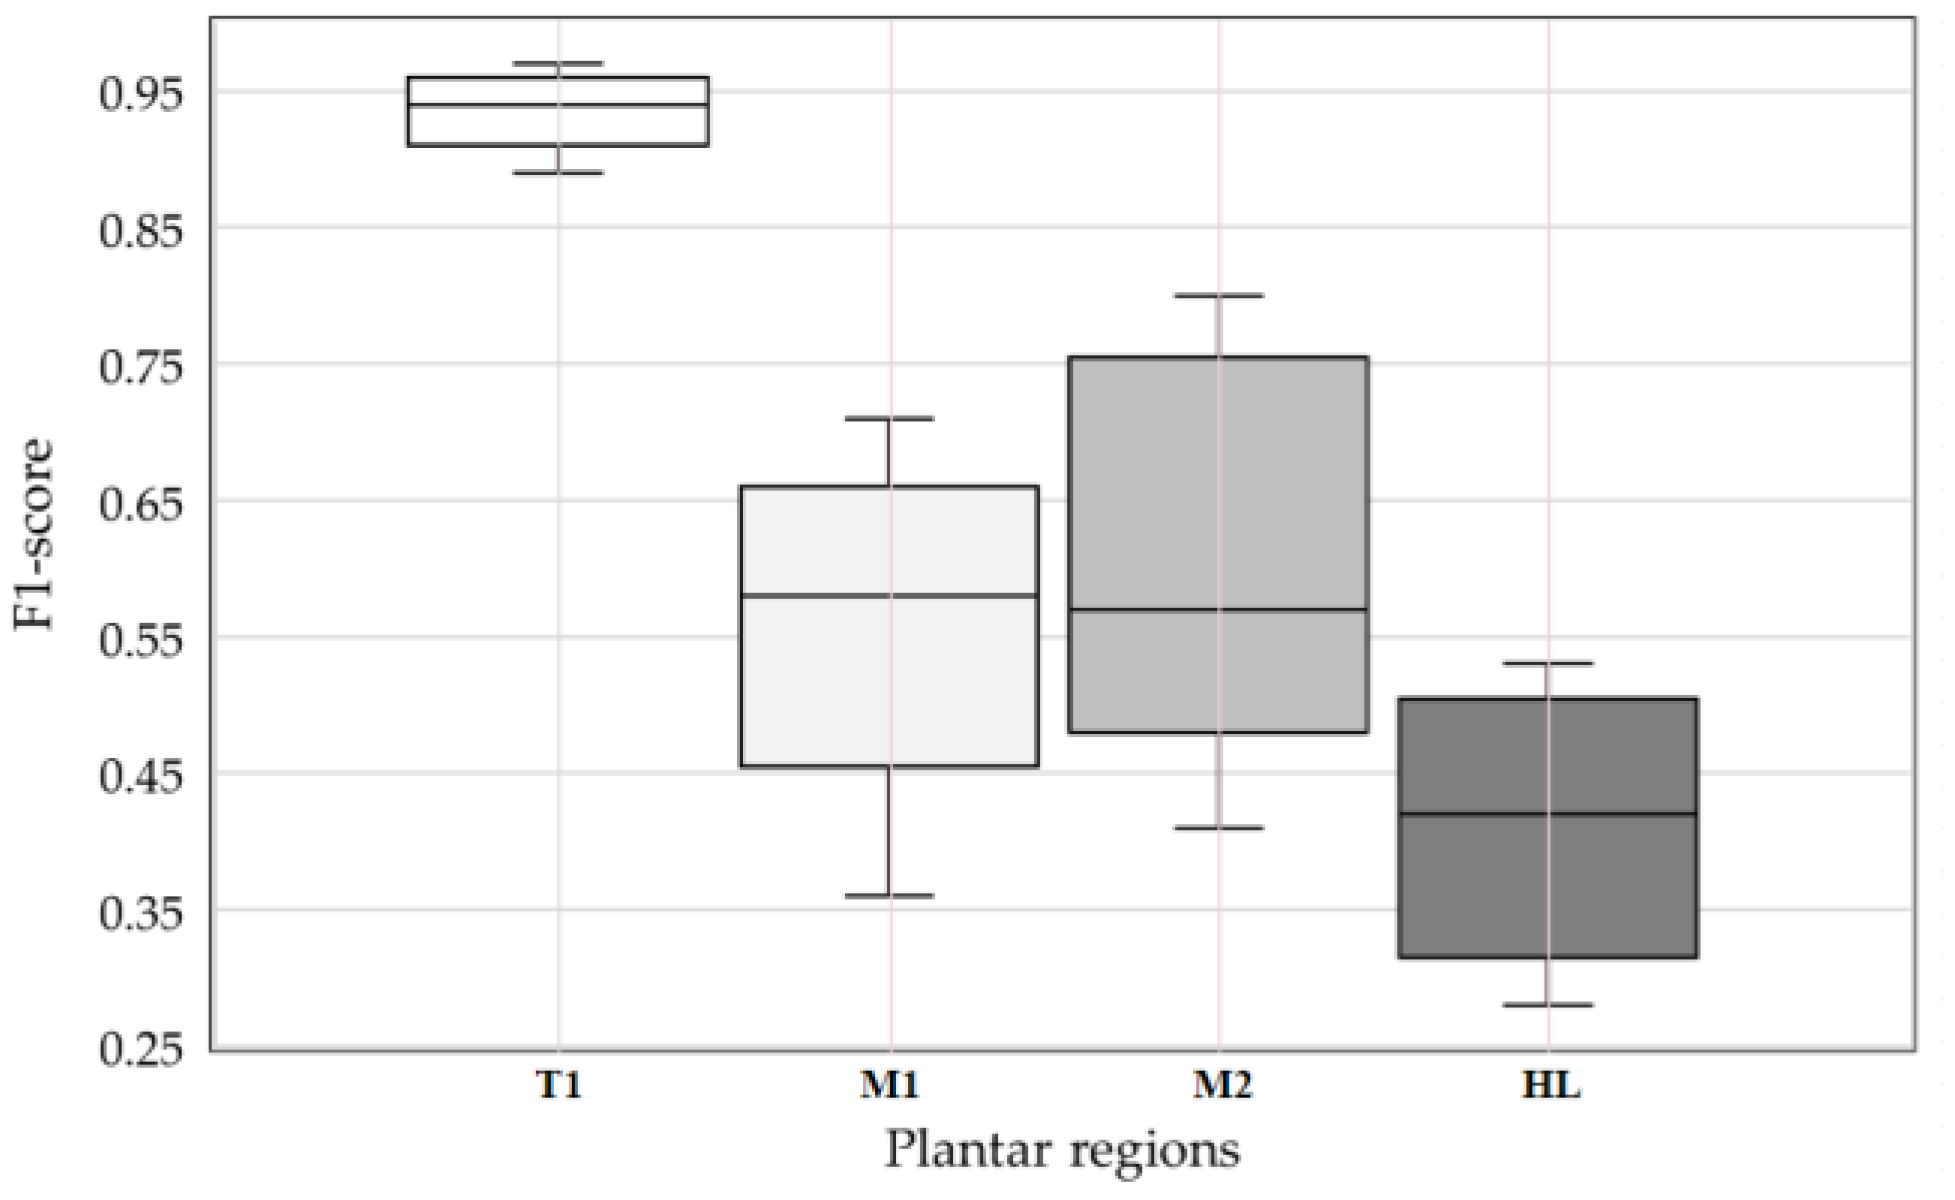
| Walking Duration | Plantar Region | F1-Score of Walking Speed | ||
|---|---|---|---|---|
| 0.8 m/s | 1.6 m/s | 2.4 m/s | ||
| 10 min | T1 | 0.91 | 0.92 | 1.00 |
| M1 | 0.36 | 0.55 | 0.71 | |
| M2 | 0.71 | 0.22 | 0.80 | |
| HL | 0.35 | 0.00 | 0.50 | |
| 20 min | T1 | 0.80 | 0.22 | 0.17 |
| M1 | 0.50 | 0.29 | 0.40 | |
| M2 | 0.67 | 0.20 | 0.18 | |
| HL | 0.50 | 0.29 | 0.22 | |
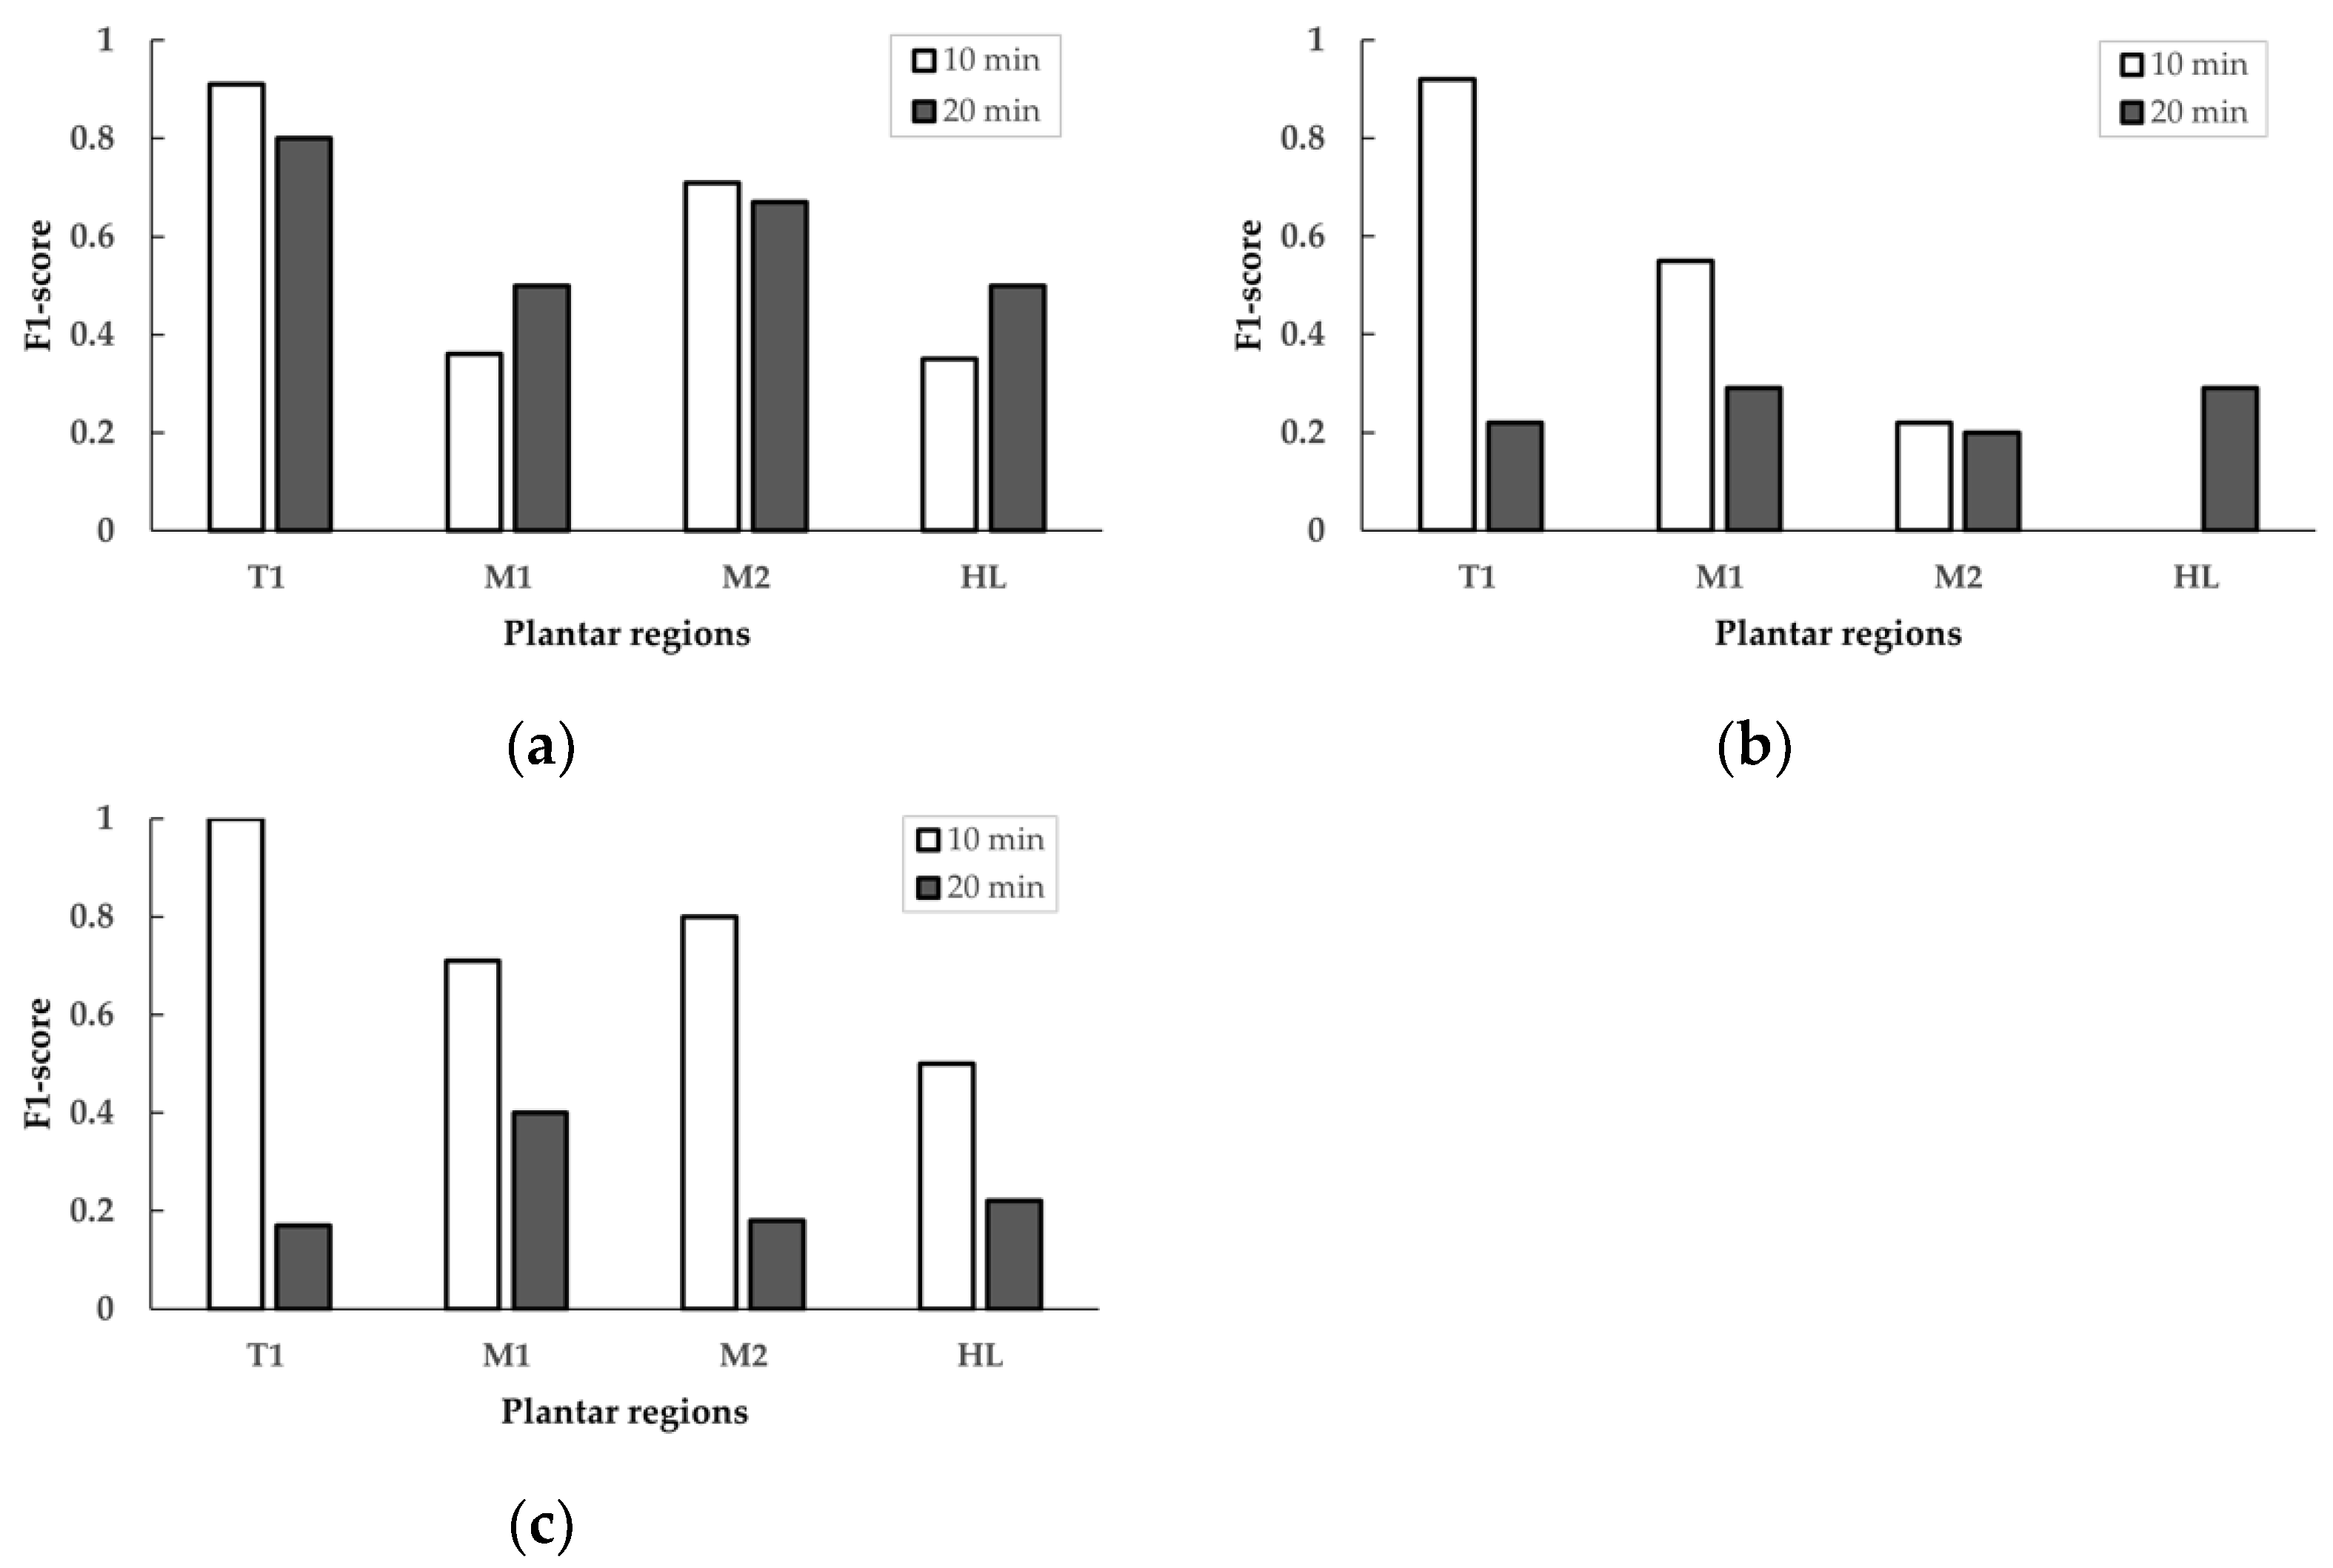
| Walking Speed | Plantar Region | F1-Score of Walking Duration | |
|---|---|---|---|
| 10 min | 20 min | ||
| 0.8 m/s | T1 | 0.91 | 0.80 |
| M1 | 0.36 | 0.50 | |
| M2 | 0.71 | 0.67 | |
| HL | 0.35 | 0.50 | |
| 1.6 m/s | T1 | 0.92 | 0.22 |
| M1 | 0.55 | 0.29 | |
| M2 | 0.22 | 0.20 | |
| HL | 0.00 | 0.29 | |
| 2.4 m/s | T1 | 1.00 | 0.17 |
| M1 | 0.71 | 0.40 | |
| M2 | 0.80 | 0.18 | |
| HL | 0.50 | 0.22 | |
| References | Study Case | Target | Method | Accuracy | F1-Score |
|---|---|---|---|---|---|
| Begg and Kamruzzaman (2006) [51] | Plantar foot data | Gait changes | ANN (3 hidden layers) | 0.83 | - |
| Joo et al. (2014) [20] 99 sensing nodes | Plantar pressure data | Gait speed | ANN (1 hidden layer) | 0.71 | - |
| Chen et al. (2021) [52] A preliminary study global pattern (660 sensing nodes) | Plantar pressure images | Walking speed | Convolutional Neural Network | - | 0.86 |
| This study region pattern (660 sensing nodes) | Plantar region pressure images | Walking speed and walking duration | ANN (2 hidden layers) | 0.94 | 0.94 |
Publisher’s Note: MDPI stays neutral with regard to jurisdictional claims in published maps and institutional affiliations. |
© 2021 by the authors. Licensee MDPI, Basel, Switzerland. This article is an open access article distributed under the terms and conditions of the Creative Commons Attribution (CC BY) license (https://creativecommons.org/licenses/by/4.0/).
Share and Cite
Chen, H.-C.; Sunardi; Liau, B.-Y.; Lin, C.-Y.; Akbari, V.B.H.; Lung, C.-W.; Jan, Y.-K. Estimation of Various Walking Intensities Based on Wearable Plantar Pressure Sensors Using Artificial Neural Networks. Sensors 2021, 21, 6513. https://doi.org/10.3390/s21196513
Chen H-C, Sunardi, Liau B-Y, Lin C-Y, Akbari VBH, Lung C-W, Jan Y-K. Estimation of Various Walking Intensities Based on Wearable Plantar Pressure Sensors Using Artificial Neural Networks. Sensors. 2021; 21(19):6513. https://doi.org/10.3390/s21196513
Chicago/Turabian StyleChen, Hsing-Chung, Sunardi, Ben-Yi Liau, Chih-Yang Lin, Veit Babak Hamun Akbari, Chi-Wen Lung, and Yih-Kuen Jan. 2021. "Estimation of Various Walking Intensities Based on Wearable Plantar Pressure Sensors Using Artificial Neural Networks" Sensors 21, no. 19: 6513. https://doi.org/10.3390/s21196513
APA StyleChen, H.-C., Sunardi, Liau, B.-Y., Lin, C.-Y., Akbari, V. B. H., Lung, C.-W., & Jan, Y.-K. (2021). Estimation of Various Walking Intensities Based on Wearable Plantar Pressure Sensors Using Artificial Neural Networks. Sensors, 21(19), 6513. https://doi.org/10.3390/s21196513