
A Comparative Study of Time Frequency Representation Techniques for Freeze of Gait Detection and Prediction


Abstract
:1. Introduction
2. Literature Review
3. Materials and Methods
3.1. Data
- 0—Not part of the experiment; user performed activities are unrelated to the experimental protocol while the sensors were installed.
- 1—Experiment; no FOG.
- 2—FOG.
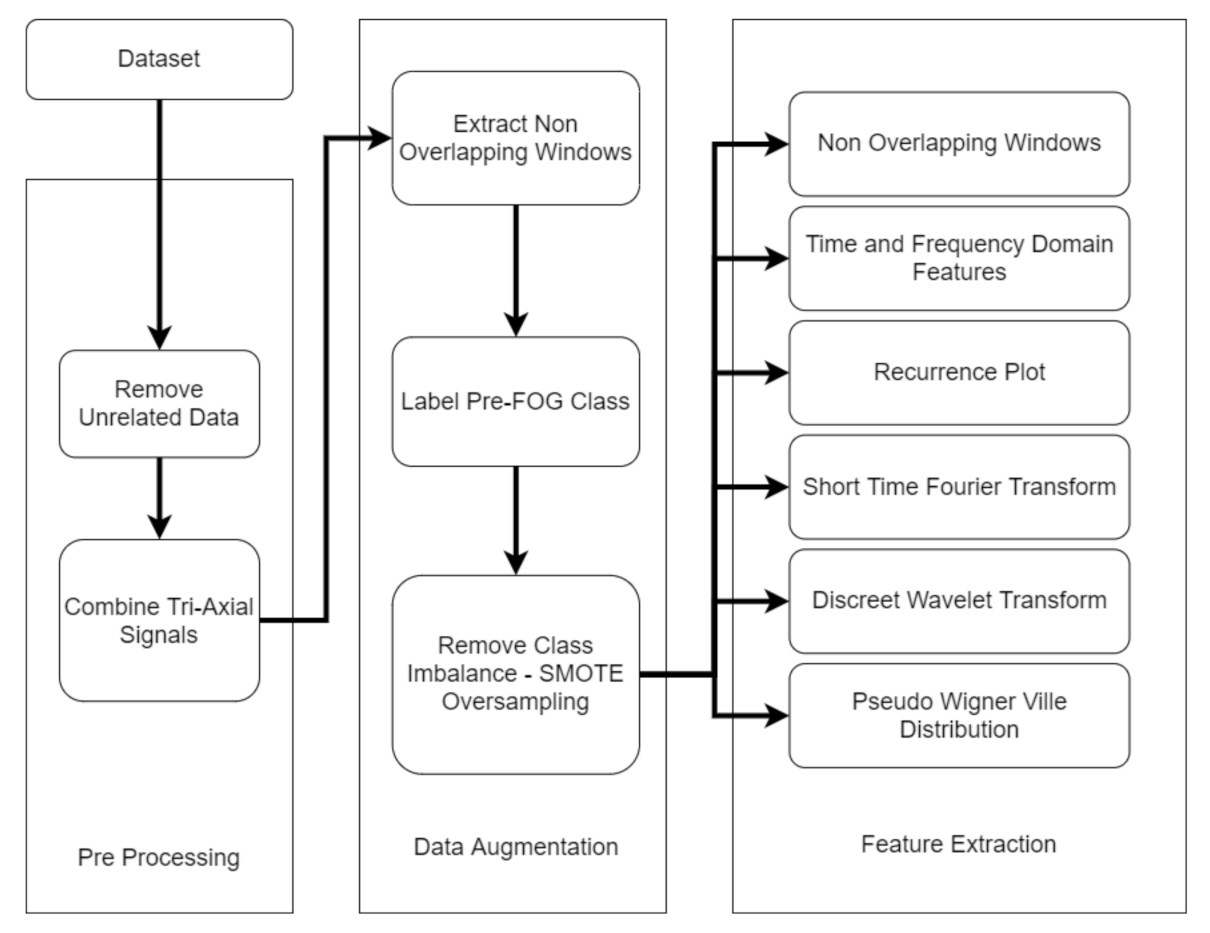
3.2. Proposed Data Preparation Method
3.3. Preprocessing
3.3.1. Removing Unrelated Data
3.3.2. Calculating Magnitude of Acceleration for all three axis
3.4. Data Augmentation
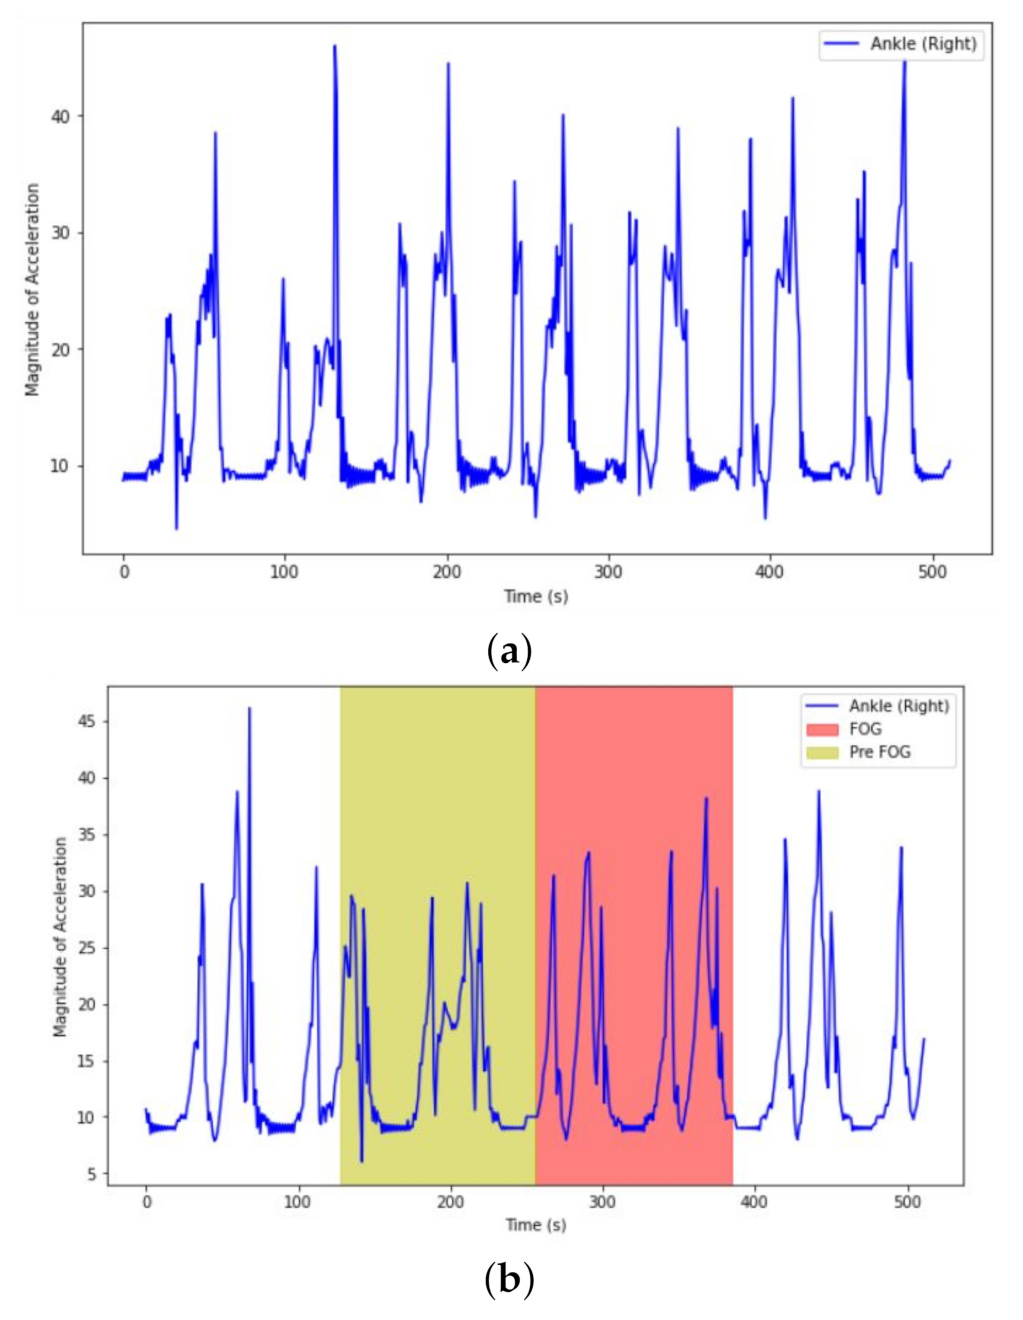
3.4.1. Signal Segmentation
3.4.2. Labeling PreFOG class
- 0—Non FOG
- 1—FOG
- 2—Pre FOG
3.4.3. SMOTE Oversampling
3.5. Feature Extraction
- = Moving window extracted from signal .
- = Manually extracted feature set from .
- = Recurrence Plot representation of .
- = Short Time Fourier Transform representation of .
- = Discrete Wavelet Transform representation of .
- = Pseudo Wigner Ville Distribution representation of .
3.5.1. Time and Frequency Domain Features
3.5.2. Recurrence Plots
3.5.3. Short Time Fourier Transform
3.5.4. Discrete Wavelet Transform
3.5.5. Pseudo Wigner Ville Distribution
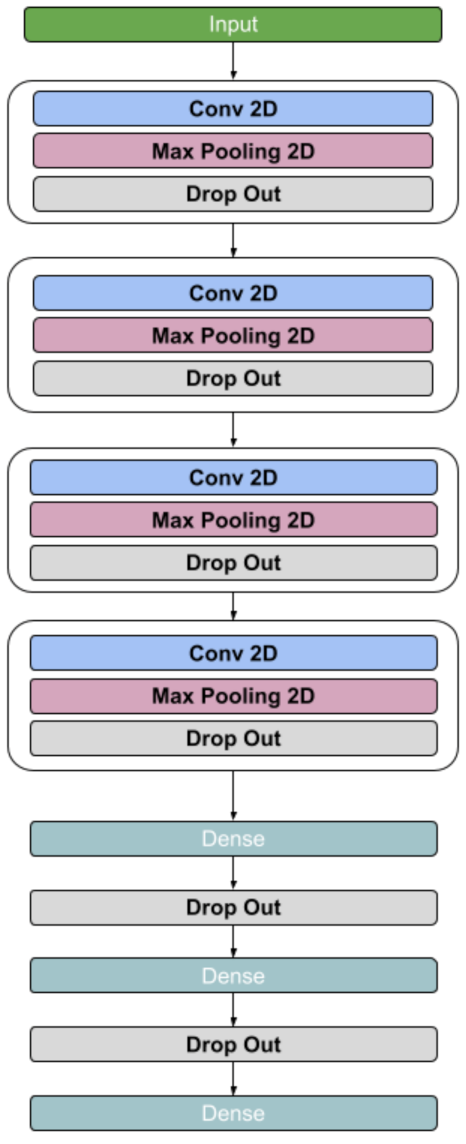
3.6. Model Structure
3.6.1. Basic Convolutional Neural Network
3.6.2. Basic Bidirectional LSTM
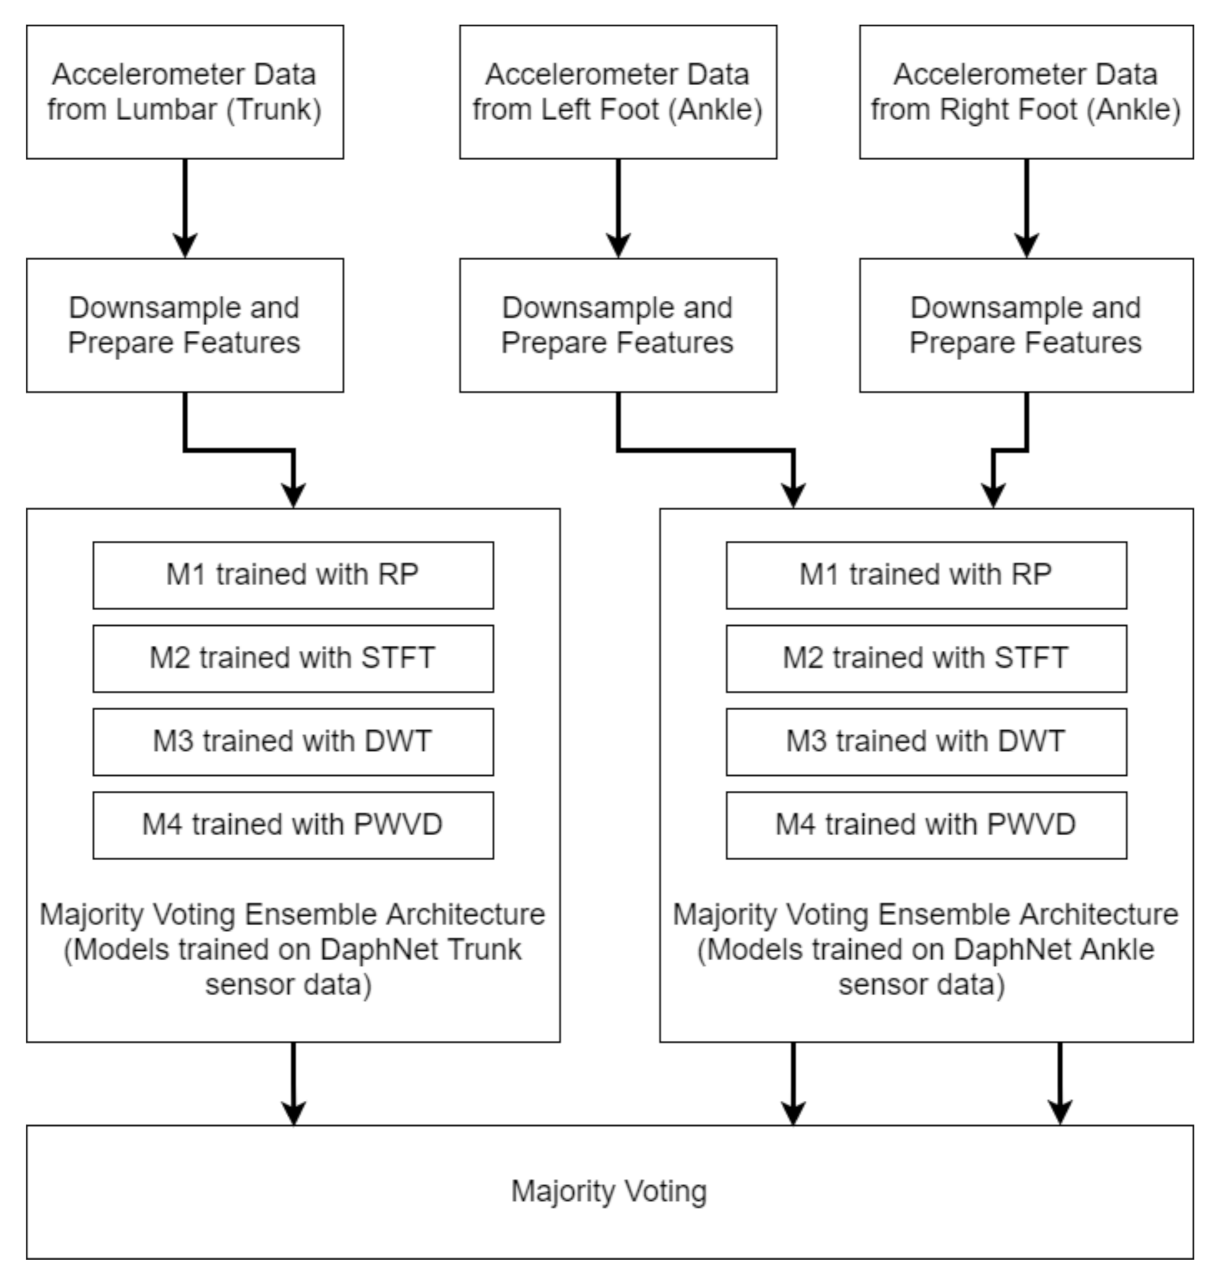
3.6.3. Ensemble Architectures
Stacked Ensemble Model—M7
Average Ensemble Model—M8
Majority Voting—M9
4. Results
4.1. Evaluation Criteria
4.1.1. Detection Accuracy
4.1.2. Precision, Recall/Sensitivity, Specificity, Score
- is the predictions for class k.
- is the occurrences for class k.
- is the predictions for samples not in class k.
- is the occurrences for samples not in class k.
- k represents a class in range , in our case .
4.1.3. Matthews Correlation Coefficient
- , the number of occurrences of class k.
- , the number of predictions for class k.
- , total correct predictions.
- , total number of samples.
4.2. K-Fold Cross Validation
4.3. Normalization
4.4. Experimental Setup
4.5. Metric Scores and Discussion
5. Application of Trained Model on Data Collected from APDM™ Sensors
5.1. Data Collection and Processing
Sensor Types and Locations
- Accelerometer.
- Magnetometer.
- Gyroscope.
- Barometer.
- Temperature.
5.2. Workflow and Challenges
6. Conclusions
Author Contributions
Funding
Institutional Review Board Statement
Informed Consent Statement
Data Availability Statement
Conflicts of Interest
Abbreviations
| FOG | Freezing of Gait |
| PD | Parkinson’s Disease |
| RAS | Rhythmic Auditory Stimulation |
| RP | Recurrence Plot |
| STFT | Short Time Fourier Transform |
| DWT | Discreet Wavelet Transform |
| PWVD | Pseudo Wigner Ville Distribution |
| DL | Deep Learning |
| ML | Machine Learning |
| LSTM | Long Short Term Memory |
| CNN | Concolutional Neural Network |
| RNN | Recurrent Neural Network |
| ADL | Activities of Daily Living |
| HAR | Human Activity Recognition |
| WB | Walking Band |
| FB | Freezing Band |
| FTH | Freezing Threshold |
| PTH | Power Threshold |
| FI | Freeze Index |
| PI | Power Index |
| RF | Random Forest |
| KNN | K Nearest Neighbours |
| AUC | Area Under Curve |
| ROC | Receiver Operating Characteristic |
| SVM | Support Vector Machine |
| LOSO | Leave One Subject Out |
| GB | Gradient Boosting |
| RBF | Radial Basis Function |
| IMU | Inertial Measurement Unit |
| SQA | Speech Quality Assesment |
| MFCC | Mel Frequency Cepstral Coefficients |
| EER | Equal Error Rate |
| FFT | Fast Fourier Transform |
| MCC | Matthews Correlation Coefficient |
| TP | True Positive |
| FP | False Positive |
| TN | True Negative |
| FN | False Negative |
| 2AFC | Two-Alternative-Forced-Choice |
| DSCQS | Double Stimulus Continuous Quality Scale |
| U-AMS | Activity Monitoring System |
| GM | Geometric Mean |
| SQA | Speech Quality Assessment |
| HMM | Hidden Markov Model |
References
- Vos, T.; Allen, C.; Arora, M.; Barber, R.M.; Bhutta, Z.A.; Brown, A.; Carter, A.; Casey, D.C.; Charlson, F.J.; Chen, A.Z.; et al. Global, regional, and national incidence, prevalence, and years lived with disability for 310 diseases and injuries, 1990–2015: A systematic analysis for the Global Burden of Disease Study 2015. Lancet 2016, 388, 1545–1602. [Google Scholar] [CrossRef] [Green Version]
- Statistics. (n.d.). Retrieved 26 September 2021. Available online: https://www.parkinson.org/Understanding-Parkinsons/Statistics (accessed on 13 August 2021).
- Reeve, A.; Simcox, E.; Turnbull, D. Ageing and Parkinson’s disease: Why is advancing age the biggest risk factor? Ageing Res. Rev. 2014, 14, 19–30. [Google Scholar] [CrossRef] [PubMed]
- Goetz, C.G. The History of Parkinson’s Disease: Early Clinical Descriptions and Neurological Therapies. Cold Spring Harb. Perspect. Med. 2011, 1, a008862. [Google Scholar] [CrossRef] [PubMed] [Green Version]
- Wirdefeldt, K.; Adami, H.O.; Cole, P.; Trichopoulos, D.; Mandel, J. Epidemiology and etiology of Parkinson’s disease: A review of the evidence. Eur. J. Epidemiol. 2011, 26, 1–58. [Google Scholar] [CrossRef] [PubMed]
- Michel, P.P.; Hirsch, E.C.; Hunot, S. Understanding Dopaminergic Cell Death Pathways in Parkinson Disease. Neuron 2016, 90, 675–691. [Google Scholar] [CrossRef] [Green Version]
- Sveinbjornsdottir, S. The clinical symptoms of Parkinson’s disease. J. Neurochem. 2016, 139, 318–324. [Google Scholar] [CrossRef] [PubMed] [Green Version]
- Cheng, H.C.; Ulane, C.M.; Burke, R.E. Clinical progression in Parkinson disease and the neurobiology of axons. Ann. Neurol. 2010, 67, 715–725. [Google Scholar] [CrossRef]
- Giladi, N.; Treves, T.A.; Simon, E.S.; Shabtai, H.; Orlov, Y.; Kandinov, B.; Paleacu, D.; Korczyn, A.D. Freezing of gait in patients with advanced Parkinson’s disease. J. Neural Transm. 2001, 108, 53–61. [Google Scholar] [CrossRef]
- Okuma, Y.; Yanagisawa, N. The clinical spectrum of freezing of gait in Parkinson’s disease. Mov. Disord. 2008, 23, S426–S430. [Google Scholar] [CrossRef]
- Schaafsma, J.D.; Balash, Y.; Gurevich, T.; Bartels, A.L.; Hausdorff, J.M.; Giladi, N. Characterization of freezing of gait subtypes and the response of each to levodopa in Parkinson’s disease. Eur. J. Neurol. 2003, 10, 391–398. [Google Scholar] [CrossRef] [Green Version]
- Ahlrichs, C.; Samá, A.; Lawo, M.; Cabestany, J.; Rodríguez-Martín, D.; Pérez-López, C.; Sweeney, D.; Quinlan, L.R.; Laighin, G.O.; Counihan, T.; et al. Detecting freezing of gait with a tri-axial accelerometer in Parkinson’s disease patients. Med Biol. Eng. Comput. 2015, 54, 223–233. [Google Scholar] [CrossRef] [Green Version]
- Kim, H.; Lee, H.J.; Lee, W.; Kwon, S.; Kim, S.K.; Jeon, H.S.; Park, H.; Shin, C.W.; Yi, W.J.; Jeon, B.S.; et al. Unconstrained detection of freezing of Gait in Parkinson’s disease patients using smartphone. In Proceedings of the 2015 37th Annual International Conference of the IEEE Engineering in Medicine and Biology Society (EMBC), Milan, Italy, 25–29 August 2015. [Google Scholar] [CrossRef]
- Latt, M.D.; Lord, S.R.; Morris, J.G.; Fung, V.S. Clinical and physiological assessments for elucidating falls risk in Parkinson’s disease. Mov. Disord. 2009, 24, 1280–1289. [Google Scholar] [CrossRef]
- Kerr, G.K.; Worringham, C.J.; Cole, M.H.; Lacherez, P.F.; Wood, J.M.; Silburn, P.A. Predictors of future falls in Parkinson disease. Neurology 2010, 75, 116–124. [Google Scholar] [CrossRef]
- Moore, O.; Peretz, C.; Giladi, N. Freezing of gait affects quality of life of peoples with Parkinson’s disease beyond its relationships with mobility and gait. Mov. Disord. 2007, 22, 2192–2195. [Google Scholar] [CrossRef]
- Okuma, Y. Freezing of Gait and Falls in Parkinson’s Disease. J. Park. Dis. 2014, 4, 255–260. [Google Scholar] [CrossRef]
- Giladi, N.; Shabtai, H.; Simon, E.; Biran, S.; Tal, J.; Korczyn, A. Construction of freezing of gait questionnaire for patients with Parkinsonism. Park. Relat. Disord. 2000, 6, 165–170. [Google Scholar] [CrossRef]
- Giladi, N.; Tal, J.; Azulay, T.; Rascol, O.; Brooks, D.J.; Melamed, E.; Oertel, W.; Poewe, W.H.; Stocchi, F.; Tolosa, E.; et al. Validation of the freezing of gait questionnaire in patients with Parkinson’s disease. Mov. Disord. 2009, 24, 655–661. [Google Scholar] [CrossRef]
- Nieuwboer, A.; Rochester, L.; Herman, T.; Vandenberghe, W.; Emil, G.E.; Thomaes, T.; Giladi, N. Reliability of the new freezing of gait questionnaire: Agreement between patients with Parkinson’s disease and their carers. Gait Posture 2009, 30, 459–463. [Google Scholar] [CrossRef] [PubMed]
- Nieuwboer, A.; Weerdt, W.D.; Dom, R.; Lesaffre, E. A frequency and correlation analysis of motor deficits in Parkinson patients. Disabil. Rehabil. 1998, 20, 142–150. [Google Scholar] [CrossRef] [PubMed]
- Sazonov, E. Wearable Sensors: Fundamentals, Implementation and Applications; Academic Press: Cambridge, MA, USA; Elsevier: Amsterdam, The Netherlands, 2021. [Google Scholar]
- Hassan, M.M.; Huda, S.; Uddin, M.Z.; Almogren, A.; Alrubaian, M. Human Activity Recognition from Body Sensor Data using Deep Learning. J. Med. Syst. 2018, 42, 99. [Google Scholar] [CrossRef]
- Nweke, H.F.; Teh, Y.W.; Al-garadi, M.A.; Alo, U.R. Deep learning algorithms for human activity recognition using mobile and wearable sensor networks: State of the art and research challenges. Expert Syst. Appl. 2018, 105, 233–261. [Google Scholar] [CrossRef]
- Wang, J.; Chen, Y.; Hao, S.; Peng, X.; Hu, L. Deep learning for sensor-based activity recognition: A survey. Pattern Recognit. Lett. 2019, 119, 3–11. [Google Scholar] [CrossRef] [Green Version]
- Ordóñez, F.; Roggen, D. Deep Convolutional and LSTM Recurrent Neural Networks for Multimodal Wearable Activity Recognition. Sensors 2016, 16, 115. [Google Scholar] [CrossRef] [Green Version]
- Lara, O.D.; Labrador, M.A. A Survey on Human Activity Recognition using Wearable Sensors. IEEE Commun. Surv. Tutor. 2013, 15, 1192–1209. [Google Scholar] [CrossRef]
- Bachlin, M.; Plotnik, M.; Roggen, D.; Maidan, I.; Hausdorff, J.M.; Giladi, N.; Troster, G. Wearable Assistant for Parkinson’s Disease Patients With the Freezing of Gait Symptom. IEEE Trans. Inf. Technol. Biomed. 2010, 14, 436–446. [Google Scholar] [CrossRef]
- Jovanov, E.; Wang, E.; Verhagen, L.; Fredrickson, M.; Fratangelo, R. A real time system for detection and unfreezing of gait of Parkinson’s patients. In Proceedings of the 2009 Annual International Conference of the IEEE Engineering in Medicine and Biology Society, Minneapolis, MN, USA, 3–6 September 2009. [Google Scholar] [CrossRef] [Green Version]
- Kubota, K.J.; Chen, J.A.; Little, M.A. Machine learning for large-scale wearable sensor data in Parkinson’s disease: Concepts, promises, pitfalls, and futures. Mov. Disord. 2016, 31, 1314–1326. [Google Scholar] [CrossRef]
- Matias, R.; Paixão, V.; Bouça, R.; Ferreira, J.J. A Perspective on Wearable Sensor Measurements and Data Science for Parkinson’s Disease. Front. Neurol. 2017, 8, 677. [Google Scholar] [CrossRef] [Green Version]
- Sánchez-Ferro, A.; Elshehabi, M.; Godinho, C.; Salkovic, D.; Hobert, M.A.; Domingos, J.; van Uem, M.; Ferreira, J.J.; Maetzler, W. New methods for the assessment of Parkinson’s disease (2005 to 2015): A systematic review. Mov. Disord. 2016, 31, 1283–1292. [Google Scholar] [CrossRef]
- Maetzler, W.; Domingos, J.; Srulijes, K.; Ferreira, J.J.; Bloem, B.R. Quantitative wearable sensors for objective assessment of Parkinson’s disease. Mov. Disord. 2013, 28, 1628–1637. [Google Scholar] [CrossRef]
- Hashimoto, T. Speculation on the responsible sites and pathophysiology of freezing of gait. Park. Relat. Disord. 2006, 12, S55–S62. [Google Scholar] [CrossRef]
- Arias, P.; Cudeiro, J. Effect of Rhythmic Auditory Stimulation on Gait in Parkinsonian Patients with and without Freezing of Gait. PLoS ONE 2010, 5, e9675. [Google Scholar] [CrossRef] [PubMed] [Green Version]
- Rocha, P.A.; Porfírio, G.M.; Ferraz, H.B.; Trevisani, V.F. Effects of external cues on gait parameters of Parkinson’s disease patients: A systematic review. Clin. Neurol. Neurosurg. 2014, 124, 127–134. [Google Scholar] [CrossRef]
- Lim, I.; van Wegen, E.; de Goede, C.; Deutekom, M.; Nieuwboer, A.; Willems, A.; Jones, D.; Rochester, L.; Kwakkel, G. Effects of external rhythmical cueing on gait in patients with Parkinson’s disease: A systematic review. Clin. Rehabil. 2005, 19, 695–713. [Google Scholar] [CrossRef]
- LeCun, Y.; Bengio, Y. Convolutional Networks for Images, Speech, and Time Series. In The Handbook of Brain Theory and Neural Networks; MIT Press: Cambridge, MA, USA, 1998; pp. 255–258. [Google Scholar]
- Pascanu, R.; Gulcehre, C.; Cho, K.; Bengio, Y. How to Construct Deep Recurrent Neural Networks. arXiv 2014, arXiv:1312.6026. [Google Scholar]
- Karim, F.; Majumdar, S.; Darabi, H.; Chen, S. LSTM Fully Convolutional Networks for Time Series Classification. IEEE Access 2018, 6, 1662–1669. [Google Scholar] [CrossRef]
- Hochreiter, S.; Schmidhuber, J. Long Short-Term Memory. Neural Comput. 1997, 9, 1735–1780. [Google Scholar] [CrossRef]
- Sollich, P.; Krogh, A. Learning with ensembles: How overfitting can be useful. In Proceedings of the 1995 Conference, Denver, CO, USA, 27–30 November 1995; Volume 8, pp. 190–196. [Google Scholar]
- Hansen, L.; Salamon, P. Neural network ensembles. IEEE Trans. Pattern Anal. Mach. Intell. 1990, 12, 993–1001. [Google Scholar] [CrossRef] [Green Version]
- Mostafa, T.A.; Cheng, I. Parkinson’s Disease Detection with Ensemble Architectures based on ILSVRC Models. arXiv 2020, arXiv:2007.12496. [Google Scholar]
- Ashfaque Mostafa, T.; Cheng, I. Parkinson’s Disease Detection Using Ensemble Architecture from MR Images*. In Proceedings of the 2020 IEEE 20th International Conference on Bioinformatics and Bioengineering (BIBE), Cincinnati, OH, USA, 26–28 October 2020. [Google Scholar] [CrossRef]
- Camps, J.; Samà, A.; Martín, M.; Rodríguez-Martín, D.; Pérez-López, C.; Alcaine, S.; Mestre, B.; Prats, A.; Crespo, M.C.; Cabestany, J.; et al. Advances in Computational Intelligence; Rojas, I., Joya, G., Catala, A., Eds.; Springer International Publishing: Cham, Switzerland, 2017; pp. 344–355. [Google Scholar]
- Soltaninejad, S.; Cheng, I.; Basu, A. Kin-FOG: Automatic Simulated Freezing of Gait (FOG) Assessment System for Parkinson’s Disease. Sensors 2019, 19, 2416. [Google Scholar] [CrossRef] [Green Version]
- Han, J.H.; Lee, W.J.; Ahn, T.B.; Jeon, B.S.; Park, K.S. Gait analysis for freezing detection in patients with movement disorder using three dimensional acceleration system. In Proceedings of the 25th Annual International Conference of the IEEE Engineering in Medicine and Biology Society (IEEE Cat. No.03CH37439), Cancun, Mexico, 17–21 September 2003; IEEE: Piscataway, NJ, USA, 2003. [Google Scholar] [CrossRef]
- Moore, S.T.; MacDougall, H.G.; Ondo, W.G. Ambulatory monitoring of freezing of gait in Parkinson’s disease. J. Neurosci. Methods 2008, 167, 340–348. [Google Scholar] [CrossRef] [PubMed]
- Mazilu, S.; Hardegger, M.; Zhu, Z.; Roggen, D.; Troester, G.; Plotnik, M.; Hausdorff, J. Online Detection of Freezing of Gait with Smartphones and Machine Learning Techniques. In Proceedings of the 6th International Conference on Pervasive Computing Technologies for Healthcare, San Diego, CA, USA, 21–24 May 2012; IEEE: Piscataway, NJ, USA, 2012. [Google Scholar] [CrossRef]
- Tripoliti, E.E.; Tzallas, A.T.; Tsipouras, M.G.; Rigas, G.; Bougia, P.; Leontiou, M.; Konitsiotis, S.; Chondrogiorgi, M.; Tsouli, S.; Fotiadis, D.I. Automatic detection of freezing of gait events in patients with Parkinson’s disease. Comput. Methods Programs Biomed. 2013, 110, 12–26. [Google Scholar] [CrossRef]
- Moore, S.T.; Yungher, D.A.; Morris, T.R.; Dilda, V.; MacDougall, H.G.; Shine, J.M.; Naismith, S.L.; Lewis, S.J. Autonomous identification of freezing of gait in Parkinson’s disease from lower-body segmental accelerometry. J. NeuroEng. Rehabil. 2013, 10, 19. [Google Scholar] [CrossRef] [Green Version]
- Zach, H.; Janssen, A.M.; Snijders, A.H.; Delval, A.; Ferraye, M.U.; Auff, E.; Weerdesteyn, V.; Bloem, B.R.; Nonnekes, J. Identifying freezing of gait in Parkinson’s disease during freezing provoking tasks using waist-mounted accelerometry. Park. Relat. Disord. 2015, 21, 1362–1366. [Google Scholar] [CrossRef]
- Rodríguez-Martín, D.; Samà, A.; Pérez-López, C.; Català, A.; Arostegui, J.M.M.; Cabestany, J.; Bayés, À.; Alcaine, S.; Mestre, B.; Prats, A.; et al. Home detection of freezing of gait using support vector machines through a single waist-worn triaxial accelerometer. PLoS ONE 2017, 12, e0171764. [Google Scholar] [CrossRef]
- Samà, A.; Rodríguez-Martín, D.; Pérez-López, C.; Català, A.; Alcaine, S.; Mestre, B.; Prats, A.; Crespo, M.C.; Bayés, À. Determining the optimal features in freezing of gait detection through a single waist accelerometer in home environments. Pattern Recognit. Lett. 2018, 105, 135–143. [Google Scholar] [CrossRef]
- Orphanidou, N.K.; Hussain, A.; Keight, R.; Lishoa, P.; Hind, J.; Al-Askar, H. Predicting Freezing of Gait in Parkinsons Disease Patients Using Machine Learning. In Proceedings of the 2018 IEEE Congress on Evolutionary Computation (CEC), Rio de Janeiro, Brazil, 8–13 July 2018; IEEE: Piscataway, NJ, USA, 2018. [Google Scholar] [CrossRef]
- Camps, J.; Samà, A.; Martín, M.; Rodríguez-Martín, D.; Pérez-López, C.; Arostegui, J.M.M.; Cabestany, J.; Català, A.; Alcaine, S.; Mestre, B.; et al. Deep learning for freezing of gait detection in Parkinson’s disease patients in their homes using a waist-worn inertial measurement unit. Knowl.-Based Syst. 2018, 139, 119–131. [Google Scholar] [CrossRef]
- San-Segundo, R.; Navarro-Hellín, H.; Torres-Sánchez, R.; Hodgins, J.; De la Torre, F. Increasing Robustness in the Detection of Freezing of Gait in Parkinson’s Disease. Electronics 2019, 8, 119. [Google Scholar] [CrossRef] [Green Version]
- San-Segundo, R.; Montero, J.M.; Barra-Chicote, R.; Fernández, F.; Pardo, J.M. Feature extraction from smartphone inertial signals for human activity segmentation. Signal Process. 2016, 120, 359–372. [Google Scholar] [CrossRef]
- Sigcha, L.; Costa, N.; Pavón, I.; Costa, S.; Arezes, P.; López, J.M.; Arcas, G.D. Deep Learning Approaches for Detecting Freezing of Gait in Parkinson’s Disease Patients through On-Body Acceleration Sensors. Sensors 2020, 20, 1895. [Google Scholar] [CrossRef] [Green Version]
- Hoehn, M.; Yahr, M. Parkinsonism: Onset, progression, and mortality. Neurology 1967, 77, 874. [Google Scholar] [CrossRef] [Green Version]
- Mazilu, S.; Calatroni, A.; Gazit, E.; Roggen, D.; Hausdorff, J.M.; Tröster, G. Feature Learning for Detection and Prediction of Freezing of Gait in Parkinson’s Disease. In Machine Learning and Data Mining in Pattern Recognition; Springer: Berlin/Heidelberg, Germany, 2013; pp. 144–158. [Google Scholar] [CrossRef]
- Chawla, N.V.; Bowyer, K.W.; Hall, L.O.; Kegelmeyer, W.P. SMOTE: Synthetic Minority Over-sampling Technique. J. Artif. Intell. Res. 2002, 16, 321–357. [Google Scholar] [CrossRef]
- Gokul, H.; Suresh, P.; Hari Vignesh, B.; Pravin Kumaar, R.; Vijayaraghavan, V. Gait Recovery System for Parkinson’s Disease using Machine Learning on Embedded Platforms. In Proceedings of the 2020 IEEE International Systems Conference (SysCon), Montreal, QC, Canada, 24 August–20 September 2020. [Google Scholar] [CrossRef]
- Eckmann, J.P.; Kamphorst, S.O.; Ruelle, D. Recurrence Plots of Dynamical Systems. Europhys. Lett. (EPL) 1987, 4, 973–977. [Google Scholar] [CrossRef] [Green Version]
- Recurrence Plot. 12 August 2021. Available online: https://en.wikipedia.org/wiki/Recurrence_plot (accessed on 13 August 2021).
- Rajoub, B. Characterization of biomedical signals: Feature engineering and extraction. In Biomedical Signal Processing and Artificial Intelligence in Healthcare; Academic Press: Cambridge, MA, USA, 2020; pp. 29–50. [Google Scholar] [CrossRef]
- Hosseinzadeh, M. Robust control applications in biomedical engineering: Control of depth of hypnosis. In Control Applications for Biomedical Engineering Systems; Academic Press: Cambridge, MA, USA, 2020; pp. 89–125. [Google Scholar] [CrossRef]
- Haar, A. Zur Theorie der orthogonalen Funktionensysteme. Math. Ann. 1911, 71, 38–53. [Google Scholar] [CrossRef]
- Shin, Y.S.; Jeon, J.J. Pseudo Wigner–Ville Time-Frequency Distribution and Its Application to Machinery Condition Monitoring. Shock Vib. 1993, 1, 65–76. [Google Scholar] [CrossRef]
- Zhou, Z.H.; Wu, J.; Tang, W. Corrigendum to “Ensembling neural networks: Many could be better than all” [Artificial Intelligence 137 (1–2) (2002) 239–263]. Artif. Intell. 2010, 174, 1570. [Google Scholar] [CrossRef] [Green Version]
- Matthews, B. Comparison of the predicted and observed secondary structure of T4 phage lysozyme. Biochim. Biophys. Acta (BBA)-Protein Struct. 1975, 405, 442–451. [Google Scholar] [CrossRef]
- Gorodkin, J. Comparing two K-category assignments by a K-category correlation coefficient. Comput. Biol. Chem. 2004, 28, 367–374. [Google Scholar] [CrossRef]
- Metrics and Scoring: Quantifying the Quality of Predictions. (n.d.). Available online: https://scikit-learn.org/stable/modules/model_evaluation.html (accessed on 13 August 2021).
- Steffen, T.; Seney, M. Test-Retest reliability and minimal detectable change on balance AND Ambulation tests, the 36-ITEM Short-Form Health survey, and the unified Parkinson Disease rating scale in people with parkinsonism. Phys. Ther. 2008, 88, 733–746. [Google Scholar] [CrossRef] [PubMed]


| Authors | Technology Used |
|---|---|
| Han et al. [48] | U-AMS (Activity Monitoring System) using wavelet power features for discrimination of abnormal movement. |
| Moore et al. [49] | Threshold based method for FOG detection by defining the Freeze Index (FI), achieving True Positive Rate |
| Bachlin et al. [28] | Added Power Index (PI) to the method proposed by Moore et al. [49] |
| Bachlin et al. [28] | Two thresholds (FTH and PTH) given and , achieving sensitivity and specificity |
| Mazilu et al. [50] | Additional Features along with Bachlin et al. [28] features used with ML models RF, Naive Bayes and KNN, achieving sensitivity and specificity |
| Tripoliti et al. [51] | Data imputation (interpolation), band-pass filtering, entropy calculation, and automatic classification (Naïve Bayes, RF, Decision Trees and Random Tree), resulting in sensitivity, specificity, accuracy and AUC |
| Moore et al. [52] | Assessed seven sensors placed in different locations and concluded that the shank and back were the most convenient places for the sensors. Using all the seven sensors achieved best performance with sensitivity and specificity |
| Zack et al. [53] | presented a threshold based FOG detection technique following Moore [52] using ROC to determine a global FI threshold to distinguish between FOG and non-FOG episodes for different tasks, achieving sensitivity of and specificity of |
| Rodríguez et al. [54] | used ML techniques and 55 FOG related features from 21 PD patients with SVM. reporting a sensitivity of and specificity of for user independent evaluation, and a sensitivity of and specificity of for LOSO evaluation |
| Sama et al. [55] | Decreased the number of features to 28 for the Rodríguez et al. [54] dataset and used 8 different classifiers with greedy subset selection process, 10-fold cross-validation and different window sizes, achieving and for sensitivity and specificity respectively |
| Orphanidou et al. [56] | Extracted features and presented to 7 machine learning classifiers, with SVM achieving the highest performance. The classification algorithm was applied to 5 s windows using 18 features, obtaining balanced accuracy (the mean value of sensitivity and specificity) of , , and over the Walk, FOG and Transition classes, respectively |
| Orphanidou et al. [56] | Focused on the early detection, through classification of the transition class using varying size time windows and time/frequency contrary to the majority of previous studies that recognized FOG only when it had occurred by including another class label called ‘transition’ that showed the episodes before FOG occurrence. 5 classifiers were used, including Gradient Boosting (GB), Extreme Gradient Boosting, SVM, RF and Neural Networks. SVM with RBF kernels has the best performance with sensitivity of , , and specificity values of , and , for FOG, transition and normal activity classes, respectively |
| Camps et al. [57] | Proposed 1D Convolutions Neural Network (CNN) with 8 layers, trained using a novel spectral data representation strategy that considers information from both the previous and current signal windows showing a performance of for the GM, an AUC of , a sensitivity of and a sensibility of |
| San-Segundo et al. [58] | Evaluated the robustness of different feature sets and ML algorithms for FOG detection using body-worn accelerometers with 4 feature sets: (Mazilu et al. [50], HAR, MFCCs, and SQA) using 4 classification methods (RF, multi-layer perceptron, HMM and deep neural networks).The current window and three previous windows, with the feature set composed of Mazilu features [50] and MFCCs [59] achieved best scores. Deep convolutions neural network achieved an AUC of and an Equal Error Rate (EER) of . |
| Sigcha et al. [60] | Reproduced Mazilu features [50], MFCCs [59], and FFT) to establish a baseline using RF classifier with 10-fold cross-validation (R10fold) and LOSO. Further, tested multiple DL approaches include: A denoiser autoencoder, a deep neural network with CNN and a combination of CNN and LSTM layers and compared with shallow algorithms such as one-class SVM (OC-SVM), SVM, AdaBoost and RF, achieving AUC |
| Our Proposed Method | Using all three sensors from Daphnet [28] dataset, used moving windows extracted from the original signal, handcrafted feature set and time frequency visualization techniques including RP, STFT, DWT and PWVD alongside a CNN and LSTM architecture. Evaluated the performance and used trained models to create 3 ensemble architectures which further improve the performance. The proposed method is capable of both FOG detection and prediction and the evaluation scores show better performance when compared to existing approaches. |
| Time Domain Features | Description |
|---|---|
| Min, Max | Minimum and Maximum value of the signal |
| Range | Difference between the minimum and maximum value of the signal |
| Mean | Average value of signal |
| Median | Median value of the signal |
| Mode | Modal value of the signal |
| Trimmed Mean | Trimmed/Truncated mean of the signal |
| Standard Deviation | Deviation of a signal compared to its mean |
| Variance | Square root of the standard deviation of the signal |
| Root mean square | Square root of the mean of the squared signal |
| Mean absolute value | Mean of absolute value of the signal |
| Median absolute deviation | Median over the absolute deviations from the median |
| 25th Percentile | 25th percentile value of the signal |
| 75th Percentile | 75th percentile value of the signal |
| Interquantile range | Difference between the 75th and 25th percentile of the signal |
| Normalized Signal Magnitude Area | Sum of standardized acceleration magnitude normalized by window length |
| Skewness | The degree of asymmetry in the signal |
| Kurtosis | The degree of peakedness in the signal, signals with high kurtosis have more outliers |
| Mean Crossing Rate | The number of times the signals goes from above average value to below average value normalized by the window length |
| Signal Vector Magnitude | Sum of euclidean norm over the window normalized by window length |
| Peak of Fourier Transform | Maximum magnitude of Discrete Fourier Transform of the signal normalized by the window length |
| Frequency Domain Features | Description |
| Entropy | Measure of random distribution of frequency |
| Energy | Sum of squared magnitude of FFT of the signal divided by window length |
| Peak Frequency | Maximum frequency value in the power spectrum |
| Freeze Band Power | The sum of power in Freeze band of frequencies divided by sampling frequency |
| Locomotion Band Power | The sum of power in Locomotion band of frequencies divided by sampling frequency |
| Freeze Index | Power of signal in freeze band (3-8Hz) divided by its Power in locomotion band(0.5-3Hz) |
| Band Power | Sum of the power in freeze band and in locomotion band |
| Model | Window (s) | Sensitivity | Specificity | Score |
|---|---|---|---|---|
| Mazilu et al. [62] (Unsupervised—20 Features) | 3 | 76.86 | 86.21 | 81.56 |
| Mazilu et al. [62] (Supervised—20 Features) | 3 | 66.65 | 88.74 | 78.27 |
| Mazilu et al. [62] (Unsupervised—25 Features) | 3 | 76.86 | 85.52 | 80.82 |
| Mazilu et al. [62] (Supervised—25 Features) | 3 | 67.58 | 88.52 | 78.65 |
| Decision Tree [64] | 4 | 96.70 | 98.92 | - |
| Random Forest [64] | 4 | 98.91 | 99.44 | - |
| AdaBoost [64] | 4 | 97.99 | 99.56 | - |
| KNN [64] | 4 | 94.61 | 97.38 | - |
| SVM [64] | 4 | 97.54 | 98.64 | - |
| ProtoNN [64] | 4 | 95.25 | 99.66 | - |
| Bonsai [64] | 4 | 92.9 | 98.36 | - |
| Data Type | Window (s) | Accuracy | Precision | Sensitivity | Specificity | Score | MCC | Runtime (min) |
|---|---|---|---|---|---|---|---|---|
(3) | 2 | 0.894 ± 0.021 | 0.929 ± 0.006 | 0.894 ± 0.021 | 0.933 ± 0.007 | 0.904 ± 0.016 | 0.687 ± 0.039 | 52.05 |
| 3 | 0.832 ± 0.023 | 0.905 ± 0.011 | 0.832 ± 0.023 | 0.926 ± 0.010 | 0.849 ± 0.021 | 0.648 ± 0.035 | 17:41 | |
| 4 | 0.864 ± 0.030 | 0.901 ± 0.020 | 0.864 ± 0.030 | 0.925 ± 0.020 | 0.873 ± 0.027 | 0.695 ± 0.058 | 11:52 | |
(3) | 2 | 0.891 ± 0.019 | 0.929 ± 0.008 | 0.891 ± 0.019 | 0.937 ± 0.008 | 0.902 ± 0.016 | 0.684 ± 0.037 | 57:31 |
| 3 | 0.873 ± 0.005 | 0.915 ± 0.006 | 0.873 ± 0.005 | 0.937 ± 0.006 | 0.883 ± 0.005 | 0.702 ± 0.014 | 22:41 | |
| 4 | 0.840 ± 0.022 | 0.895 ± 0.013 | 0.840 ± 0.022 | 0.930 ± 0.014 | 0.853 ± 0.020 | 0.664 ± 0.037 | 9:25 | |
(3) | 2 | 0.926 ± 0.013 | 0.942 ± 0.007 | 0.926 ± 0.013 | 0.944 ± 0.009 | 0.930 ± 0.011 | 0.755 ± 0.033 | 64:58 |
| 3 | 0.876 ± 0.021 | 0.921 ± 0.008 | 0.876 ± 0.021 | 0.924 ± 0.008 | 0.889 ± 0.017 | 0.649 ± 0.038 | 15:24 | |
| 4 | 0.849 ± 0.000 | 0.911 ± 0.000 | 0.849 ± 0.000 | 0.934 ± 0.000 | 0.863 ± 0.000 | 0.667 ± 0.000 | 9:59 |
| Data Type | Window (s) | Accuracy | Precision | Sensitivity | Specificity | Score | MCC | Runtime (min) |
|---|---|---|---|---|---|---|---|---|
(3) | 2 | 0.678 ± 0.016 | 0.893 ± 0.008 | 0.678 ± 0.0176 | 0.860 ± 0.007 | 0.742 ± 0.011 | 0.407 ± 0.014 | 68.11 |
| 3 | 0.799 ± 0.030 | 0.883 ± 0.010 | 0.799 ± 0.030 | 0.897 ± 0.012 | 0.819 ± 0.026 | 0.585 ± 0.038 | 18:41 | |
| 4 | 0.781 ± 0.030 | 0.877 ± 0.005 | 0.781 ± 0.030 | 0.905 ± 0.010 | 0.803 ± 0.025 | 0.588 ± 0.026 | 11:22 | |
(3) | 2 | 0.719 ± 0.023 | 0.889 ± 0.009 | 0.719 ± 0.023 | 0.864 ± 0.017 | 0.762 ± 0.019 | 0.452 ± 0.035 | 127:59 |
| 3 | 0.815 ± 0.025 | 0.902 ± 0.006 | 0.815 ± 0.025 | 0.921 ± 0.008 | 0.834 ± 0.021 | 0.633 ± 0.030 | 21:02 | |
| 4 | 0.746 ± 0.036 | 0.865 ± 0.010 | 0.746 ± 0.036 | 0.894 ± 0.013 | 0.770 ± 0.031 | 0.550 ± 0.032 | 8:55 | |
(3) | 2 | 0.781 ± 0.010 | 0.899 ± 0.002 | 0.781 ± 0.010 | 0.894 ± 0.003 | 0.813 ± 0.008 | 0.516 ± 0.008 | 57:19 |
| 3 | 0.831 ± 0.037 | 0.911 ± 0.013 | 0.831 ± 0.037 | 0.914 ± 0.019 | 0.854 ± 0.030 | 0.586 ± 0.060 | 14:36 | |
| 4 | 0.816 ± 0.005 | 0.905 ± 0.004 | 0.816 ± 0.005 | 0.927 ± 0.003 | 0.836 ± 0.004 | 0.629 ± 0.004 | 8:19 |
| Data Type | Window (s) | Accuracy | Precision | Sensitivity | Specificity | Score | MCC | Runtime (min) |
|---|---|---|---|---|---|---|---|---|
(3) | 2 | 0.939 ± 0.002 | 0.948 ± 0.004 | 0.939 ± 0.002 | 0.947 ± 0.009 | 0.942 ± 0.002 | 0.785 ± 0.013 | 67.44 |
| 3 | 0.922 ± 0.031 | 0.940 ± 0.019 | 0.922 ± 0.031 | 0.949 ± 0.017 | 0.926 ± 0.028 | 0.796 ± 0.068 | 22:39 | |
| 4 | 0.906 ± 0.022 | 0.923 ± 0.018 | 0.906 ± 0.022 | 0.941 ± 0.017 | 0.910 ± 0.021 | 0.766 ± 0.050 | 13:48 | |
(3) | 2 | 0.923 ± 0.005 | 0.941 ± 0.001 | 0.923 ± 0.005 | 0.944 ± 0.006 | 0.928 ± 0.004 | 0.748 ± 0.003 | 127:32 |
| 3 | 0.940 ± 0.010 | 0.951 ± 0.006 | 0.940 ± 0.010 | 0.963 ± 0.003 | 0.943 ± 0.009 | 0.834 ± 0.020 | 26:43 | |
| 4 | 0.930 ± 0.020 | 0.940 ± 0.015 | 0.930 ± 0.020 | 0.958 ± 0.014 | 0.932 ± 0.019 | 0.817 ± 0.044 | 16:47 | |
(3) | 2 | 0.946 ± 0.015 | 0.954 ± 0.010 | 0.946 ± 0.015 | 0.952 ± 0.010 | 0.949 ± 0.013 | 0.811 ± 0.042 | 55:17 |
| 3 | 0.938 ± 0.019 | 0.949 ± 0.012 | 0.938 ± 0.019 | 0.952 ± 0.008 | 0.941 ± 0.017 | 0.784 ± 0.048 | 22:12 | |
| 4 | 0.943 ± 0.008 | 0.953 ± 0.005 | 0.943 ± 0.008 | 0.971 ± 0.003 | 0.945 ± 0.008 | 0.839 ± 0.019 | 12:39 |
| Data Type | Window (s) | Accuracy | Precision | Sensitivity | Specificity | Score | MCC | Runtime (min) |
|---|---|---|---|---|---|---|---|---|
(3) | 2 | 0.831 ± 0.023 | 0.906 ± 0.006 | 0.831 ± 0.023 | 0.902 ± 0.011 | 0.852 ± 0.018 | 0.571 ± 0.035 | 74.00 |
| 3 | 0.865 ± 0.015 | 0.907 ± 0.009 | 0.865 ± 0.015 | 0.930 ± 0.010 | 0.876 ± 0.014 | 0.681 ± 0.031 | 32:34 | |
| 4 | 0.825 ± 0.024 | 0.888 ± 0.010 | 0.825 ± 0.024 | 0.919 ± 0.010 | 0.839 ± 0.021 | 0.641 ± 0.035 | 17:46 | |
(3) | 2 | 0.811 ± 0.011 | 0.901 ± 0.005 | 0.811 ± 0.011 | 0.897 ± 0.009 | 0.836 ± 0.009 | 0.545 ± 0.021 | 131:00 |
| 3 | 0.871 ± 0.020 | 0.912 ± 0.005 | 0.871 ± 0.020 | 0.930 ± 0.005 | 0.881 ± 0.016 | 0.695 ± 0.026 | 28:58 | |
| 4 | 0.831 ± 0.025 | 0.895 ± 0.010 | 0.831 ± 0.025 | 0.923 ± 0.013 | 0.846 ± 0.021 | 0.657 ± 0.032 | 16:27 | |
(3) | 2 | 0.805 ± 0.011 | 0.900 ± 0.010 | 0.805 ± 0.011 | 0.887 ± 0.017 | 0.832 ± 0.010 | 0.531 ± 0.036 | 68:28 |
| 3 | 0.842 ± 0.033 | 0.908 ± 0.009 | 0.842 ± 0.033 | 0.917 ± 0.013 | 0.861 ± 0.026 | 0.590 ± 0.052 | 29:24 | |
| 4 | 0.864 ± 0.025 | 0.916 ± 0.010 | 0.864 ± 0.025 | 0.946 ± 0.012 | 0.877 ± 0.021 | 0.687 ± 0.040 | 15:50 |
| Data Type | Window (s) | Accuracy | Precision | Sensitivity | Specificity | Score | MCC | Runtime (min) |
|---|---|---|---|---|---|---|---|---|
(3) | 2 | 0.797 ± 0.106 | 0.896 ± 0.027 | 0.797 ± 0.106 | 0.917 ± 0.048 | 0.827 ± 0.082 | 0.527 ± 0.149 | 302.21 |
| 3 | 0.784 ± 0.124 | 0.903 ± 0.018 | 0.784 ± 0.124 | 0.939 ± 0.053 | 0.817 ± 0.092 | 0.597 ± 0.152 | 149:31 | |
| 4 | 0.695 ± 0.178 | 0.832 ± 0.053 | 0.695 ± 0.178 | 0.774 ± 0.074 | 0.715 ± 0.155 | 0.441 ± 0.168 | 73:22 | |
(3) | 2 | 0.705 ± 0.106 | 0.877 ± 0.012 | 0.705 ± 0.106 | 0.836 ± 0.034 | 0.747 ± 0.088 | 0.418 ± 0.091 | 121:56 |
| 3 | 0.894 ± 0.021 | 0.929 ± 0.006 | 0.894 ± 0.021 | 0.933 ± 0.007 | 0.904 ± 0.016 | 0.687 ± 0.039 | 96.09 | |
| 4 | 0.360 ± 0.380 | 0.315 ± 0.432 | 0.360 ± 0.380 | 0.806 ± 0.134 | 0.312 ± 0.419 | 0.246 ± 0.351 | 52:05 | |
(3) | 2 | 0.715 ± 0.270 | 0.880 ± 0.071 | 0.715 ± 0.270 | 0.800 ± 0.120 | 0.744 ± 0.239 | 0.478 ± 0.314 | 199:10 |
| 3 | 0.778 ± 0.142 | 0.903 ± 0.032 | 0.778 ± 0.142 | 0.930 ± 0.060 | 0.814 ± 0.111 | 0.531 ± 0.181 | 105:22 | |
| 4 | 0.441 ± 0.312 | 0.517 ± 0.372 | 0.441 ± 0.312 | 0.728 ± 0.059 | 0.411 ± 0.305 | 0.111 ± 0.157 | 74:20 |
| Data Type | Window (s) | Accuracy | Precision | Sensitivity | Specificity | Score | MCC | Runtime (min) |
|---|---|---|---|---|---|---|---|---|
(3) | 2 | 0.846 ± 0.034 | 0.912 ± 0.015 | 0.846 ± 0.034 | 0.902 ± 0.023 | 0.865 ± 0.028 | 0.600 ± 0.067 | 179.36 |
| 3 | 0.815 ± 0.020 | 0.896 ± 0.007 | 0.815 ± 0.020 | 0.923 ± 0.009 | 0.834 ± 0.017 | 0.620 ± 0.026 | 91:14 | |
| 4 | 0.803 ± 0.033 | 0.875 ± 0.010 | 0.803 ± 0.033 | 0.893 ± 0.009 | 0.821 ± 0.028 | 0.597 ± 0.040 | 49:37 | |
(3) | 2 | 0.822 ± 0.013 | 0.907 ± 0.008 | 0.822 ± 0.013 | 0.904 ± 0.012 | 0.845 ± 0.010 | 0.563 ± 0.025 | 147:41 |
| 3 | 0.812 ± 0.011 | 0.897 ± 0.001 | 0.812 ± 0.011 | 0.917 ± 0.002 | 0.832 ± 0.008 | 0.620 ± 0.011 | 89:48 | |
| 4 | 0.783 ± 0.070 | 0.859 ± 0.042 | 0.783 ± 0.070 | 0.855 ± 0.043 | 0.801 ± 0.062 | 0.557 ± 0.122 | 47:42 | |
(3) | 2 | 0.840 ± 0.007 | 0.907 ± 0.014 | 0.840 ± 0.007 | 0.898 ± 0.025 | 0.859 ± 0.006 | 0.579 ± 0.039 | 190:06 |
| 3 | 0.773 ± 0.022 | 0.900 ± 0.001 | 0.773 ± 0.022 | 0.897 ± 0.004 | 0.807 ± 0.017 | 0.519 ± 0.019 | 61:44 | |
| 4 | 0.770 ± 0.019 | 0.888 ± 0.013 | 0.770 ± 0.019 | 0.909 ± 0.019 | 0.797 ± 0.017 | 0.560 ± 0.035 | 40:11 |
| Data Type | Window (s) | Accuracy | Precision | Sensitivity | Specificity | Score | MCC | Runtime (min) |
|---|---|---|---|---|---|---|---|---|
(3) | 2 | 0.971 ± 0.007 | 0.972 ± 0.007 | 0.971 ± 0.007 | 0.956 ± 0.012 | 0.971 ± 0.007 | 0.885 ± 0.027 | 200.32 |
| 3 | 0.979 ± 0.002 | 0.979 ± 0.002 | 0.979 ± 0.002 | 0.977 ± 0.005 | 0.979 ± 0.002 | 0.934 ± 0.006 | 157:30 | |
| 4 | 0.967 ± 0.005 | 0.967 ± 0.007 | 0.967 ± 0.005 | 0.967 ± 0.012 | 0.967 ± 0.006 | 0.905 ± 0.018 | 108:52 | |
(3) | 2 | 0.967 ± 0.008 | 0.968 ± 0.008 | 0.967 ± 0.008 | 0.954 ± 0.013 | 0.967 ± 0.008 | 0.870 ± 0.032 | 200:29 |
| 3 | 0.980 ± 0.002 | 0.980 ± 0.002 | 0.980 ± 0.002 | 0.977 ± 0.005 | 0.980 ± 0.002 | 0.938 ± 0.006 | 132:45 | |
| 4 | 0.965 ± 0.011 | 0.965 ± 0.011 | 0.965 ± 0.011 | 0.968 ± 0.014 | 0.965 ± 0.011 | 0.899 ± 0.032 | 118:05 | |
(3) | 2 | 0.972 ± 0.009 | 0.973 ± 0.009 | 0.972 ± 0.009 | 0.956 ± 0.013 | 0.972 ± 0.009 | 0.889 ± 0.036 | 324:54 |
| 3 | 0.971 ± 0.006 | 0.971 ± 0.006 | 0.971 ± 0.006 | 0.960 ± 0.008 | 0.971 ± 0.006 | 0.882 ± 0.024 | 196:53 | |
| 4 | 0.967 ± 0.009 | 0.971 ± 0.007 | 0.967 ± 0.009 | 0.979 ± 0.003 | 0.968 ± 0.009 | 0.900 ± 0.026 | 178:51 |
| Data Type | Window (s) | Accuracy | Precision | Sensitivity | Specificity | Score | MCC | Runtime (min) |
|---|---|---|---|---|---|---|---|---|
(3) | 2 | 0.979 ± 0.008 | 0.978 ± 0.009 | 0.979 ± 0.008 | 0.958 ± 0.013 | 0.978 ± 0.009 | 0.913 ± 0.034 | 103.09 |
| 3 | 0.980 ± 0.005 | 0.980 ± 0.005 | 0.980 ± 0.005 | 0.976 ± 0.007 | 0.980 ± 0.005 | 0.938 ± 0.015 | 43:36 | |
| 4 | 0.967 ± 0.005 | 0.967 ± 0.006 | 0.967 ± 0.005 | 0.967 ± 0.012 | 0.967 ± 0.006 | 0.905 ± 0.018 | 32:09 | |
(3) | 2 | 0.973 ± 0.008 | 0.973 ± 0.008 | 0.973 ± 0.008 | 0.956 ± 0.013 | 0.973 ± 0.008 | 0.893 ± 0.032 | 107:14 |
| 3 | 0.978 ± 0.003 | 0.978 ± 0.002 | 0.978 ± 0.003 | 0.976 ± 0.003 | 0.978 ± 0.003 | 0.931 ± 0.008 | 51:31 | |
| 4 | 0.969 ± 0.008 | 0.970 ± 0.008 | 0.969 ± 0.008 | 0.969 ± 0.013 | 0.969 ± 0.008 | 0.911 ± 0.024 | 24:04 | |
(3) | 2 | 0.983 ± 0.006 | 0.983 ± 0.006 | 0.983 ± 0.006 | 0.960 ± 0.012 | 0.983 ± 0.006 | 0.932 ± 0.026 | 64:56 |
| 3 | 0.975 ± 0.005 | 0.975 ± 0.005 | 0.975 ± 0.005 | 0.962 ± 0.009 | 0.975 ± 0.005 | 0.900 ± 0.019 | 32:55 | |
| 4 | 0.976 ± 0.008 | 0.978 ± 0.007 | 0.976 ± 0.008 | 0.983 ± 0.003 | 0.976 ± 0.008 | 0.925 ± 0.024 | 38:40 |
| Data Type | Window (s) | Accuracy | Precision | Sensitivity | Specificity | Score | MCC | Runtime (min) |
|---|---|---|---|---|---|---|---|---|
(3) | 2 | 0.981 ± 0.007 | 0.980 ± 0.007 | 0.981 ± 0.007 | 0.951 ± 0.015 | 0.980 ± 0.007 | 0.921 ± 0.029 | < 1 |
| 3 | 0.985 ± 0.003 | 0.985 ± 0.003 | 0.985 ± 0.003 | 0.979 ± 0.006 | 0.985 ± 0.003 | 0.953 ± 0.010 | < 1 | |
| 4 | 0.969 ± 0.006 | 0.969 ± 0.007 | 0.969 ± 0.006 | 0.967 ± 0.012 | 0.969 ± 0.007 | 0.911 ± 0.019 | < 1 | |
(3) | 2 | 0.977 ± 0.008 | 0.977 ± 0.008 | 0.977 ± 0.008 | 0.958 ± 0.012 | 0.977 ± 0.008 | 0.907 ± 0.032 | < 1 |
| 3 | 0.973 ± 0.008 | 0.975 ± 0.006 | 0.973 ± 0.008 | 0.974 ± 0.002 | 0.973 ± 0.007 | 0.917 ± 0.020 | < 1 | |
| 4 | 0.971 ± 0.008 | 0.972 ± 0.008 | 0.971 ± 0.008 | 0.967 ± 0.008 | 0.971 ± 0.008 | 0.917 ± 0.023 | < 1 | |
(3) | 2 | 0.983 ± 0.007 | 0.983 ± 0.007 | 0.983 ± 0.007 | 0.960 ± 0.012 | 0.983 ± 0.007 | 0.932 ± 0.030 | < 1 |
| 3 | 0.977 ± 0.003 | 0.977 ± 0.004 | 0.977 ± 0.003 | 0.962 ± 0.008 | 0.976 ± 0.004 | 0.905 ± 0.015 | < 1 | |
| 4 | 0.976 ± 0.011 | 0.978 ± 0.009 | 0.976 ± 0.011 | 0.979 ± 0.004 | 0.976 ± 0.010 | 0.925 ± 0.032 | < 1 |
Publisher’s Note: MDPI stays neutral with regard to jurisdictional claims in published maps and institutional affiliations. |
© 2021 by the authors. Licensee MDPI, Basel, Switzerland. This article is an open access article distributed under the terms and conditions of the Creative Commons Attribution (CC BY) license (https://creativecommons.org/licenses/by/4.0/).
Share and Cite
Ashfaque Mostafa, T.; Soltaninejad, S.; McIsaac, T.L.; Cheng, I. A Comparative Study of Time Frequency Representation Techniques for Freeze of Gait Detection and Prediction. Sensors 2021, 21, 6446. https://doi.org/10.3390/s21196446
Ashfaque Mostafa T, Soltaninejad S, McIsaac TL, Cheng I. A Comparative Study of Time Frequency Representation Techniques for Freeze of Gait Detection and Prediction. Sensors. 2021; 21(19):6446. https://doi.org/10.3390/s21196446
Chicago/Turabian StyleAshfaque Mostafa, Tahjid, Sara Soltaninejad, Tara L. McIsaac, and Irene Cheng. 2021. "A Comparative Study of Time Frequency Representation Techniques for Freeze of Gait Detection and Prediction" Sensors 21, no. 19: 6446. https://doi.org/10.3390/s21196446
APA StyleAshfaque Mostafa, T., Soltaninejad, S., McIsaac, T. L., & Cheng, I. (2021). A Comparative Study of Time Frequency Representation Techniques for Freeze of Gait Detection and Prediction. Sensors, 21(19), 6446. https://doi.org/10.3390/s21196446