
Voltammetric Determination of Levodopa Using Mesoporous Carbon—Modified Screen-Printed Carbon Sensors


Abstract
:1. Introduction
2. Materials and Methods
2.1. Reagents and Solutions
2.2. Electrodes and Equpiment
2.3. The Real Samples Analyzed
2.4. Methods of Analysis
3. Results and Discussion
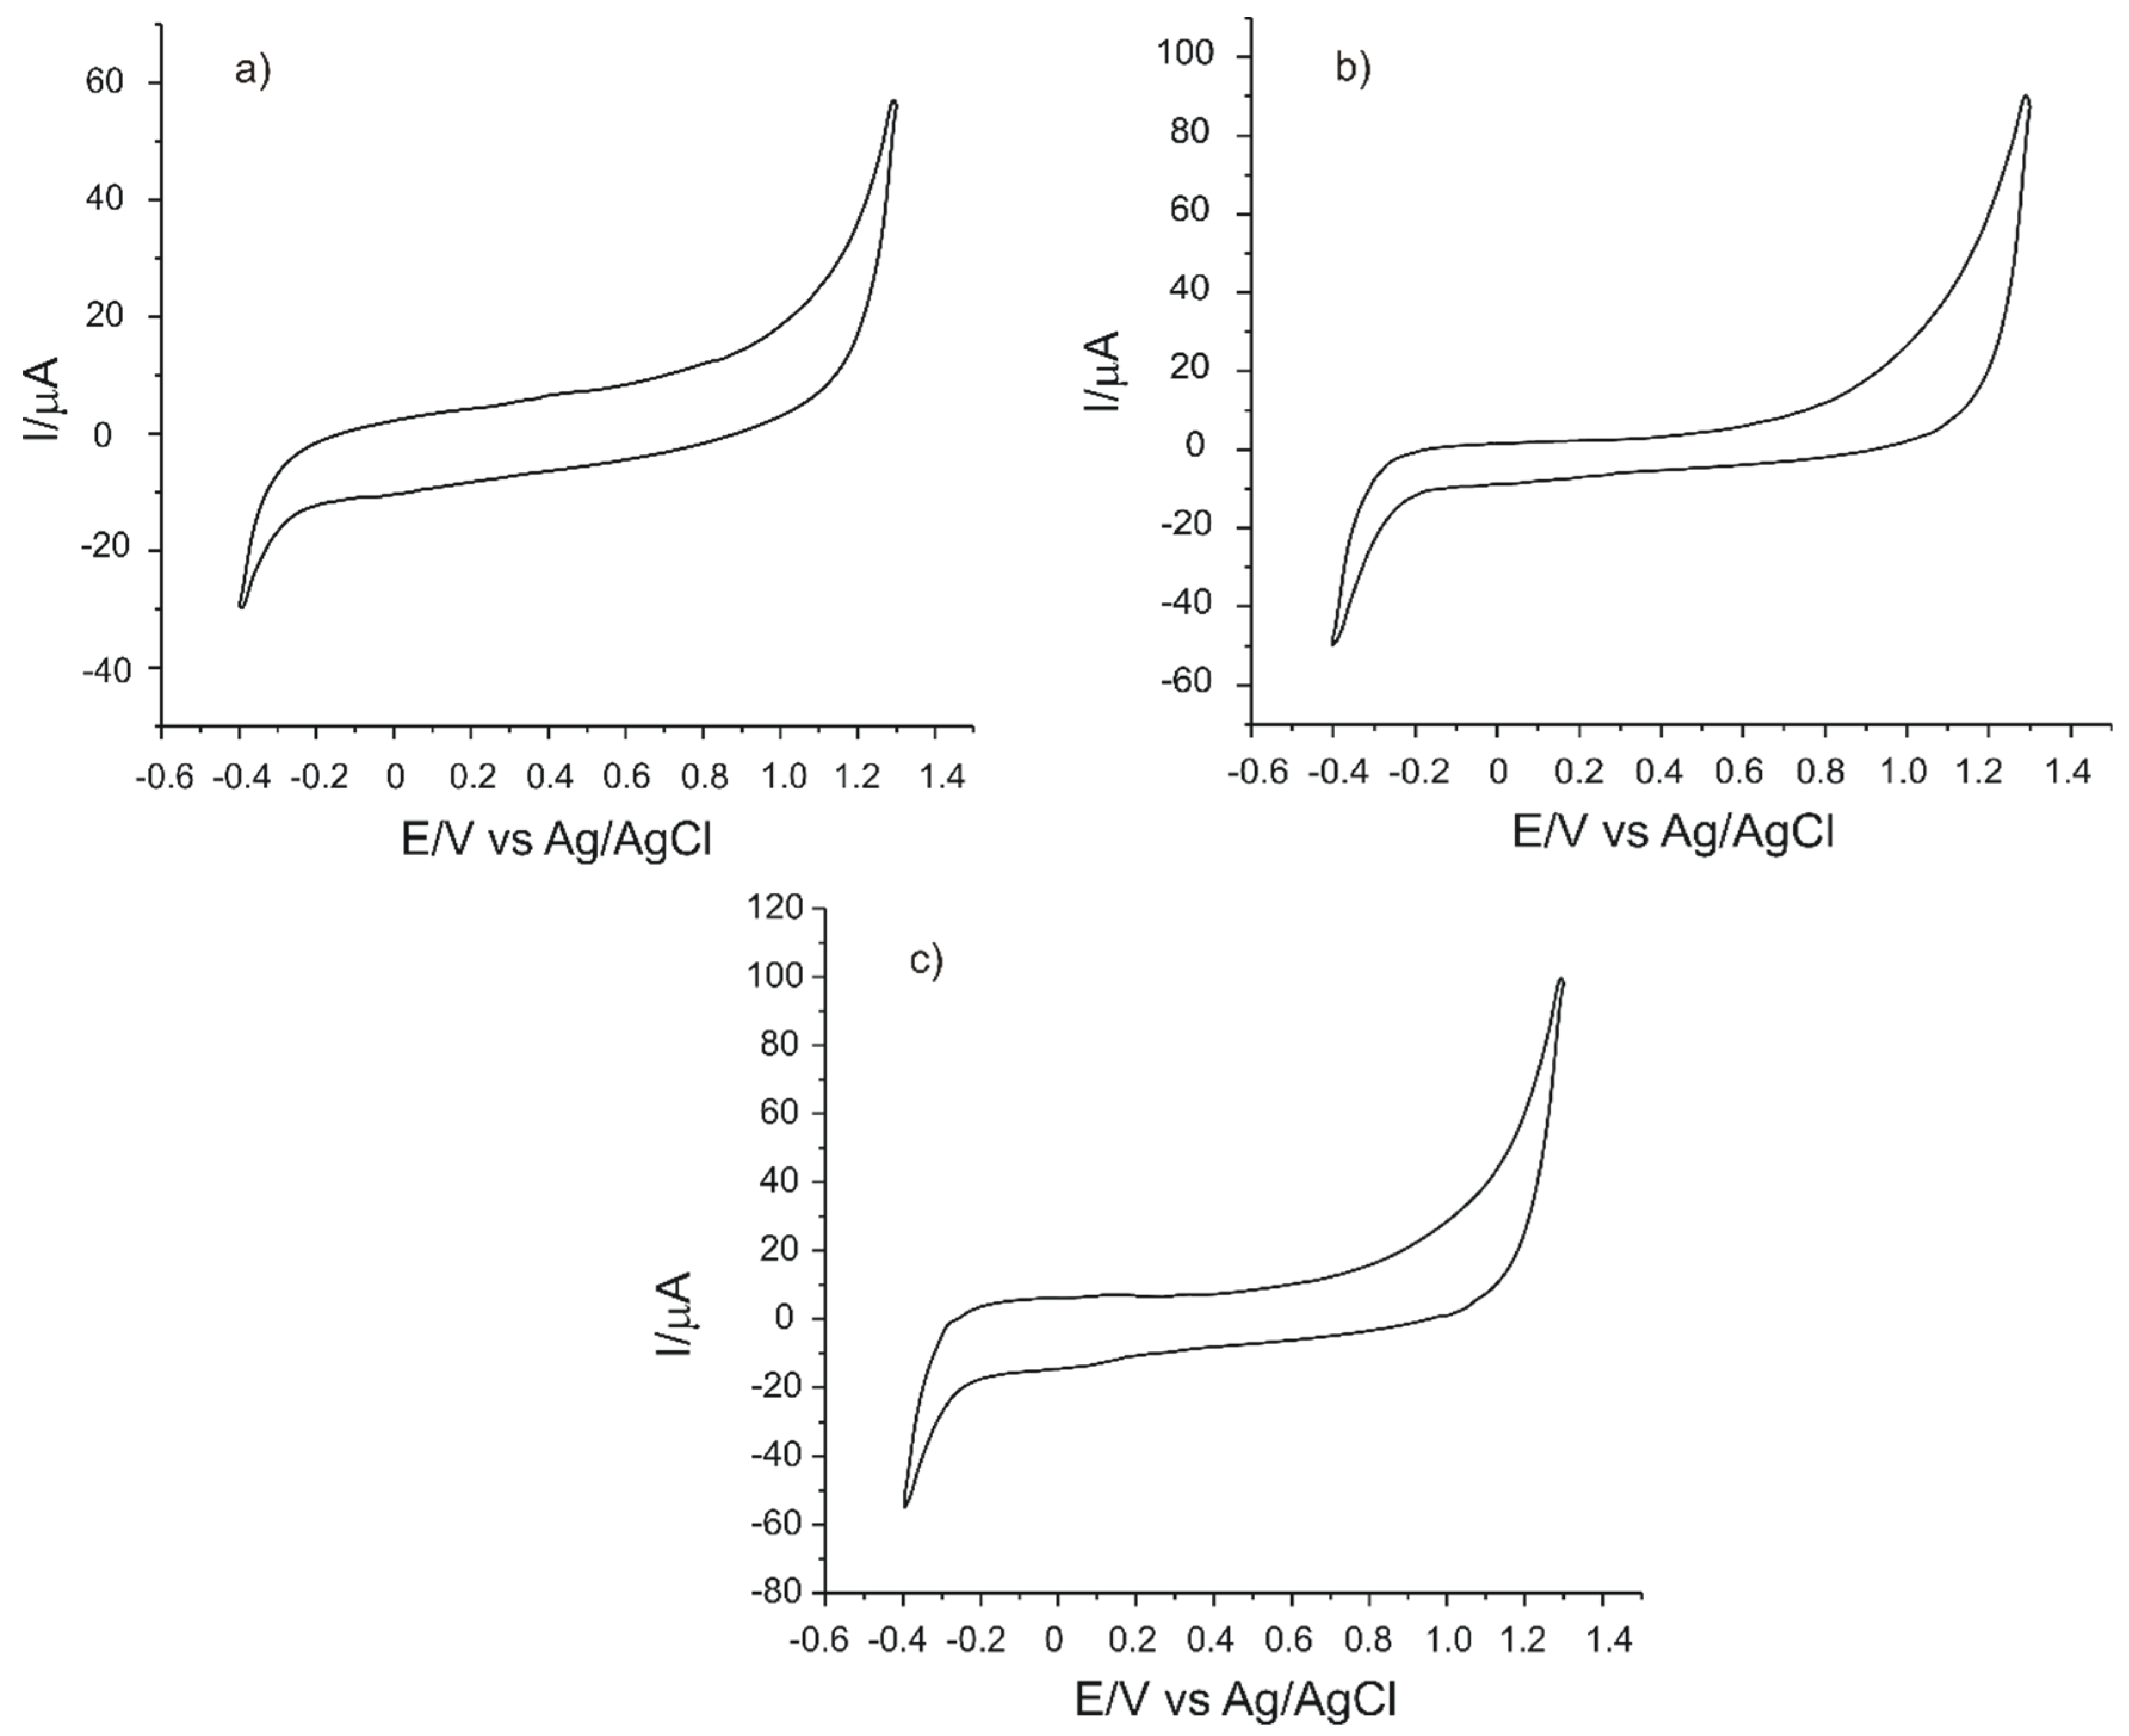
3.1. Preliminary Stages
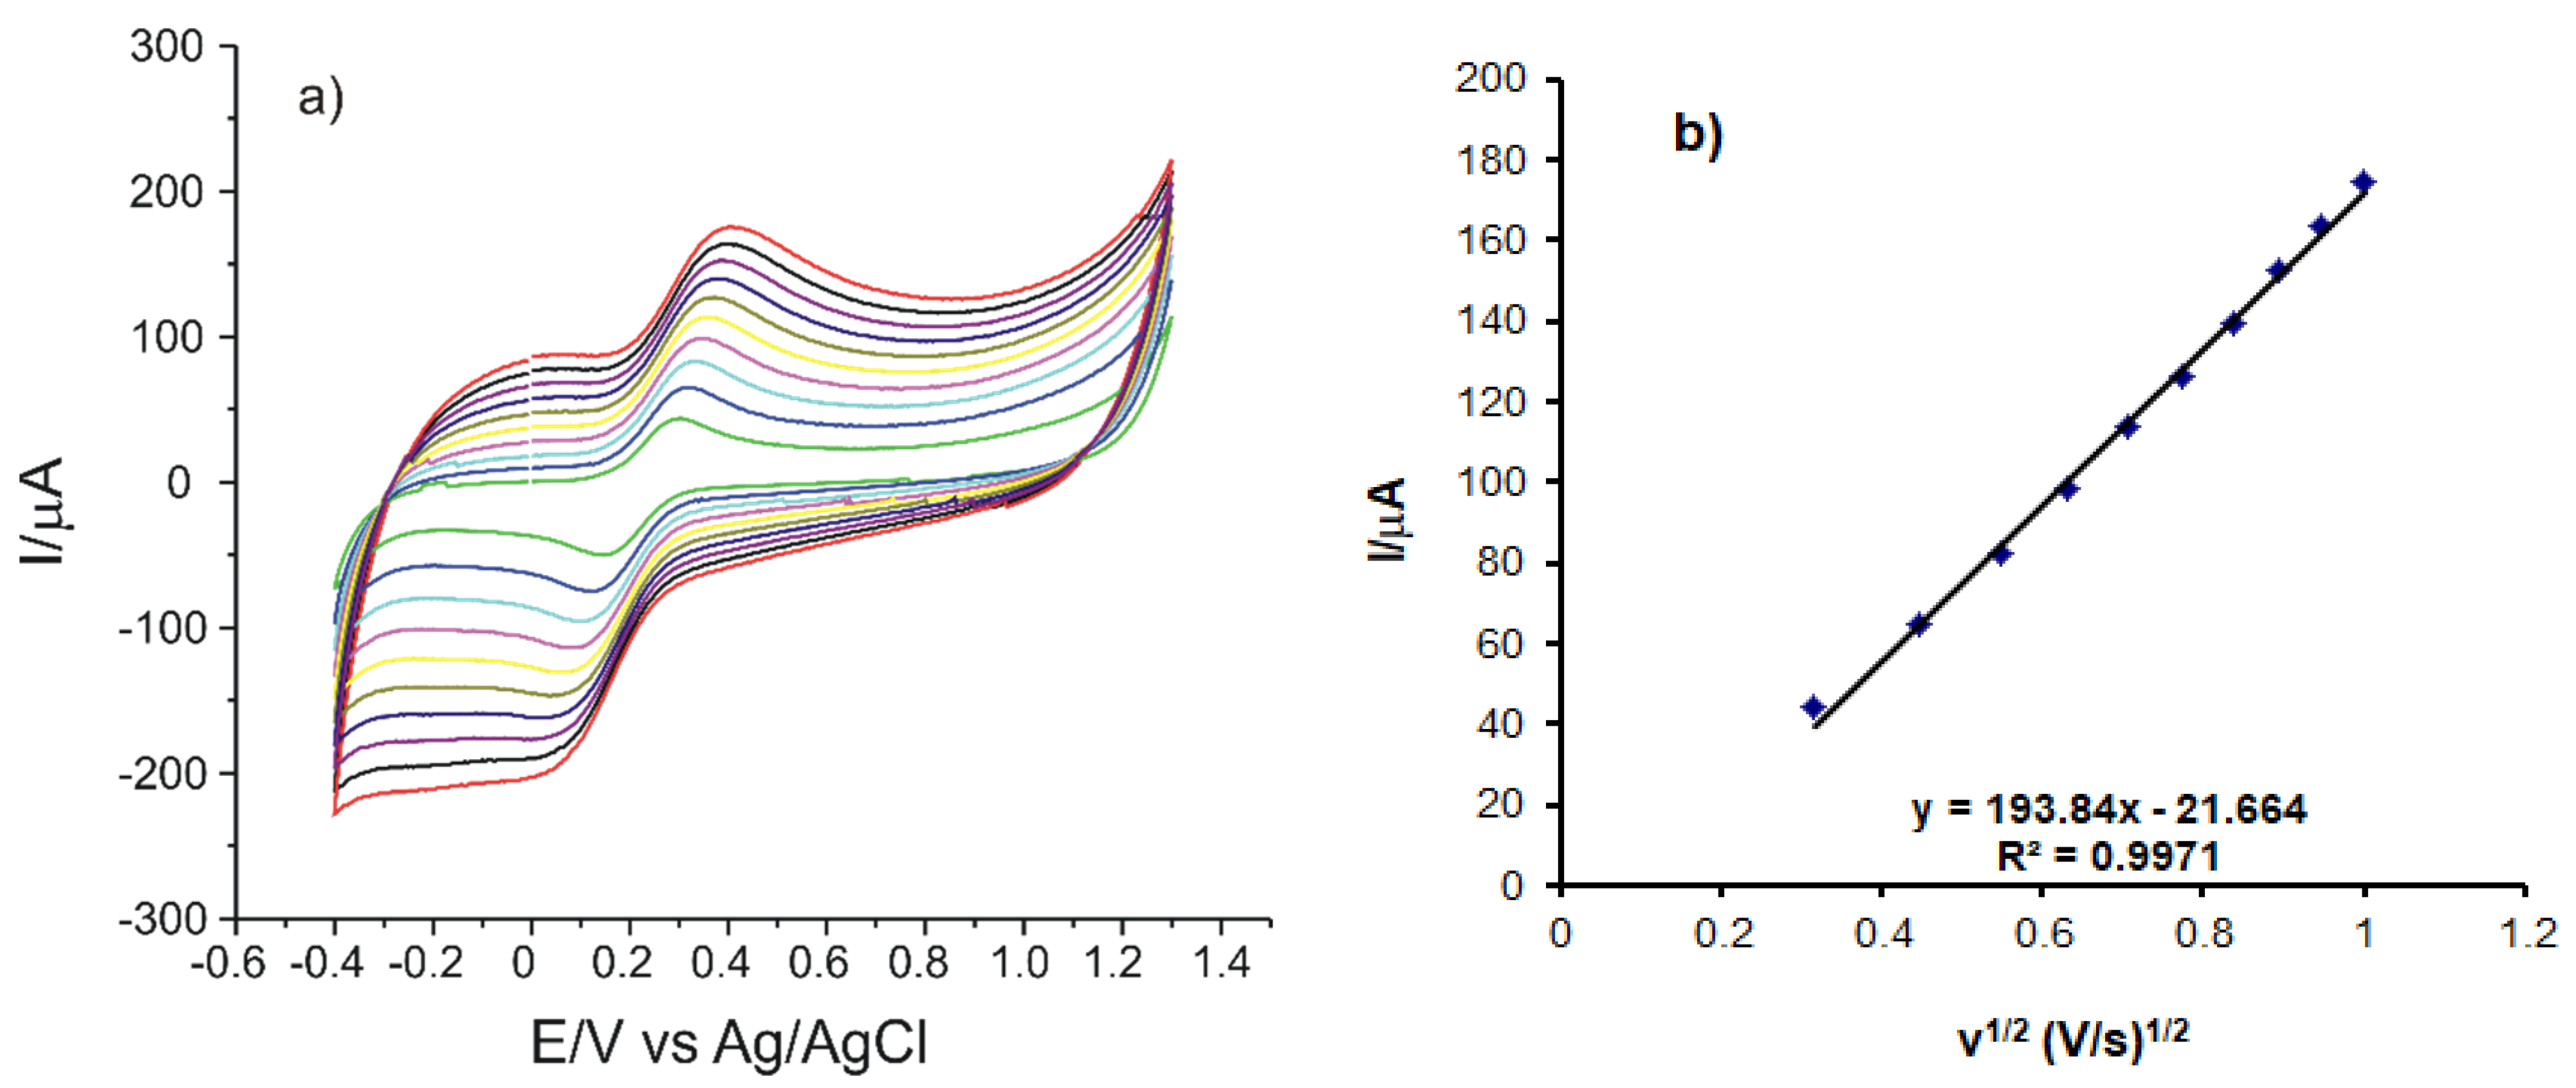
3.2. Determination of the Active Surface of C-SPCE, MC-SPCE, OMC-SPCE
- Ipa represents the anodic peak current (A)
- n is the number of electrons transferred in the redox process, 1 in this case
- A is the electrode area (cm2)
- D represents the diffusion coefficient (cm2 s−1)
- C is the concentration (mol cm−3)
- v is the scan rate (V·s−1)
- The diffusion coefficient of the ferrocyanide ion is D = 7.26 × 10⁻⁶ cm2·s−1 [42]
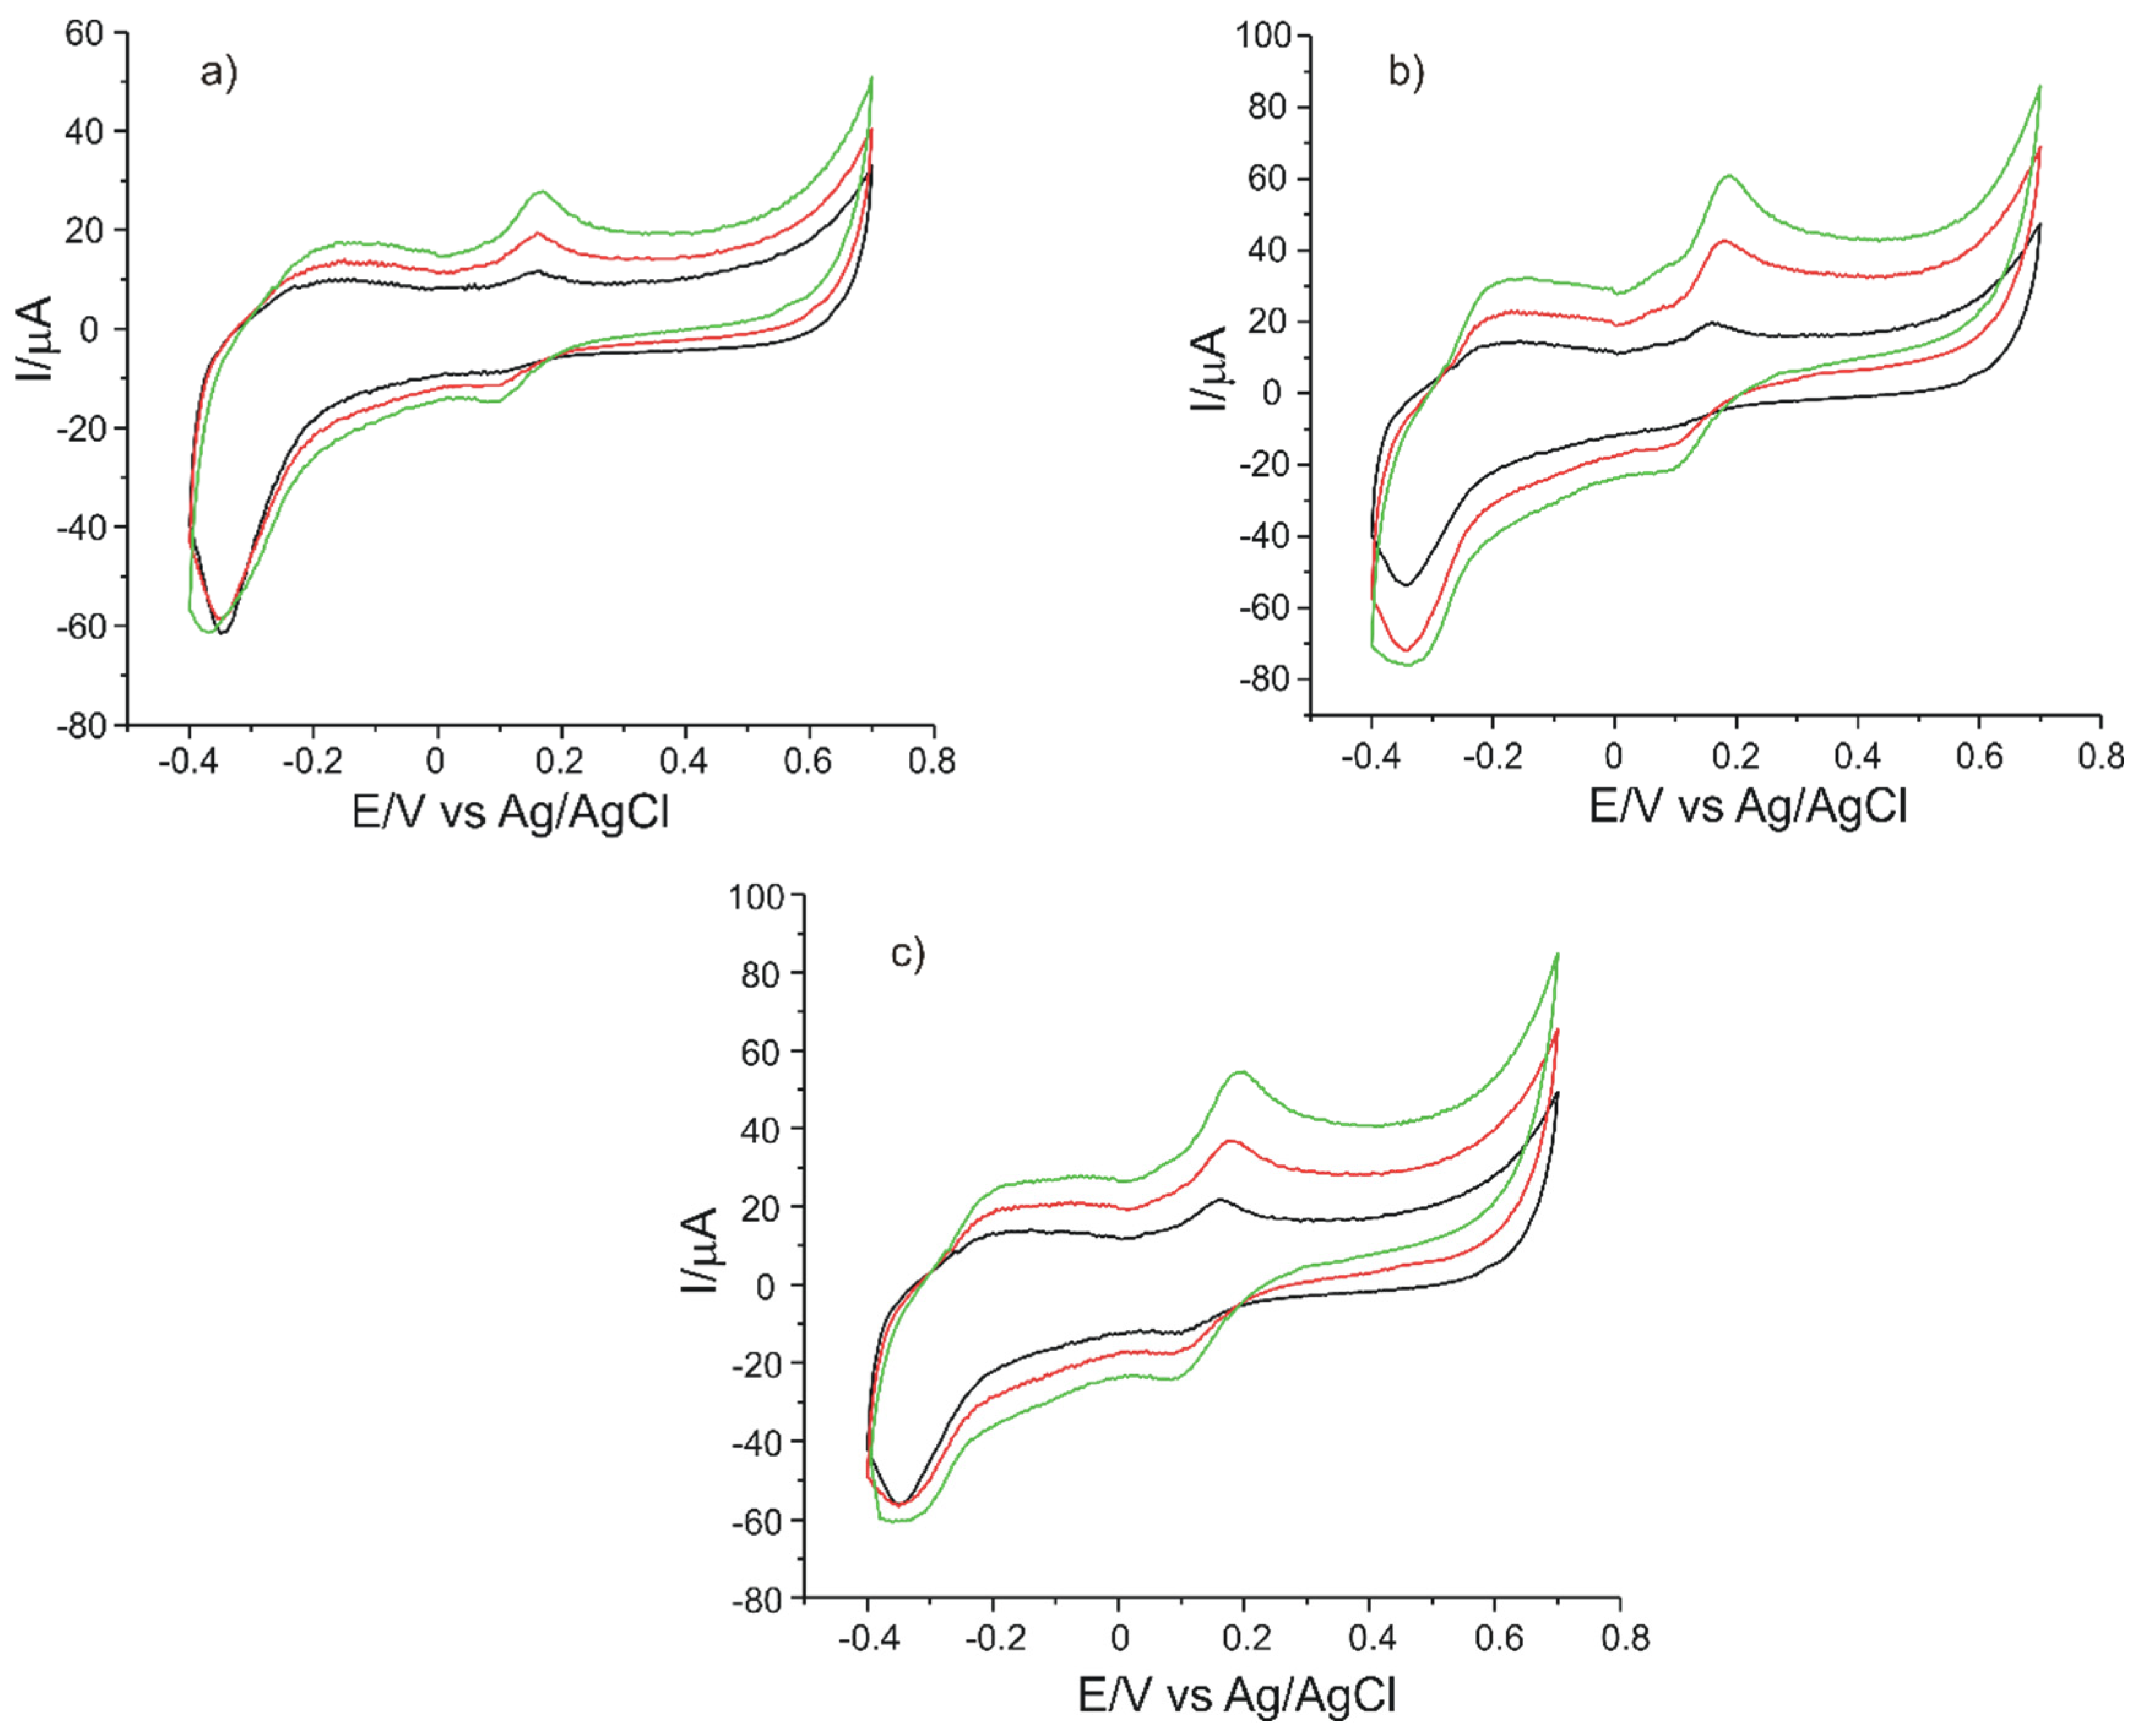
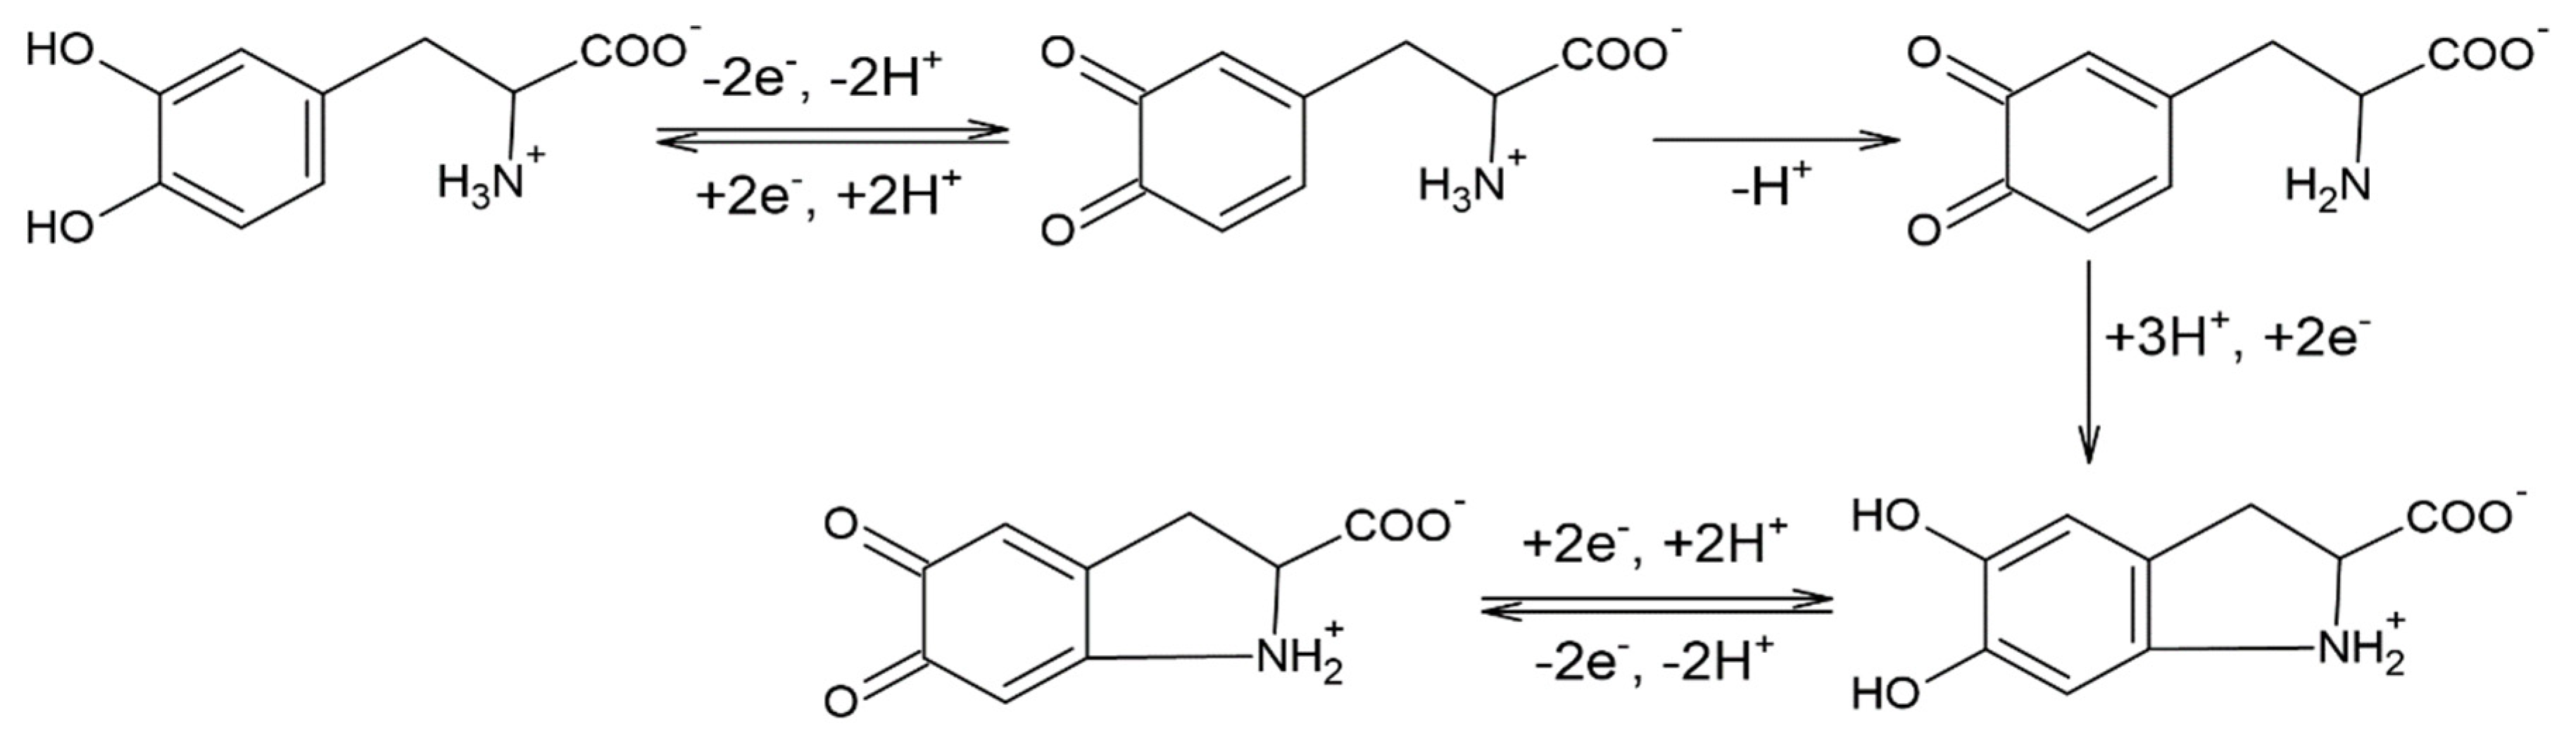
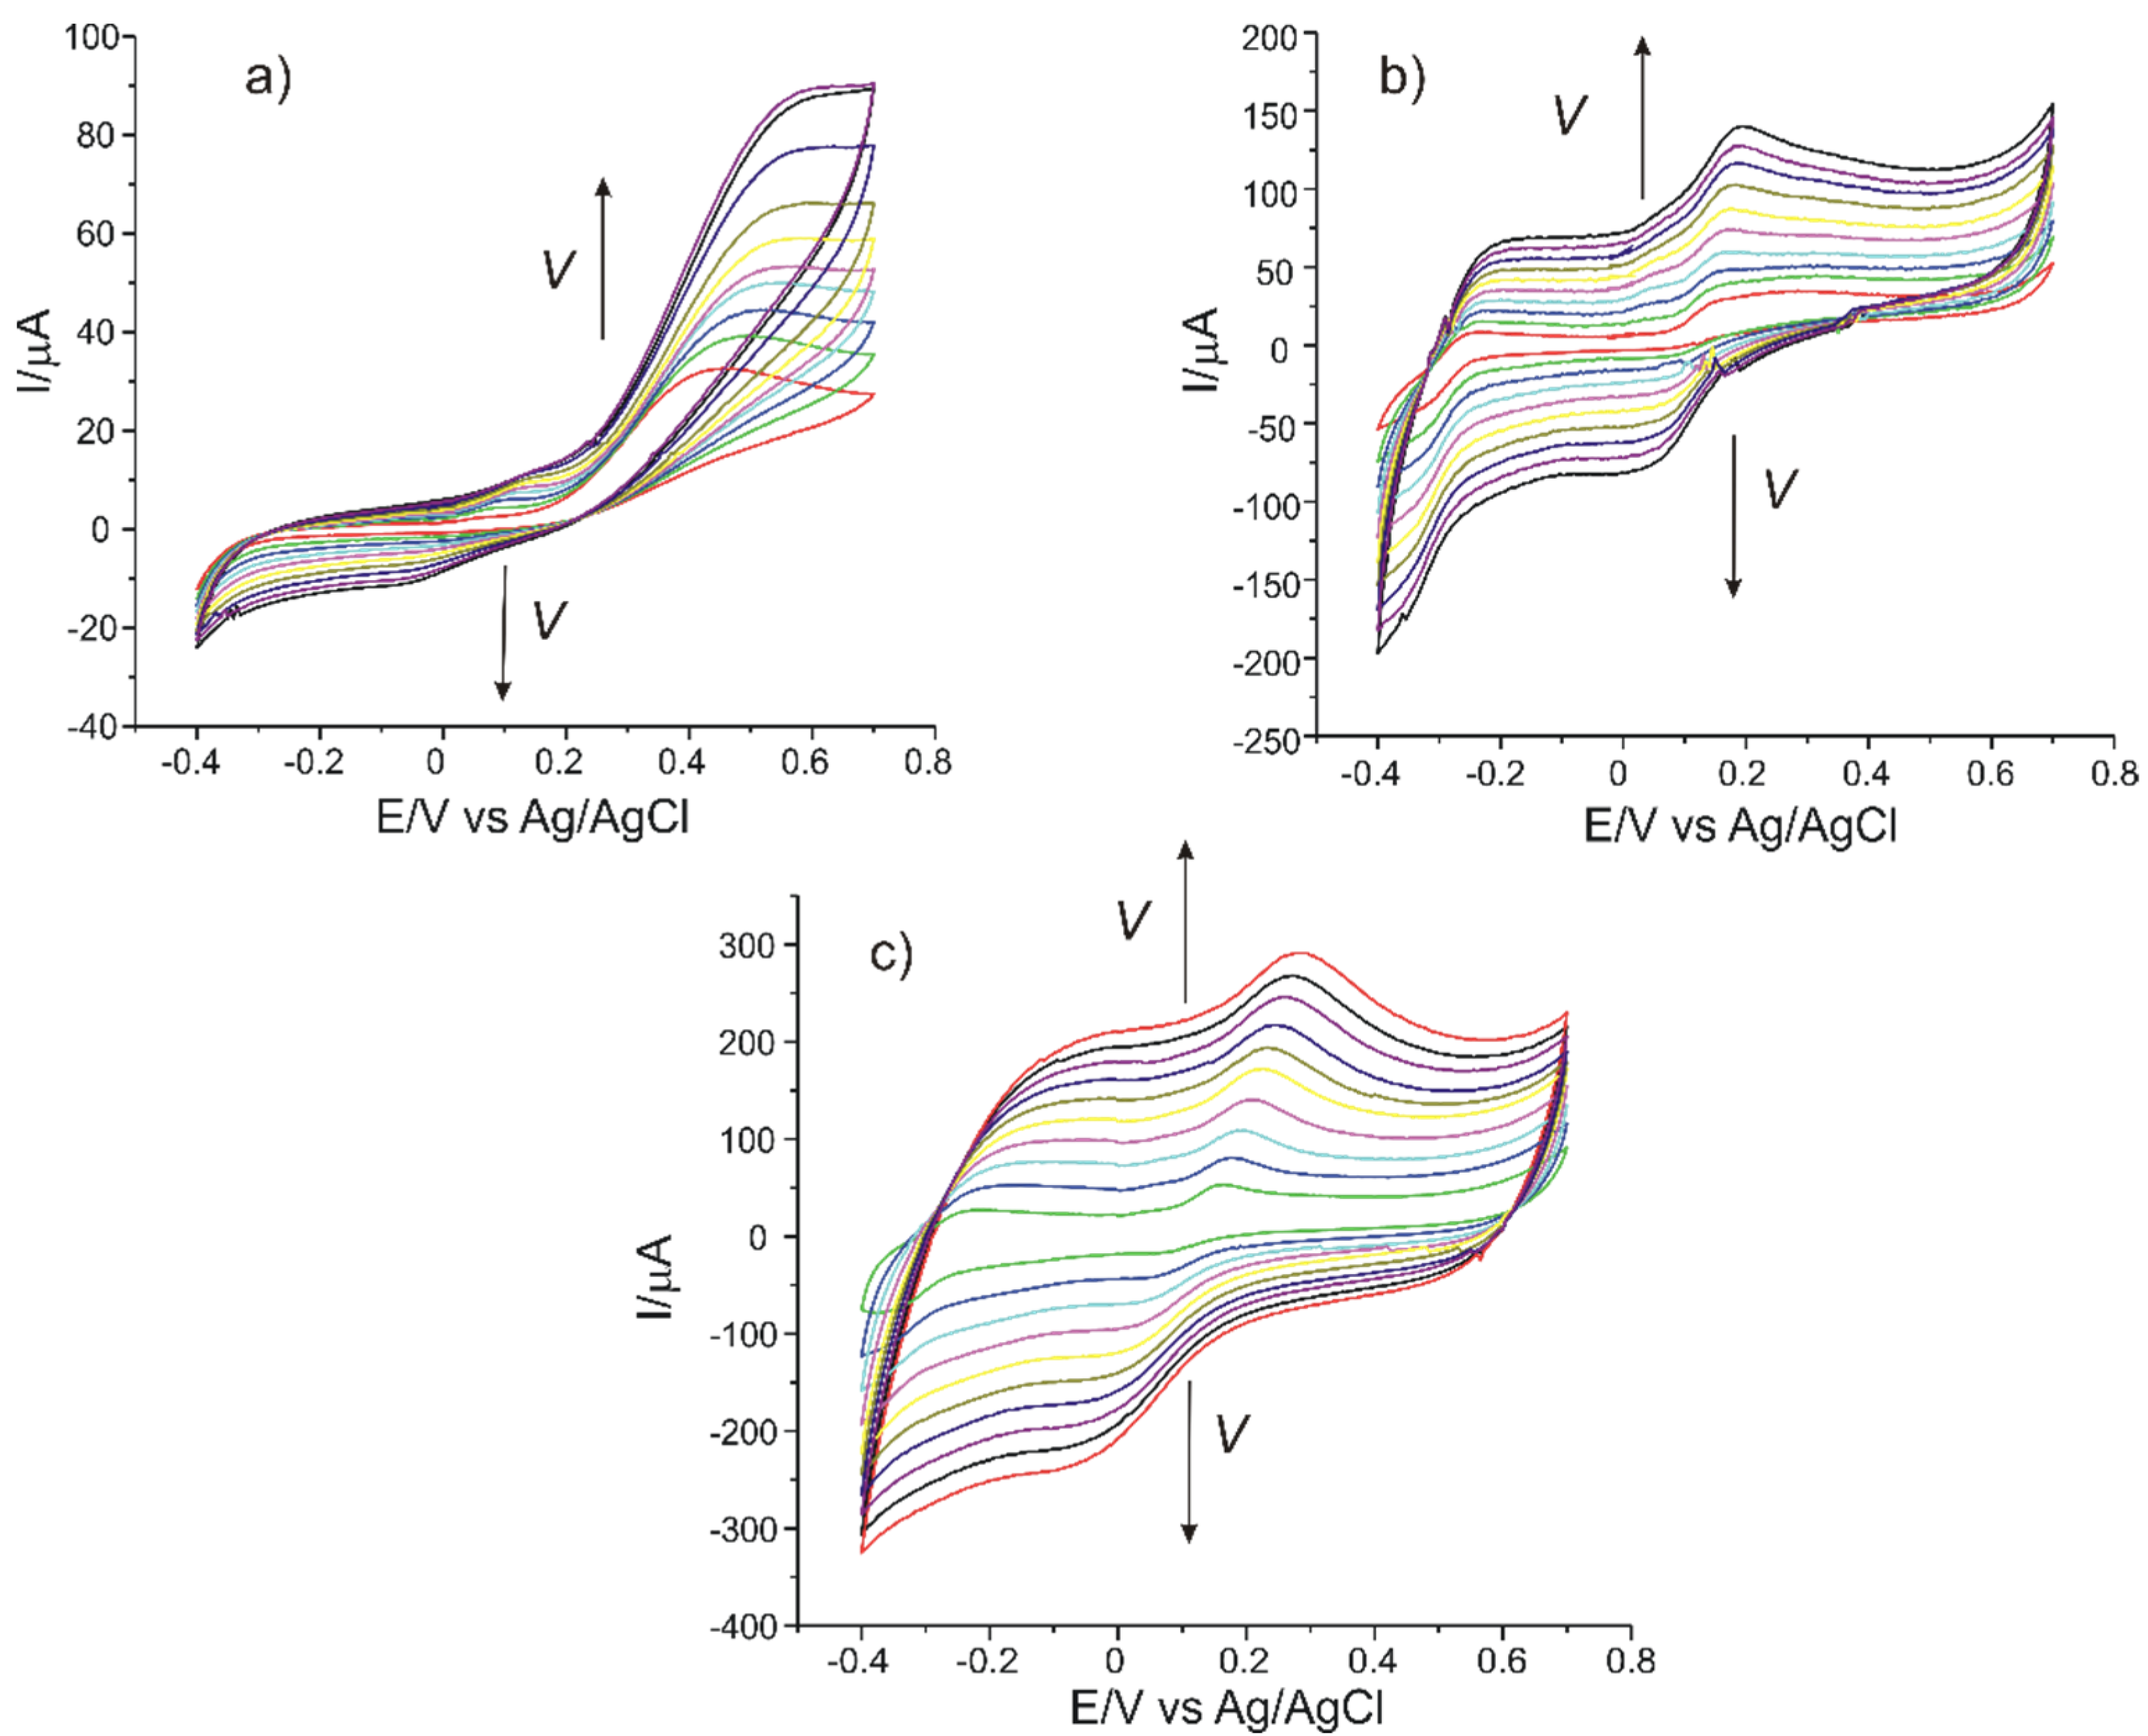
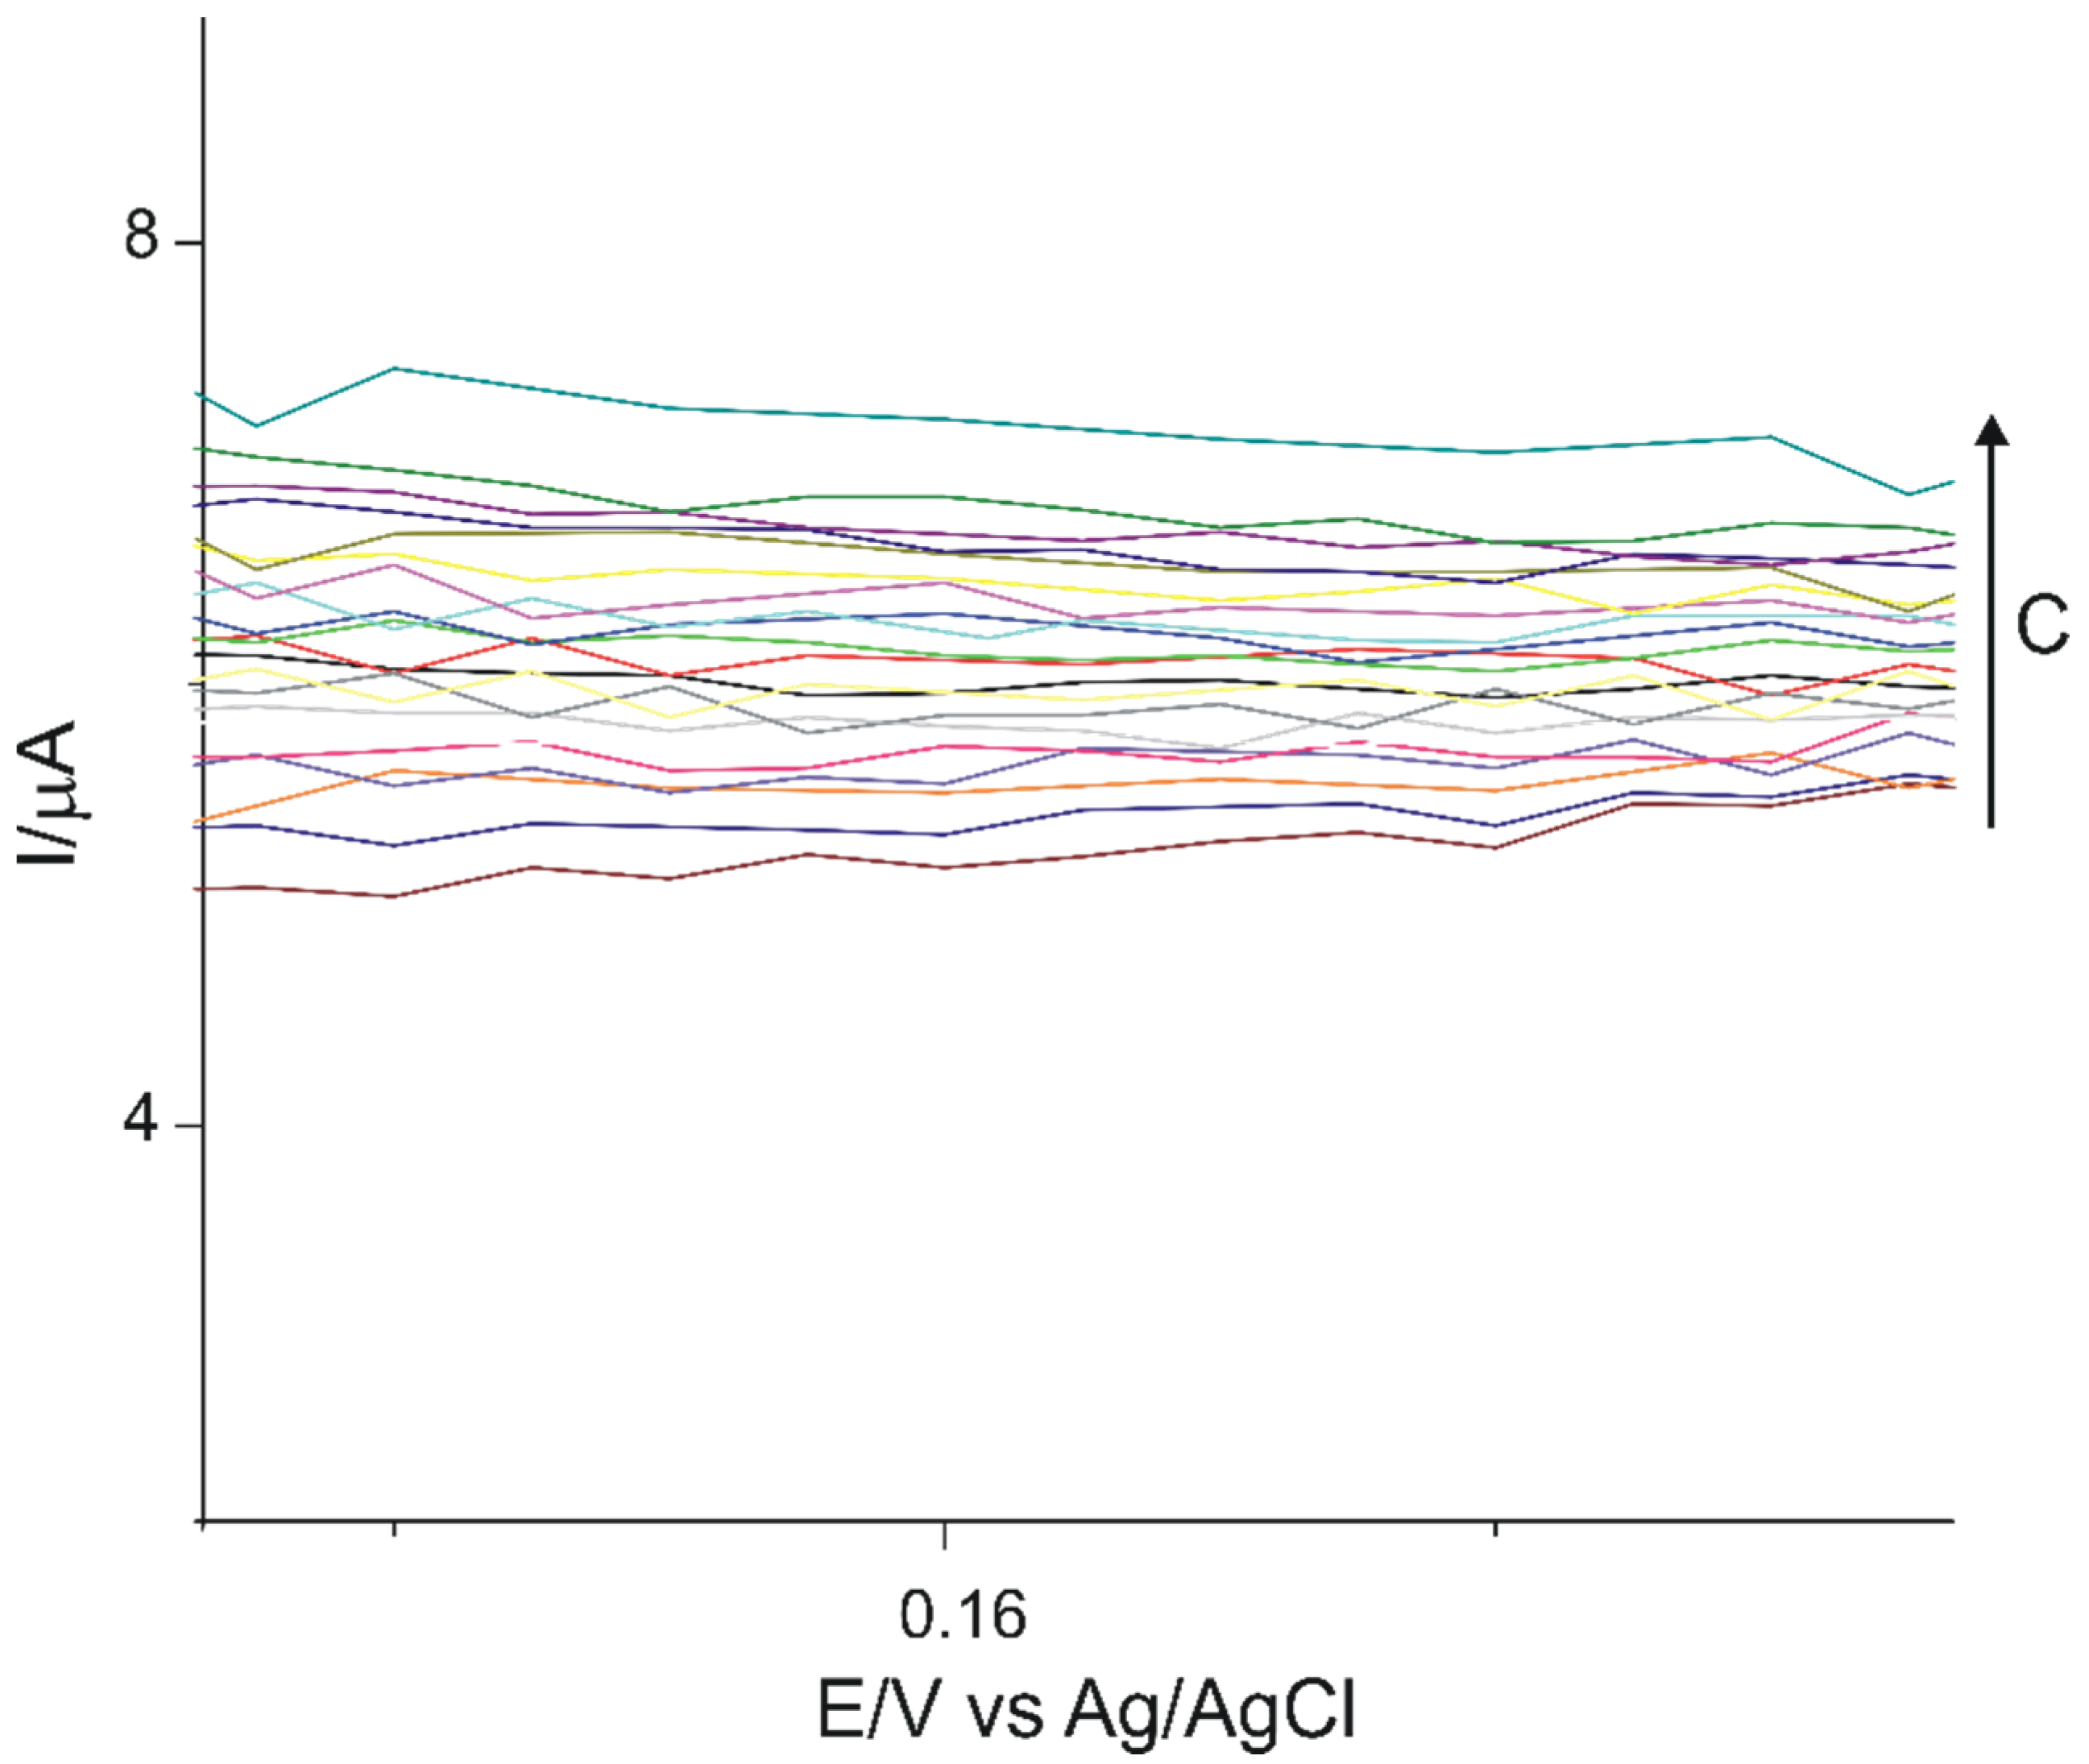
3.3. Electrochemical Responses of Sensors in L-DOPA Solutions
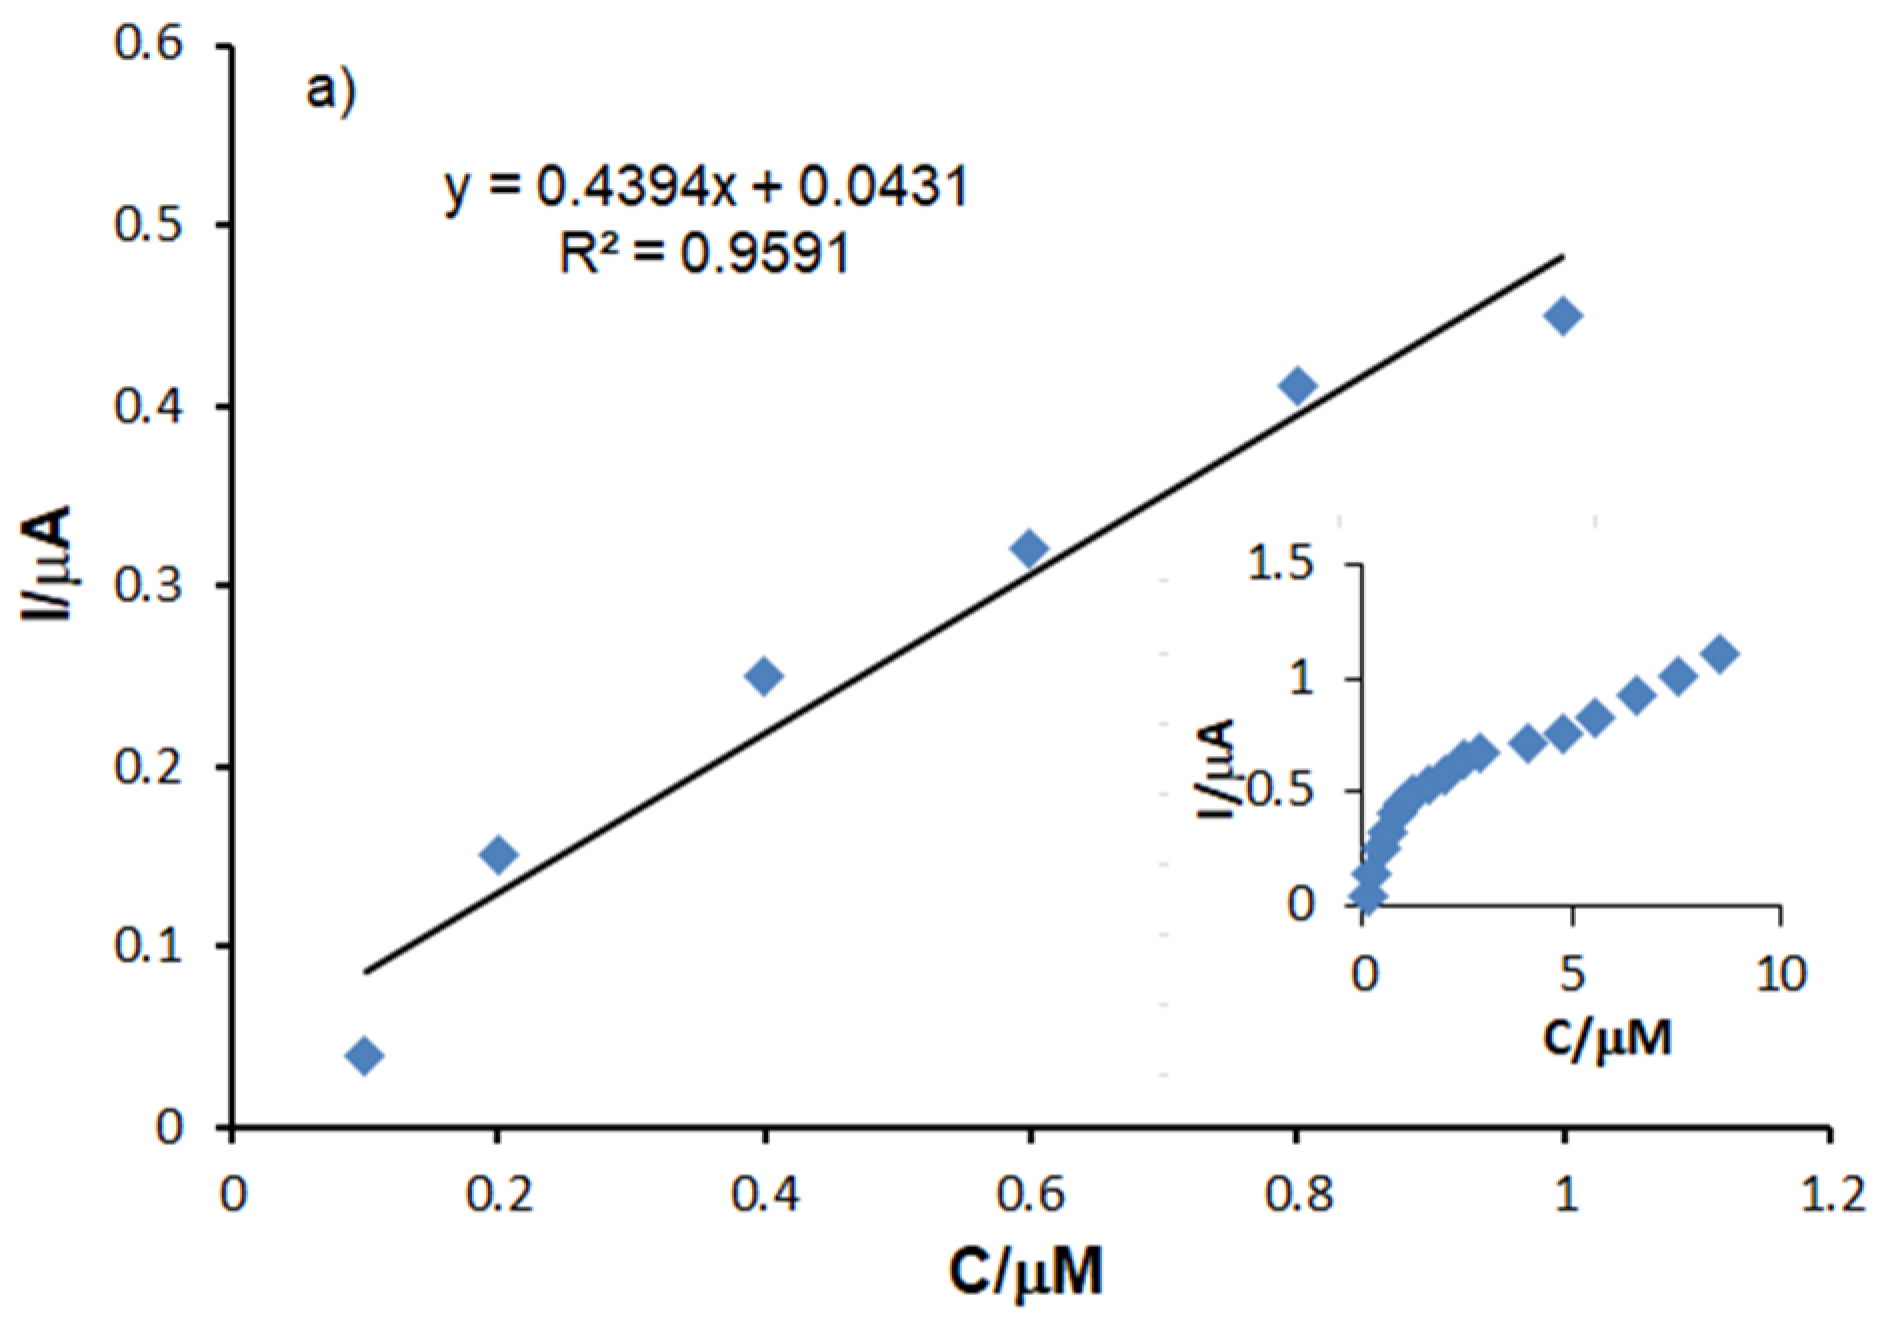
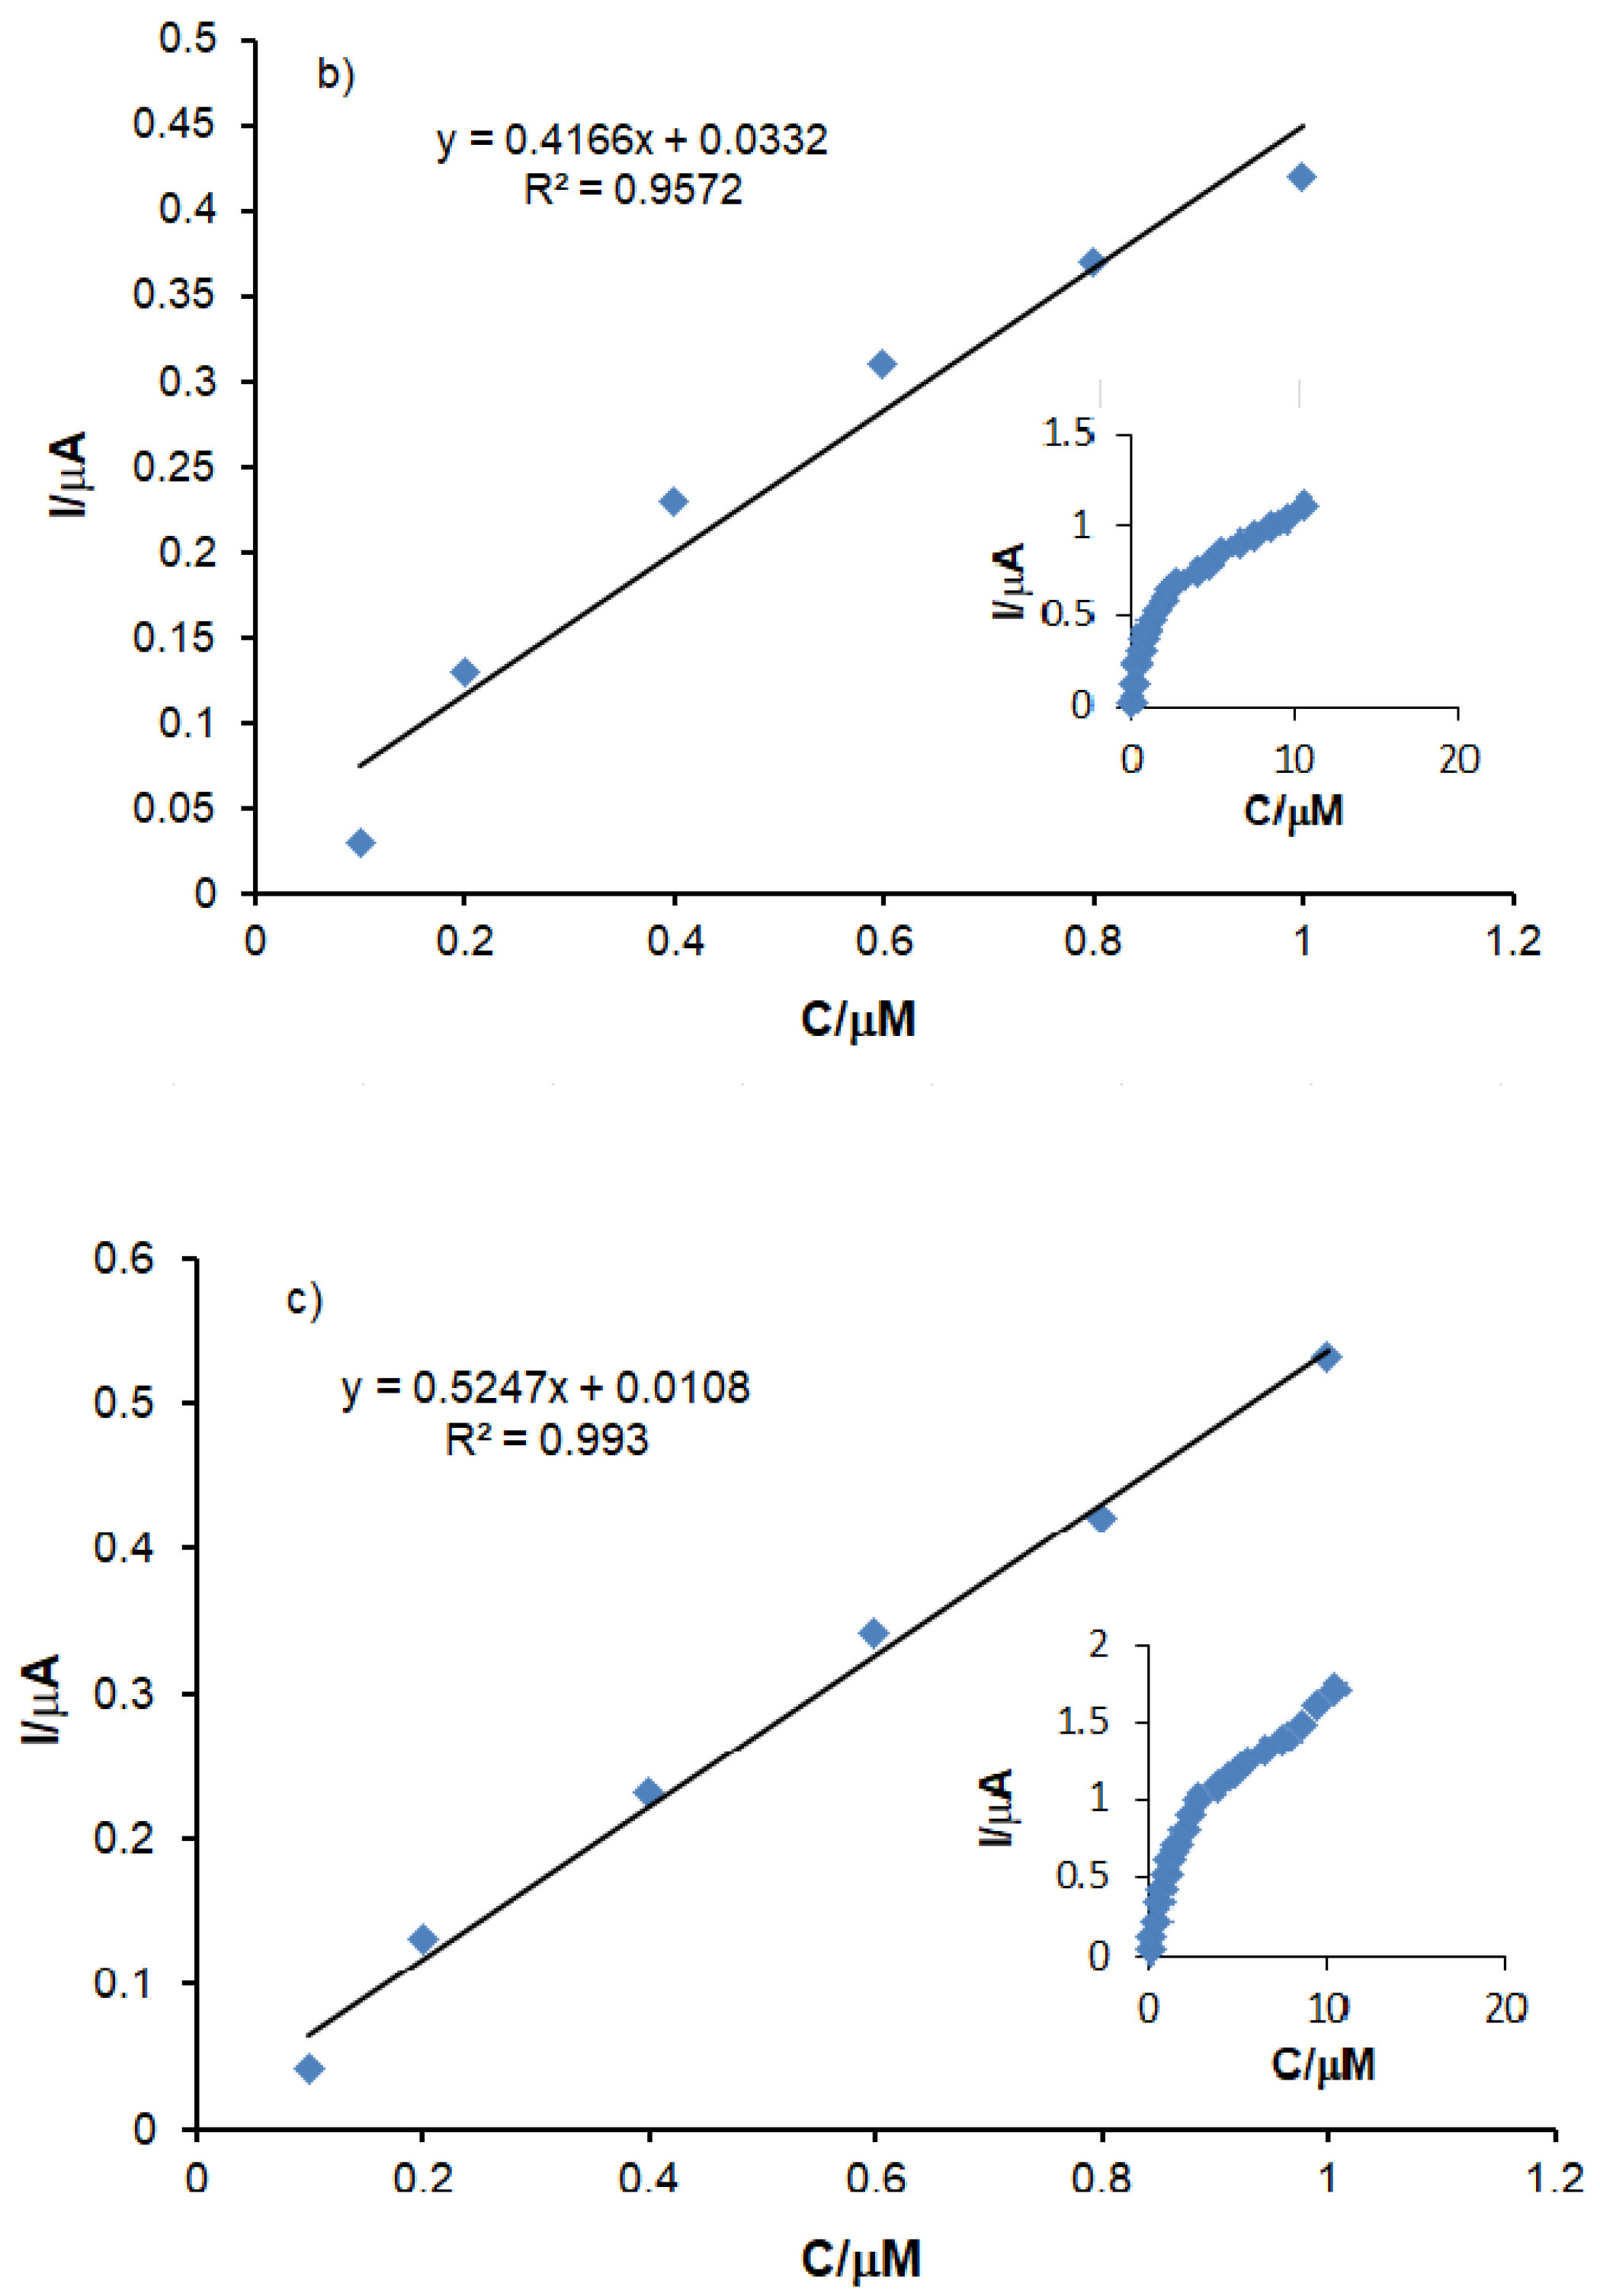
3.4. Preparation of the Calibration Curve
3.5. Stability, Repeatability Interference Studies
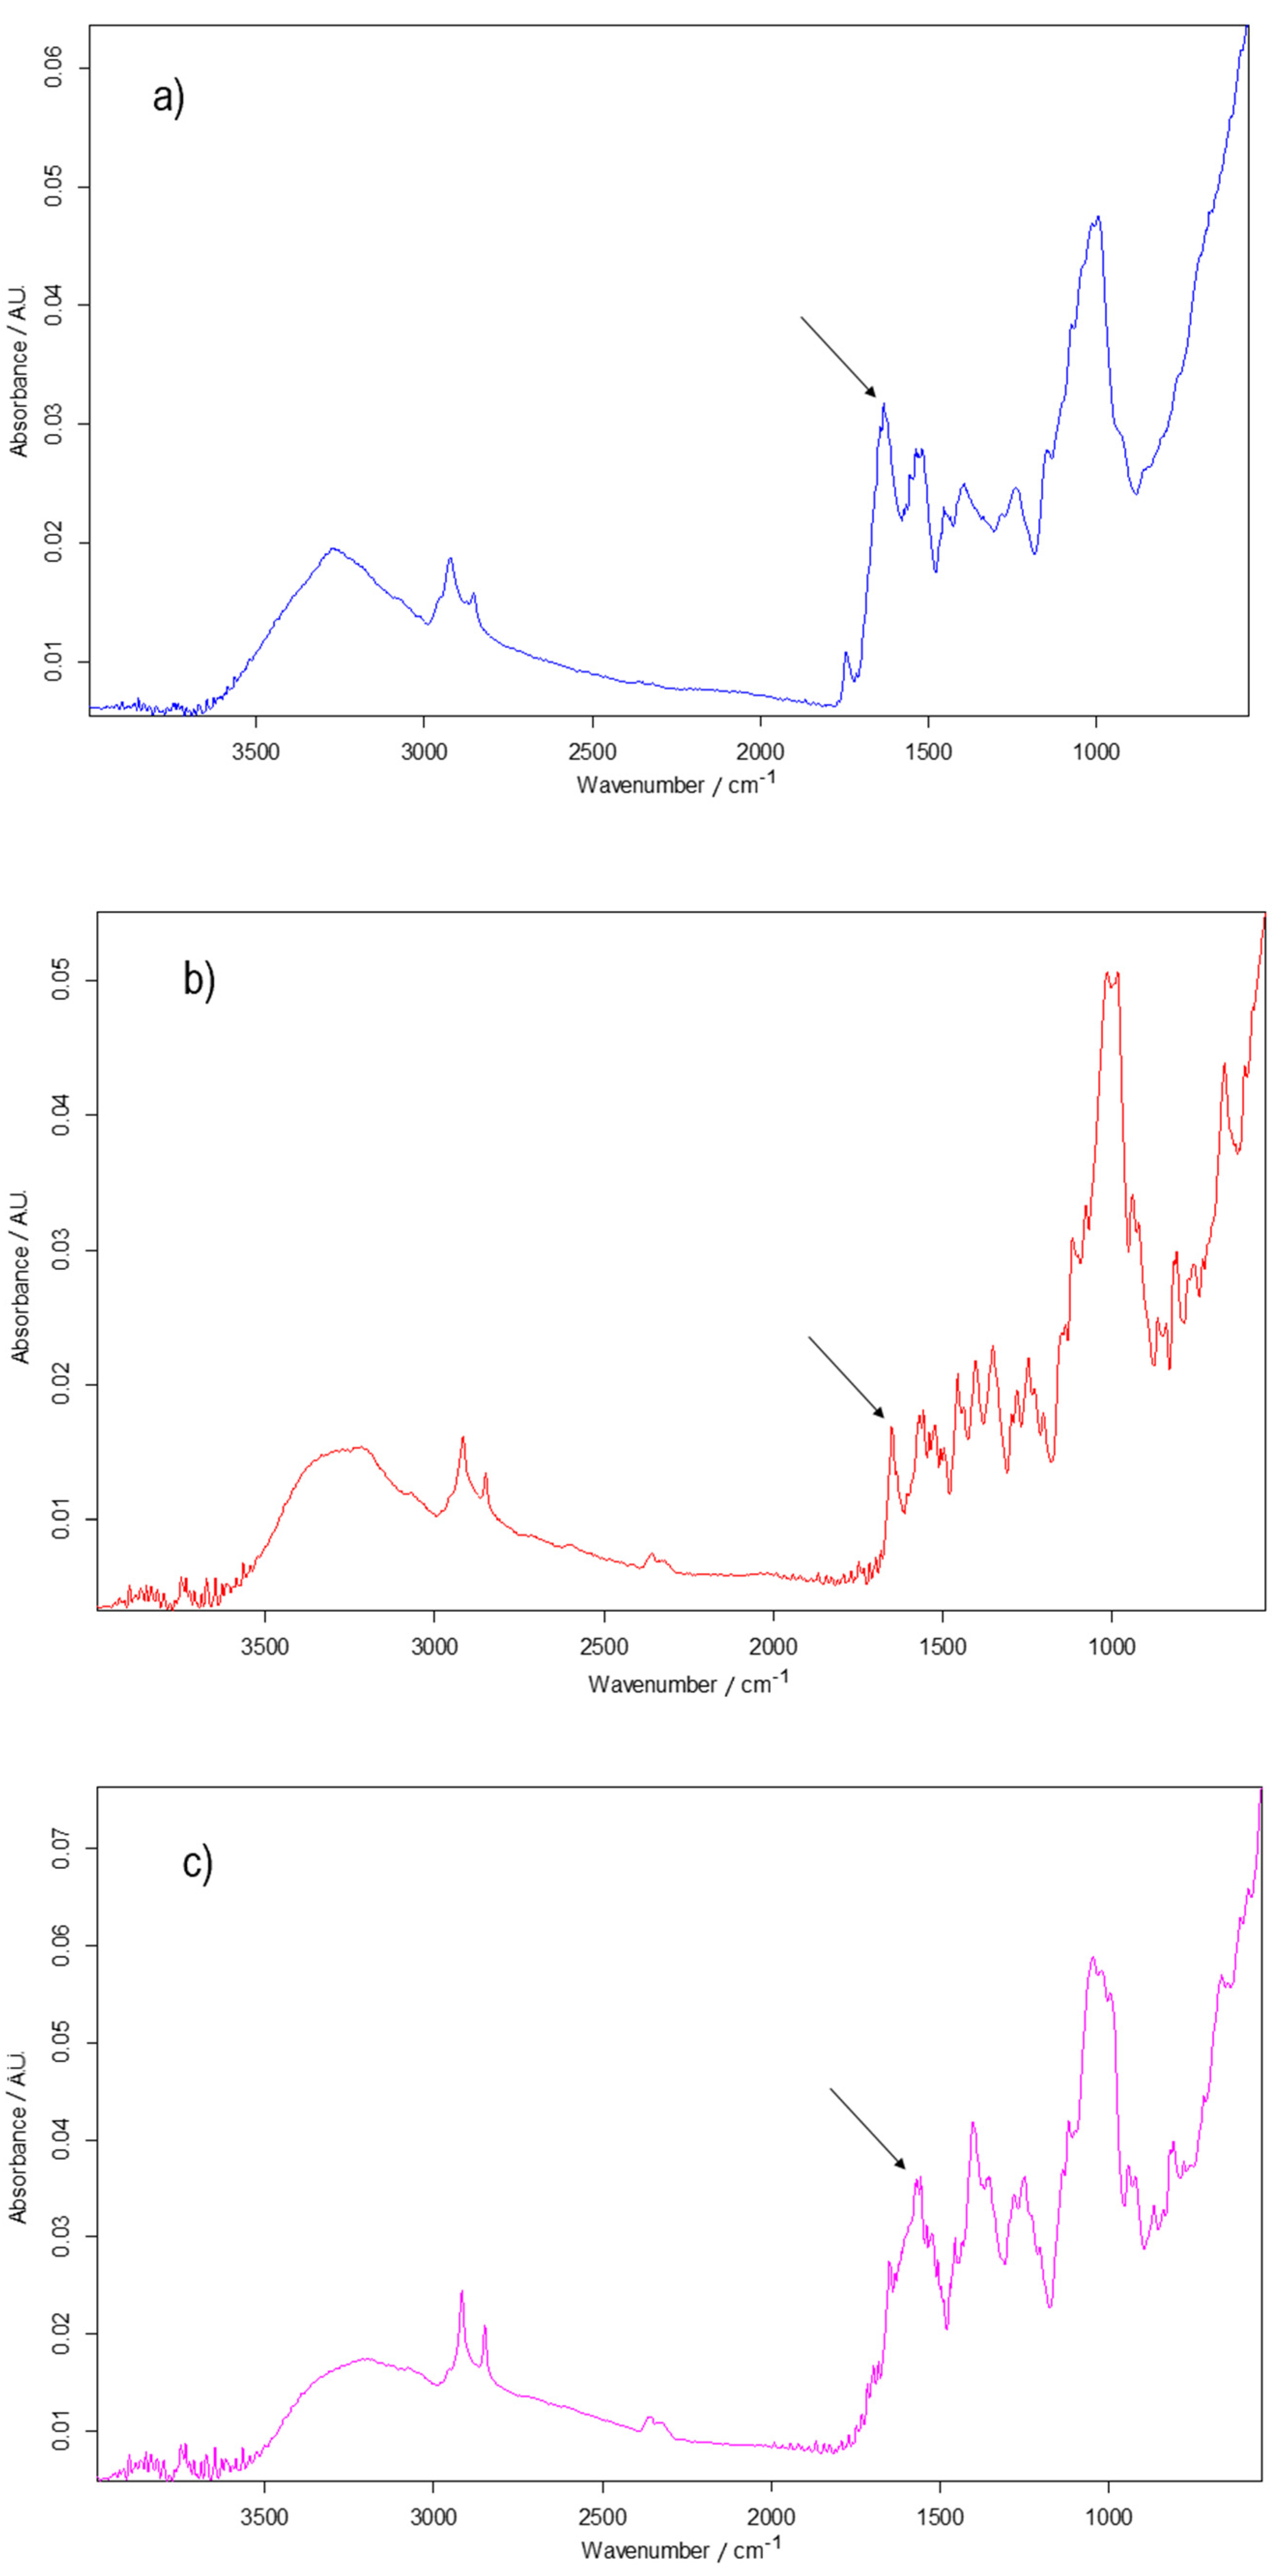
3.6. Levodopa Determination in Real Samples
4. Conclusions
Author Contributions
Funding
Institutional Review Board Statement
Informed Consent Statement
Data Availability Statement
Acknowledgments
Conflicts of Interest
References
- Rai, S.N.; Birla, H.; Zahra, W.; Singh, S.S.; Singh, S.P. Immunomodulation of Parkinson’s Disease Using Mucuna Pruriens (Mp). J. Chem. Neuroanat. 2017, 85, 27–35. [Google Scholar] [CrossRef]
- Poewe, W.; Seppi, K.; Tanner, C.M.; Halliday, G.M.; Brundin, P.; Volkmann, J.; Schrag, A.-E.; Lang, A.E. Parkinson Disease. Nat. Rev. Dis. Prim. 2017, 3, 17013. [Google Scholar] [CrossRef]
- Balestrino, R.; Schapira, A.H.V. Parkinson Disease. Eur. J. Neurol. 2020, 27, 27–42. [Google Scholar] [CrossRef]
- Grandi, L.C.; Di Giovanni, G.; Galati, S. Reprint of “Animal Models of Early-Stage Parkinson’s Disease and Acute Dopamine Deficiency to Study Compensatory Neurodegenerative Mechanisms”. J. Neurosci. Methods 2018, 310, 75–88. [Google Scholar] [CrossRef]
- Cerantola, S.; Caputi, V.; Contarini, G.; Mereu, M.; Bertazzo, A.; Bosi, A.; Banfi, D.; Mantini, D.; Giaroni, C.; Giron, M.C. Dopamine Transporter Genetic Reduction Induces Morpho-Functional Changes in the Enteric Nervous System. Biomedicines 2021, 9, 465. [Google Scholar] [CrossRef] [PubMed]
- Chen, C.; Turnbull, D.M.; Reeve, A.K. Mitochondrial Dysfunction in Parkinson’s Disease—Cause or Consequence? Biology 2019, 8, 38. [Google Scholar] [CrossRef] [Green Version]
- Vidyadhara, D.J.; Lee, J.E.; Chandra, S.S. Role of the Endolysosomal System in Parkinson’s Disease. J. Neurochem. 2019, 150, 487–506. [Google Scholar] [CrossRef] [PubMed] [Green Version]
- Roy, M.-A.; Doiron, M.; Talon-Croteau, J.; Dupré, N.; Simard, M. Effects of Antiparkinson Medication on Cognition in Parkinson’s Disease: A Systematic Review. Can. J. Neurol. Sci. 2018, 45, 375–404. [Google Scholar] [CrossRef] [PubMed]
- Morris, R.; Smulders, K.; Peterson, D.S.; Mancini, M.; Carlson-Kuhta, P.; Nutt, J.G.; Horak, F.B. Cognitive Function in People with and without Freezing of Gait in Parkinson’s Disease. NPJ Parkinson’s Dis. 2020, 6, 9. [Google Scholar] [CrossRef]
- Zhang, Y.; Gao, S.Y. Determination of Picogram Levels of Levodopa in Pharmaceutical Preparations and Biofluids by Flow-Injection Chemiluminescence. AMR 2014, 884–885, 566–569. [Google Scholar] [CrossRef]
- Ganguly, S.; Das, T.K.; Mondal, S.; Das, N.C. Synthesis of Polydopamine-Coated Halloysite Nanotube-Based Hydrogel for Controlled Release of a Calcium Channel Blocker. RSC Adv. 2016, 6, 105350–105362. [Google Scholar] [CrossRef]
- Soumyanath, A.; Denne, T.; Hiller, A.; Ramachandran, S.; Shinto, L. Analysis of Levodopa Content in Commercial Mucuna Pruriens Products Using High-Performance Liquid Chromatography with Fluorescence Detection. J. Altern. Complement. Med. 2018, 24, 182–186. [Google Scholar] [CrossRef] [PubMed]
- Abdel-Ghany, M.F.; Hussein, L.A.; Ayad, M.F.; Youssef, M.M. Investigation of Different Spectrophotometric and Chemometric Methods for Determination of Entacapone, Levodopa and Carbidopa in Ternary Mixture. Spectrochim. Acta Part A Mol. Biomol. Spectrosc. 2017, 171, 236–245. [Google Scholar] [CrossRef] [PubMed]
- Wang, J.; Cui, L.; Han, S.; Hao, F. Size–Dependent Active Effect of Cadmium Telluride Quantum Dots on Luminol–Potassium Periodate Chemiluminescence System for Levodopa Detection. Appl. Spectrosc. 2015, 69, 699–704. [Google Scholar] [CrossRef]
- Miraki, M.; Karimi-Maleh, H.; Taher, M.A.; Cheraghi, S.; Karimi, F.; Agarwal, S.; Gupta, V.K. Voltammetric Amplified Platform Based on Ionic Liquid/NiO Nanocomposite for Determination of Benserazide and Levodopa. J. Mol. Liq. 2019, 278, 672–676. [Google Scholar] [CrossRef]
- Movlaee, K.; Beitollahi, H.; Ganjali, M.R.; Norouzi, P. Electrochemical Platform for Simultaneous Determination of Levodopa, Acetaminophen and Tyrosine Using a Graphene and Ferrocene Modified Carbon Paste Electrode. Microchim. Acta 2017, 184, 3281–3289. [Google Scholar] [CrossRef]
- Beitollahi, H.; Movlaee, K.; Ganjali, M.R.; Norouzi, P.; Hosseinzadeh, R. Application of a Nanostructured Sensor Based on Graphene- and Ethyl 2-(4-Ferrocenyl[1,2,3]Triazol-1-Yl)Acetate-Modified Carbon Paste Electrode for Determination of Methyldopa in the Presence of Phenylephrine and Guaifenesin. Appl. Organomet. Chem. 2018, 32, e4243. [Google Scholar] [CrossRef]
- Bounegru, A.V.; Apetrei, C. Development of a Novel Electrochemical Biosensor Based on Carbon Nanofibers–Gold Nanoparticles–Tyrosinase for the Detection of Ferulic Acid in Cosmetics. Sensors 2020, 20, 6724. [Google Scholar] [CrossRef]
- Hajializadeh, A.; Tajik, S.; Jahani, S.; Beitollahi, H. Synergic Effect of Cu (II) Nanocomplex for the Fabrication of Highly Sensitive Voltammetric Sensor for Levodopa Determination. Anal. Bioanal. Electrochem. 2018, 10, 292–301. [Google Scholar]
- Zapata-Urzúa, C.; Pérez-Ortiz, M.; Bravo, M.; Olivieri, A.C.; Álvarez-Lueje, A. Simultaneous Voltammetric Determination of Levodopa, Carbidopa and Benserazide in Pharmaceuticals Using Multivariate Calibration. Talanta 2010, 82, 962–968. [Google Scholar] [CrossRef]
- Arvand, M.; Abbasnejad, S.; Ghodsi, N. Graphene Quantum Dots Decorated with Fe3O4 Nanoparticles/Functionalized Multiwalled Carbon Nanotubes as a New Sensing Platform for Electrochemical Determination of l-DOPA in Agricultural Products. Anal. Methods 2016, 8, 5861–5868. [Google Scholar] [CrossRef]
- Beitollahi, H.; Safaei, M.; Tajik, S. Electrochemical Deduction of Levodopa by Utilizing Modified Electrodes: A Review. Microchem. J. 2020, 152, 104287. [Google Scholar] [CrossRef]
- Manawi, Y.M.; Ihsanullah; Samara, A.; Al-Ansari, T.; Atieh, M.A. A Review of Carbon Nanomaterials’ Synthesis via the Chemical Vapor Deposition (CVD) Method. Materials 2018, 11, 822. [Google Scholar] [CrossRef] [Green Version]
- Liang, C.; Li, Z.; Dai, S. Mesoporous Carbon Materials: Synthesis and Modification. Angew. Chem. Int. Ed. 2008, 47, 3696–3717. [Google Scholar] [CrossRef] [PubMed]
- Knox, J.H.; Kaur, B.; Millward, G.R. Structure and Performance of Porous Graphitic Carbon in Liquid Chromatography. J. Chromatogr. A 1986, 352, 3–25. [Google Scholar] [CrossRef]
- Lee, K.T.; Ji, X.; Rault, M.; Nazar, L.F. Simple Synthesis of Graphitic Ordered Mesoporous Carbon Materials by a Solid-State Method Using Metal Phthalocyanines. Angew. Chem. 2009, 121, 5771–5775. [Google Scholar] [CrossRef]
- Kyotani, T.; Ma, Z.; Tomita, A. Template Synthesis of Novel Porous Carbons Using Various Types of Zeolites. Carbon 2003, 41, 1451–1459. [Google Scholar] [CrossRef]
- Kaneda, M.; Tsubakiyama, T.; Carlsson, A.; Sakamoto, Y.; Ohsuna, T.; Terasaki, O.; Joo, S.H.; Ryoo, R. Structural Study of Mesoporous MCM-48 and Carbon Networks Synthesized in the Spaces of MCM-48 by Electron Crystallography. J. Phys. Chem. B 2002, 106, 1256–1266. [Google Scholar] [CrossRef]
- Li, F.; Song, J.; Shan, C.; Gao, D.; Xu, X.; Niu, L. Electrochemical Determination of Morphine at Ordered Mesoporous Carbon Modified Glassy Carbon Electrode. Biosens. Bioelectron. 2010, 25, 1408–1413. [Google Scholar] [CrossRef]
- Zhang, Y.; Waterhouse, G.I.N.; Xiang, Z.; Che, J.; Chen, C.; Sun, W. A Highly Sensitive Electrochemical Sensor Containing Nitrogen-Doped Ordered Mesoporous Carbon (NOMC) for Voltammetric Determination of l-Tryptophan. Food Chem. 2020, 326, 126976. [Google Scholar] [CrossRef]
- Zhou, M.; Ding, J.; Guo, L.; Shang, Q. Electrochemical Behavior of l -Cysteine and Its Detection at Ordered Mesoporous Carbon-Modified Glassy Carbon Electrode. Anal. Chem. 2007, 79, 5328–5335. [Google Scholar] [CrossRef] [PubMed]
- Wang, L.; Teng, Q.; Sun, X.; Chen, Y.; Wang, Y.; Wang, H.; Zhang, Y. Facile Synthesis of Metal-Organic Frameworks/Ordered Mesoporous Carbon Composites with Enhanced Electrocatalytic Ability for Hydrazine. J. Colloid Interface Sci. 2018, 512, 127–133. [Google Scholar] [CrossRef]
- Wang, M.; Liu, Y.; Yang, L.; Tian, K.; He, L.; Zhang, Z.; Jia, Q.; Song, Y.; Fang, S. Bimetallic Metal–Organic Framework Derived FeO /TiO2 Embedded in Mesoporous Carbon Nanocomposite for the Sensitive Electrochemical Detection of 4-Nitrophenol. Sens. Actuators B Chem. 2019, 281, 1063–1072. [Google Scholar] [CrossRef]
- Gwent Group. Leaders in Paste Manufacturing, Sensor/Biosensor Development and Instrumentation. Available online: http://www.gwent.org/gem_screen_printing.html (accessed on 25 February 2020).
- Metrohm DropSens. Screen-Printed Electrodes. Available online: http://www.dropsens.com/en/screen_printed_electrodes_pag.html (accessed on 18 August 2021).
- Fanjul-Bolado, P.; Hernández-Santos, D.; Lamas-Ardisana, P.J.; Martín-Pernía, A.; Costa-García, A. Electrochemical Characterization of Screen-Printed and Conventional Carbon Paste Electrodes. Electrochim. Acta 2008, 53, 3635–3642. [Google Scholar] [CrossRef]
- Apetrei, I.M.; Apetrei, C. Voltammetric Determination of Melatonin Using a Graphene-Based Sensor in Pharmaceutical Products. Int. J. Nanomed. 2016, 11, 1859–1866. [Google Scholar] [CrossRef] [Green Version]
- Taurino, I.; Carrara, S.; Giorcelli, M.; Tagliaferro, A.; De Micheli, G. Comparison of Two Different Carbon Nanotube-Based Surfaces with Respect to Potassium Ferricyanide Electrochemistry. Surf. Sci. 2012, 606, 156–160. [Google Scholar] [CrossRef] [Green Version]
- Jia, N.; Wang, Z.; Yang, G.; Shen, H.; Zhu, L. Electrochemical Properties of Ordered Mesoporous Carbon and Its Electroanalytical Application for Selective Determination of Dopamine. Electrochem. Commun. 2007, 9, 233–238. [Google Scholar] [CrossRef]
- Heidari, H.; Habibi, B.; Vaigan, F.B. Glassy Carbon Electrode Modified with an Ordered Mesoporous Carbon/Ag Nanoparticle Nanocomposite for the Selective Detection of Iodate. Anal. Methods 2016, 8, 4406–4412. [Google Scholar] [CrossRef]
- Qiu, Y.; Huo, J.; Jia, F.; Shanks, B.E.; Li, W. N- and S-Doped Mesoporous Carbon as Metal-Free Cathode Catalysts for Direct Biorenewable Alcohol Fuel Cells. J. Mater. Chem. A 2016, 4, 83–95. [Google Scholar] [CrossRef] [Green Version]
- Tabacaru, A.; Colombo, V.; Apetrei, C. Development of Sensor Based on Copper(II) Thiocyanate Pyridine Polymeric Complex for Detection of Catechol. IEEE Sens. J. 2019, 19, 10198–10206. [Google Scholar] [CrossRef]
- Wang, Q.; Das, M.R.; Li, M.; Boukherroub, R.; Szunerits, S. Voltammetric Detection of L-Dopa and Carbidopa on Graphene Modified Glassy Carbon Interfaces. Bioelectrochemistry 2013, 93, 15–22. [Google Scholar] [CrossRef]
- Kul, D.; Brett, C.M.A. Electrochemical Investigation and Determination of Levodopa on Poly(Nile Blue-A)/Multiwalled Carbon Nanotube Modified Glassy Carbon Electrodes. Electroanalysis 2014, 26, 1320–1325. [Google Scholar] [CrossRef]
- Liu, X.; Zhang, Z.; Cheng, G.; Dong, S. Spectroelectrochemical and Voltammetric Studies of L-DOPA. Electroanalysis 2003, 15, 103–107. [Google Scholar] [CrossRef]
- Shyam Sunder, G.S.; Rohanifar, A.; Devasurendra, A.M.; Kirchhoff, J.R. Selective Determination of L-DOPA at a Graphene Oxide/Yttrium Oxide Modified Glassy Carbon Electrode. Electrochim. Acta 2019, 301, 192–199. [Google Scholar] [CrossRef]
- Yan, X.; Pan, D.; Wang, H.; Bo, X.; Guo, L. Electrochemical Determination of L-Dopa at Cobalt Hexacyanoferrate/Large-Mesopore Carbon Composite Modified Electrode. J. Electroanal. Chem. 2011, 663, 36–42. [Google Scholar] [CrossRef]
- Raoof, J.B.; Ojani, R.; Amiri-Aref, M.; Baghayeri, M. Electrodeposition of Quercetin at a Multi-Walled Carbon Nanotubes Modified Glassy Carbon Electrode as a Novel and Efficient Voltammetric Sensor for Simultaneous Determination of Levodopa, Uric Acid and Tyramine. Sens. Actuators B Chem. 2012, 166–167, 508–518. [Google Scholar] [CrossRef]
- Dai, M.; Song, L.; LaBelle, J.T.; Vogt, B.D. Ordered Mesoporous Carbon Composite Films Containing Cobalt Oxide and Vanadia for Electrochemical Applications. Chem. Mater. 2011, 23, 2869–2878. [Google Scholar] [CrossRef]
- Yaghoubian, H.; Karimi-Maleh, H.; Khalilzadeh, M.A.; Karimi, F. Electrocatalytic Oxidation of Levodopa at a Ferrocene Modified Carbon Nanotube Paste Electrode. Int. J. Electrochem. Sci. 2009, 4, 11. [Google Scholar]
- Teixeira, M.F.S.; Marcolino-Júnior, L.H.; Fatibello-Filho, O.; Dockal, E.R.; Bergamini, M.F. An Electrochemical Sensor for L-Dopa Based on Oxovanadium-Salen Thin Film Electrode Applied Flow Injection System. Sens. Actuators B Chem. 2007, 122, 549–555. [Google Scholar] [CrossRef]
- Bergamini, M.F.; Santos, A.L.; Stradiotto, N.R.; Zanoni, M.V.B. A Disposable Electrochemical Sensor for the Rapid Determination of Levodopa. J. Pharm. Biomed. Anal. 2005, 39, 54–59. [Google Scholar] [CrossRef]
- Leite, F.R.F.; Maroneze, C.M.; de Oliveira, A.B.; dos Santos, W.T.P.; Damos, F.S.; de Cássia Silva Luz, R. Development of a Sensor for L-Dopa Based on Co(DMG)2ClPy/Multi-Walled Carbon Nanotubes Composite Immobilized on Basal Plane Pyrolytic Graphite Electrode. Bioelectrochemistry 2012, 86, 22–29. [Google Scholar] [CrossRef] [PubMed]
- Shahrokhian, S.; Asadian, E. Electrochemical Determination of L-Dopa in the Presence of Ascorbic Acid on the Surface of the Glassy Carbon Electrode Modified by a Bilayer of Multi-Walled Carbon Nanotube and Poly-Pyrrole Doped with Tiron. J. Electroanal. Chem. 2009, 636, 40–46. [Google Scholar] [CrossRef]
- Arvand, M.; Ghodsi, N. A Voltammetric Sensor Based on Graphene-Modified Electrode for the Determination of Trace Amounts of l-Dopa in Mouse Brain Extract and Pharmaceuticals. J. Solid State Electrochem. 2013, 17, 775–784. [Google Scholar] [CrossRef]
- Bounegru, A.V.; Apetrei, C. Voltammetric Sensors Based on Nanomaterials for Detection of Caffeic Acid in Food Supplements. Chemosensors 2020, 8, 41. [Google Scholar] [CrossRef]
- Chrisikou, I.; Orkoula, M.; Kontoyannis, C. FT-IR/ATR Solid Film Formation: Qualitative and Quantitative Analysis of a Piperacillin-Tazobactam Formulation. Molecules 2020, 25, 6051. [Google Scholar] [CrossRef]
- Ledeti, I.; Bolintineanu, S.; Vlase, G.; Circioban, D.; Ledeti, A.; Vlase, T.; Suta, L.-M.; Caunii, A.; Murariu, M. Compatibility Study between Antiparkinsonian Drug Levodopa and Excipients by FTIR Spectroscopy, X-Ray Diffraction and Thermal Analysis. J. Therm. Anal. Calorim. 2017, 130, 433–441. [Google Scholar] [CrossRef]
- PubChem. Levodopa. Available online: https://pubchem.ncbi.nlm.nih.gov/compound/6047 (accessed on 29 June 2021).


| Sensor | Ia 1 (µA) | Ic 2 (µA) | Ic/Ia | Ea 3 (V) | Ec 4 (V) | E1/2 5 (V) | ΔE 6 (V) |
|---|---|---|---|---|---|---|---|
| C-SPCE | 24.01 | −25.99 | 1.082 | 0.452 | 0.003 | 0.227 | 0.449 |
| MC-SPCE | 42.92 | −48.51 | 1.13 | 0.275 | 0.171 | 0.223 | 0.104 |
| OMC-SPCE | 43.38 | −50.00 | 1.152 | 0.298 | 0.155 | 0.226 | 0.143 |
| Sensor | Ipa vs. v1/2 | R2 | A (cm2) | Roughness Factor |
|---|---|---|---|---|
| C-SPCE | Ipa (A) = 6.96 × 10⁻⁵ v1/2 (V·s−1)1/2 + 2.00 × 10⁻⁶ | 0.9999 | 0.0962 | 0.76603 |
| MC-SPCE | Ipa (A)= 1.81 × 10⁻⁴ v1/2 (V·s−1)1/2 − 1.88 × 10⁻⁵ | 0.9962 | 0.2511 | 1.99922 |
| OMC-SPCE | Ipa (A) = 1.93 × 10⁻⁴ v1/2 (V·s−1)1/2 − 2.16 × 10⁻⁵ | 0.9971 | 0.2667 | 2.12365 |
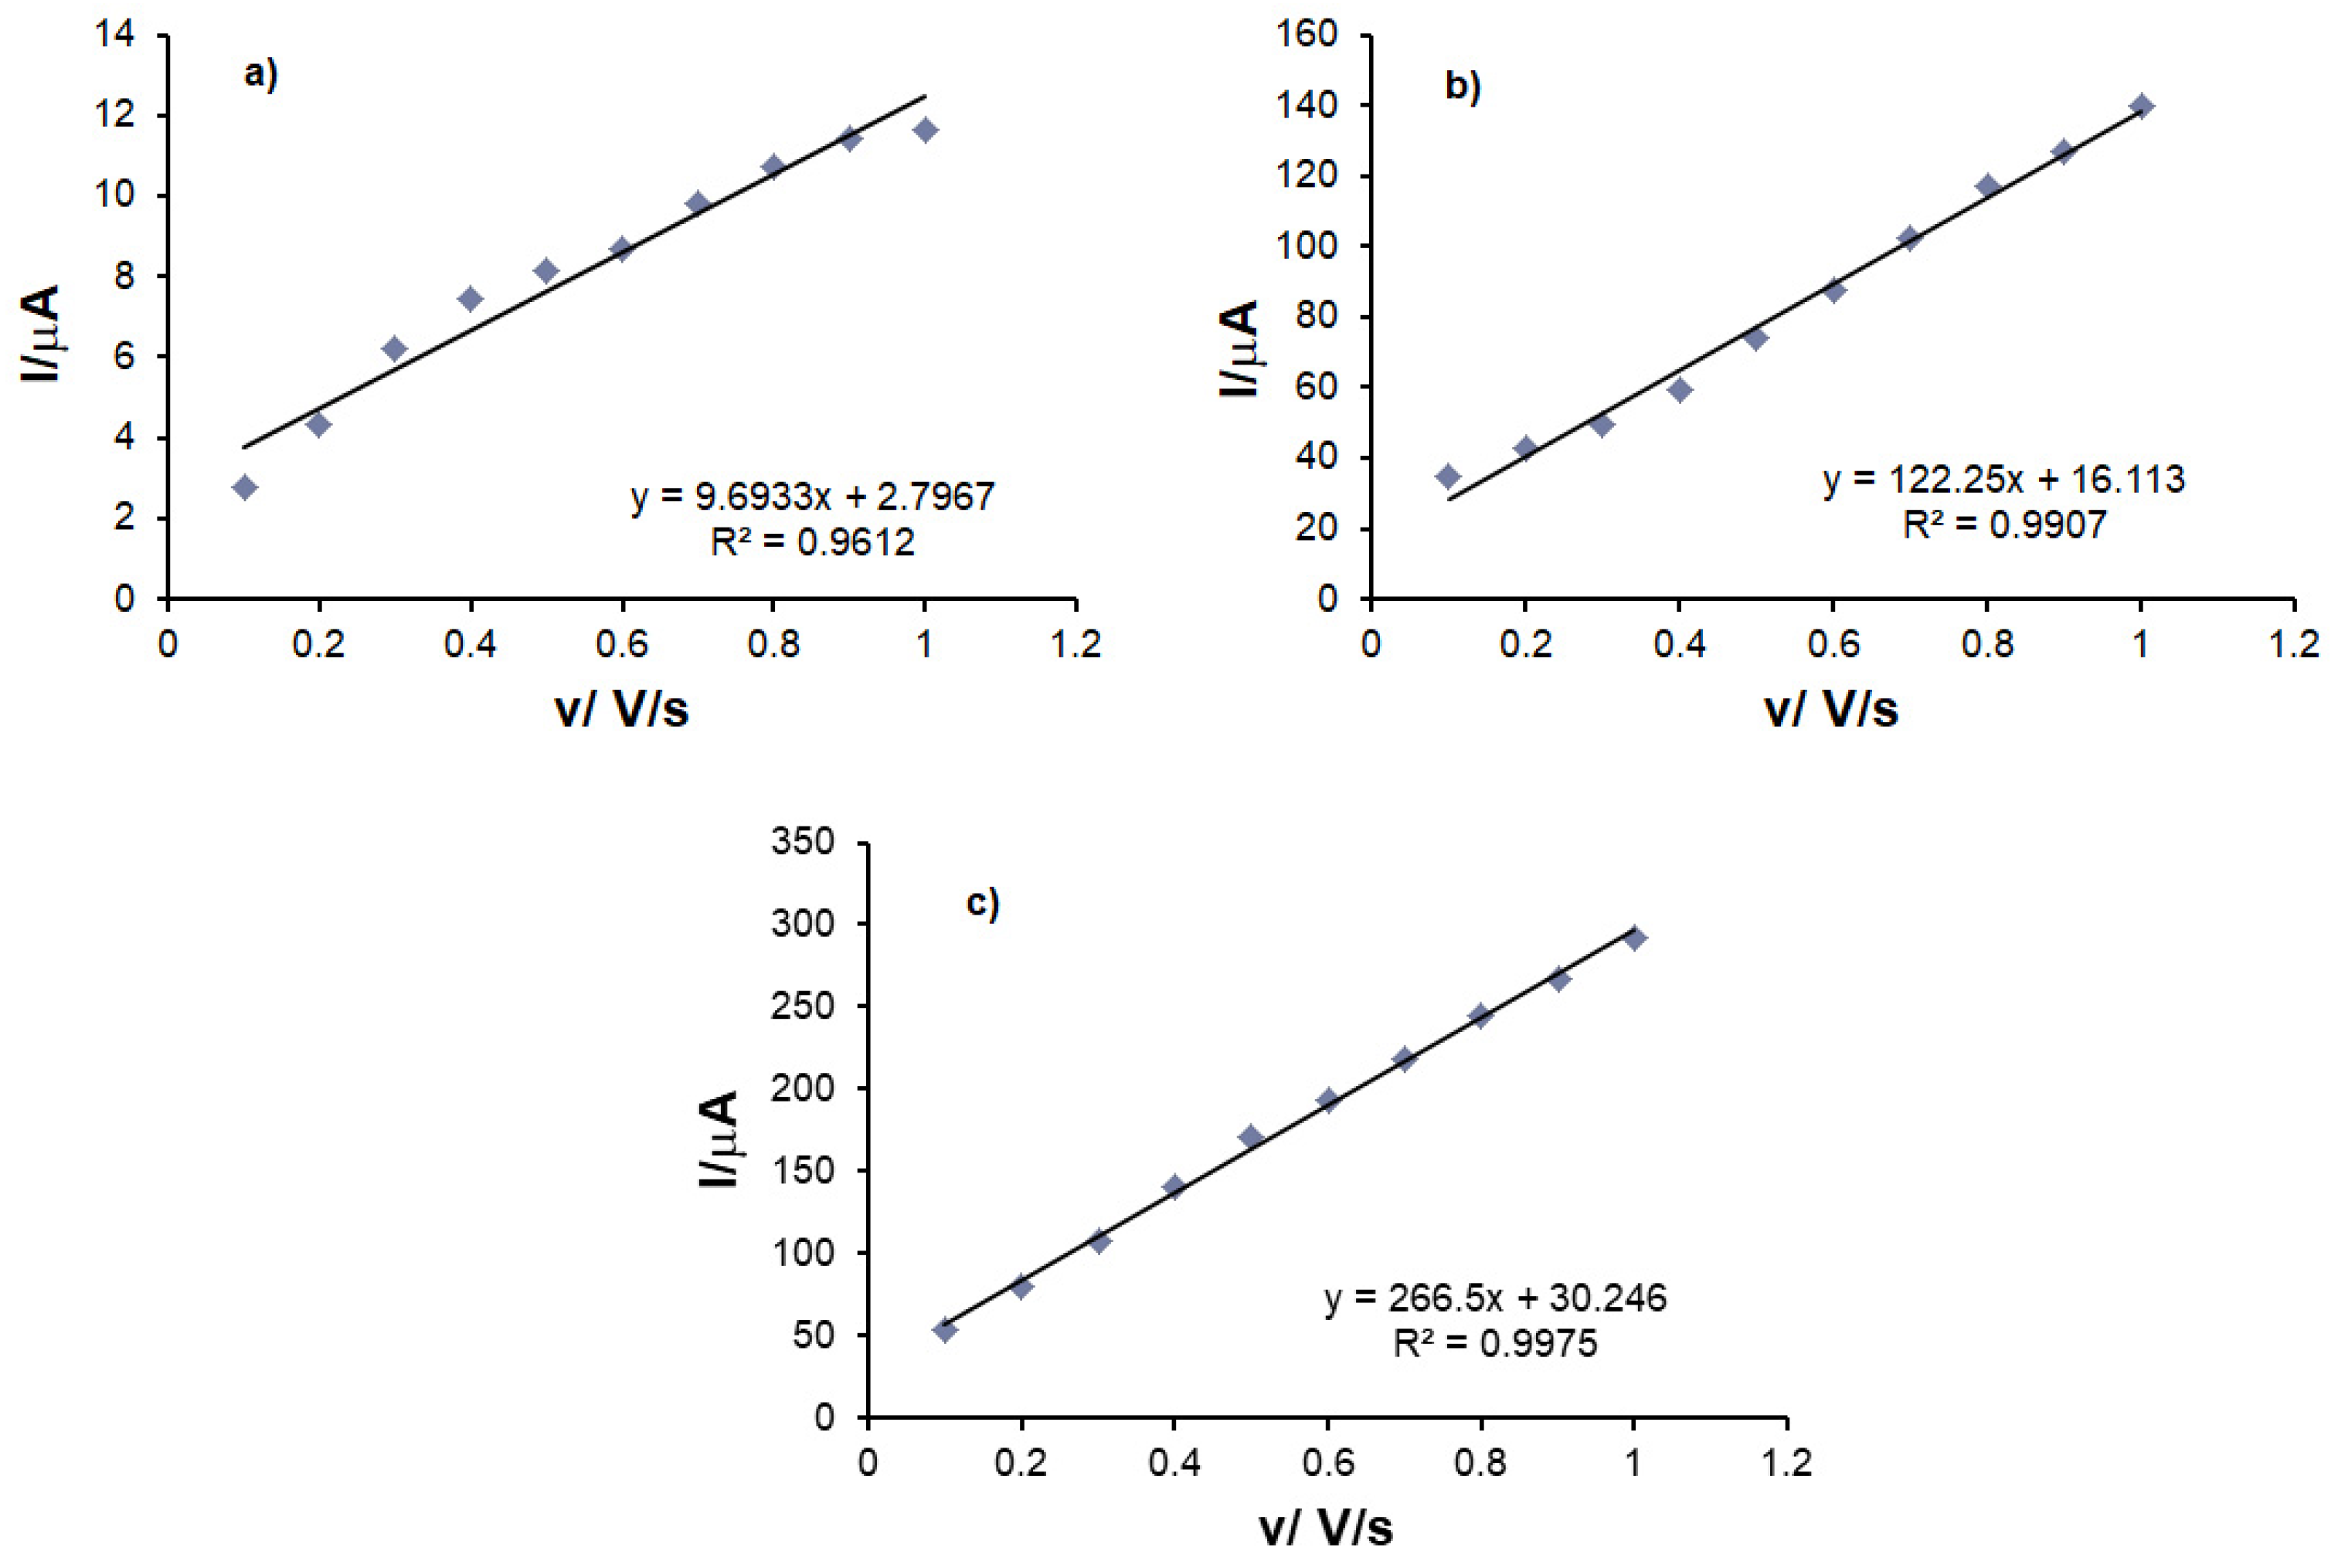
| Sensor | Linear Equation | R2 | Г (mol × cm−2) |
|---|---|---|---|
| C-SPCE | I = 9.693 × 10⁻⁶ v + 2.796 × 10⁻⁶ | 0.9612 | 2.45 × 10⁻¹¹ |
| MC-SPCE | I = 1.222 × 10⁻⁴ v + 1.611 × 10⁻⁵ | 0.9907 | 1.19 × 10⁻¹⁰ |
| OMC-SPCE | I = 2.665 × 10⁻⁴ v + 3.024 × 10⁻⁵ | 0.9975 | 2.43 × 10⁻¹⁰ |
| Sensor | Calibration Linear Equation | LOD (M) | LOQ (M) |
|---|---|---|---|
| C-SPCE | y = 0.4394 x + 0.0431 | 1.23 × 10⁻⁶ | 4.11 × 10⁻⁶ |
| MC-SPCE | y = 0.4166 x + 0.0332 | 4.44 × 10⁻⁷ | 1.48 × 10⁻⁶ |
| OMC-SPCE | y = 0.5247 x + 0.0108 | 2.90 × 10⁻⁷ | 9.66 × 10⁻⁷ |
| Modified Electrode | Detection Technique | Linearity Range/μM | LOD/μM | Ref |
|---|---|---|---|---|
| FCMPNE a | DPV | 2–500 | 1.200 | [50] |
| Oxovanadium–salen thin film/GPE b | CV | 1–100 | 0.800 | [51] |
| Gold Screen Printed | CV | 99–1200 | 68.000 | [52] |
| Co(DMG)2ClPy − MWCNT/BPPG c | CV SWV | 3–100 | 0.860 | [53] |
| PPy − MWCNTs/GCE d | CV | 1–100 | 0.100 | [54] |
| MWCNT/PNB/GCE e | DPV | 1–100 | 0.370 | [44] |
| TNF/GO/GCE f | DPV | 0.04–79 | 0.022 | [55] |
| C-SPCE | CV | 0.1–1 | 1.230 | This work |
| MC-SPCE | 0.447 | |||
| OMC-SPCE | 0.290 |
| Interferent | Interferent Concentration | Recovery/% | RSD/% |
|---|---|---|---|
| L-phenylalanine | 1.0 × 10⁻⁵ M | 105.13 | 3.50 |
| L-tyrosine | 1.0 × 10⁻⁵ M | 101.25 | 1.14 |
| L-tryptophan | 1.0 × 10⁻⁵ M | 101.00 | 0.83 |
| Dietary Supplement | c% Levodopa FTIR | RSD (%) | c% Levodopa CV | RSD (%) |
|---|---|---|---|---|
| Bio RawFoods | 1.32 ± 0.05 | 3.45 | 1.04 ± 0.03 | 3.23 |
| Haya Labs | 2.30 ± 0.07 | 2.85 | 2.26 ± 0.06 | 2.65 |
| Now foods | 2.53 ± 0.02 | 2.78 | 2.61 ± 0.07 | 2.75 |
Publisher’s Note: MDPI stays neutral with regard to jurisdictional claims in published maps and institutional affiliations. |
© 2021 by the authors. Licensee MDPI, Basel, Switzerland. This article is an open access article distributed under the terms and conditions of the Creative Commons Attribution (CC BY) license (https://creativecommons.org/licenses/by/4.0/).
Share and Cite
Dăscălescu, D.; Apetrei, C. Voltammetric Determination of Levodopa Using Mesoporous Carbon—Modified Screen-Printed Carbon Sensors. Sensors 2021, 21, 6301. https://doi.org/10.3390/s21186301
Dăscălescu D, Apetrei C. Voltammetric Determination of Levodopa Using Mesoporous Carbon—Modified Screen-Printed Carbon Sensors. Sensors. 2021; 21(18):6301. https://doi.org/10.3390/s21186301
Chicago/Turabian StyleDăscălescu, Dorin, and Constantin Apetrei. 2021. "Voltammetric Determination of Levodopa Using Mesoporous Carbon—Modified Screen-Printed Carbon Sensors" Sensors 21, no. 18: 6301. https://doi.org/10.3390/s21186301
APA StyleDăscălescu, D., & Apetrei, C. (2021). Voltammetric Determination of Levodopa Using Mesoporous Carbon—Modified Screen-Printed Carbon Sensors. Sensors, 21(18), 6301. https://doi.org/10.3390/s21186301