
Assessment of Dispersion and Bubble Entropy Measures for Enhancing Preterm Birth Prediction Based on Electrohysterographic Signals

 ,
,  , ,
, ,
Abstract
:1. Introduction
2. Materials and Methods
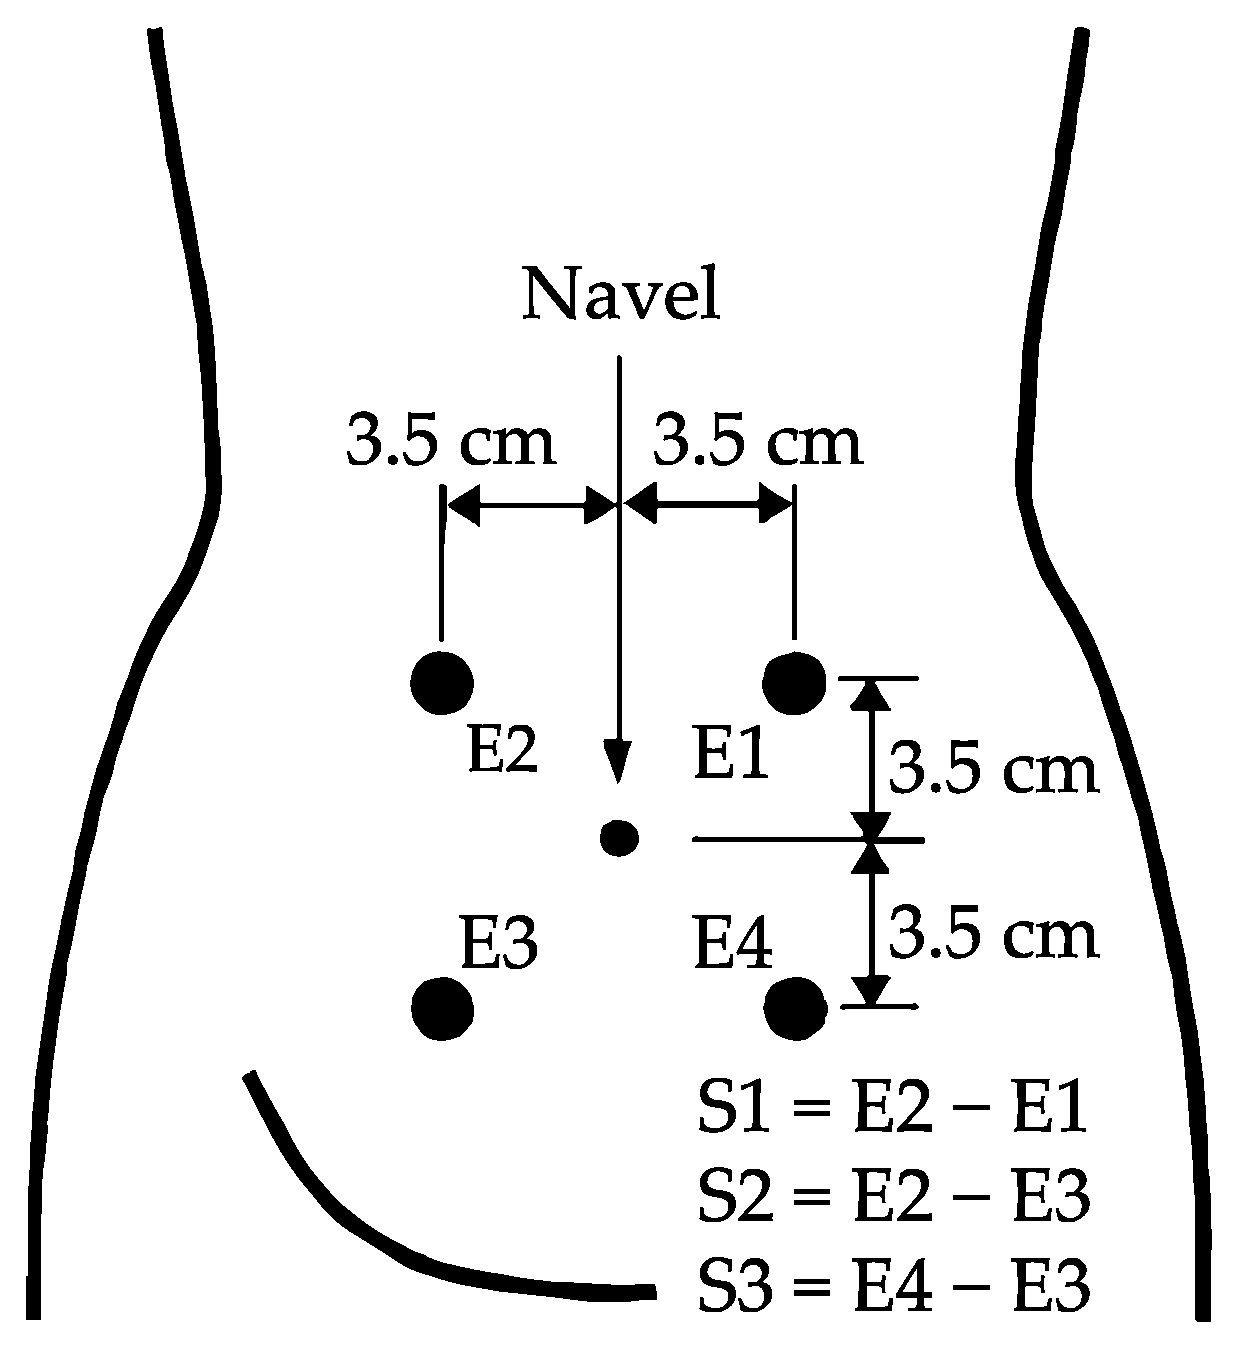
2.1. Database Description
2.2. EHG Signal Analysis
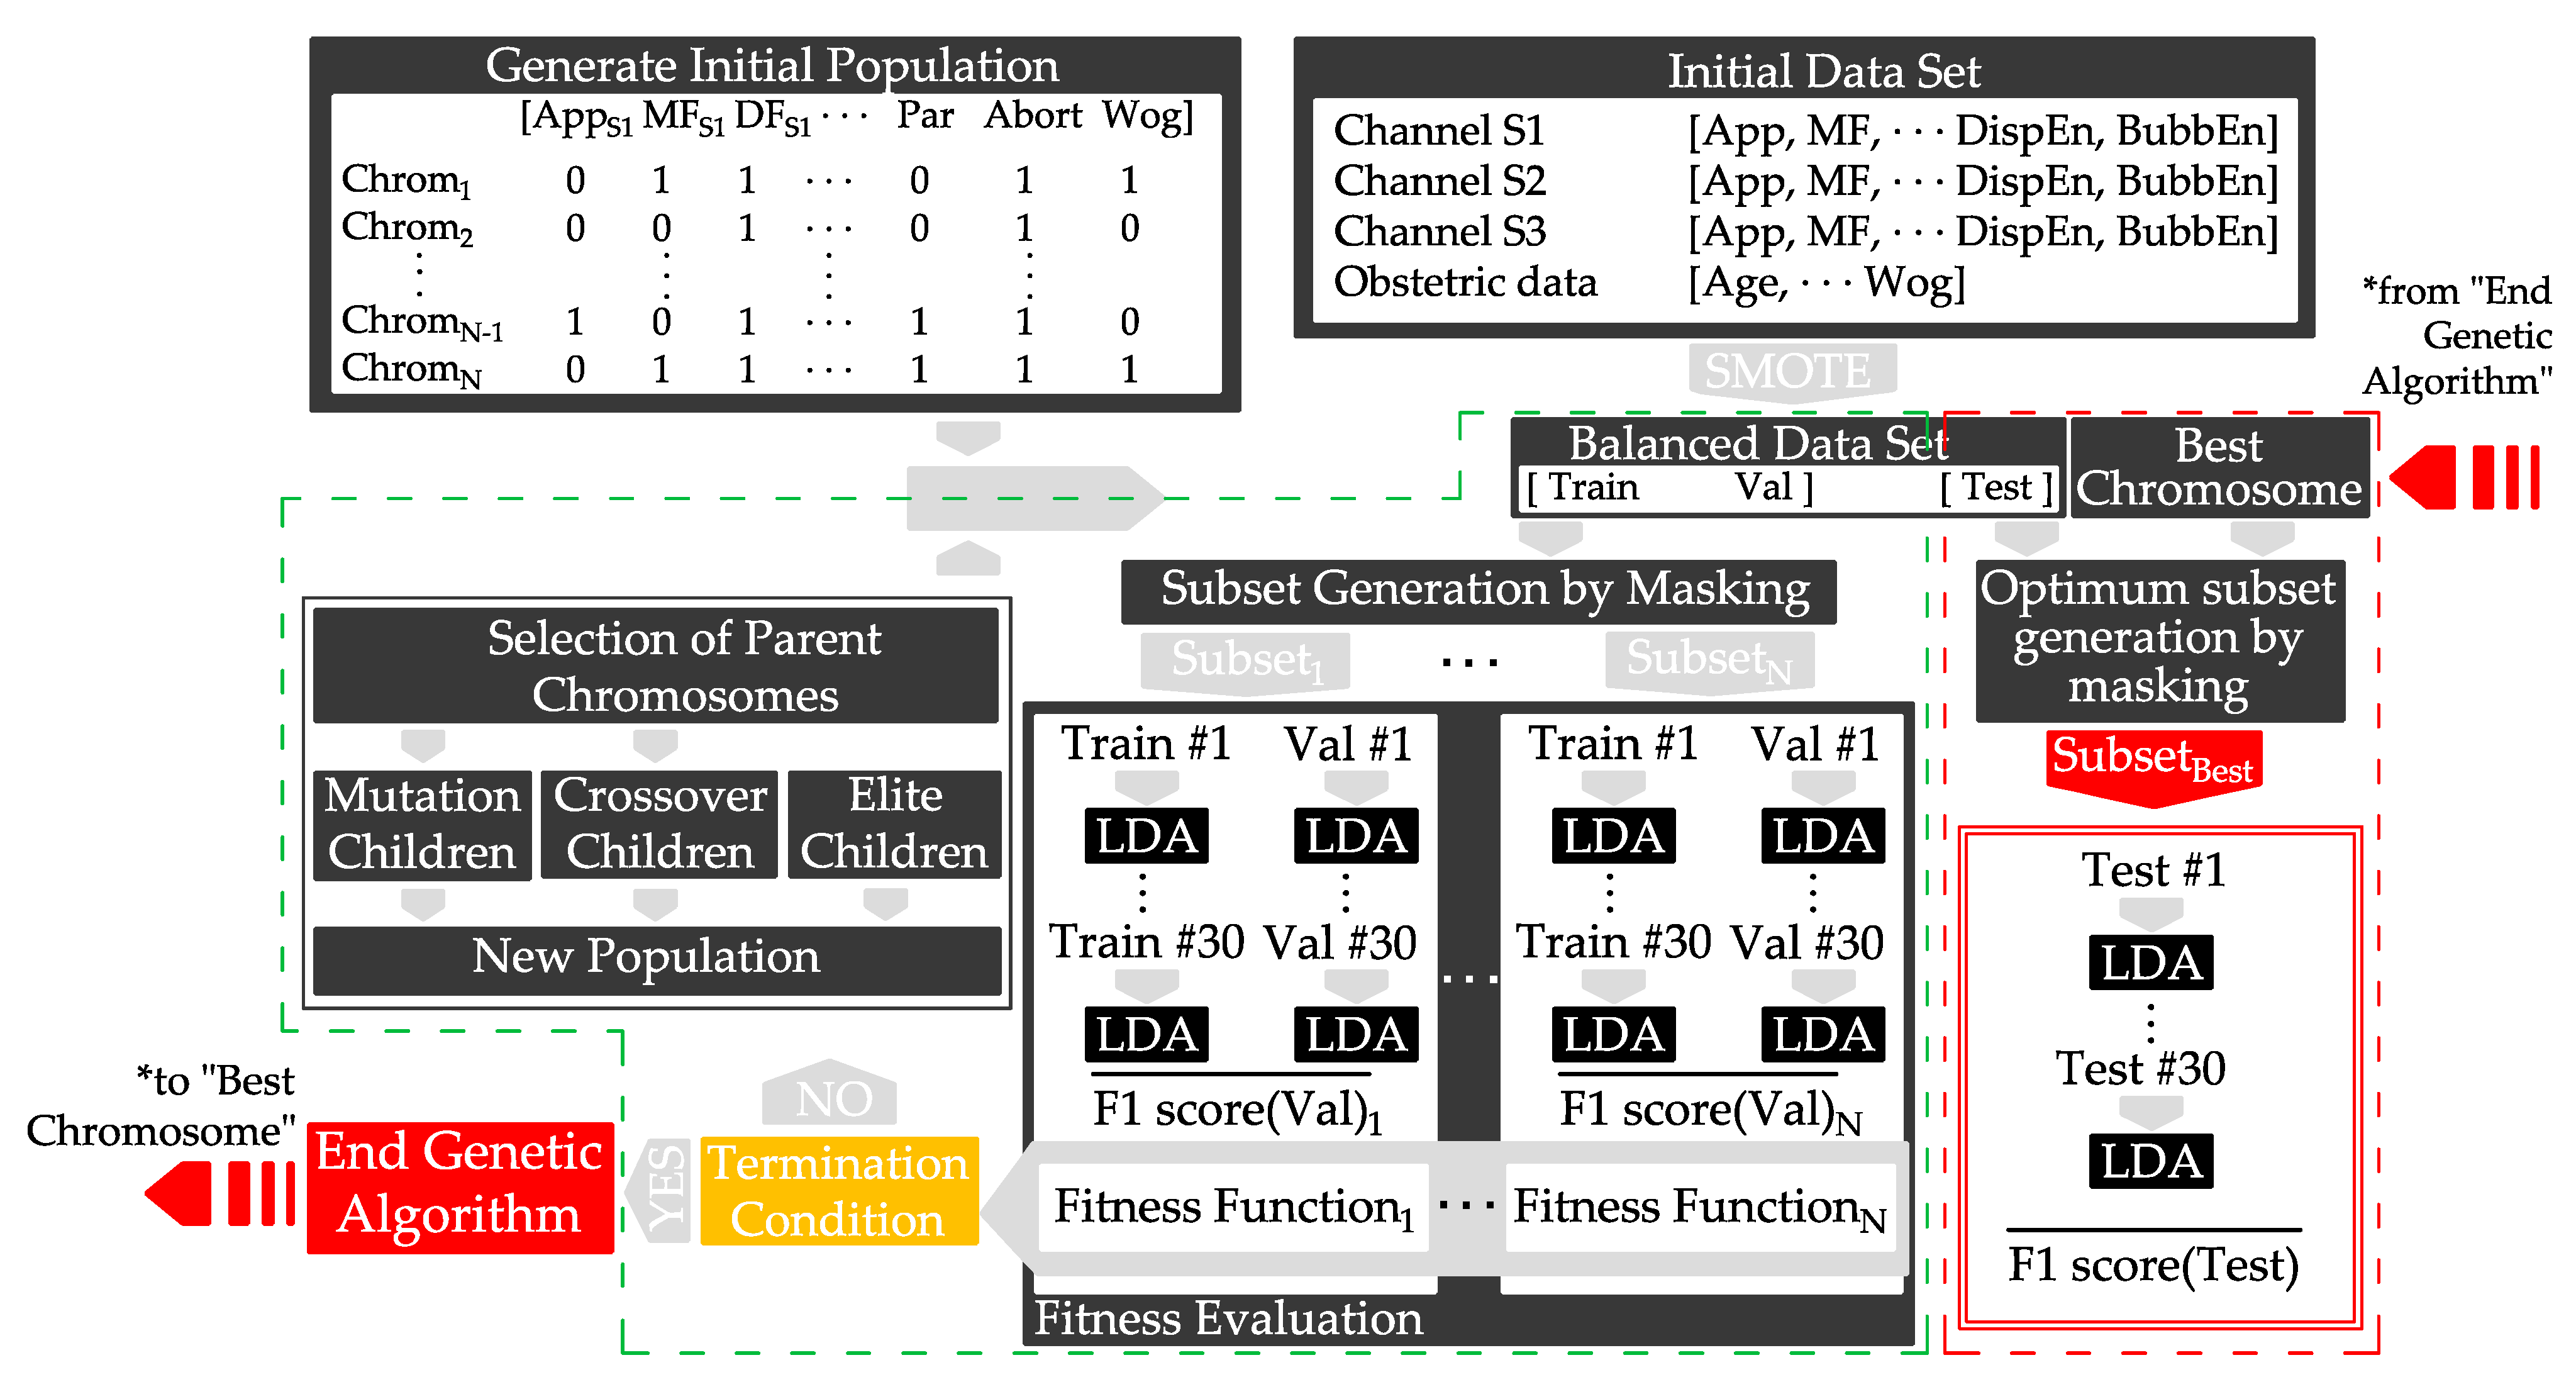
2.3. Classifier Design and Evaluation
- NFeat is the number of features of the initial set.
- NCFeat is the number of features of the current subset.
3. Results
4. Discussion
5. Conclusions
Author Contributions
Funding
Institutional Review Board Statement
Informed Consent Statement
Data Availability Statement
Conflicts of Interest
References
- Leung, C. Born too soon. Neuroendocrinol. Lett. 2004, 25, 133–136. [Google Scholar] [CrossRef]
- Vogel, J.P.; Chawanpaiboon, S.; Moller, A.-B.; Watananirun, K.; Bonet, M.; Lumbiganon, P. The global epidemiology of preterm birth. Best Pract. Res. Clin. Obstet. Gynaecol. 2018, 52, 3–12. [Google Scholar] [CrossRef]
- Goldenberg, R.L.; Culhane, J.F.; Iams, J.D.; Romero, R. Epidemiology and causes of preterm birth. Lancet 2008, 371, 75–84. [Google Scholar] [CrossRef]
- Mandy, G.T. Short-term complications of the preterm infant. UpToDate 2019, 46, 1–17. [Google Scholar]
- Petrou, S.; Yiu, H.H.; Kwon, J. Economic consequences of preterm birth: A systematic review of the recent literature (2009–2017). Arch. Dis. Child. 2019, 104, 456–465. [Google Scholar] [CrossRef] [PubMed]
- Johnston, K.M.; Gooch, K.; Korol, E.; Vo, P.; Eyawo, O.; Bradt, P.; Levy, A. The economic burden of prematurity in Canada. BMC Pediatr. 2014, 14, 1–10. [Google Scholar] [CrossRef] [Green Version]
- Thanh, N.X.; Toye, J.; Savu, A.; Kumar, M.; Kaul, P. Health service use and costs associated with low birth weight—A population level analysis. J. Pediatr. 2015, 167, 551–556. [Google Scholar] [CrossRef] [PubMed]
- Garcia-Casado, J.; Ye-Lin, Y.; Prats-Boluda, G.; Mas-Cabo, J.; Alberola-Rubio, J.; Perales, A. Electrohysterography in the diagnosis of preterm birth: A review. Physiol. Meas. 2018, 39, 02TR01. [Google Scholar] [CrossRef] [PubMed]
- Lim, K.; Butt, K.; Crane, J.M.; Morin, L.; Bly, S.; Butt, K.; Cargill, Y.; Davies, G.; Denis, N.; Ouellet, A.; et al. Ultrasonographic cervical length assessment in predicting preterm birth in singleton pregnancies. J. Obstet. Gynaecol. Can. 2011, 33, 486–499. [Google Scholar] [CrossRef]
- Euliano, T.Y.; Nguyen, M.T.; Darmanjian, S.; McGorray, S.P.; Euliano, N.; Onkala, A.; Gregg, A.R. Monitoring uterine activity during labor: A comparison of three methods. Am. J. Obs. Gynecol. 2013, 208, 66–67. [Google Scholar] [CrossRef] [Green Version]
- Euliano, T.Y.; Nguyen, M.T.; Darmanjian, S.; Busowski, J.D.; Euliano, N.; Gregg, A.R. Monitoring uterine activity during labor: Clinician interpretation of electrohysterography versus intrauterine pressure catheter and tocodynamometry. Am. J. Perinatol. 2016, 33, 831–838. [Google Scholar] [CrossRef] [PubMed] [Green Version]
- Berghella, V.; Hayes, E.; Visintine, J.; Baxter, J.K. Fetal fibronectin testing for reducing the risk of preterm birth. Cochrane Database Syst. Rev. 2008. [Google Scholar] [CrossRef] [PubMed]
- Devedeux, D.; Marque, C.; Mansour, S.; Germain, G.; Duchêne, J. Uterine electromyography: A critical review. Am. J. Obstet. Gynecol. 1993, 169, 1636–1653. [Google Scholar] [CrossRef]
- Schlembach, D.; Maner, W.L.; Garfield, R.E.; Maul, H. Monitoring the progress of pregnancy and labor using electromyography. Eur. J. Obstet. Gynecol. Reprod. Biol. 2009, 144, 2–8. [Google Scholar] [CrossRef]
- Fele-Žorž, G.; Kavšek, G.; Novak-Antolič, Ž.; Jager, F. A comparison of various linear and non-linear signal processing techniques to separate uterine EMG records of term and pre-term delivery groups. Med. Biol. Eng. Comput. 2008, 46, 911–922. [Google Scholar] [CrossRef]
- Mas-Cabo, J.; Ye-Lin, Y.; Garcia-Casado, J.; Díaz-Martinez, A.; Perales-Marin, A.; Monfort-Ortiz, R.; Roca-Prats, A.; López-Corral, Á.; Prats-Boluda, G. Robust characterization of the uterine myoelectrical activity in different obstetric scenarios. Entropy 2020, 22, 743. [Google Scholar] [CrossRef]
- Mas-Cabo, J.; Prats-Boluda, G.; Garcia-Casado, J.; Alberola-Rubio, J.; Monfort-Ortiz, R.; Martinez-Saez, C.; Perales, A.; Ye-Lin, Y. Electrohysterogram for ANN-Based prediction of imminent labor in women with threatened preterm labor undergoing tocolytic therapy. Sensors 2020, 20, 2681. [Google Scholar] [CrossRef]
- Pincus, S.M. Approximate entropy as a measure of system complexity. Proc. Natl. Acad. Sci. USA 1991, 88, 2297–2301. [Google Scholar] [CrossRef] [Green Version]
- Lemancewicz, A.; Borowska, M.; Kuć, P.; Jasińska, E.; Laudański, P.; Laudański, T.; Oczeretko, E. Early diagnosis of threatened premature labor by electrohysterographic recordings—The use of digital signal processing. Biocybern. Biomed. Eng. 2016, 36, 302–307. [Google Scholar] [CrossRef]
- Ferrario, M.; Signorini, M.G.; Magenes, G.; Cerutti, S. Comparison of entropy-based regularity estimators: Application to the fetal heart rate signal for the identification of fetal distress. IEEE Trans. Biomed. Eng. 2006, 53, 119–125. [Google Scholar] [CrossRef]
- Richman, J.S.; Moorman, J.R. Physiological time-series analysis using approximate entropy and sample entropy. Am. J. Physiol. Circ. Physiol. 2000, 278, H2039–H2049. [Google Scholar] [CrossRef] [Green Version]
- Mas-Cabo, J.; Prats-Boluda, G.; Perales, A.; Garcia-Casado, J.; Alberola-Rubio, J.; Ye-Lin, Y. Uterine electromyography for discrimination of labor imminence in women with threatened preterm labor under tocolytic treatment. Med. Biol. Eng. Comput. 2019, 57, 401–411. [Google Scholar] [CrossRef]
- Humeau-Heurtier, A. Evaluation of systems’ irregularity and complexity: Sample entropy, its derivatives, and their applications across scales and disciplines. Entropy 2018, 20, 794. [Google Scholar] [CrossRef] [Green Version]
- Azami, H.; Li, P.; Arnold, S.E.; Escudero, J.; Humeau-Heurtier, A. Fuzzy entropy metrics for the analysis of biomedical signals: Assessment and comparison. IEEE Access 2019, 7, 104833–104847. [Google Scholar] [CrossRef]
- Manis, G.; Aktaruzzaman, M.; Sassi, R. Bubble entropy: An entropy almost free of parameters. IEEE Trans. Biomed. Eng. 2017, 64, 2711–2718. [Google Scholar] [CrossRef] [PubMed]
- Unakafov, A.M.; Keller, K. Conditional entropy of ordinal patterns. Phys. D Nonlinear Phenom. 2014, 269, 94–102. [Google Scholar] [CrossRef] [Green Version]
- Liang, Z.; Wang, Y.; Sun, X.; Li, D.; Voss, L.J.; Sleigh, J.W.; Hagihira, S.; Li, X. EEG entropy measures in anesthesia. Front. Comput. Neurosci. 2015, 9, 1–17. [Google Scholar] [CrossRef] [PubMed]
- Rostaghi, M.; Azami, H. Dispersion entropy: A measure for time-series analysis. IEEE Signal Process. Lett. 2016, 23, 610–614. [Google Scholar] [CrossRef]
- Azami, H.; Escudero, J. Amplitude- and fluctuation-based dispersion entropy. Entropy 2018, 20, 210. [Google Scholar] [CrossRef] [Green Version]
- Li, Y.; Gao, X.; Wang, L. Reverse dispersion entropy: A new complexity measure for sensor signal. Sensors 2019, 19, 5203. [Google Scholar] [CrossRef] [Green Version]
- Kafantaris, E.; Piper, I.; Lo, T.Y.M.; Escudero, J. Application of dispersion entropy to healthy and pathological heartbeat ECG segments. In Proceedings of the 2019 41st Annual International Conference of the IEEE Engineering in Medicine and Biology Society (EMBC), Berlin, Germany, 23–27 July 2019; pp. 2269–2272. [Google Scholar] [CrossRef]
- Amezquita-Sanchez, J.P.; Mammone, N.; Morabito, F.C.; Adeli, H. A New dispersion entropy and fuzzy logic system methodology for automated classification of dementia stages using electroencephalograms. Clin. Neurol. Neurosurg. 2021, 201. [Google Scholar] [CrossRef] [PubMed]
- Tripathy, R.K.; Ghosh, S.K.; Gajbhiye, P.; Acharya, U.R. Development of automated sleep stage classification system using multivariate projection-based fixed boundary empirical wavelet transform and entropy features extracted from multichannel eeg signals. Entropy 2020, 22, 1141. [Google Scholar] [CrossRef]
- Jager, F.; Libenšek, S.; Geršak, K. Characterization and automatic classification of preterm and term uterine records. PLoS ONE 2018, 13, e0202125. [Google Scholar] [CrossRef] [Green Version]
- Ye-Lin, Y.; Garcia-Casado, J.; Prats-Boluda, G.; Alberola-Rubio, J.; Perales, A. Automatic identification of motion artifacts in EHG recording for robust analysis of uterine contractions. Comput. Math. Methods Med. 2014, 2014. [Google Scholar] [CrossRef] [Green Version]
- Katz, M.J. Fractals and the analysis of waveforms. Comput. Biol. Med. 1988, 18, 145–156. [Google Scholar] [CrossRef]
- Brennan, M.; Palaniswami, M.; Kamen, P. Do existing measures of Poincareé plot geometry reflect nonlinear features of heart rate variability? IEEE Trans. Biomed. Eng. 2001, 48, 1342–1347. [Google Scholar] [CrossRef] [PubMed]
- Xiong, J.; Liang, X.; Zhu, T.; Zhao, L.; Li, J.; Liu, C. A new physically meaningful threshold of sample entropy for detecting cardiovascular diseases. Entropy 2019, 21, 830. [Google Scholar] [CrossRef] [Green Version]
- Chawla, N.V.; Bowyer, K.W.; Hall, L.O.; Kegelmeyer, W.P. SMOTE: Synthetic minority over-sampling technique. J. Artif. Intell. Res. 2002, 16, 321–357. [Google Scholar] [CrossRef]
- Murphy, K.P. Machine Learning: A Probabilistic Perspective; MIT Press: Cambridge, MA, USA, 2012; ISBN 9780262018029. [Google Scholar]
- Bouaguel, W. A new approach for wrapper feature selection using genetic algorithm for big data. In Intelligent and Evolutionary Systems; Springer: Cham, Switzerland, 2016; pp. 75–83. [Google Scholar]
- Babatunde, O.; Armstrong, L.; Leng, J.; Diepeveen, D. A genetic algorithm-based feature selection. Int. J. Electron. Commun. Comput. Eng. 2014, 5, 899–905. [Google Scholar]
- Beasley, D.; Bull, D.R.; Martin, R.R. An overview of genetic algorithms: Part 1, fundamentals. Univ. Comput. 1993, 2, 1–16. [Google Scholar]
- Goldberg, D.E. Genetic Algorithms in Search, Optimization, and Machine Learning; Addison-Wesley: Boston, MA, USA, 1989; ISBN 9780201157673. [Google Scholar]
- Fergus, P.; Cheung, P.; Hussain, A.; Al-Jumeily, D.; Dobbins, C.; Iram, S. Prediction of preterm deliveries from EHG signals using machine learning. PLoS ONE 2013, 8, e77154. [Google Scholar] [CrossRef] [PubMed]
- Smrdel, A.; Jager, F. Separating sets of term and pre-term uterine EMG records. Physiol. Meas. 2015, 36, 341–355. [Google Scholar] [CrossRef]
- Fergus, P.; Idowu, I.; Hussain, A.; Dobbins, C. Advanced artificial neural network classification for detecting preterm births using EHG records. Neurocomputing 2016, 188, 42–49. [Google Scholar] [CrossRef] [Green Version]
- Ren, P.; Yao, S.; Li, J.; Valdes-Sosa, P.A.; Kendrick, K.M. Improved prediction of preterm delivery using empirical mode decomposition analysis of uterine electromyography signals. PLoS ONE 2015, 10, e0132116. [Google Scholar] [CrossRef] [Green Version]
- Mas-Cabo, J.; Prats-Boluda, G.; Ye-Lin, Y.; Alberola-Rubio, J.; Perales, A.; Garcia-Casado, J. Characterization of the effects of Atosiban on uterine electromyograms recorded in women with threatened preterm labor. Biomed. Signal Process. Control 2019, 52, 198–205. [Google Scholar] [CrossRef]
- Azami, H.; Rostaghi, M.; Fernandez, A.; Escudero, J. Dispersion entropy for the analysis of resting-state MEG regularity in Alzheimer’s disease. In Proceedings of the 2016 38th Annual International Conference of the IEEE Engineering in Medicine and Biology Society (EMBC), Orlando, FL, USA, 17–20 August 2016; pp. 6417–6420. [Google Scholar]
- Simons, S.; Espino, P.; Abásolo, D. Fuzzy entropy analysis of the electroencephalogram in patients with Alzheimer’s disease: Is the method superior to sample entropy? Entropy 2018, 20, 21. [Google Scholar] [CrossRef] [Green Version]
- Doquire, G.; Verleysen, M. A comparison of multivariate mutual information estimators for feature selection. In Proceedings of the ICPRAM 2012—Proceedings of the 1st International Conference on Pattern Recognition Applications and Methods, Algarve, Portugal, 6–8 February 2012; Volume 1, pp. 176–185. [Google Scholar] [CrossRef] [Green Version]
- Fang, L.; Zhao, H.; Wang, P.; Yu, M.; Yan, J.; Cheng, W.; Chen, P. Feature selection method based on mutual information and class separability for dimension reduction in multidimensional time series for clinical data. Biomed. Signal Process. Control 2015, 21, 82–89. [Google Scholar] [CrossRef] [Green Version]
- Alamedine, D.; Khalil, M.; Marque, C. Comparison of feature selection for monopolar and bipolar EHG signal. In Proceedings of the Journees Recherche en Imagerie et Technologies pour la Santé (RITS 2015), Dourdan, France, 25–27 March 2015; pp. 100–101. [Google Scholar]
- Naeem, S.M.; Seddik, A.F.; Eldosoky, M.A. New technique based on uterine electromyography nonlinearity for preterm delivery detection. J. Eng. Technol. Res. 2014, 6, 107–114. [Google Scholar] [CrossRef]
- Hassan, M.; Terrien, J.; Marque, C.; Karlsson, B. Comparison between approximate entropy, correntropy and time reversibility: Application to uterine electromyogram signals. Med. Eng. Phys. 2011, 33, 980–986. [Google Scholar] [CrossRef] [PubMed]
- Nieto-del-Amor, F.; Prats-Boluda, G.; Martinez-De-Juan, J.L.; Diaz-Martinez, A.; Monfort-Ortiz, R.; Diago-Almela, V.J.; Ye-Lin, Y. Optimized feature subset selection using genetic algorithm for preterm labor prediction based on electrohysterography. Sensors 2021, 21, 3350. [Google Scholar] [CrossRef]
- Cuesta-Frau, D.; Vargas, B. Permutation entropy and bubble entropy: Possible interactions and synergies between order and sorting relations. Math. Biosci. Eng. 2020, 17, 1637–1658. [Google Scholar] [CrossRef]
- Li, P.; Karmakar, C.; Yearwood, J.; Venkatesh, S.; Palaniswami, M.; Liu, C. Detection of epileptic seizure based on entropy analysis of short-term EEG. PLoS ONE 2018, 13, e0193691. [Google Scholar] [CrossRef] [Green Version]
- Acharya, U.R.; Sudarshan, V.K.; Rong, S.Q.; Tan, Z.; Lim, C.M.; Koh, J.E.; Nayak, S.; Bhandary, S.V. Automated detection of premature delivery using empirical mode and wavelet packet decomposition techniques with uterine electromyogram signals. Comput. Biol. Med. 2017, 85, 33–42. [Google Scholar] [CrossRef] [PubMed]
- Mas-Cabo, J.; Prats-Boluda, G.; Garcia-Casado, J.; Alberola-Rubio, J.; Perales, A.; Ye-Lin, Y. Design and assessment of a robust and generalizable ANN-based classifier for the prediction of premature birth by means of multichannel electrohysterographic records. J. Sens. 2019, 2019, 1–13. [Google Scholar] [CrossRef]
- Carvalho, D.V.; Pereira, E.M.; Cardoso, J.S. Machine learning interpretability: A survey on methods and metrics. Electron 2019, 8, 832. [Google Scholar] [CrossRef] [Green Version]
- Ahmed, M.U.; Chanwimalueang, T.; Thayyil, S.; Mandic, D.P. A multivariate multiscale fuzzy entropy algorithm with application to uterine EMG complexity analysis. Entropy 2017, 19, 2. [Google Scholar] [CrossRef] [Green Version]


| Linear Features (L) | Non-Linear Features (NL) | EnSFS | EnALL | Obstetric Data | |
|---|---|---|---|---|---|
| Number of features | 20/channel | 16/channel | 6/channel | 10/channel | 5 |
| Included features | App MeanF. DF1, DF2 NormEn H/L Ratio [D1−D9] Teager Energy SpecMR | LZBin LZMulti (n = 6) TimeRev KFD SD1 SD2 SDRR SD1/SD2 | SampEn FuzEn SpEn | SampEn FuzEn SpEn DispEn BubbEn | Maternal age Parity Abortions Weight Week of gestation at recording time (Wog) |
| Channel S1 | Channel S2 | Channel S3 | |
|---|---|---|---|
| SampEnWBW | m = 3, r = 0.15 | m = 3, r = 0.1 | m = 2, r = 0.1 |
| SampEnFWH | m = 2, r = 0.3 | m = 3, r = 0.1 | m = 2, r = 0.3 |
| FuzEnWBW | m = 5, r = 0.0077, n = 3, exponential function | m = 5, r = 0.0077, n = 3, exponential function | m = 2, r = 0.0077, n = 3, exponential function |
| FuzEnFWH | m = 5, r = 0.0077, n = 3, exponential function | m = 5, r = 0.0077, n = 3, exponential function | m = 2, r = 0.0077, n = 3, exponential function |
| DispEnWBW | m = 2, c = 3, linear | m = 2, c = 3, linear | m = 2, c = 3, linear |
| DispEnFWH | m = 2, c = 3, linear | m = 3, c = 4, linear | m = 2, c = 7, logsig |
| BubbEnWBW | m = 23 | m = 23 | m = 26 |
| BubbEnFWH | m = 25 | m = 24 | m = 24 |
| Model | Acronym | Input EHG Features | Obstetrical Data | Initial Features |
|---|---|---|---|---|
| 1 | EnSFS | EnSFS | No | 18 |
| 2 | EnALL | EnALL | No | 30 |
| 3 | Linear | Linear | Yes | 65 |
| 4 | LNL | Linear, NL | Yes | 113 |
| 5 | LEnALL | Linear, EnALL | Yes | 95 |
| 6 | LNLEnALL | Linear, NL, EnALL | Yes | 143 |
| Input Features Acronym | Selected Feature Subset | N° of Features |
|---|---|---|
| EnSFS | SpEnWBW, S2, SpEnWBW, S3 | 2 |
| EnALL | BubbEnWBW, S2, BubbEnWBW, S3 | 2 |
| Linear | AppWBW, S2, DF1S2, NormEn0.2–0.34Hz, S2, NormEn0.2–0.34Hz, S3, H/L ratioS1, D3S1, D6S2, D8S3, SpMRS3, WoG | 10 |
| LNL | DF1S2, DF1S3, NormEn0.2–0.34Hz, S2, NormEn0.2–0.34Hz, S3, H/L ratioS1, D3S1, D6S2, D8S2, D8S3, D9S2, SpMRS3, LZBinWBW, S3, KFDWBW, S1, WoG | 14 |
| LEnALL | AppFWH, S2, DF1S3, DF2S1, NormEn0.2–0.34Hz, S2, NormEn0.2–0.34Hz, S3, D6S2, D8S3, SpMRS3, BubbEnFWH, S3, Abortions, WoG | 11 |
| LNLEnALL | DF1S2, DF2S1, NormEn0.2–0.34Hz, S2, D3 S1, D6S2, D8S2, D9S2, SpMRS3, KFDWBW, S1, FuzEnFWH, S1, BubbEnWBW, S2, BubbEnFWH, S3, WoG | 12 |
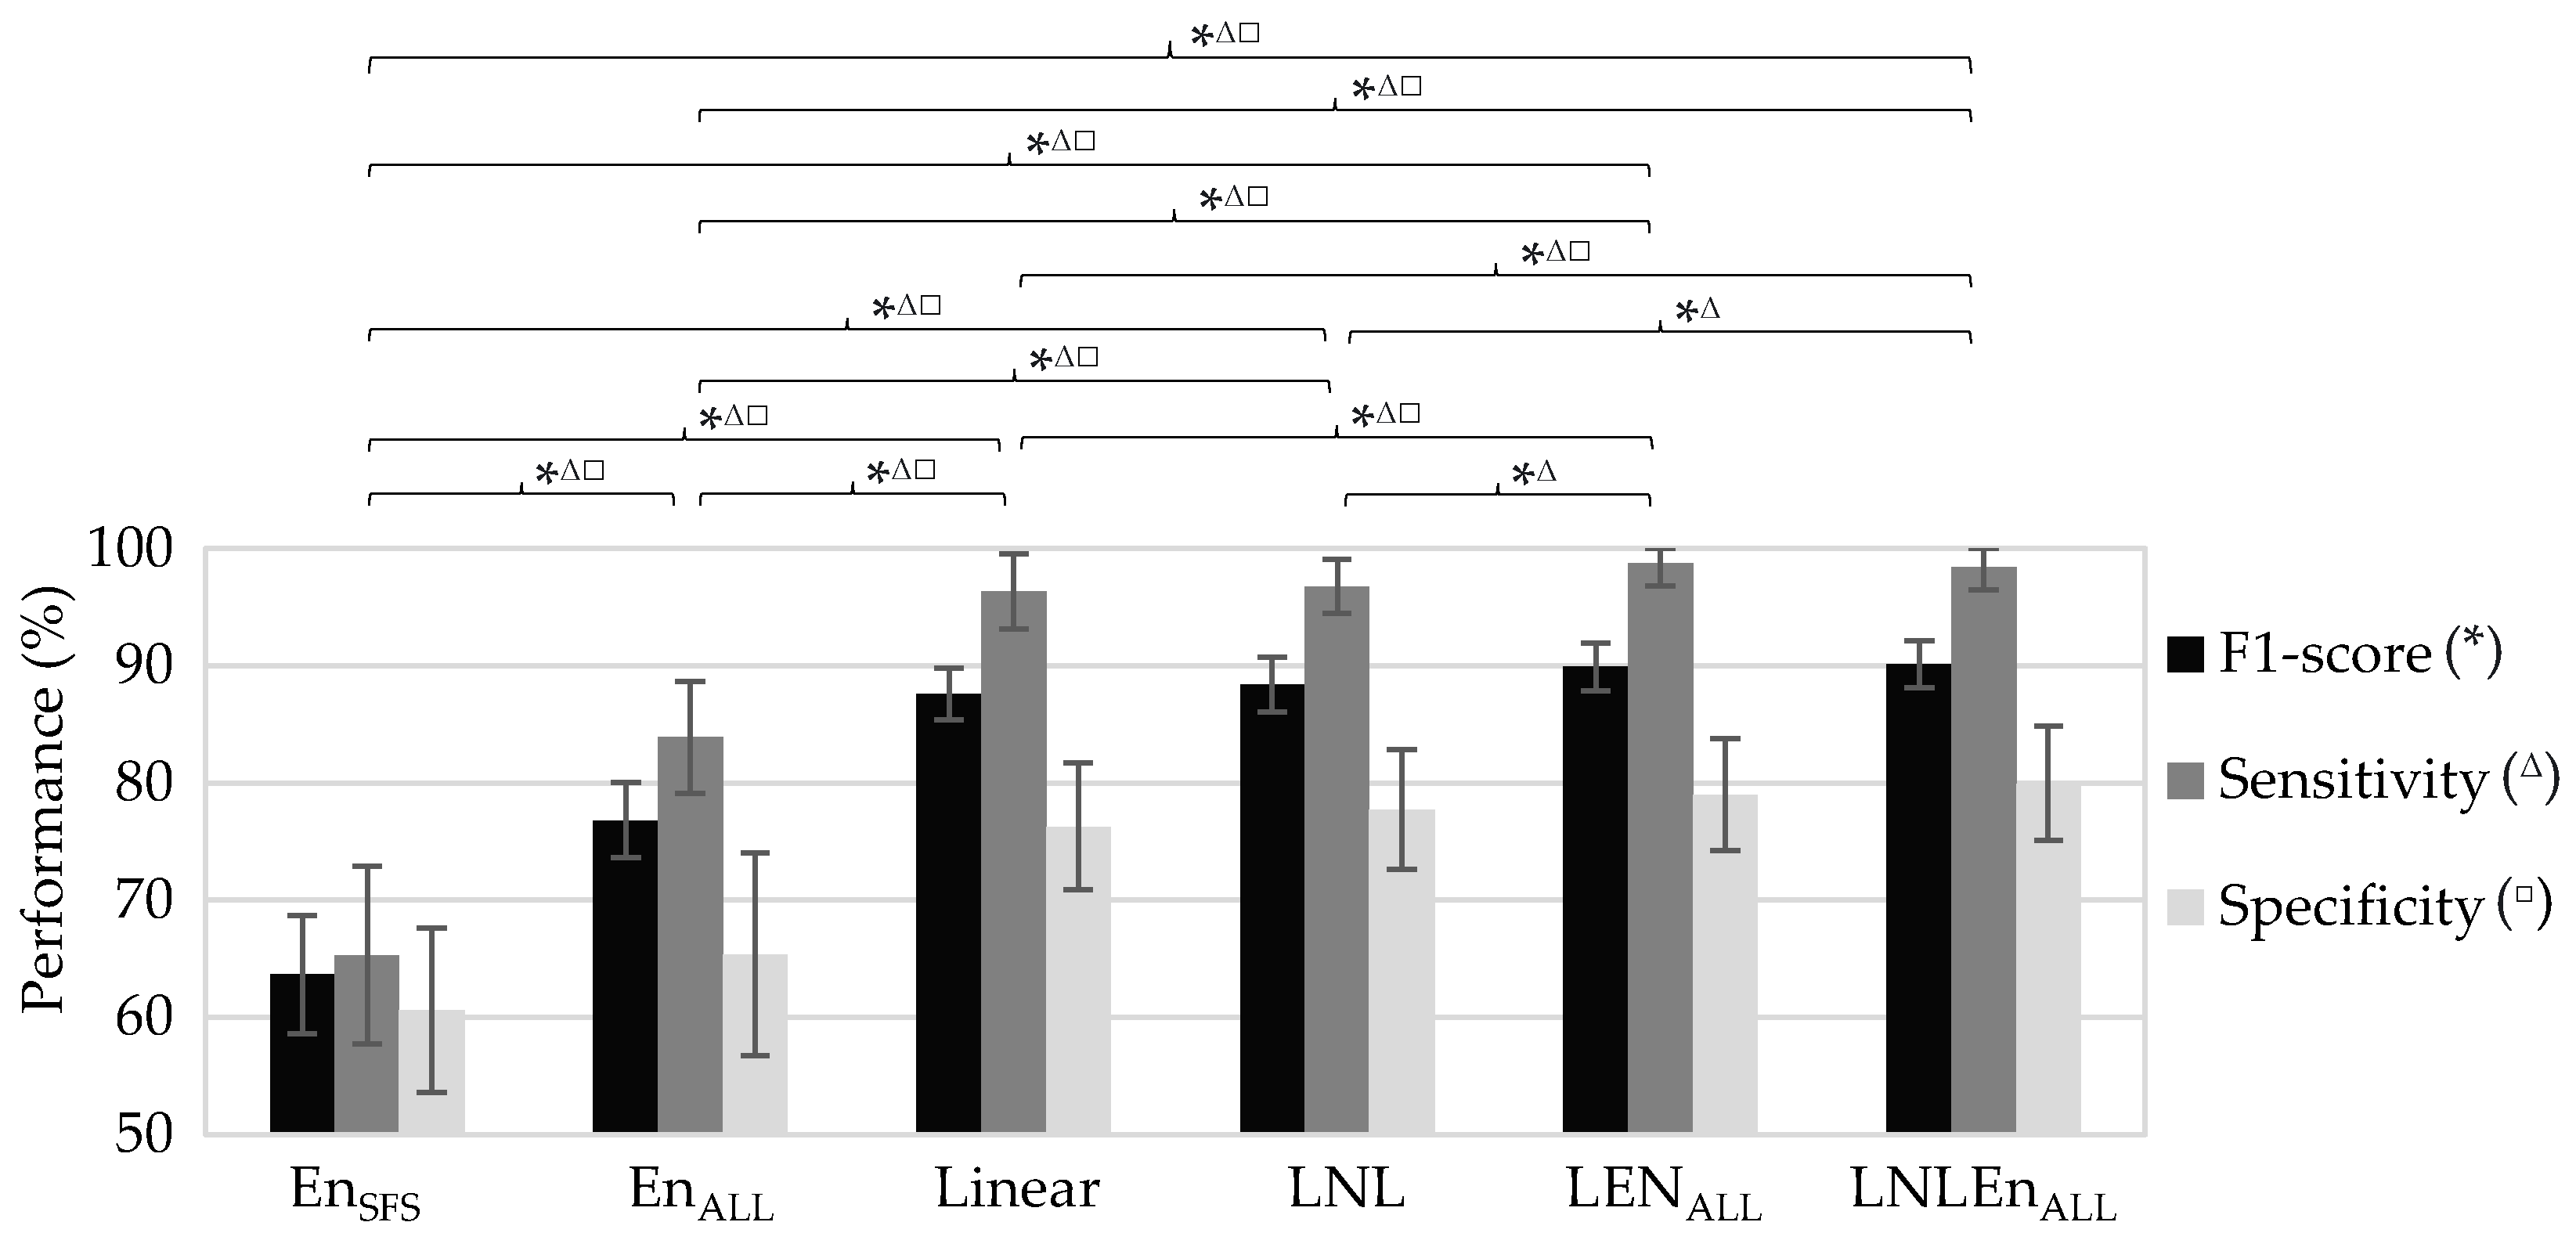
| Input Features Acronym | F1-Score (%) | Accuracy (%) | Sensitivity (%) | Specificity (%) | PPV (%) | NPV (%) | AUC (%) |
|---|---|---|---|---|---|---|---|
| EnSFS | 63.7 ± 5.1 | 63 ± 4.6 | 65.3 ± 7.6 | 60.6 ± 7 | 62.5 ± 4.6 | 63.8 ± 5.4 | 66.3 ± 4.71 |
| EnALL | 76.8 ± 3.2 | 74.6 ± 4.2 | 83.9 ± 4.8 | 65.4 ± 8.7 | 71.1 ± 5 | 80.4 ± 4.5 | 80.8 ± 4.76 |
| Linear | 87.6 ± 2.2 | 86.3 ± 2.6 | 96.4 ± 3.2 | 76.3 ± 5.4 | 80.4 ± 3.5 | 95.6 ± 3.6 | 90 ± 2.5 |
| LNL | 88.4 ± 2.3 | 87.3 ± 2.7 | 96.8 ± 2.3 | 77.7 ± 5.1 | 81.4 ± 3.5 | 96.1 ± 2.6 | 91.7 ± 2.6 |
| LEnALL | 89.9 ± 2 | 88.9 ± 2.4 | 98.7 ± 1.9 | 79 ± 4.8 | 82.6 ± 3.3 | 98.5 ± 2.3 | 91.6 ± 2.8 |
| LNLEnALL | 90.1 ± 2 | 89.2 ± 2.4 | 98.4 ± 1.9 | 79.9 ± 4.9 | 83.2 ± 3.3 | 98.2 ± 2.2 | 93.6 ± 2.3 |
Publisher’s Note: MDPI stays neutral with regard to jurisdictional claims in published maps and institutional affiliations. |
© 2021 by the authors. Licensee MDPI, Basel, Switzerland. This article is an open access article distributed under the terms and conditions of the Creative Commons Attribution (CC BY) license (https://creativecommons.org/licenses/by/4.0/).
Share and Cite
Nieto-del-Amor, F.; Beskhani, R.; Ye-Lin, Y.; Garcia-Casado, J.; Diaz-Martinez, A.; Monfort-Ortiz, R.; Diago-Almela, V.J.; Hao, D.; Prats-Boluda, G. Assessment of Dispersion and Bubble Entropy Measures for Enhancing Preterm Birth Prediction Based on Electrohysterographic Signals. Sensors 2021, 21, 6071. https://doi.org/10.3390/s21186071
Nieto-del-Amor F, Beskhani R, Ye-Lin Y, Garcia-Casado J, Diaz-Martinez A, Monfort-Ortiz R, Diago-Almela VJ, Hao D, Prats-Boluda G. Assessment of Dispersion and Bubble Entropy Measures for Enhancing Preterm Birth Prediction Based on Electrohysterographic Signals. Sensors. 2021; 21(18):6071. https://doi.org/10.3390/s21186071
Chicago/Turabian StyleNieto-del-Amor, Félix, Raja Beskhani, Yiyao Ye-Lin, Javier Garcia-Casado, Alba Diaz-Martinez, Rogelio Monfort-Ortiz, Vicente Jose Diago-Almela, Dongmei Hao, and Gema Prats-Boluda. 2021. "Assessment of Dispersion and Bubble Entropy Measures for Enhancing Preterm Birth Prediction Based on Electrohysterographic Signals" Sensors 21, no. 18: 6071. https://doi.org/10.3390/s21186071
APA StyleNieto-del-Amor, F., Beskhani, R., Ye-Lin, Y., Garcia-Casado, J., Diaz-Martinez, A., Monfort-Ortiz, R., Diago-Almela, V. J., Hao, D., & Prats-Boluda, G. (2021). Assessment of Dispersion and Bubble Entropy Measures for Enhancing Preterm Birth Prediction Based on Electrohysterographic Signals. Sensors, 21(18), 6071. https://doi.org/10.3390/s21186071