
Monocular Pedestrian 3D Localization for Social Distance Monitoring


Abstract
:1. Introduction
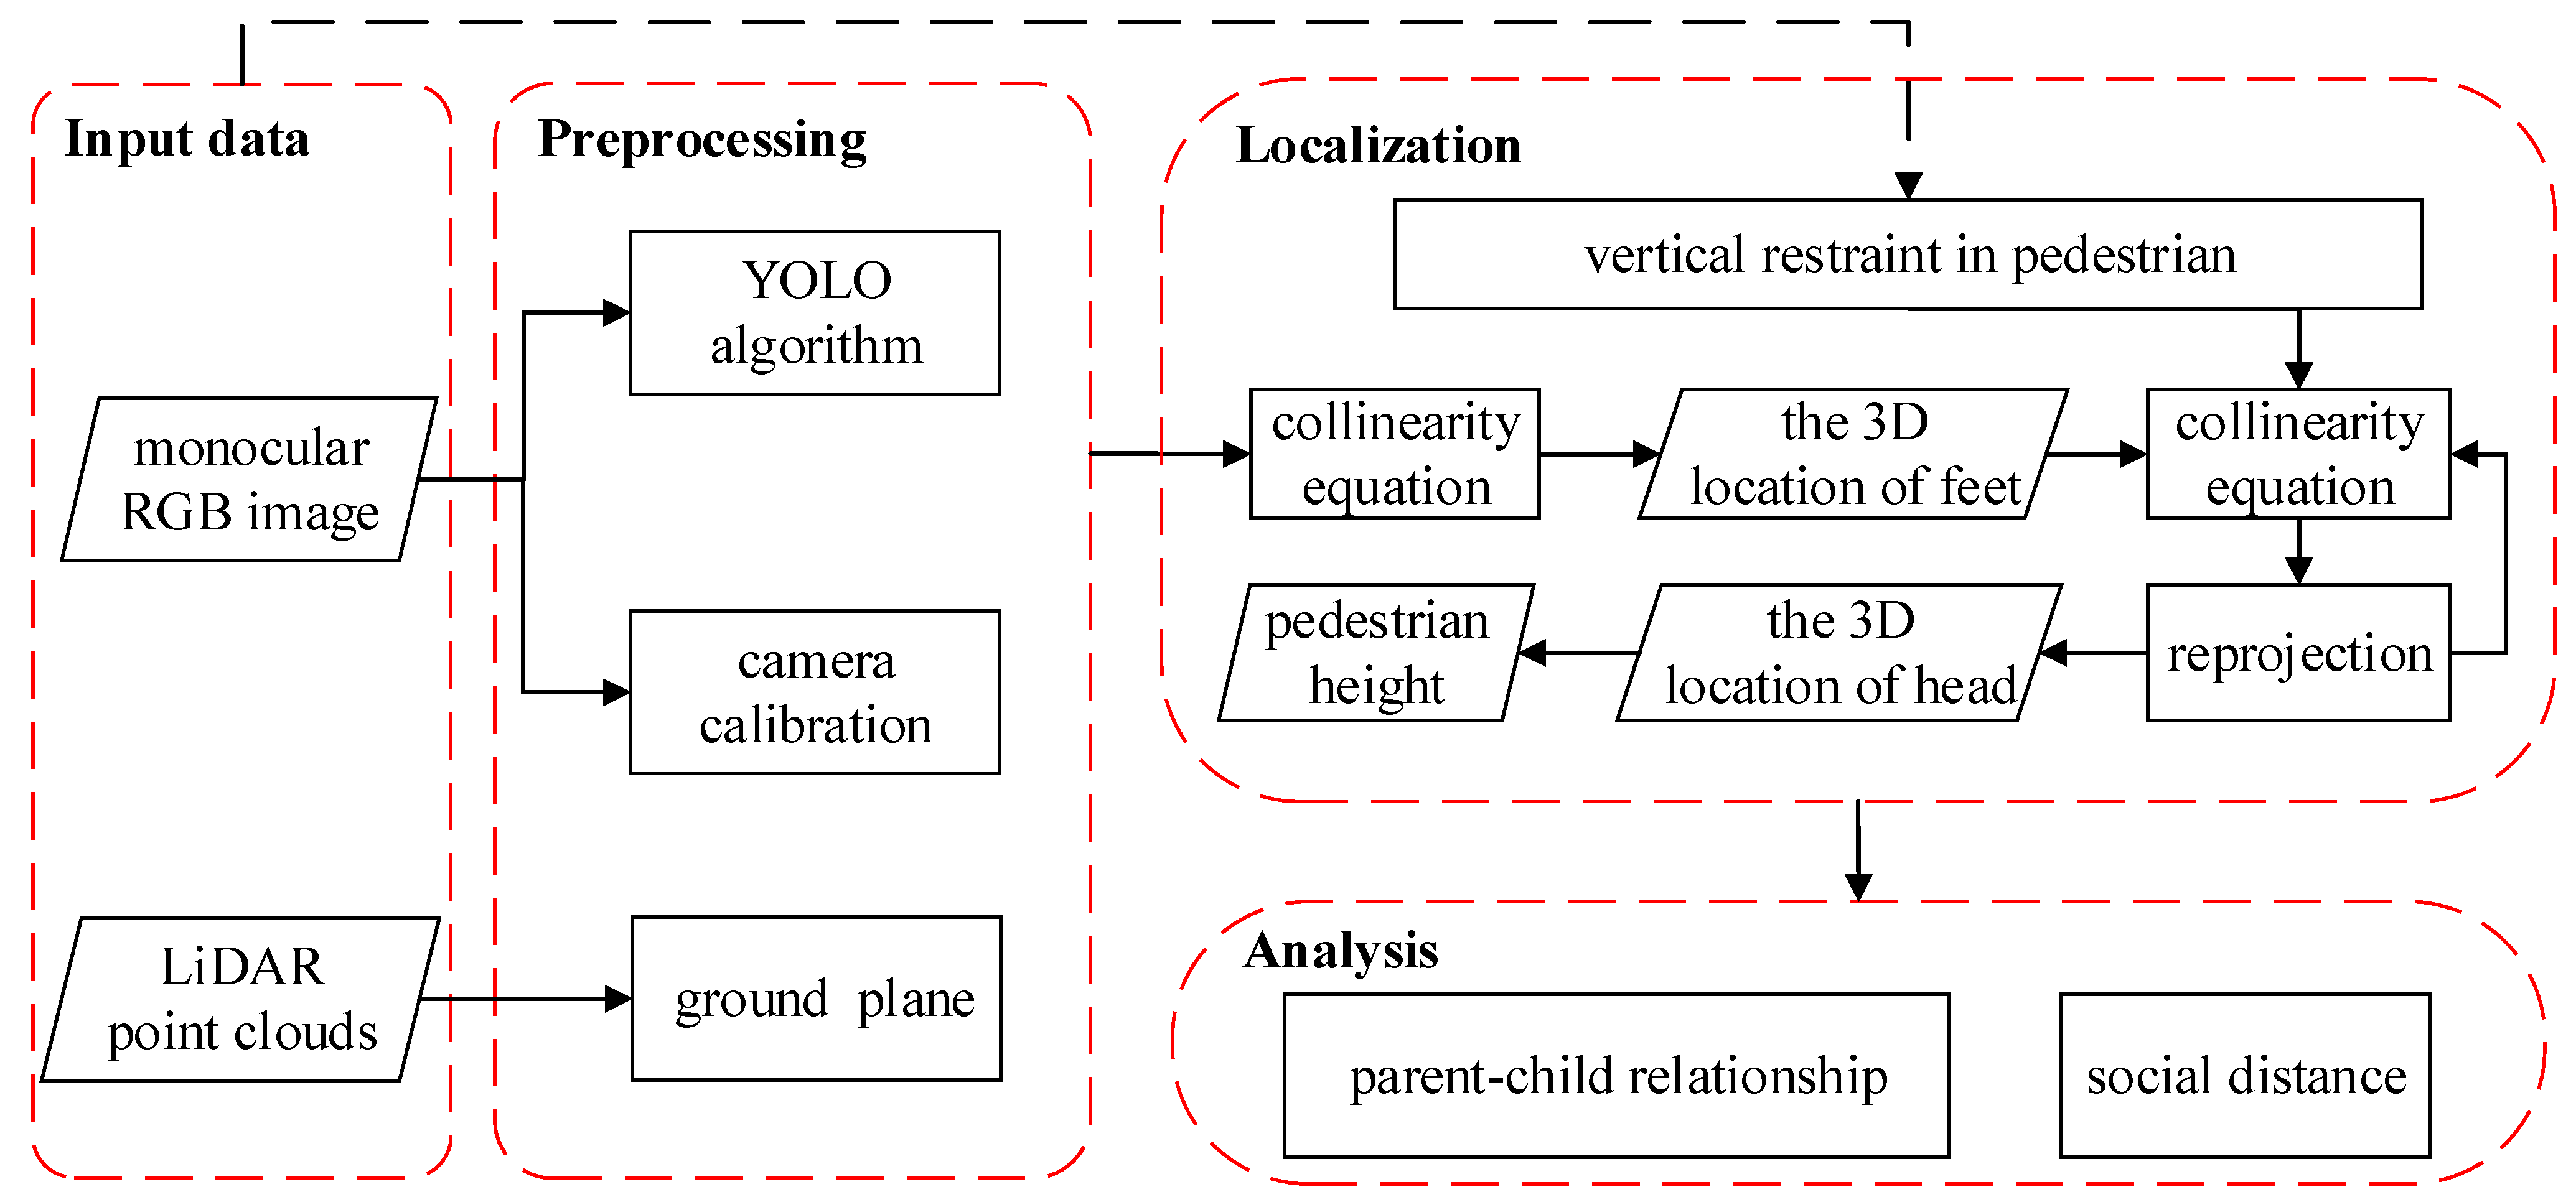
2. Proposed Method
2.1. Preprocessing
2.1.1. Camera Calibration
2.1.2. Detector
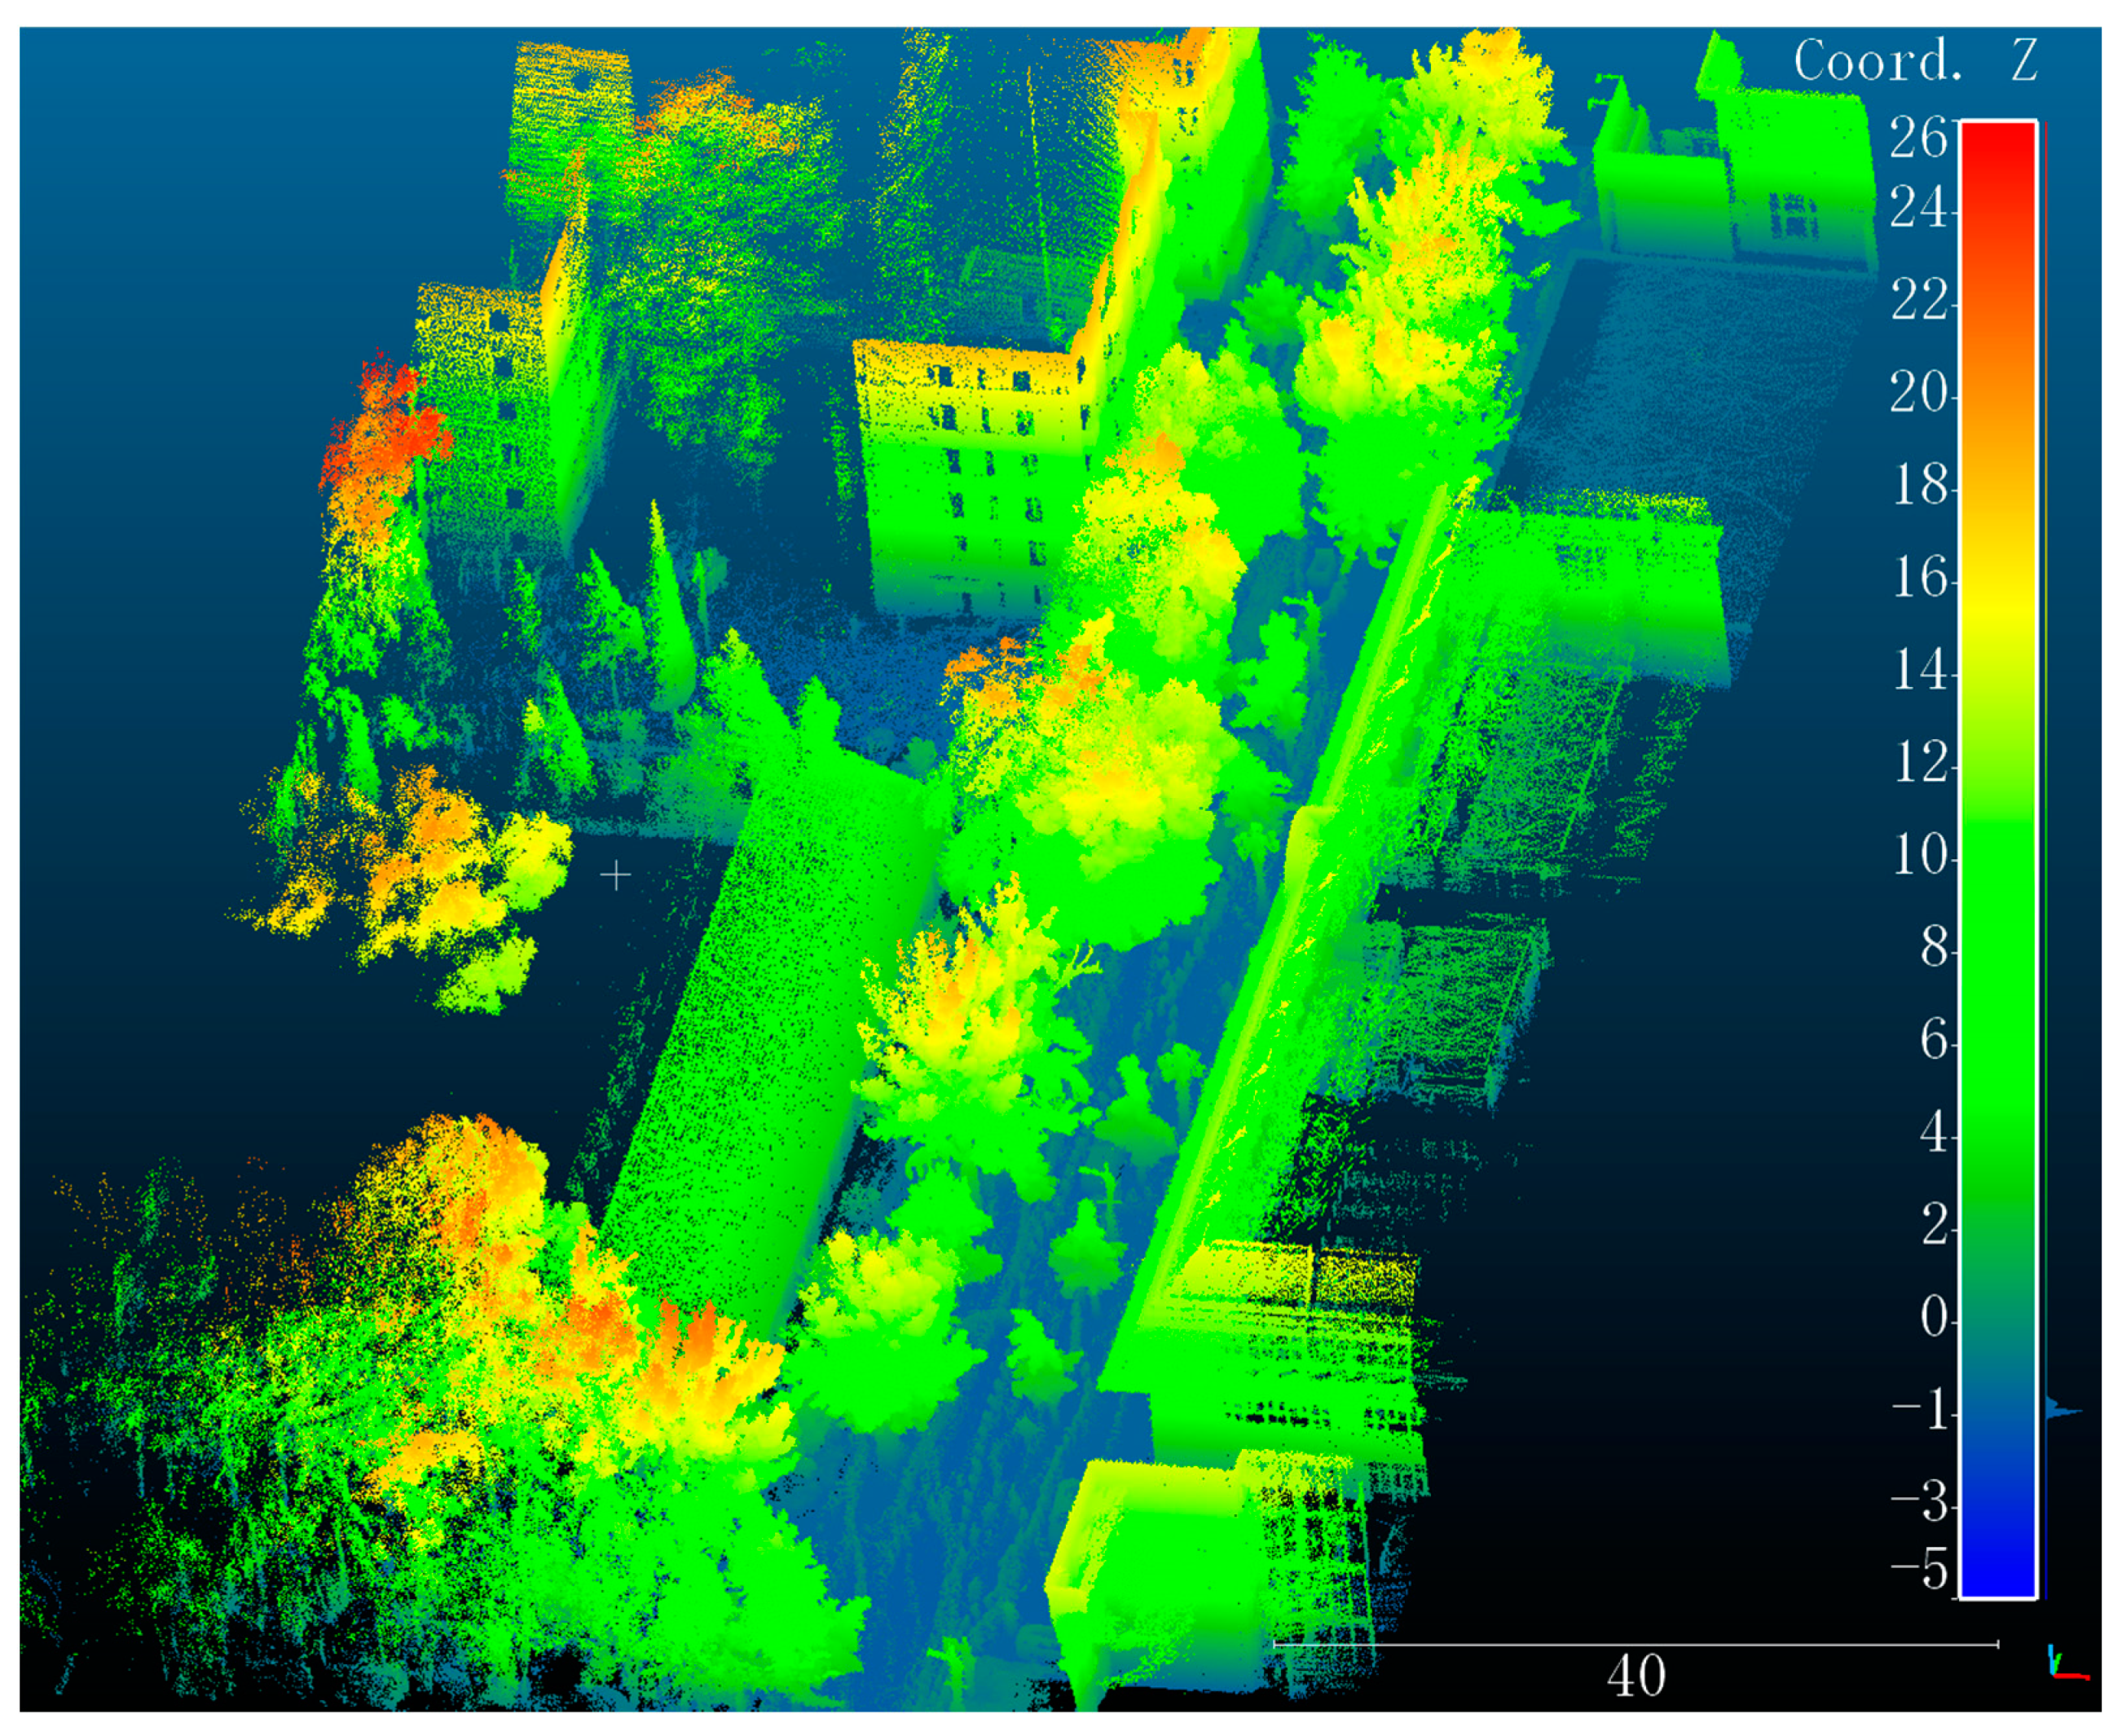
2.1.3. Extraction of the Vertical Coordinates of the Ground
2.2. 3D Localization
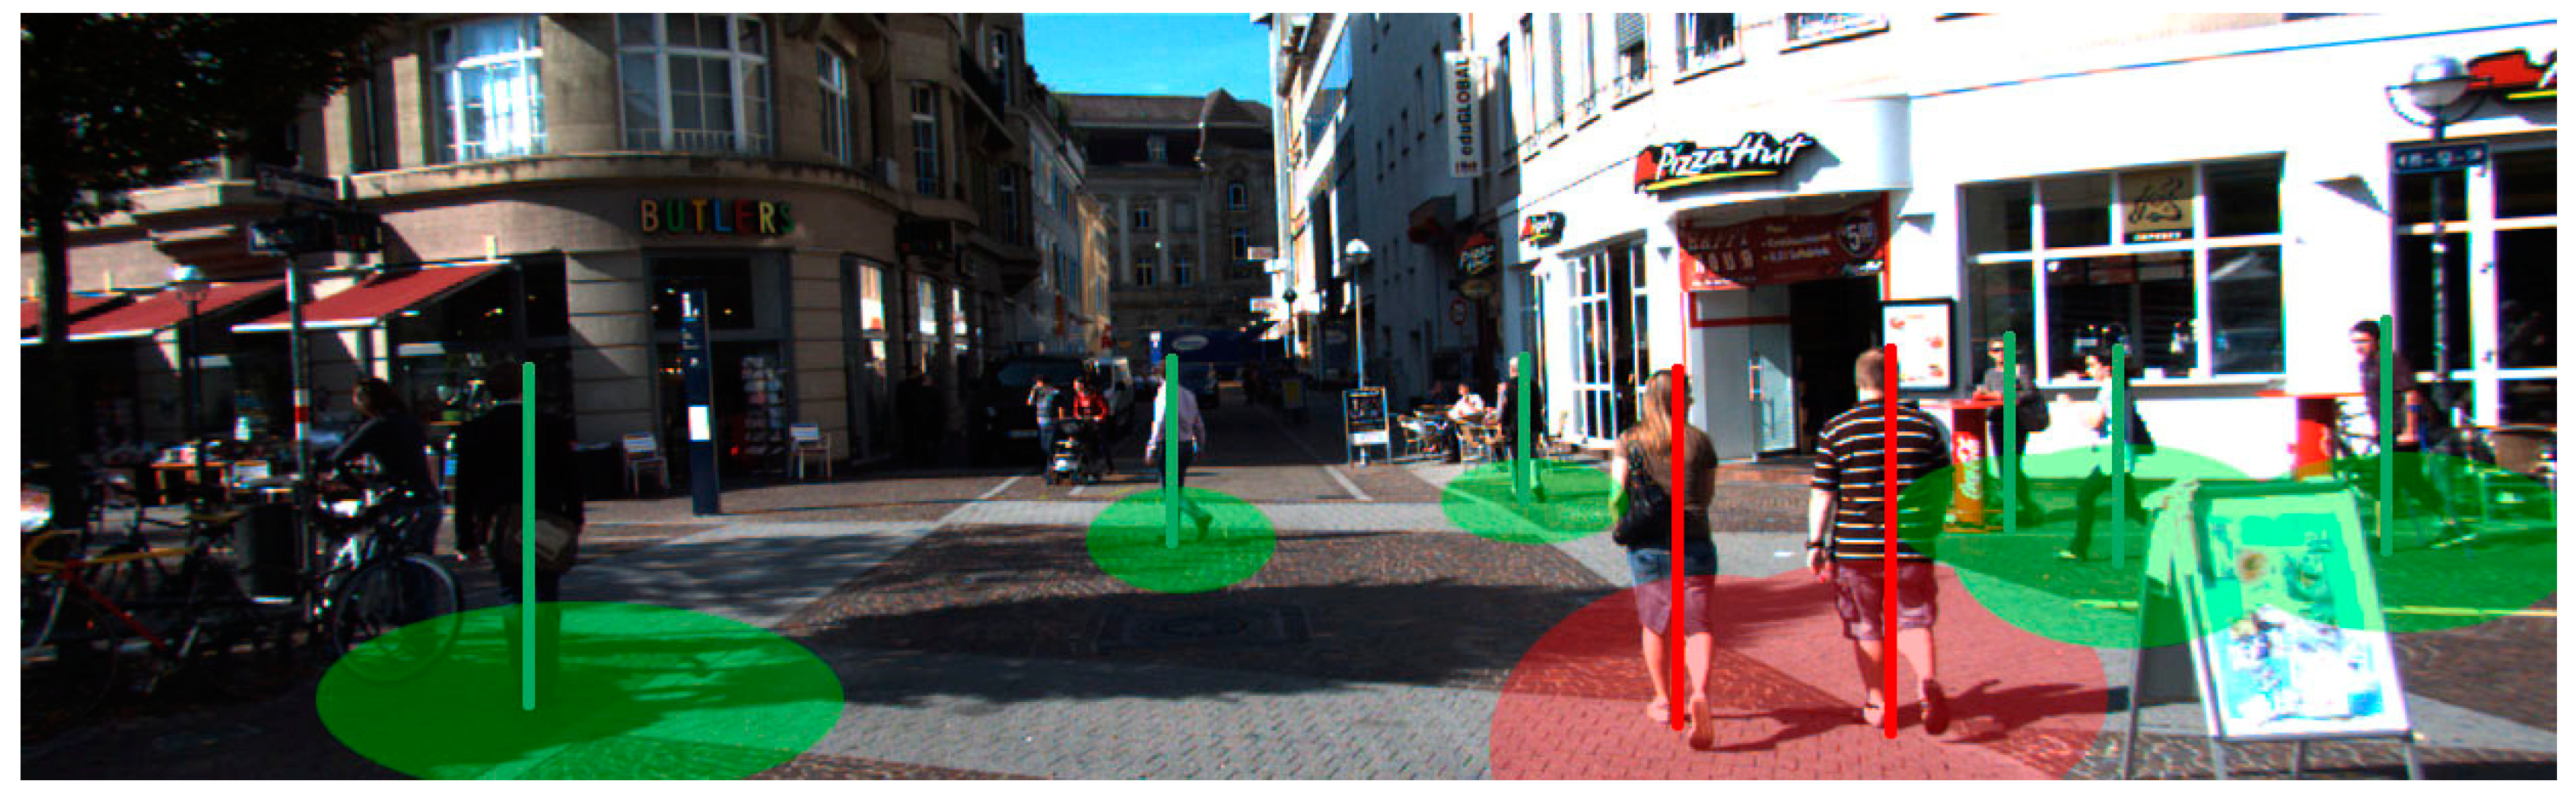
2.3. Social Distance Monitoring
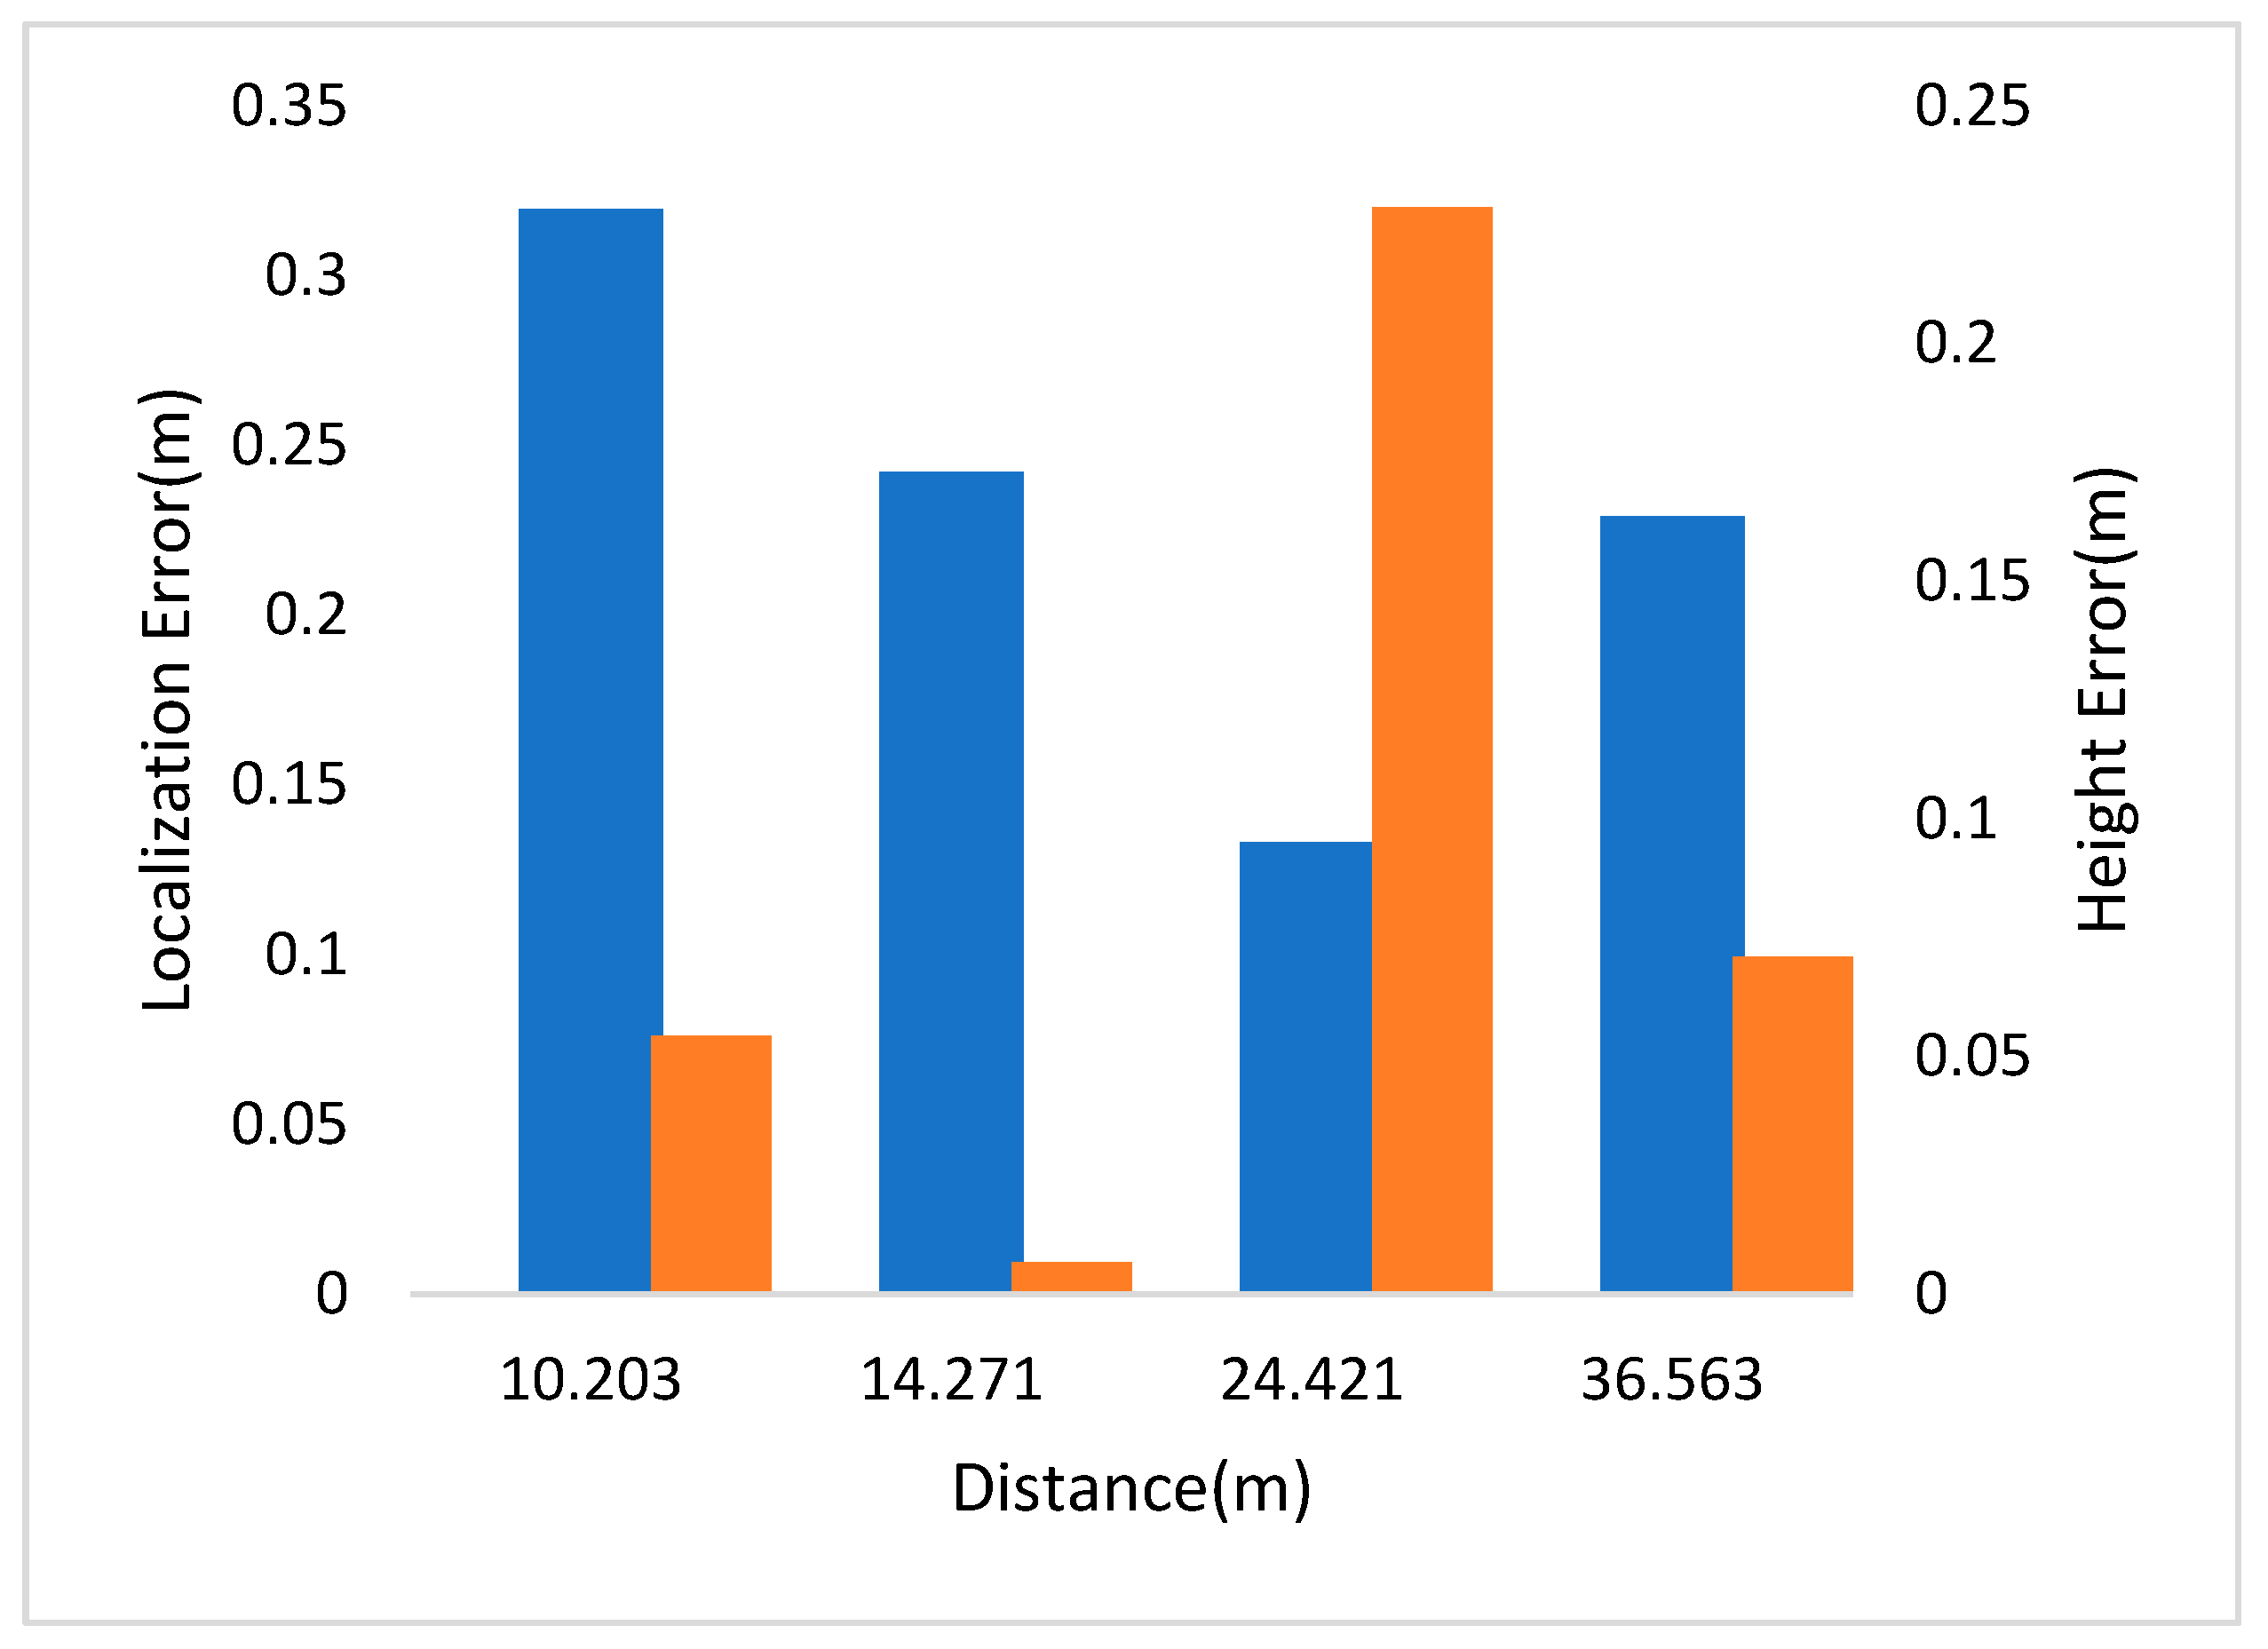
2.4. Performance Evaluation
3. Experiments and Results
3.1. Datasets
3.1.1. Self-Collected Data in CUMTB
3.1.2. The KITTI Dataset
3.2. Implementation Details and Results
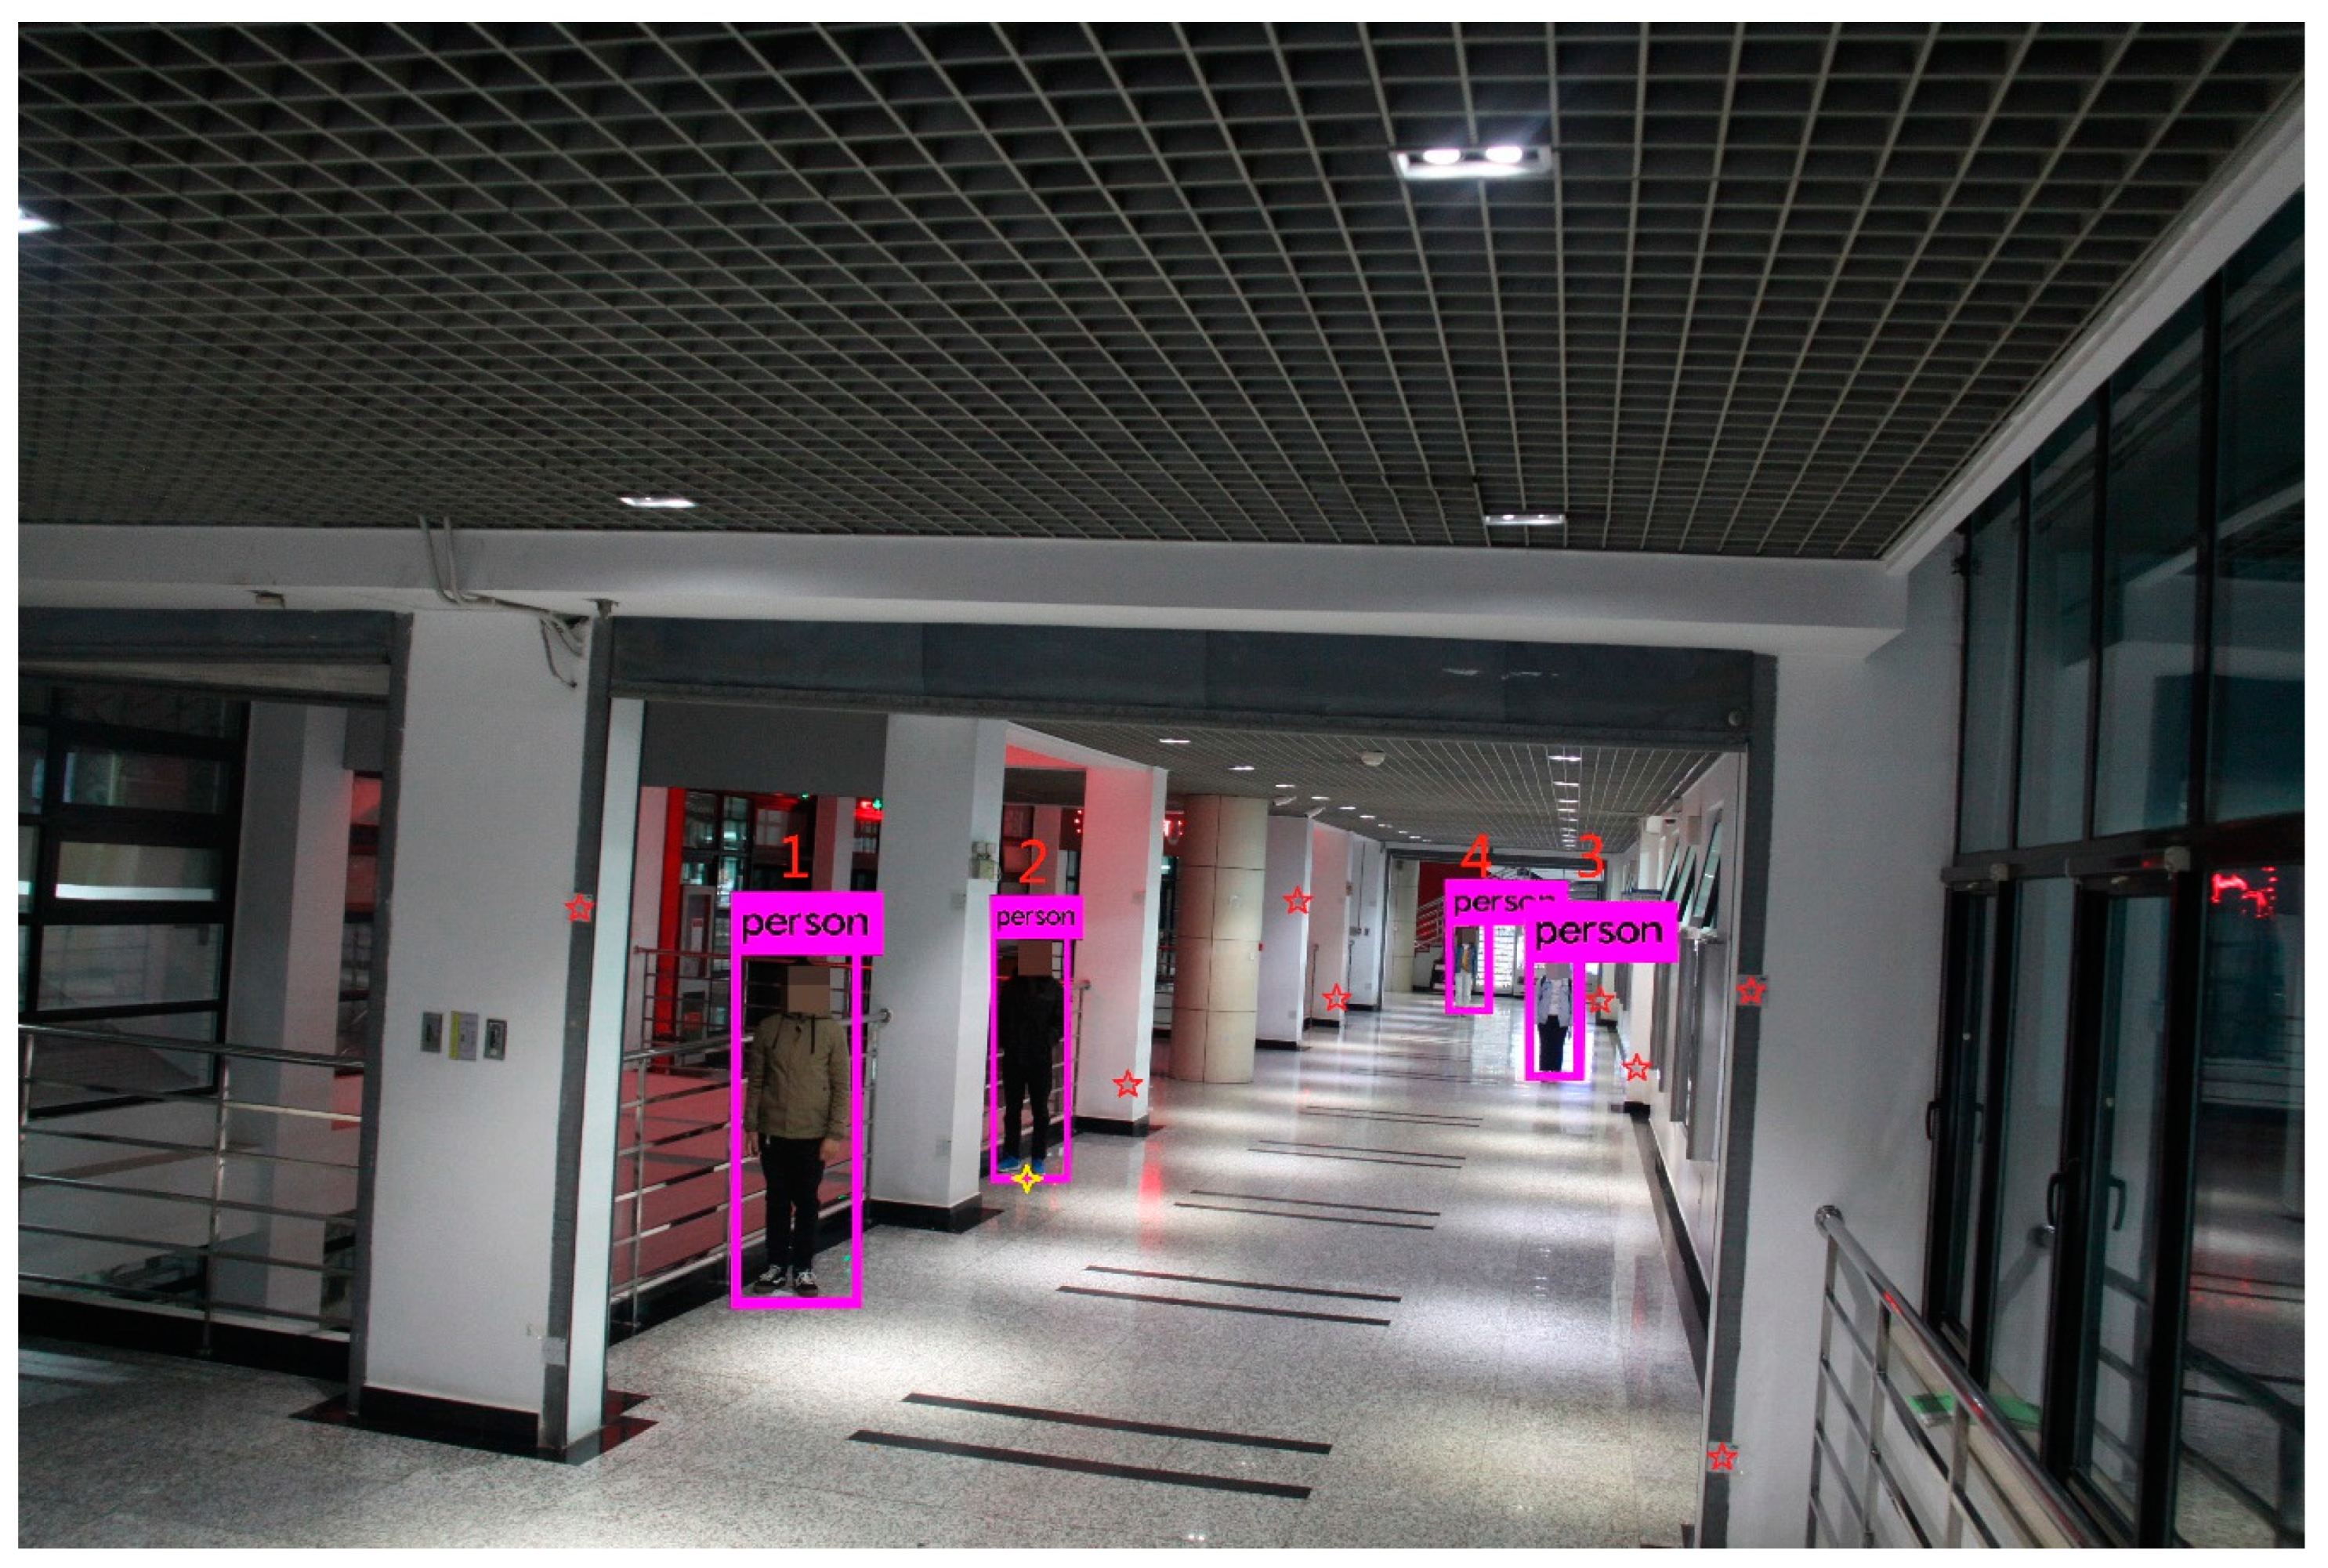
3.2.1. Implementation Details and Results for the CUMTB-Campus Dataset
- Scene 1:
- 2.
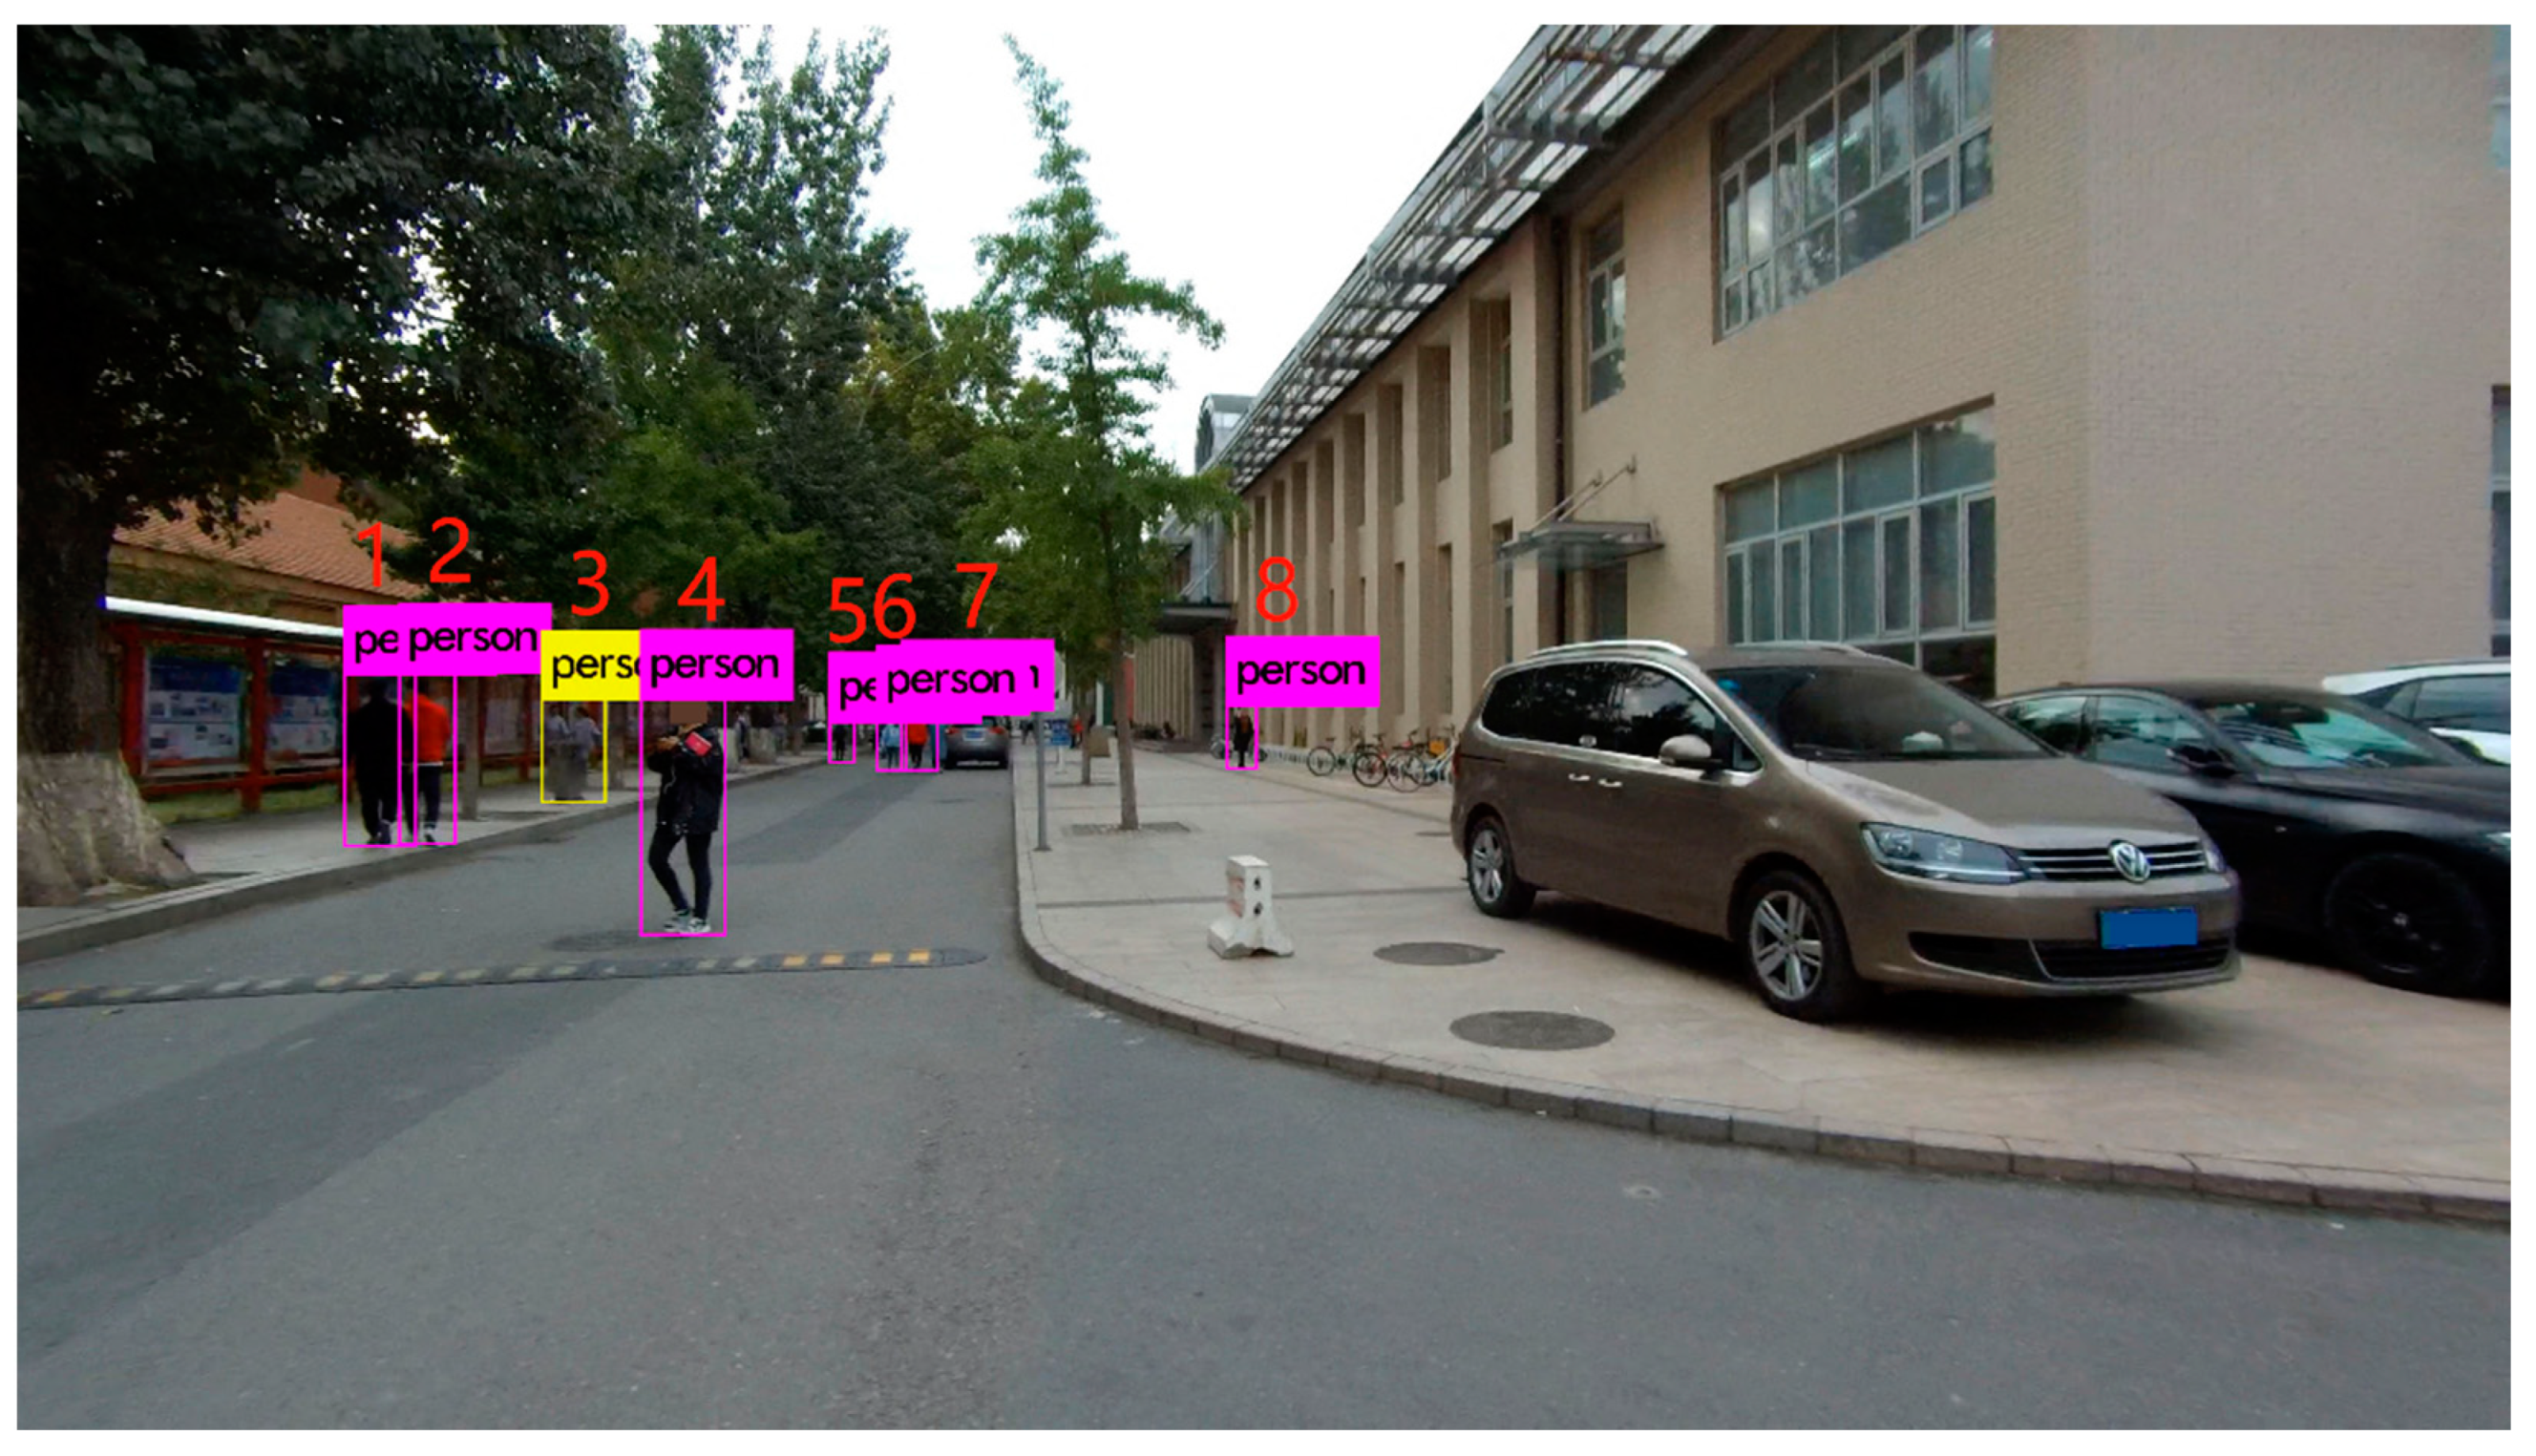
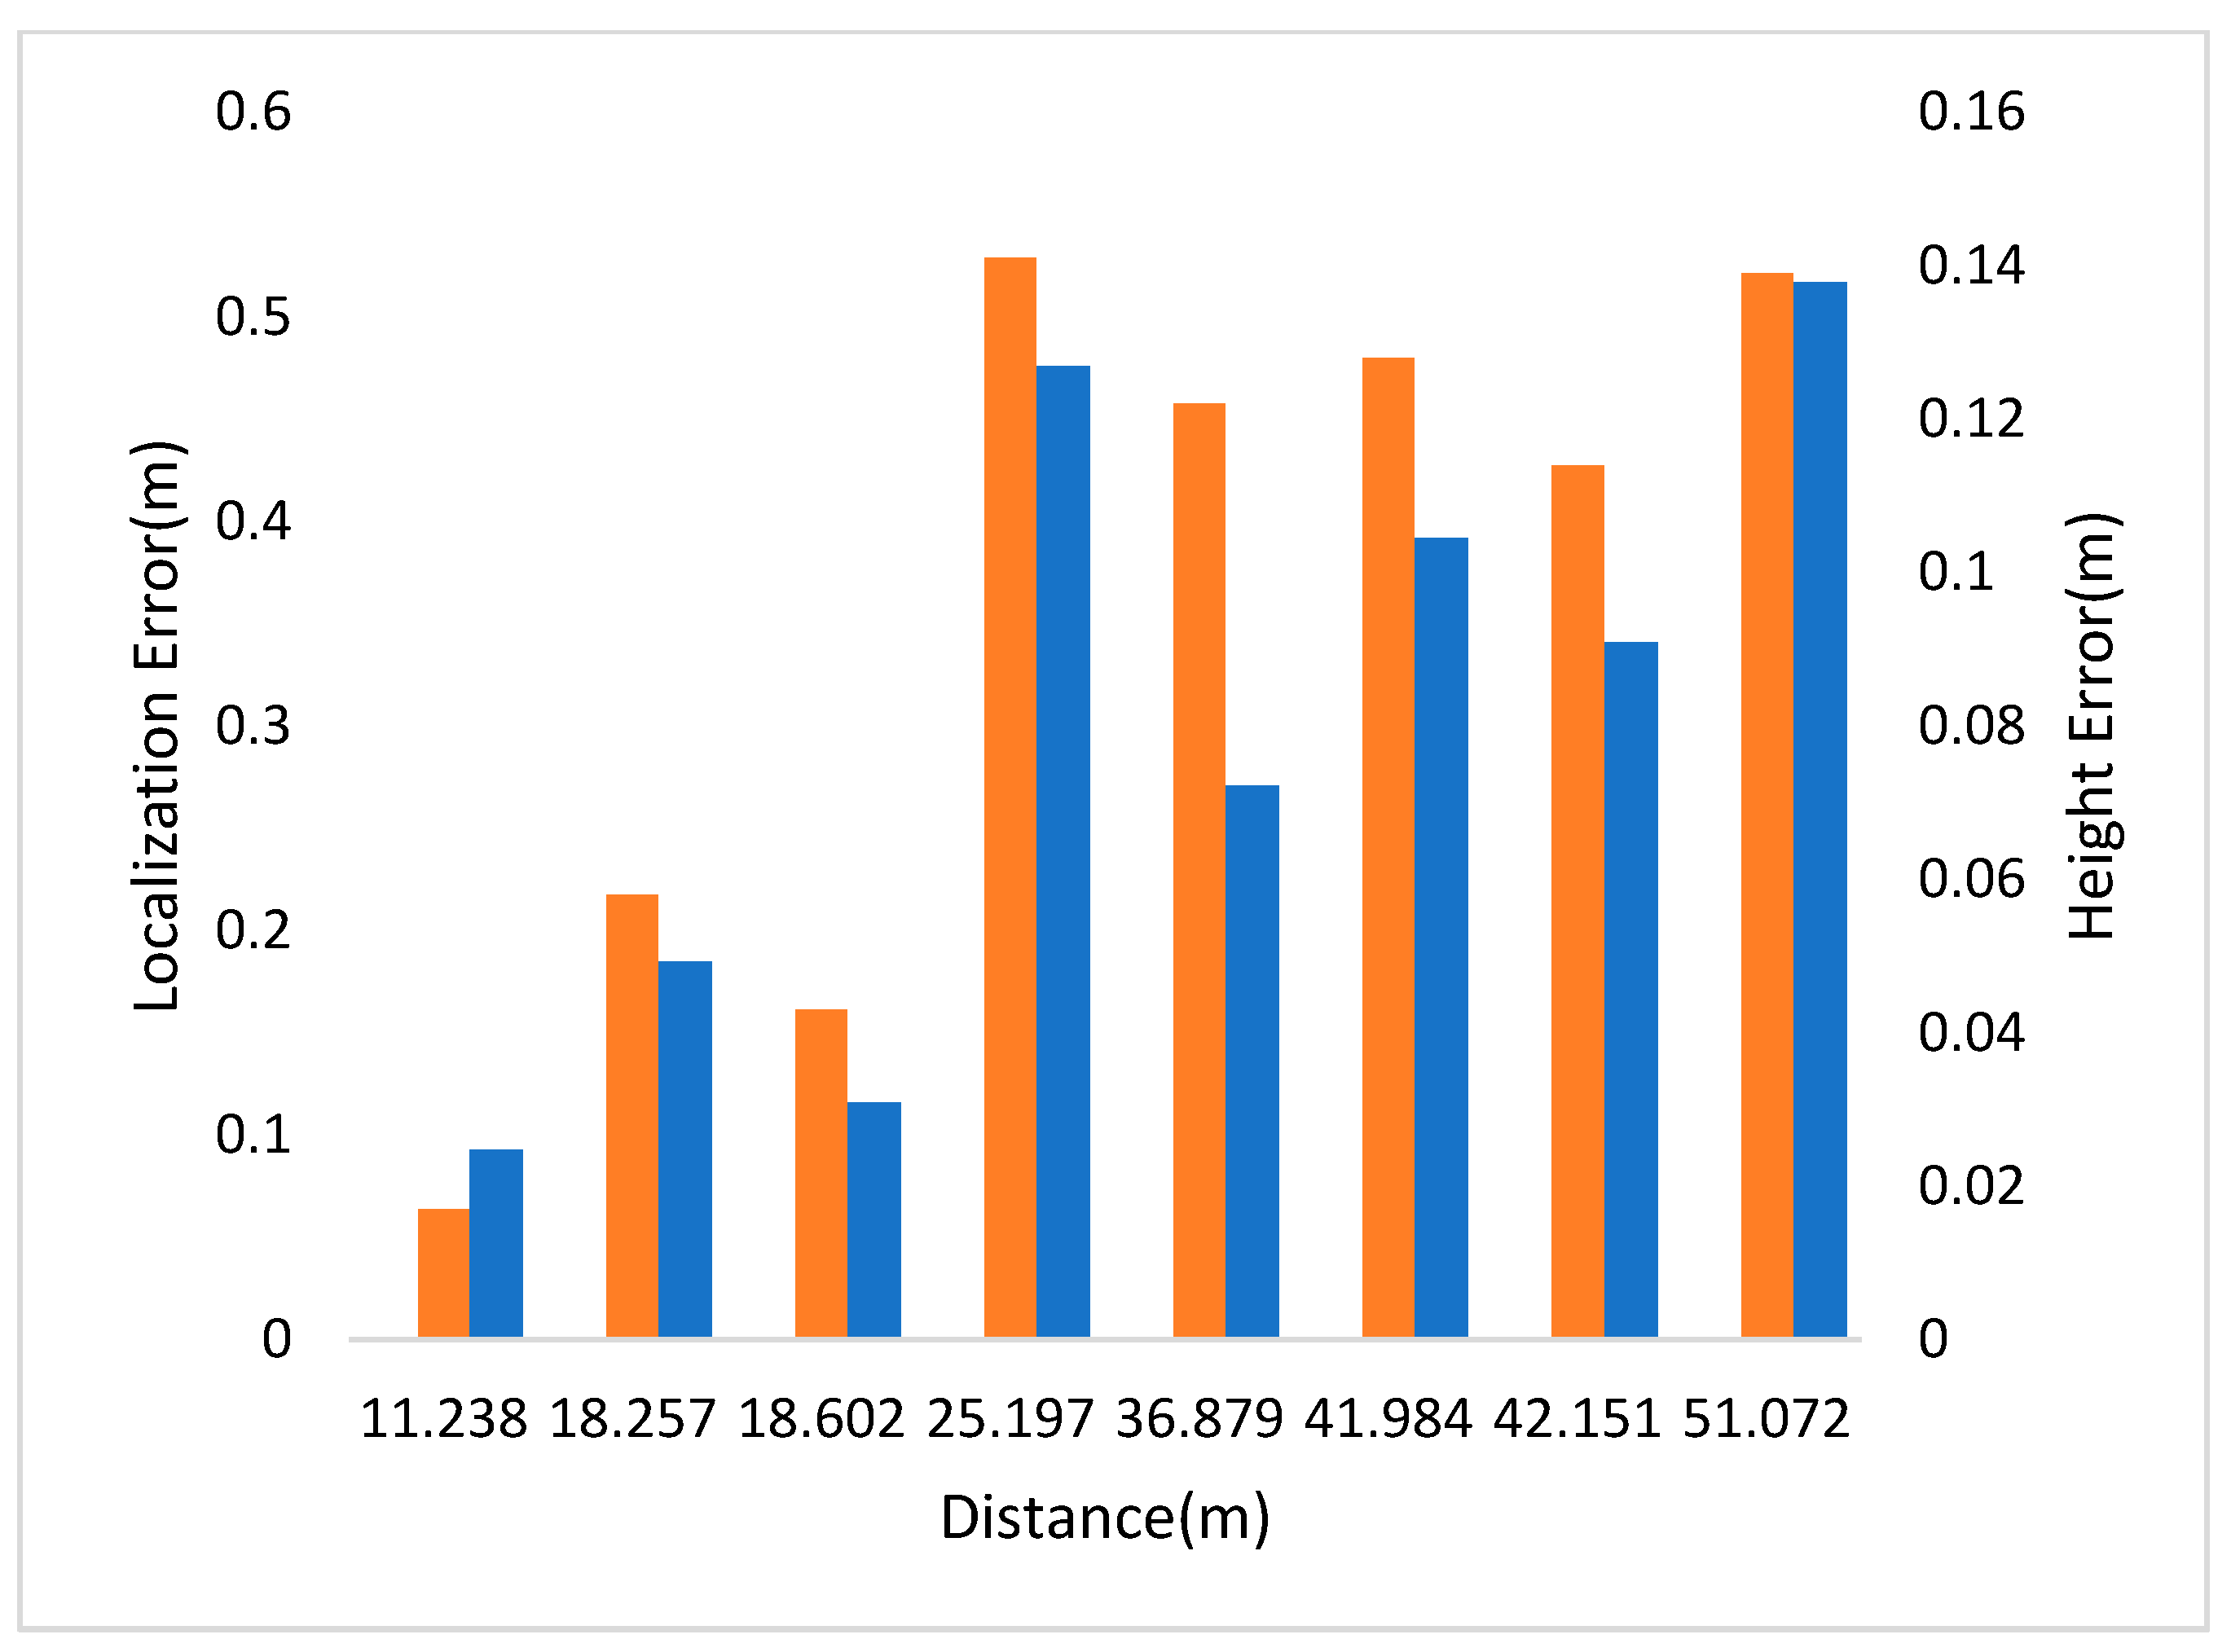
- Scene 2:
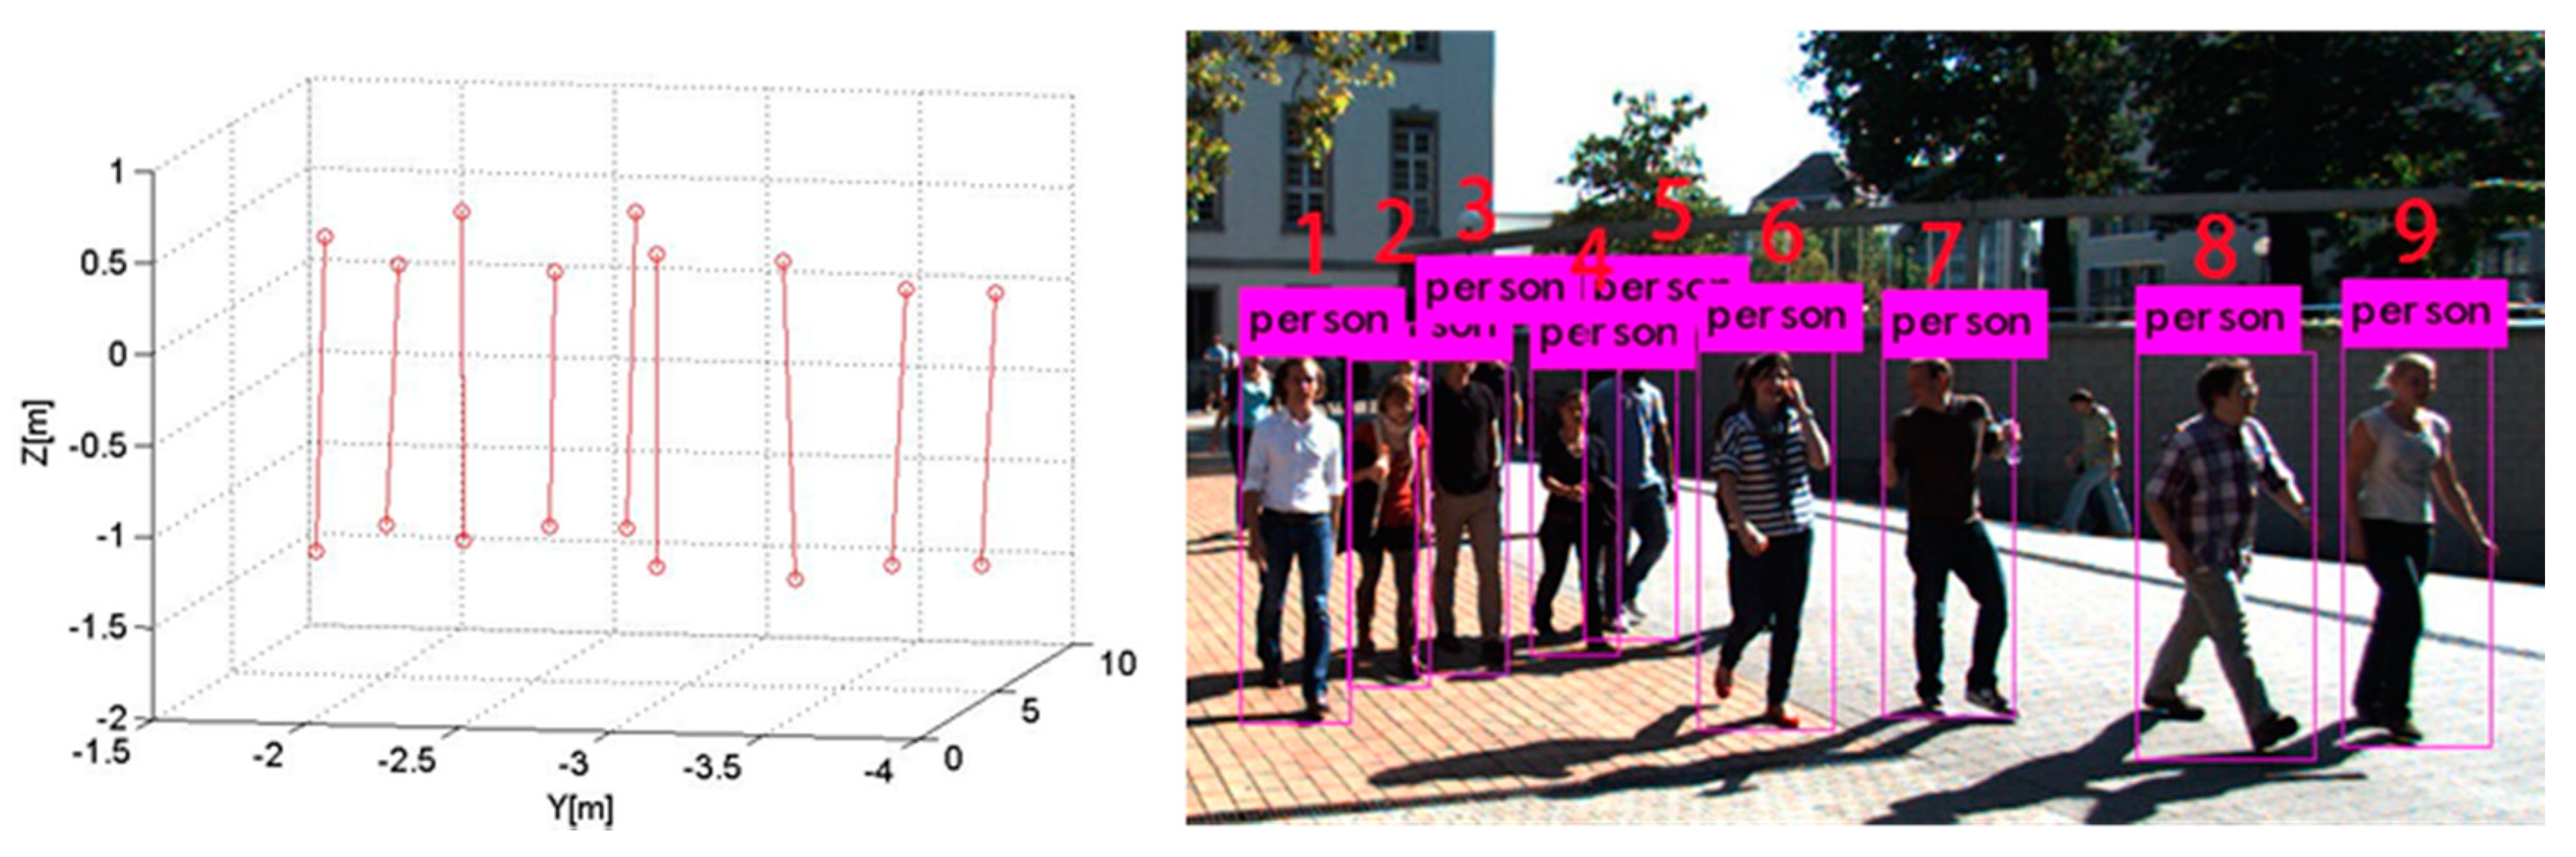
3.2.2. Implementation Details and Results for the KITTI Dataset
3.3. Methods Comparison
3.4. Social Distance Monitoring
4. Discussion
- The quality of point clouds:
- (2).
- Select the corresponding point pairs:
- (3).
- Distance from pedestrian to the projection center of monocular image:
- (4).
- Environmental situation:
5. Conclusions
Author Contributions
Funding
Institutional Review Board Statement
Informed Consent Statement
Data Availability Statement
Acknowledgments
Conflicts of Interest
References
- Kissler, S.M.; Tedijanto, C.; Goldstein, E.; Grad, Y.H.; Lipsitch, M. Projecting the transmission dynamics of SARS-CoV-2 through the postpandemic period. Science 2020, 368, 860–868. [Google Scholar] [CrossRef] [PubMed]
- Chu, D.K.; Akl, E.A.; Duda, S.; Solo, K.; Yaacoub, S.; Schünemann, H.J.; Chu, D.K.; Akl, E.A.; El-harakeh, A.; Bognanni, A.; et al. Physical distancing, face masks, and eye protection to prevent person-to-person transmission of SARS-CoV-2 and COVID-19: A systematic review and meta-analysis. Lancet 2020, 395, 1973–1987. [Google Scholar] [CrossRef]
- Rezaei, M.; Azarmi, M. DeepSOCIAL: Social Distancing Monitoring and Infection Risk Assessment in COVID-19 Pandemic. Appl. Sci. 2020, 10, 7514. [Google Scholar] [CrossRef]
- Jhunjhunwala, A. Role of Telecom Network to Manage COVID-19 in India: Aarogya Setu. Trans. Indian Natl. Acad. Eng. 2020, 5, 157–161. [Google Scholar] [CrossRef]
- Guo, S.; Niu, G.; Wang, Z.; Pun, M.O.; Yang, K. An Indoor Knowledge Graph Framework for Efficient Pedestrian Localization. IEEE Sens. J. 2021, 21, 5151–5163. [Google Scholar] [CrossRef]
- Levchev, P.; Krishnan, M.N.; Yu, C.R.; Menke, J.; Zakhor, A. Simultaneous Fingerprinting and Mapping for Multimodal Image and WiFi Indoor Positioning. In Proceedings of the 2014 International Conference on Indoor Positioning and Indoor Navigation, Busan, Korea, 27–30 October 2014; pp. 442–450. [Google Scholar]
- Liang, J.Z.; Corso, N.; Turner, E.; Zakhor, A. Image Based Localization in Indoor Environments. In Proceedings of the 2013 Fourth International Conference on Computing for Geospatial Research and Application, San Jose, CA, USA, 22–24 July 2013; pp. 70–75. [Google Scholar]
- Zhang, R.; Candra, S.A.; Vetter, K.; Zakhor, A. Sensor Fusion for Semantic Segmentation of Urban Scenes. In Proceedings of the 2015 IEEE International Conference on Robotics and Automation, Seattle, WA, USA, 26–30 May 2015; pp. 1850–1857. [Google Scholar]
- Mousavian, A.; Anguelov, D.; Flynn, J.; Kosecka, J. 3D Bounding Box Estimation Using Deep Learning and Geometry. In Proceedings of the 30th IEEE Conference on Computer Vision and Pattern Recognition, Honolulu, HI, USA, 21–26 July 2016; pp. 5632–5640. [Google Scholar] [CrossRef] [Green Version]
- Zhang, S.; Wang, C.; He, Z.; Li, Q.; Lin, X.; Li, X.; Zhang, J.; Yang, C.; Li, J. Vehicle global 6-DoF pose estimation under traffic surveillance camera. ISPRS J. Photogramm. Remote Sens. 2020, 159, 114–128. [Google Scholar] [CrossRef]
- Gunel, S.; Rhodin, H.; Fua, P. What Face and Body Shapes Can Tell Us About Height. In Proceedings of the 2019 IEEE/Cvf International Conference on Computer Vision Workshops, Seoul, Korea, 27–28 October 2019; pp. 1819–1827. [Google Scholar] [CrossRef]
- Das, S.; Meher, S. Automatic Extraction of Height and Stride parameters for Human Recognition. In Proceedings of the 2013 Students Conference on Engineering and Systems, Allahabad, India, 12–14 April 2013. [Google Scholar]
- Bieler, D.; Günel, S.G.; Fua, P.; Rhodin, H. Gravity as a Reference for Estimating a Person’s Height From Video. In Proceedings of the IEEE/CVF International Conference on Computer Vision (ICCV), Seoul, Korea, 27 October–2 November 2019. [Google Scholar]
- Deng, W.; Bertoni, L.; Kreiss, S.; Alahi, A. Joint Human Pose Estimation and Stereo 3D Localization. In Proceedings of the 2020 IEEE International Conference on Robotics and Automation (ICRA), Paris, France, 31 May–31 August 2020; pp. 2324–2330. [Google Scholar]
- Bertoni, L.; Kreiss, S.; Alahi, A. Monoloco: Monocular 3d pedestrian localization and uncertainty estimation. In Proceedings of the IEEE International Conference on Computer Vision, Seoul, Korea, 27 October–2 November 2019; pp. 6861–6871. [Google Scholar]
- Bertoni, L.; Kreiss, S.; Alahi, A. Perceiving Humans: From Monocular 3D Localization to Social Distancing. IEEE Trans. Intell. Transp. Syst. 2021. [Google Scholar] [CrossRef]
- Abdel-Aziz, Y.I.; Karara, H.; Hauck, M. Direct linear transformation from comparator coordinates into object space coordinates in close-range photogrammetry. Photogramm. Eng. Remote Sens. 2015, 81, 103–107. [Google Scholar] [CrossRef]
- Redmon, J.; Divvala, S.; Girshick, R.; Farhadi, A. You Only Look Once: Unified, Real-Time Object Detection. In Proceedings of the 2016 IEEE Conference on Computer Vision and Pattern Recognition, Las Vegas, NV, USA, 26 June–1 July 2016; pp. 779–788. [Google Scholar] [CrossRef] [Green Version]
- Xiang, Y.; Choi, W.G.; Lin, Y.Q.; Savarese, S. Data-Driven 3D Voxel Patterns for Object Category Recognition. In Proceedings of the 2015 IEEE Conference on Computer Vision and Pattern Recognition, Boston, MA, USA, 7–12 June 2015; pp. 1903–1911. [Google Scholar]
- Geiger, A.; Lenz, P.; Urtasun, R. Are we ready for autonomous driving? The KITTI vision benchmark suite. In Proceedings of the 2012 IEEE Conference on Computer Vision and Pattern Recognition, Providence, RI, USA, 16–21 June 2012; pp. 3354–3361. [Google Scholar]
- Chen, X.Z.; Kundu, K.; Zhang, Z.Y.; Ma, H.M.; Fidler, S.; Urtasun, R. Monocular 3D Object Detection for Autonomous Driving. In Proceedings of the 2016 IEEE Conference on Computer Vision and Pattern Recognition, Las Vegas, NV, USA, 27–30 June 2016; pp. 2147–2156. [Google Scholar] [CrossRef]
- Godard, C.; Mac Aodha, O.; Brostow, G.J. Unsupervised Monocular Depth Estimation with Left-Right Consistency. In Proceedings of the 30th IEEE Conference on Computer Vision and Pattern Recognition, Honolulu, HI, USA, 21–26 July 2016; pp. 6602–6611. [Google Scholar] [CrossRef] [Green Version]
- Chen, X.Z.; Kundu, K.; Zhu, Y.K.; Berneshawi, A.; Ma, H.M.; Fidler, S.; Urtasun, R. 3D Object Proposals for Accurate Object Class Detection. In Advances in Neural Information Processing Systems 28; Cortes, C., Lawrence, N.D., Lee, D.D., Sugiyama, M., Garnett, R., Eds.; Neural Information Processing Systems (Nips): La Jolla, CA, USA, 2015; Volume 28. [Google Scholar]
- Kreiss, S.; Bertoni, L.; Alahi, A. PifPaf: Composite Fields for Human Pose Estimation. In Proceedings of the 2019 IEEE/Cvf Conference on Computer Vision and Pattern Recognition, Long Beach, CA, USA, 15–20 June 2019; pp. 11969–11978. [Google Scholar] [CrossRef] [Green Version]
- Visscher, P.M. Sizing up human height variation. Nat. Genet. 2008, 40, 489–490. [Google Scholar] [CrossRef] [PubMed]
- Kundegorski, M.E.; Breckon, T.P. A Photogrammetric Approach for Real-time 3D Localization and Tracking of Pedestrians in Monocular Infrared Imagery. In Optics and Photonics for Counterterrorism, Crime Fighting, and Defence X; and Optical Materials and Biomaterials in Security and Defence Systems Technology Xi; Burgess, D., Owen, G., Rana, H., Zamboni, R., Kajzar, F., Szep, A.A., Eds.; International Society for Optics and Photonicsing: Bellingham, WA, USA, 2014; Volume 9253, p. 92530I. [Google Scholar]


| Equipment Type | CUMTB-Campus | KITTI | ||
|---|---|---|---|---|
| Canon EOS 50D | GeoSLAM-ZEB-HORIZON | FL2-14S3C-C | Velodyne 64-Wire 3D Laser Scanner | |
| Mode | Image | Point clouds | Image | Point clouds |
| Resolution | 4752 × 3168 | 1.5–3 cm | 1224 × 370 | 2 cm |
| Pedestrian Number | Distance (m) | Localization Error (m) | Height Error (m) | Social Distance | |||
|---|---|---|---|---|---|---|---|
| Adjacent Pedestrian | Truth Value (m) | Calculated Value (m) | Error (m) | ||||
| 1 | 10.203 | 0.320 | 0.054 | — | — | — | — |
| 2 | 14.271 | 0.242 | 0.007 | 1~2 | 4.832 | 4.770 | −0.062 |
| 3 | 24.421 | 0.133 | 0.229 | 2~3 | 10.266 | 10.199 | −0.067 |
| 4 | 36.563 | 0.229 | 0.071 | 3~4 | 13.122 | 13.209 | 0.087 |
| Pedestrian Number | Distance (m) | Localization Error (m) | Height Error (m) | Social Distance | |||
|---|---|---|---|---|---|---|---|
| Adjacent Pedestrian | Truth Value (m) | Calculated Value (m) | Error (m) | ||||
| 1 | 18.257 | 0.185 | 0.058 | — | — | — | — |
| 2 | 18.602 | 0.116 | 0.043 | 1~2 | 0.682 | 0.589 | −0.093 |
| 3 | 25.197 | 0.476 | 0.141 | 2~3 | 8.059 | 8.176 | 0.117 |
| 4 | 11.238 | 0.093 | 0.017 | 3~4 | 14.709 | 14.548 | −0.161 |
| 5 | 51.072 | 0.517 | 0.139 | 4~5 | 41.132 | 40.925 | −0.207 |
| 6 | 42.151 | 0.341 | 0.114 | 5~6 | 9.171 | 9.367 | 0.196 |
| 7 | 41.984 | 0.392 | 0.128 | 6~7 | 0.676 | 0.558 | −0.118 |
| 8 | 36.879 | 0.271 | 0.122 | 7~8 | 6.205 | 6.112 | −0.093 |
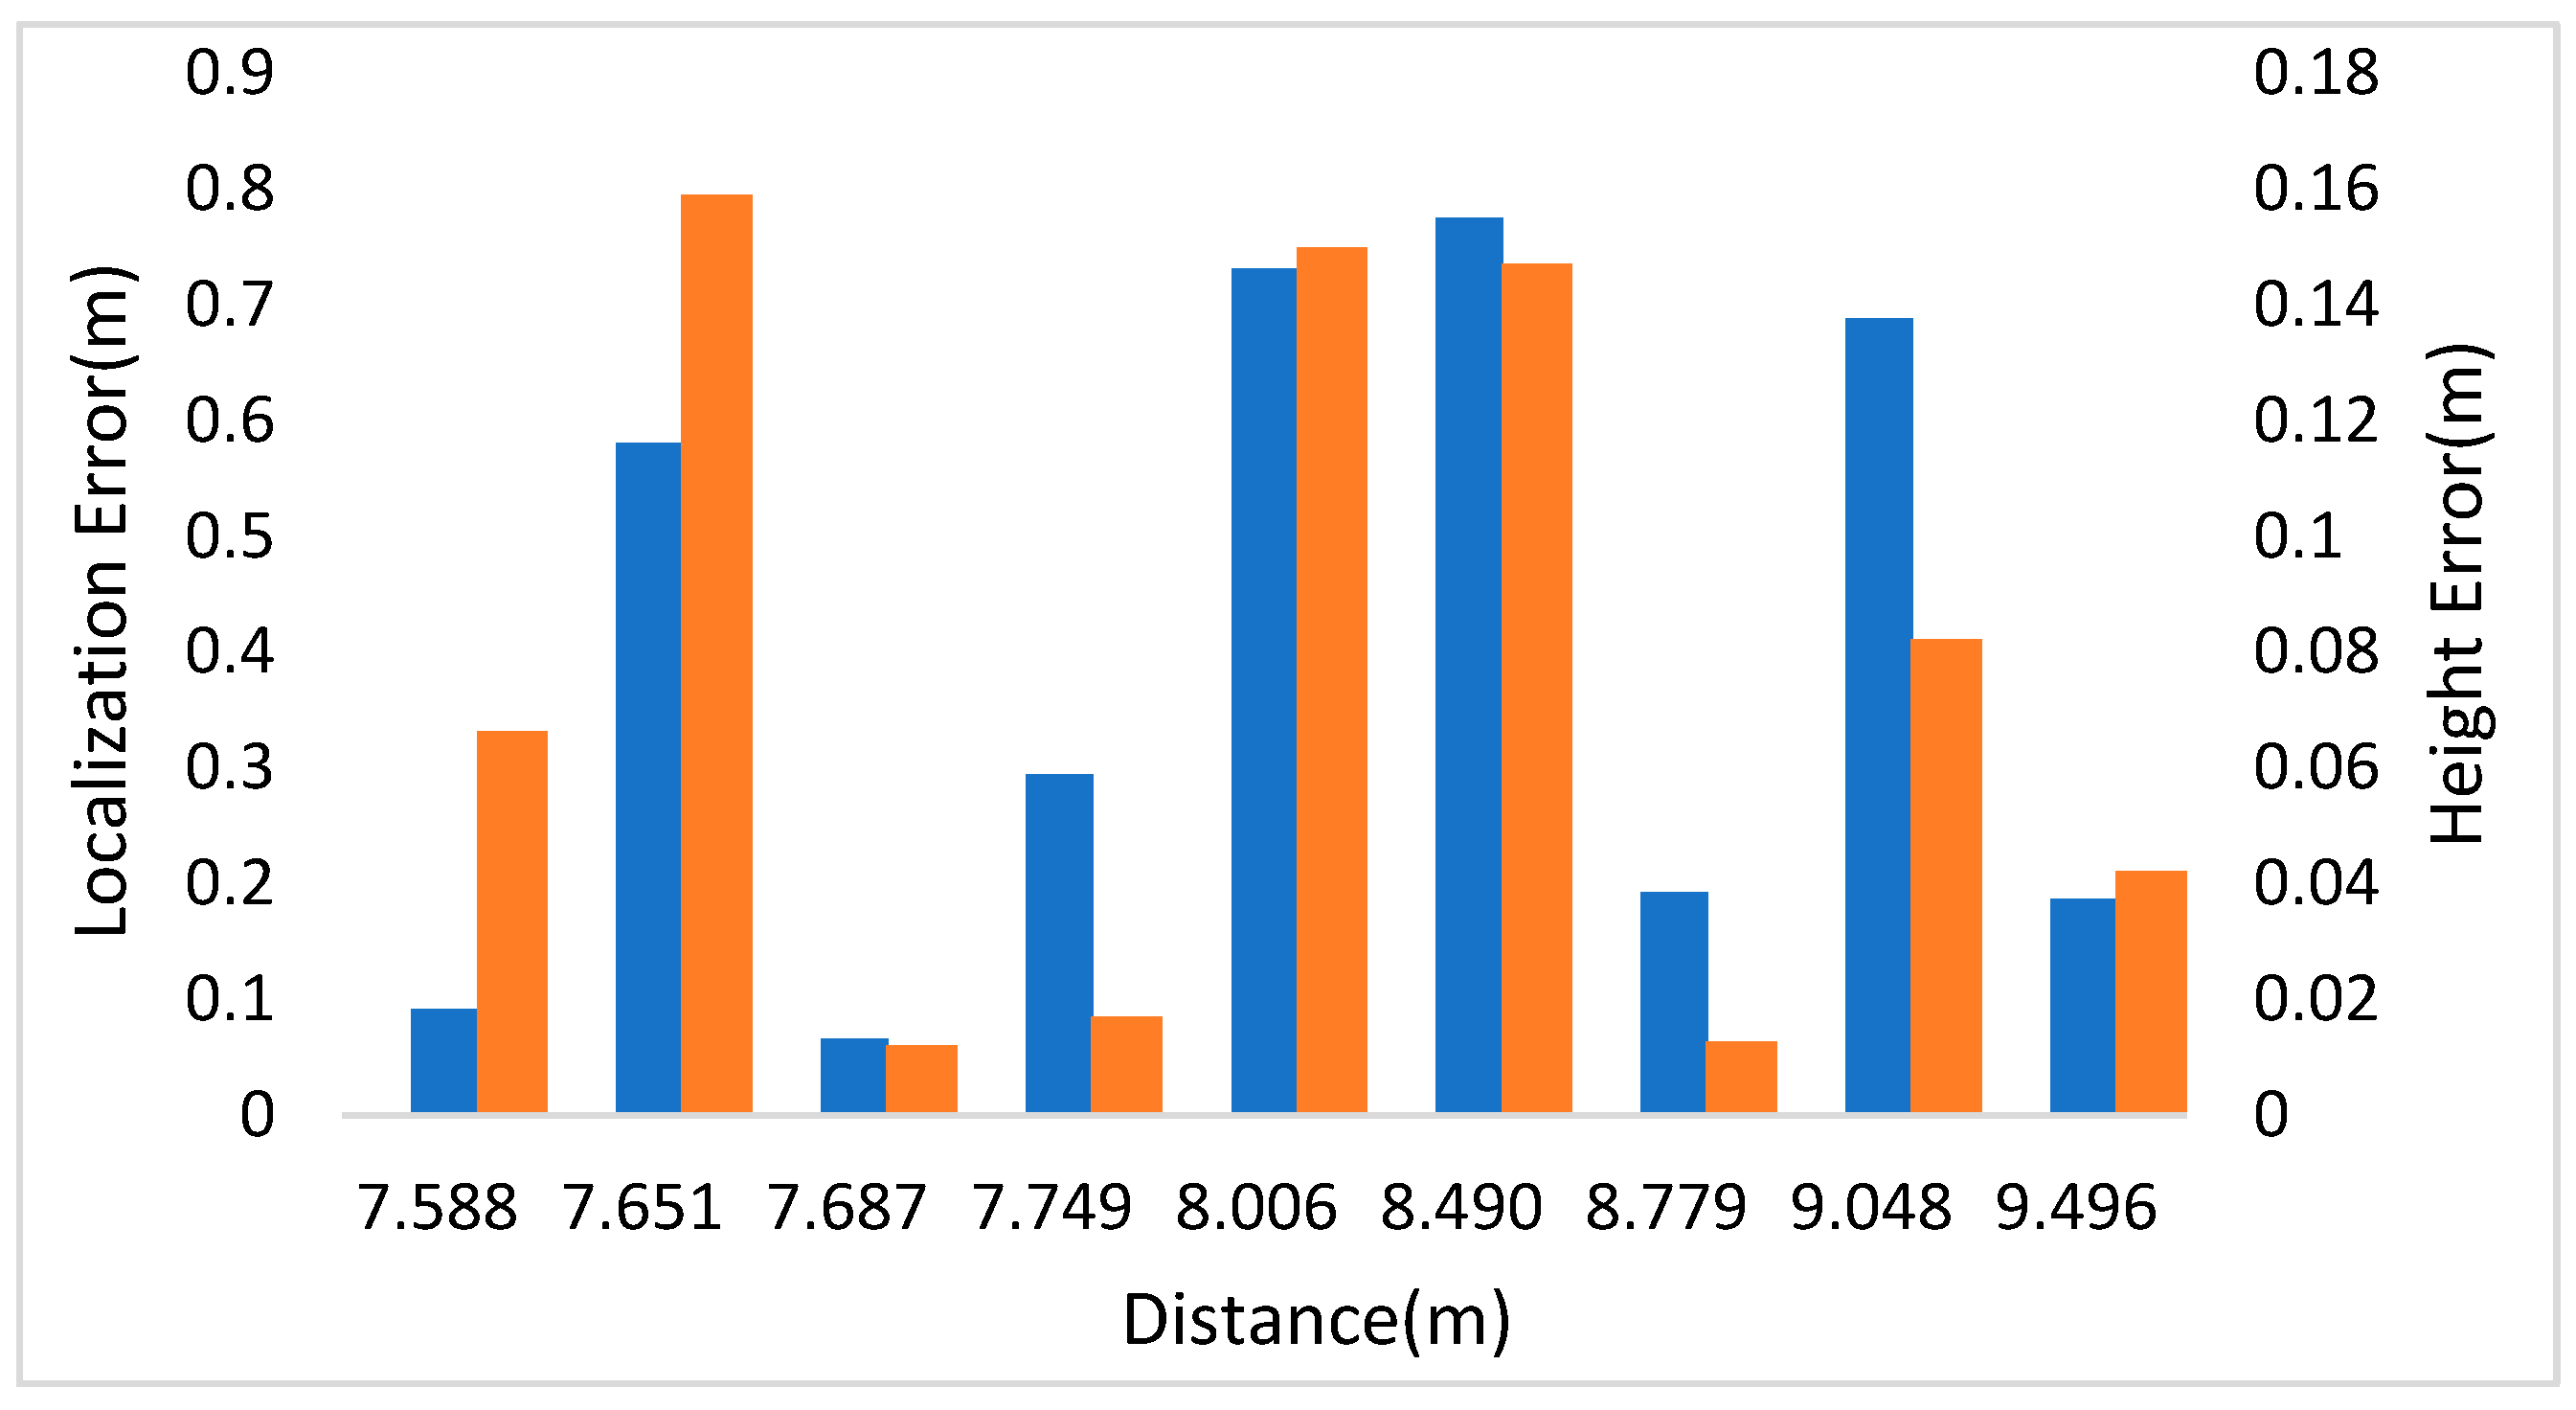
| Pedestrian Number | Distance (m) | Localization Error (m) | Height Error (m) | Social Distance | |||
|---|---|---|---|---|---|---|---|
| Adjacent Pedestrian | Truth Value (m) | Calculated Value (m) | Error (m) | ||||
| 1 | 7.749 | 0.295 | 0.017 | — | — | — | — |
| 2 | 8.490 | 0.775 | 0.147 | 1~2 | 0.868 | 0.688 | −0.180 |
| 3 | 8.779 | 0.193 | 0.012 | 2~3 | 0.632 | 0.860 | 0.228 |
| 4 | 9.048 | 0.688 | 0.082 | 3~4 | 0.683 | 0.585 | −0.098 |
| 5 | 9.496 | 0.187 | 0.042 | 4~5 | 0.606 | 0.852 | 0.246 |
| 6 | 7.588 | 0.092 | 0.066 | 5~6 | 2.110 | 2.007 | −0.103 |
| 7 | 7.687 | 0.066 | 0.012 | 6~7 | 0.929 | 0.930 | 0.001 |
| 8 | 7.651 | 0.581 | 0.159 | 7~8 | 1.102 | 1.216 | 0.114 |
| 9 | 8.006 | 0.731 | 0.150 | 8~9 | 0.677 | 0.643 | −0.034 |
| Method | Type | ALE (m) | |||
|---|---|---|---|---|---|
| r = 0.5 m | r = 1 m | r = 2 m | Fully Visible | ||
| Mono3D | Mono | 13.2 | 23.2 | 38.9 | 2.32 |
| MonoDepth + PifPaf [24] | Mono | 20.5 | 35.3 | 50.6 | 1.69 |
| Monoloco-trained on KITTI | Mono | 29.0 | 49.6 | 71.2 | 0.98 |
| 3DOP | Stereo | 41.4 | 54.9 | 63.2 | 0.71 |
| Our proposed method | Mono | 78.0 | 100.0 | 100.0 | 0.20 |
Publisher’s Note: MDPI stays neutral with regard to jurisdictional claims in published maps and institutional affiliations. |
© 2021 by the authors. Licensee MDPI, Basel, Switzerland. This article is an open access article distributed under the terms and conditions of the Creative Commons Attribution (CC BY) license (https://creativecommons.org/licenses/by/4.0/).
Share and Cite
Niu, Y.; Xu, Z.; Xu, E.; Li, G.; Huo, Y.; Sun, W. Monocular Pedestrian 3D Localization for Social Distance Monitoring. Sensors 2021, 21, 5908. https://doi.org/10.3390/s21175908
Niu Y, Xu Z, Xu E, Li G, Huo Y, Sun W. Monocular Pedestrian 3D Localization for Social Distance Monitoring. Sensors. 2021; 21(17):5908. https://doi.org/10.3390/s21175908
Chicago/Turabian StyleNiu, Yiru, Zhihua Xu, Ershuai Xu, Gongwei Li, Yuan Huo, and Wenbin Sun. 2021. "Monocular Pedestrian 3D Localization for Social Distance Monitoring" Sensors 21, no. 17: 5908. https://doi.org/10.3390/s21175908
APA StyleNiu, Y., Xu, Z., Xu, E., Li, G., Huo, Y., & Sun, W. (2021). Monocular Pedestrian 3D Localization for Social Distance Monitoring. Sensors, 21(17), 5908. https://doi.org/10.3390/s21175908