
Computer-Aided Diagnosis Algorithm for Classification of Malignant Melanoma Using Deep Neural Networks


Abstract
:1. Introduction
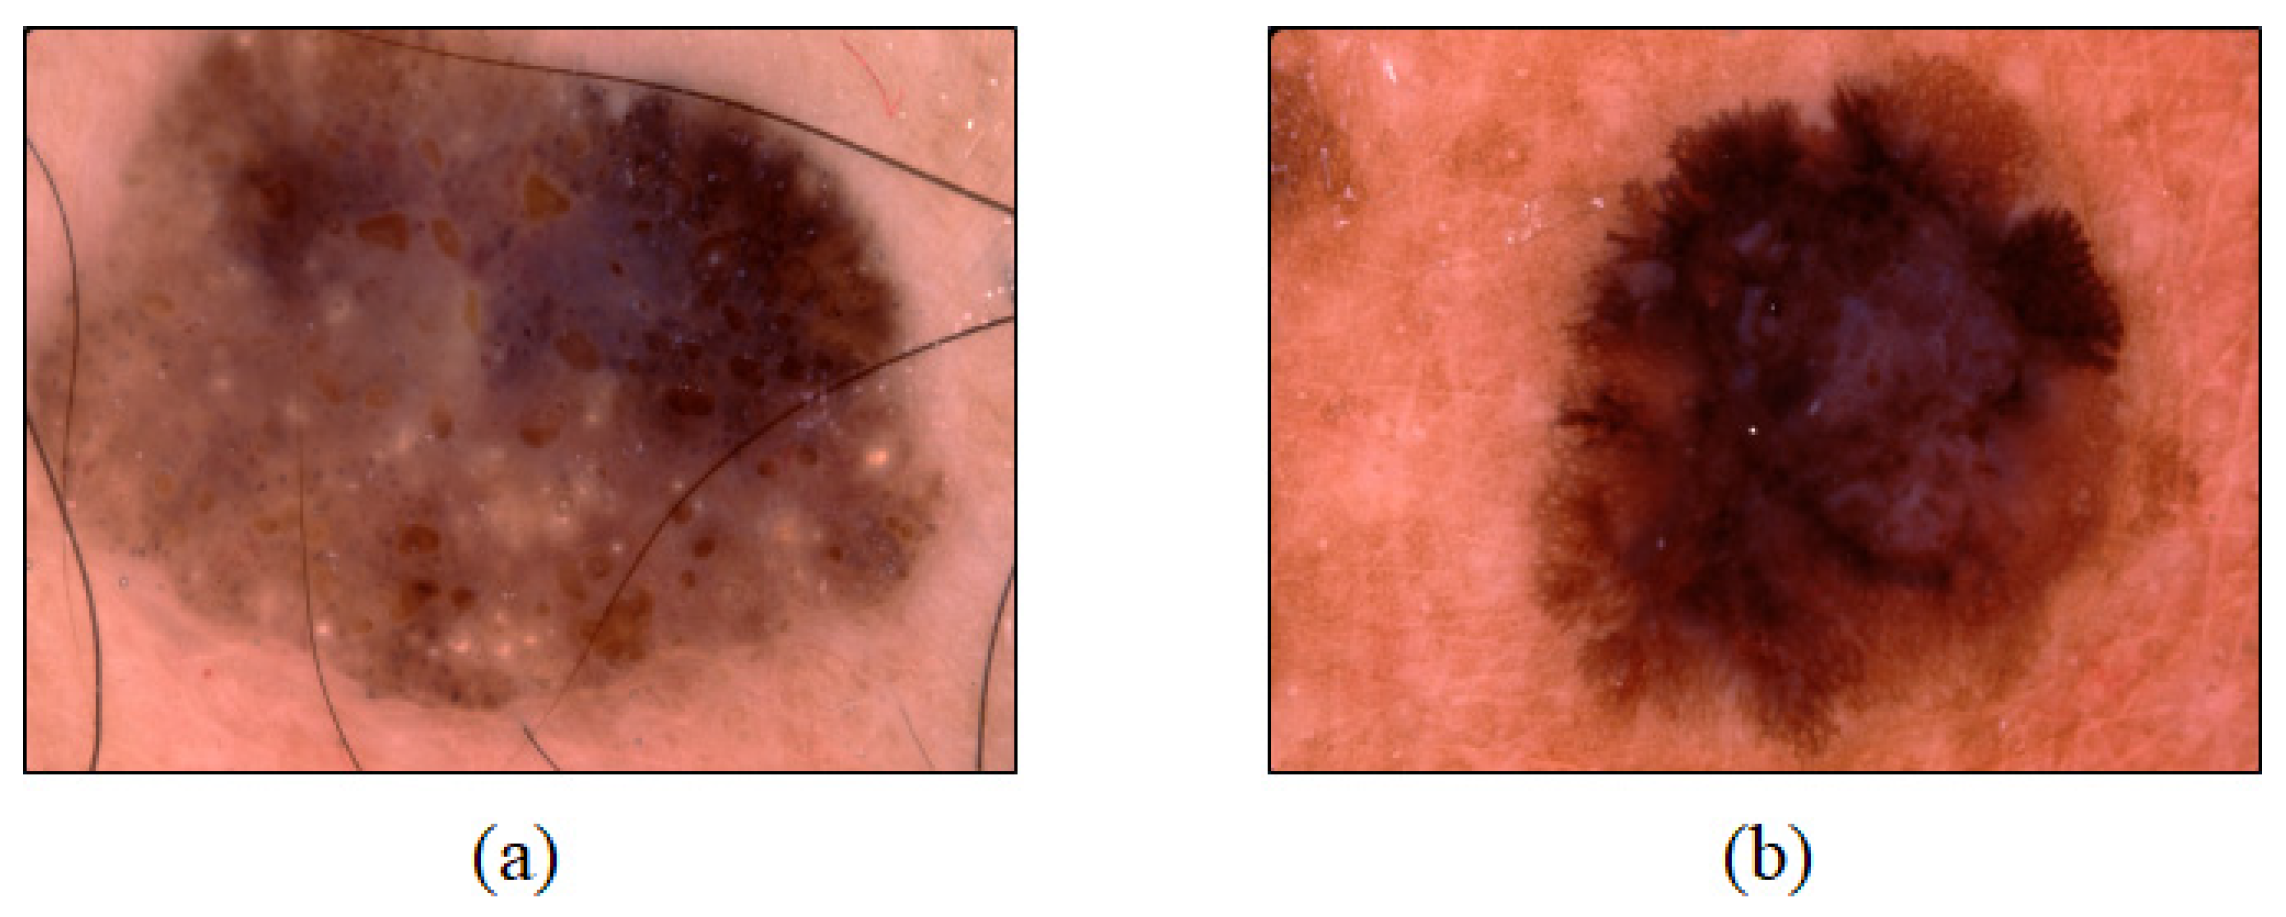
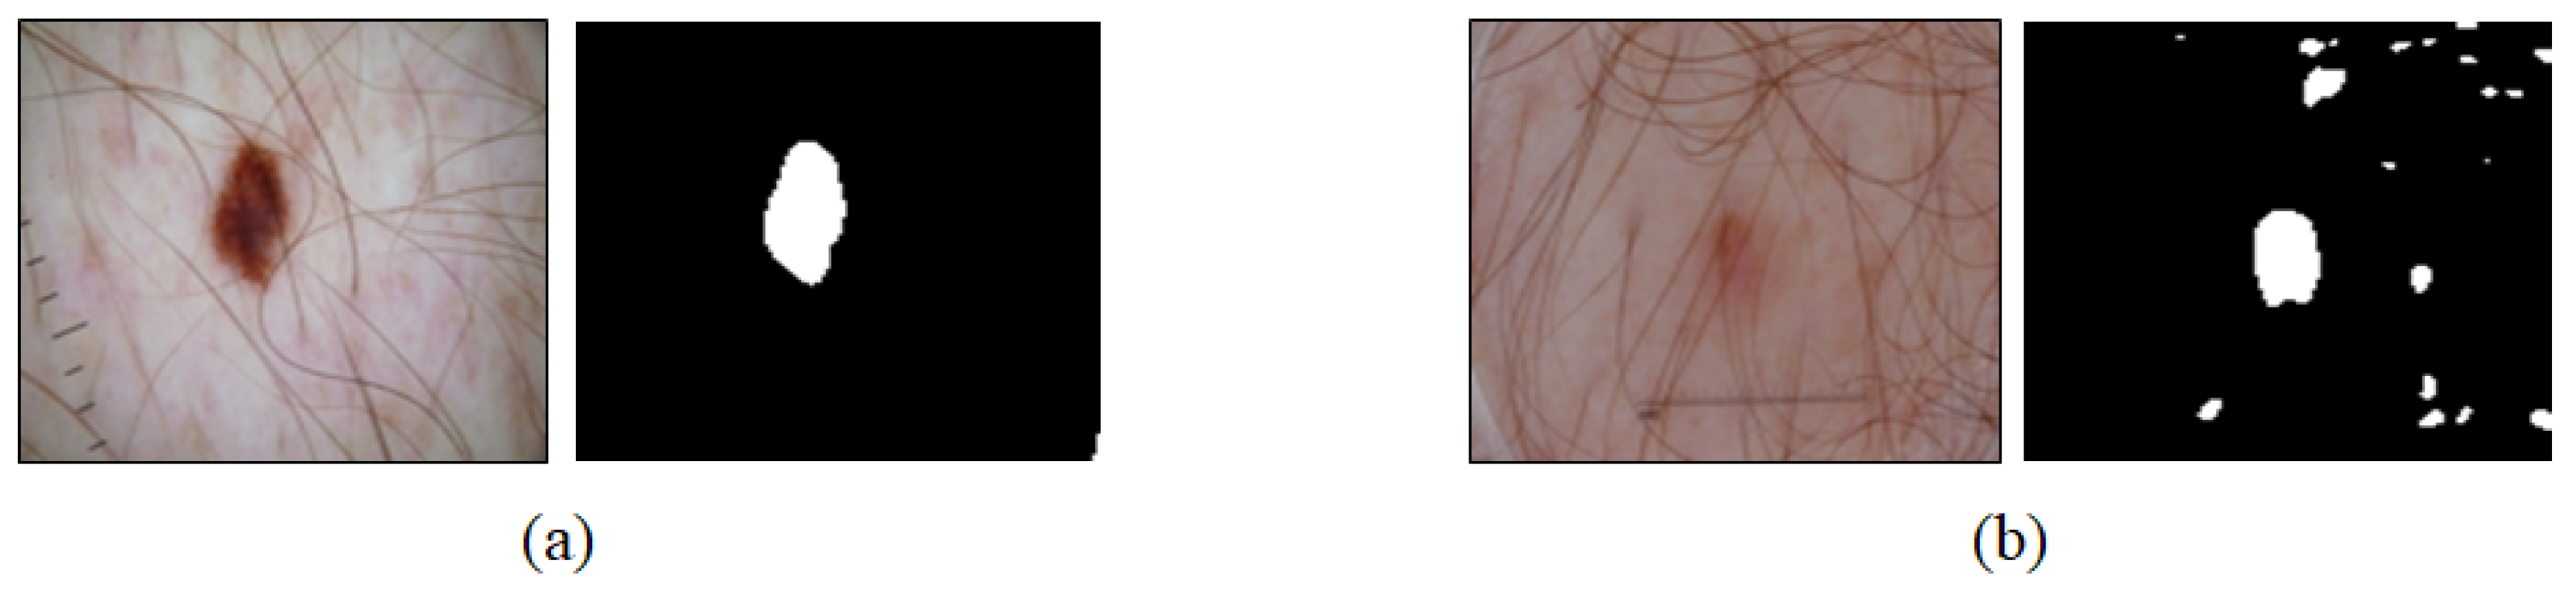
2. Lesion Area Segmentation
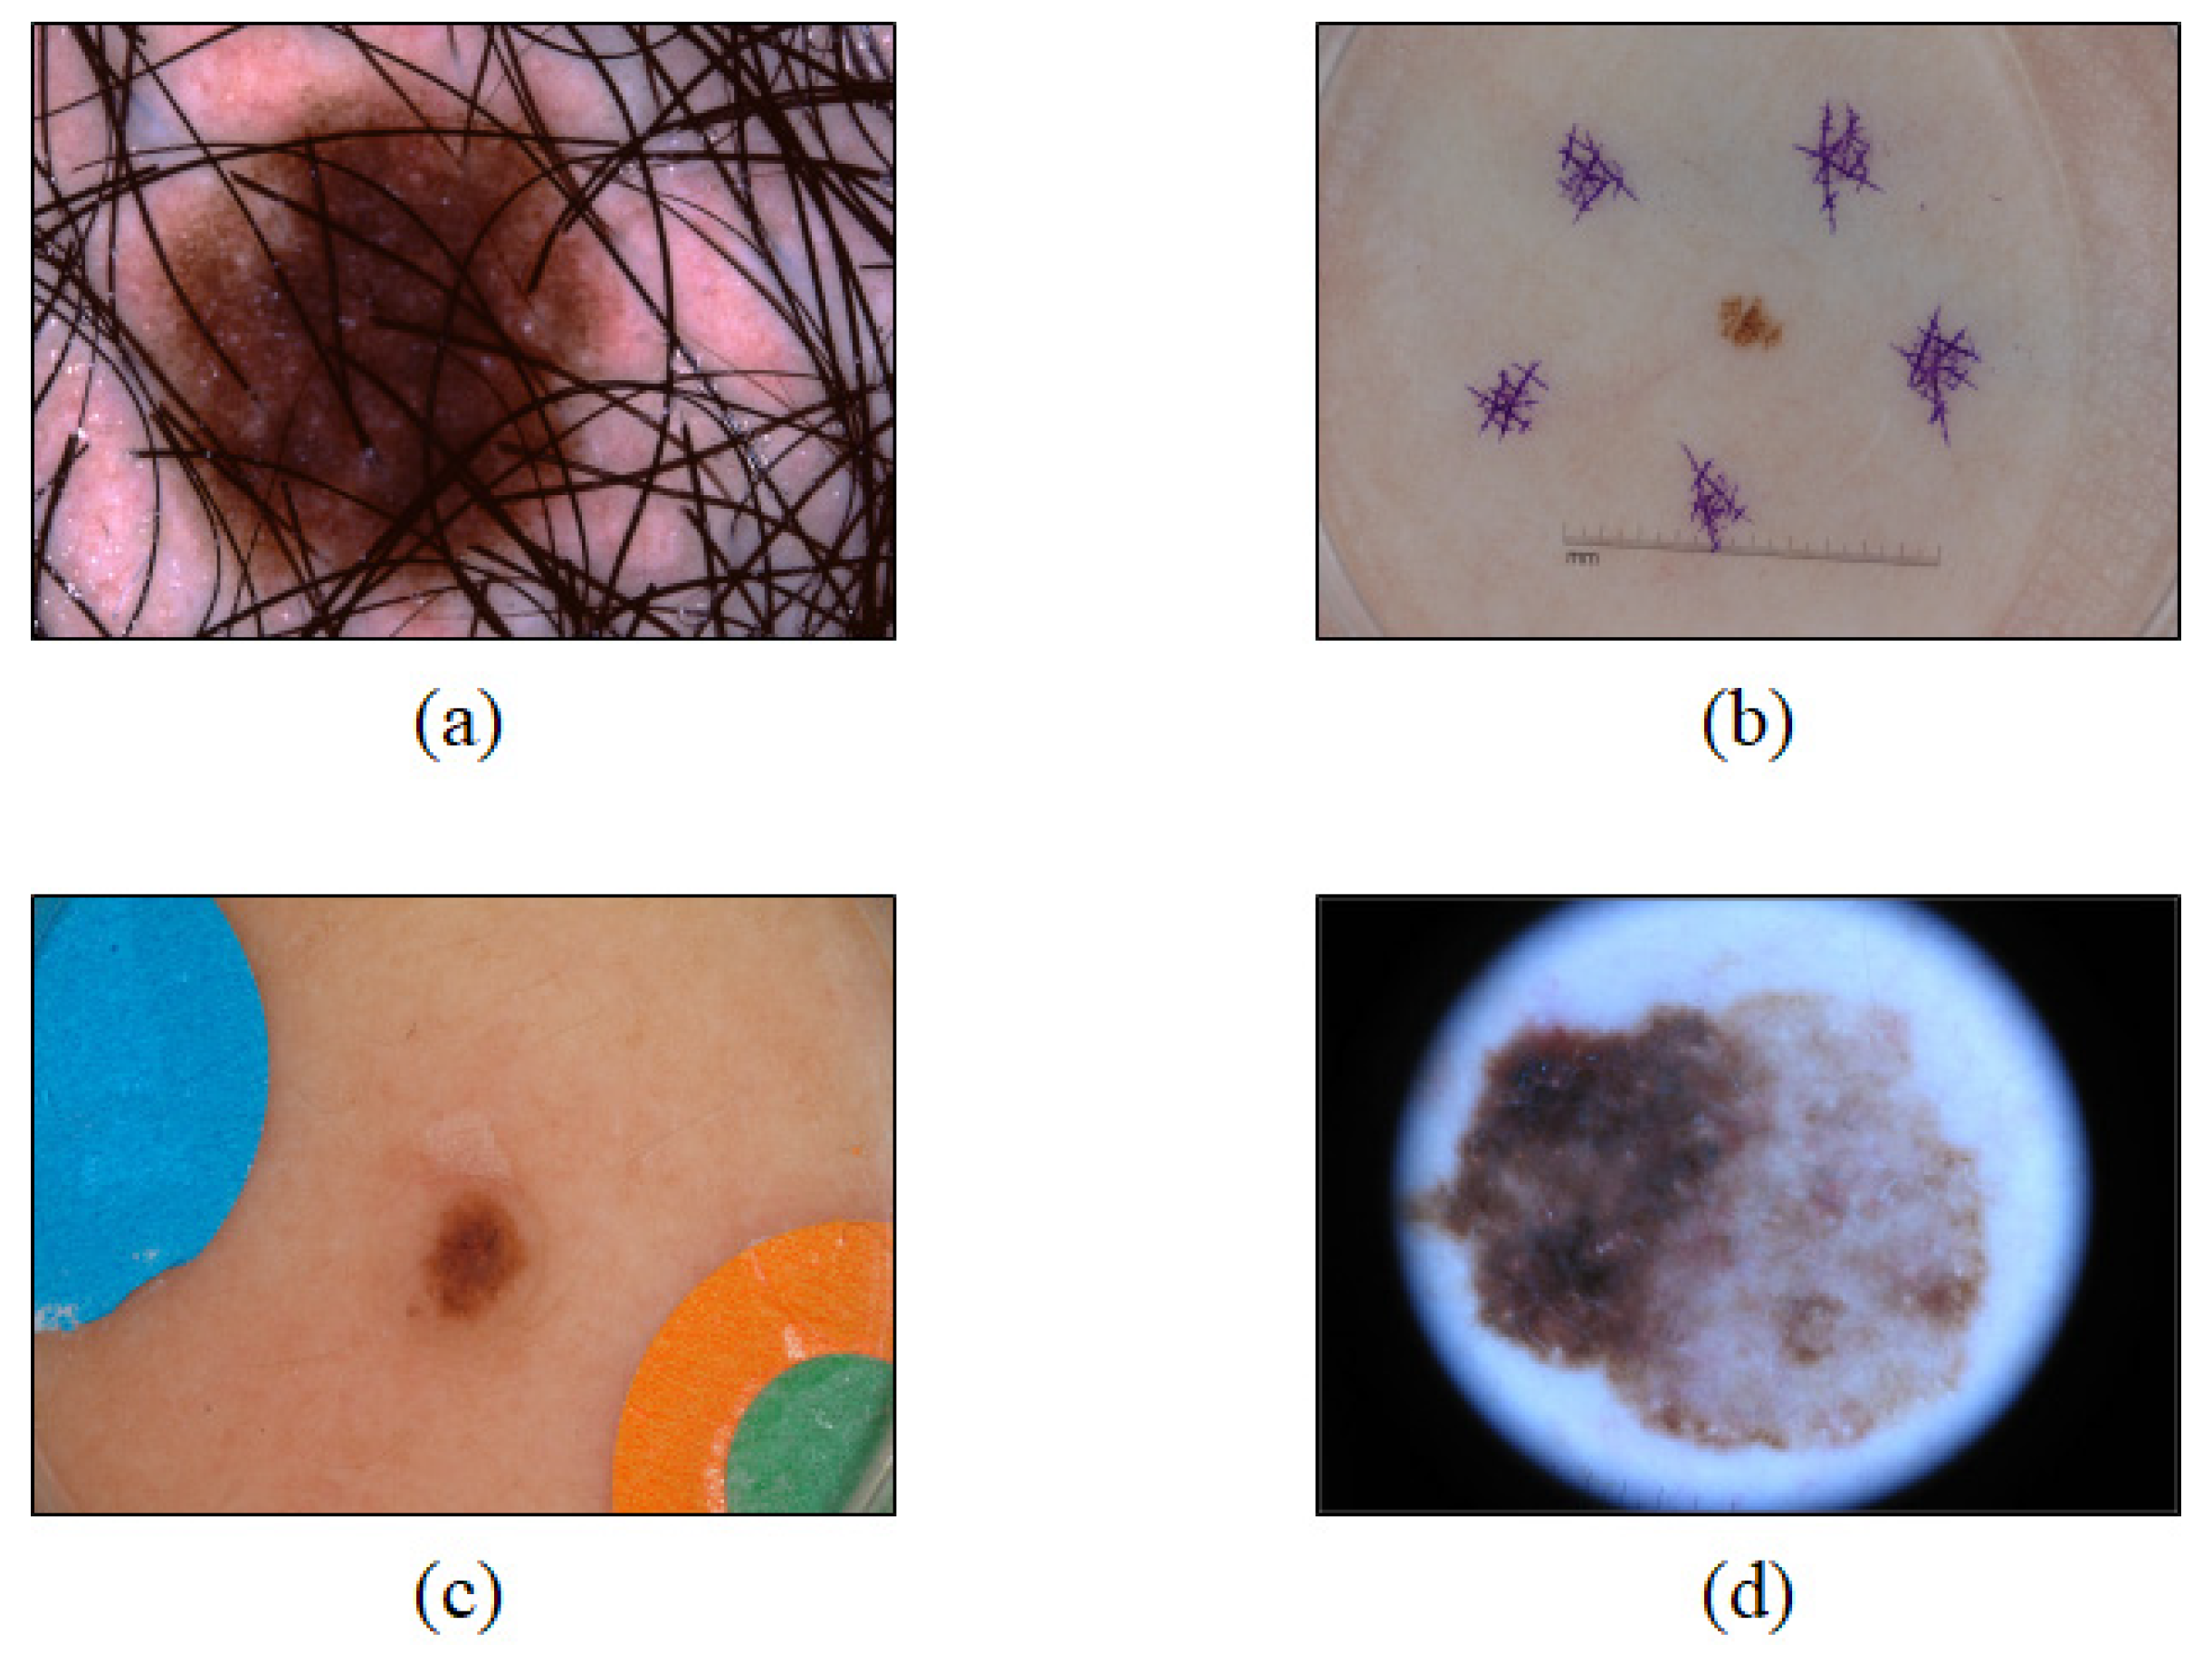
2.1. Data
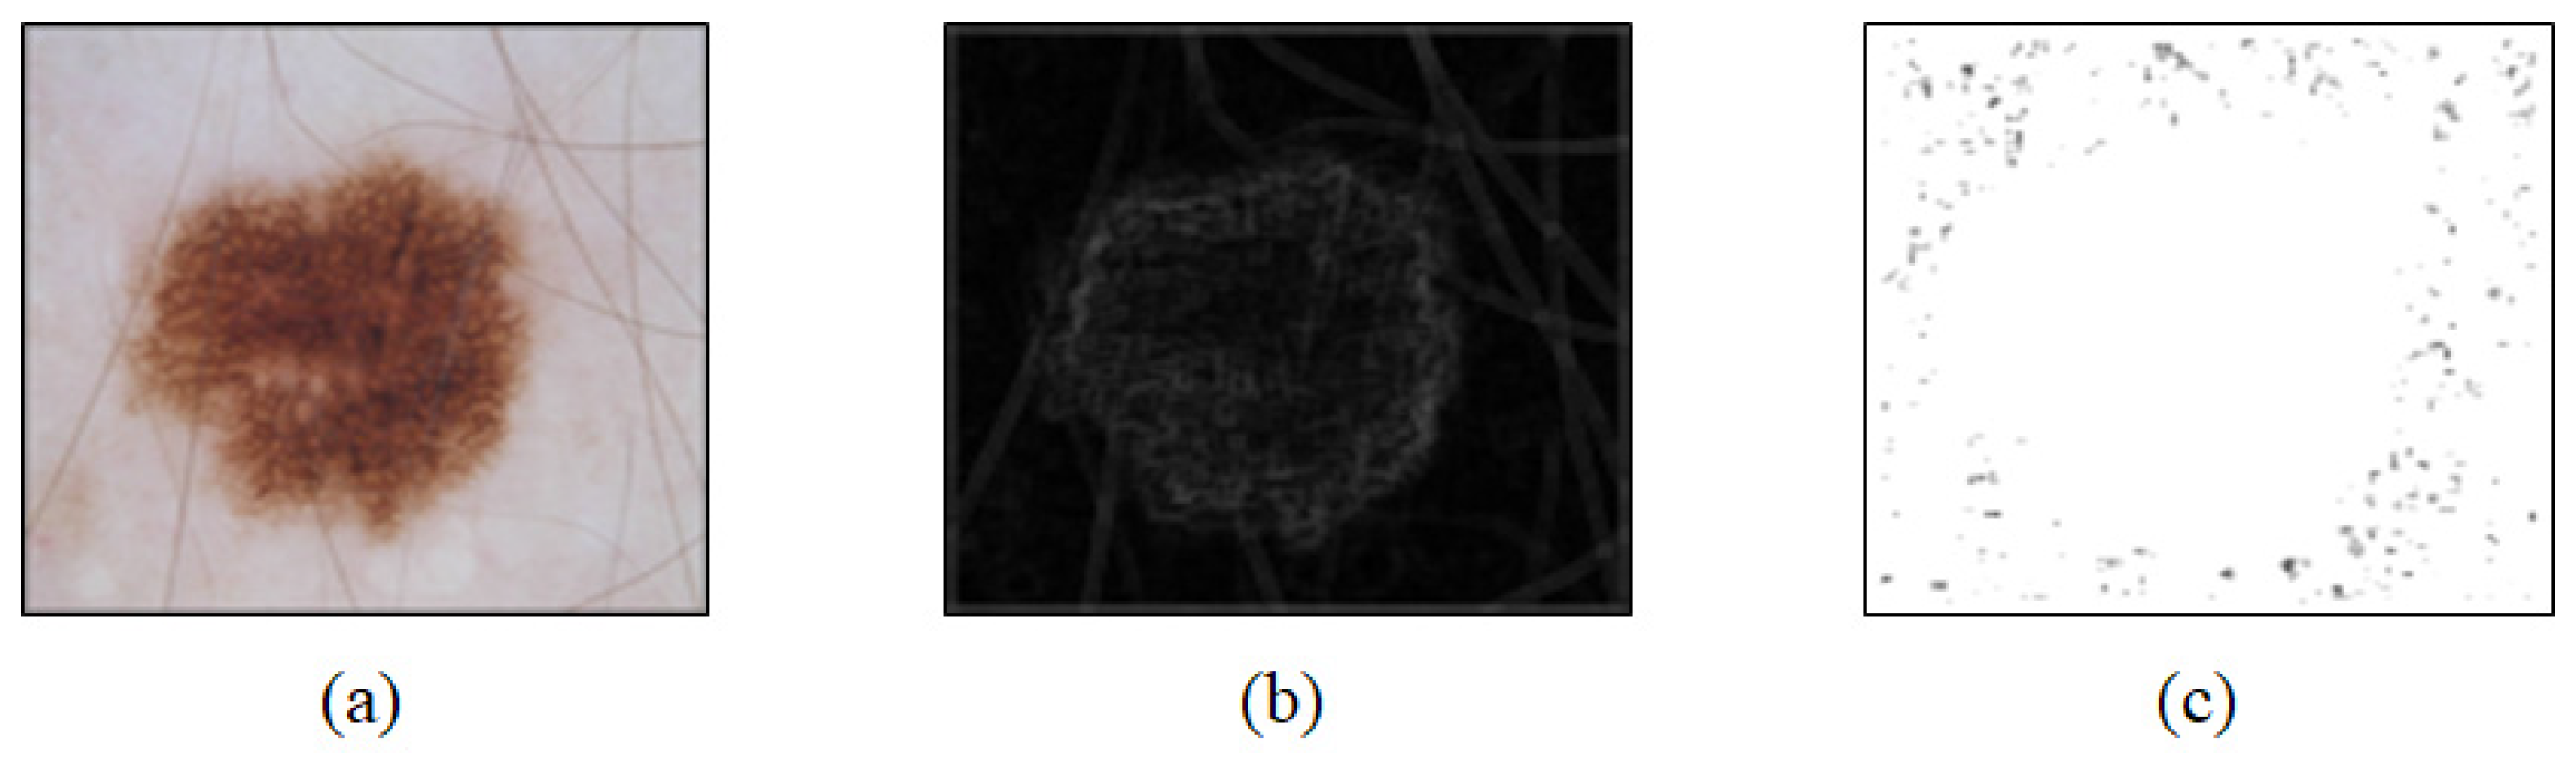
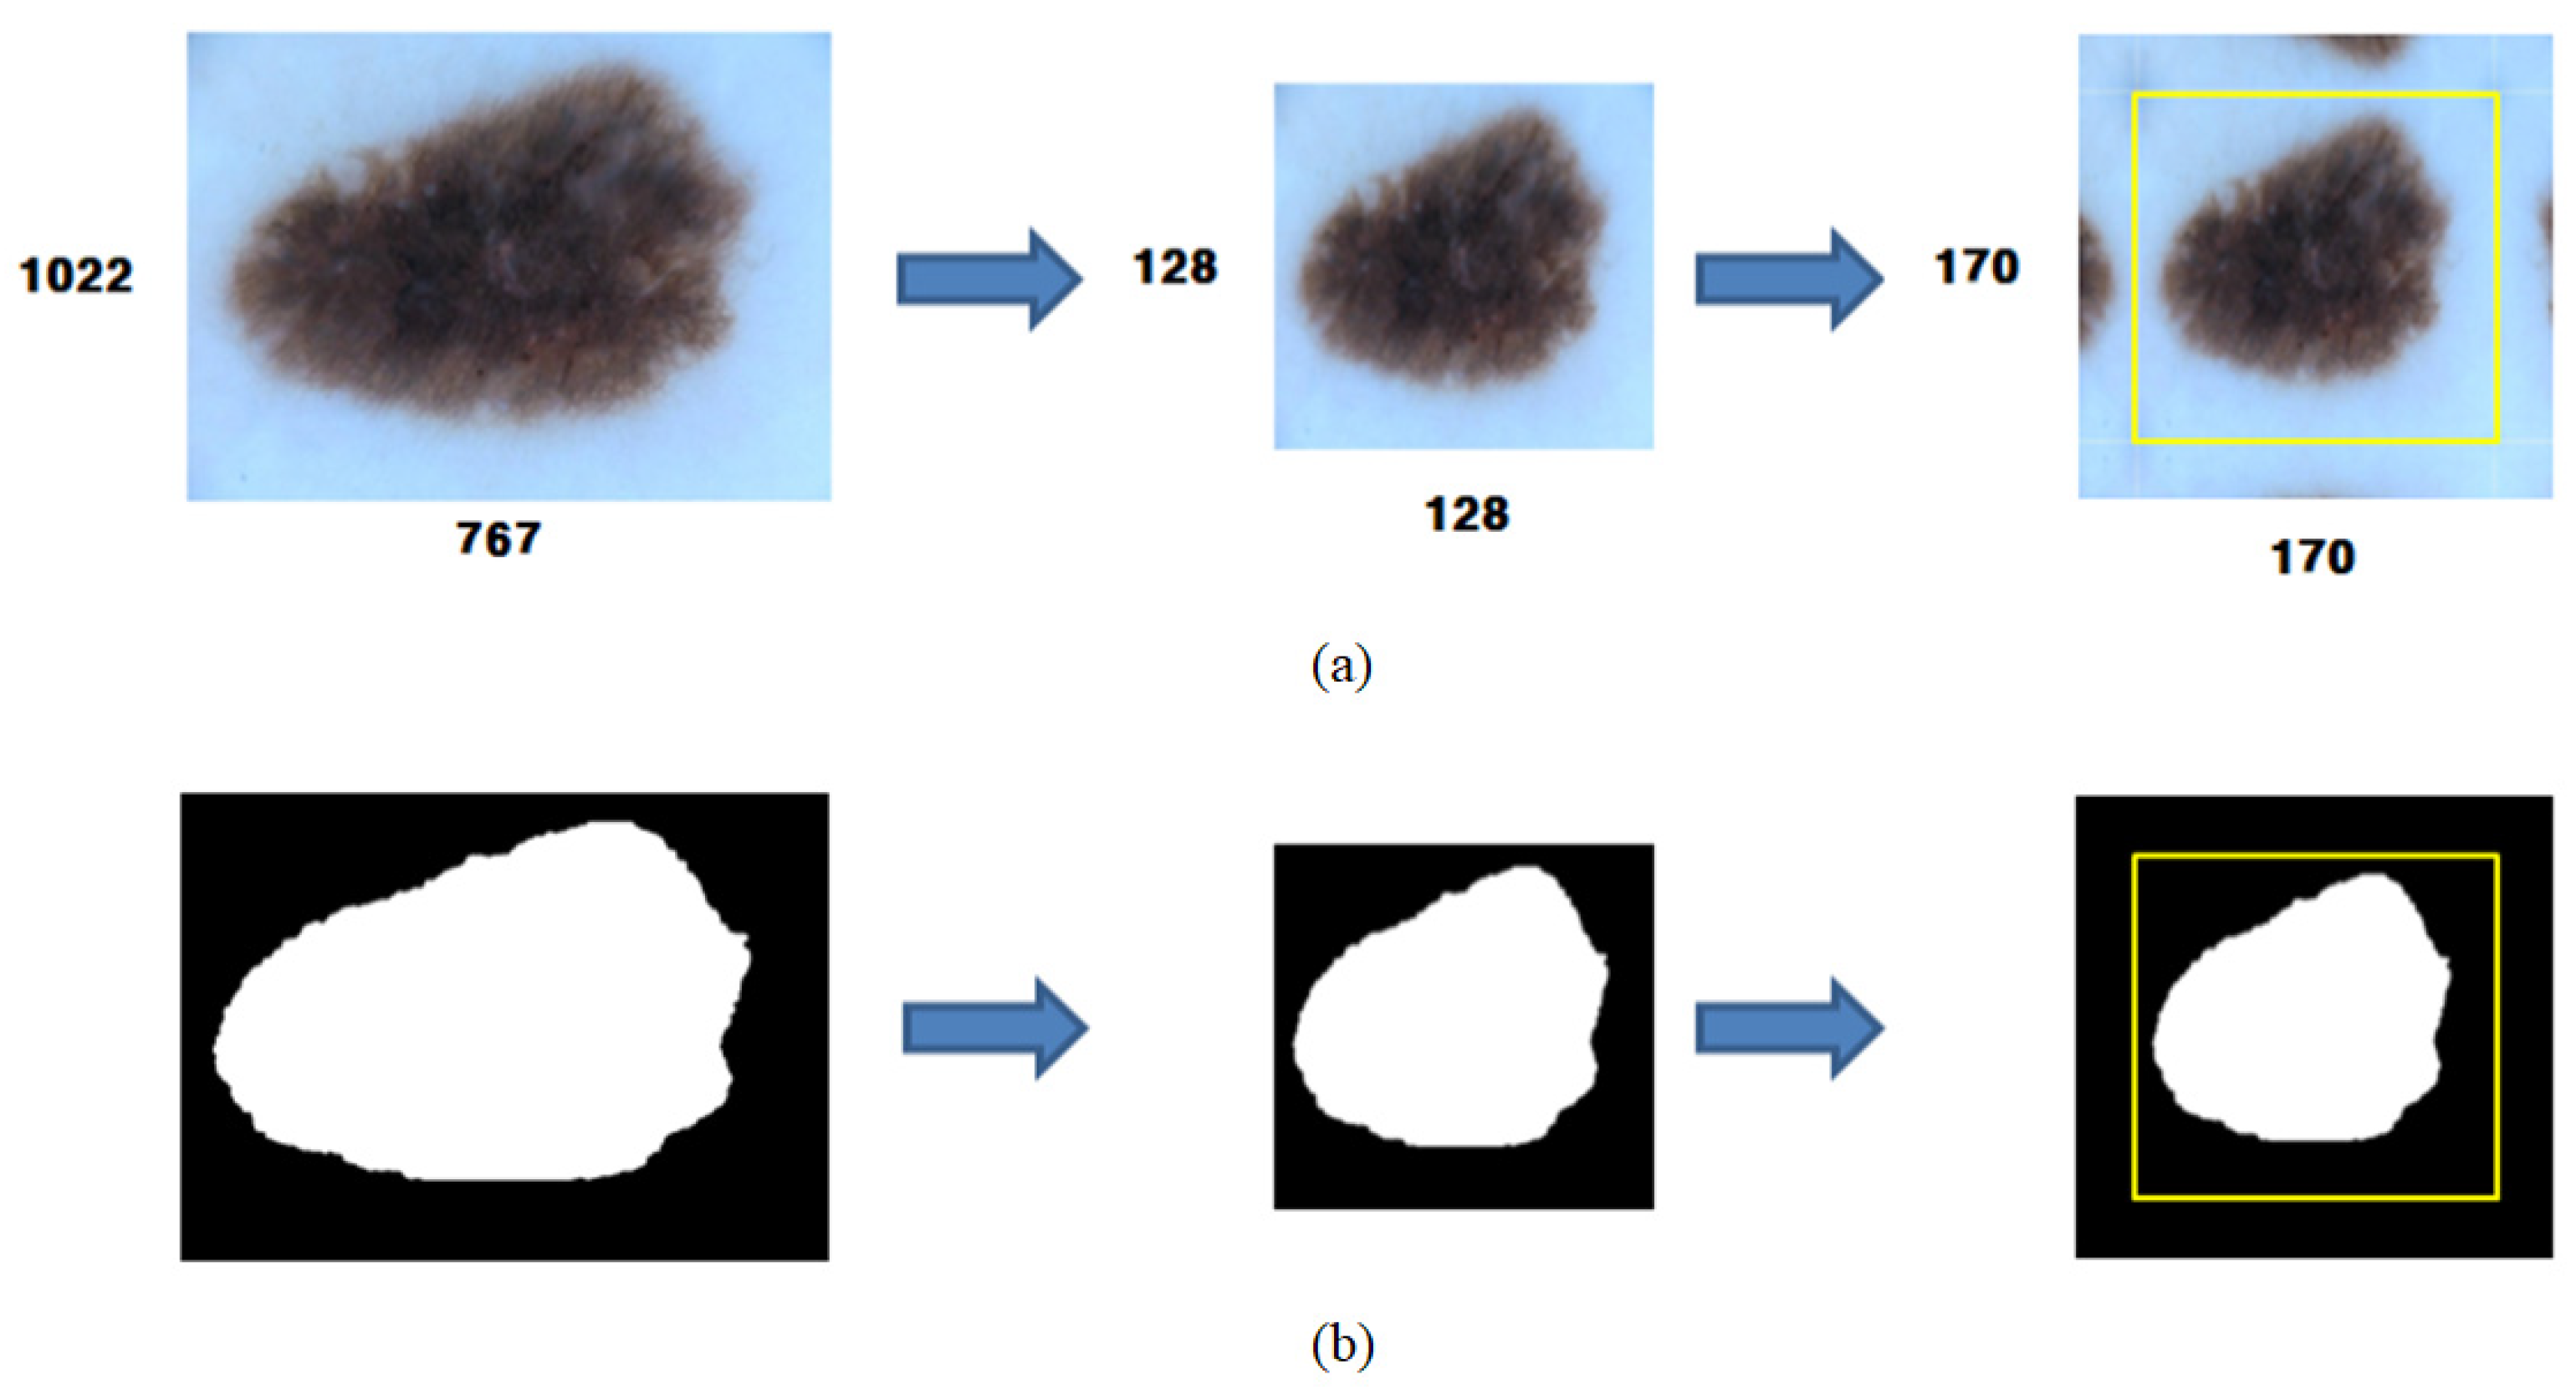
2.2. Preprocessing
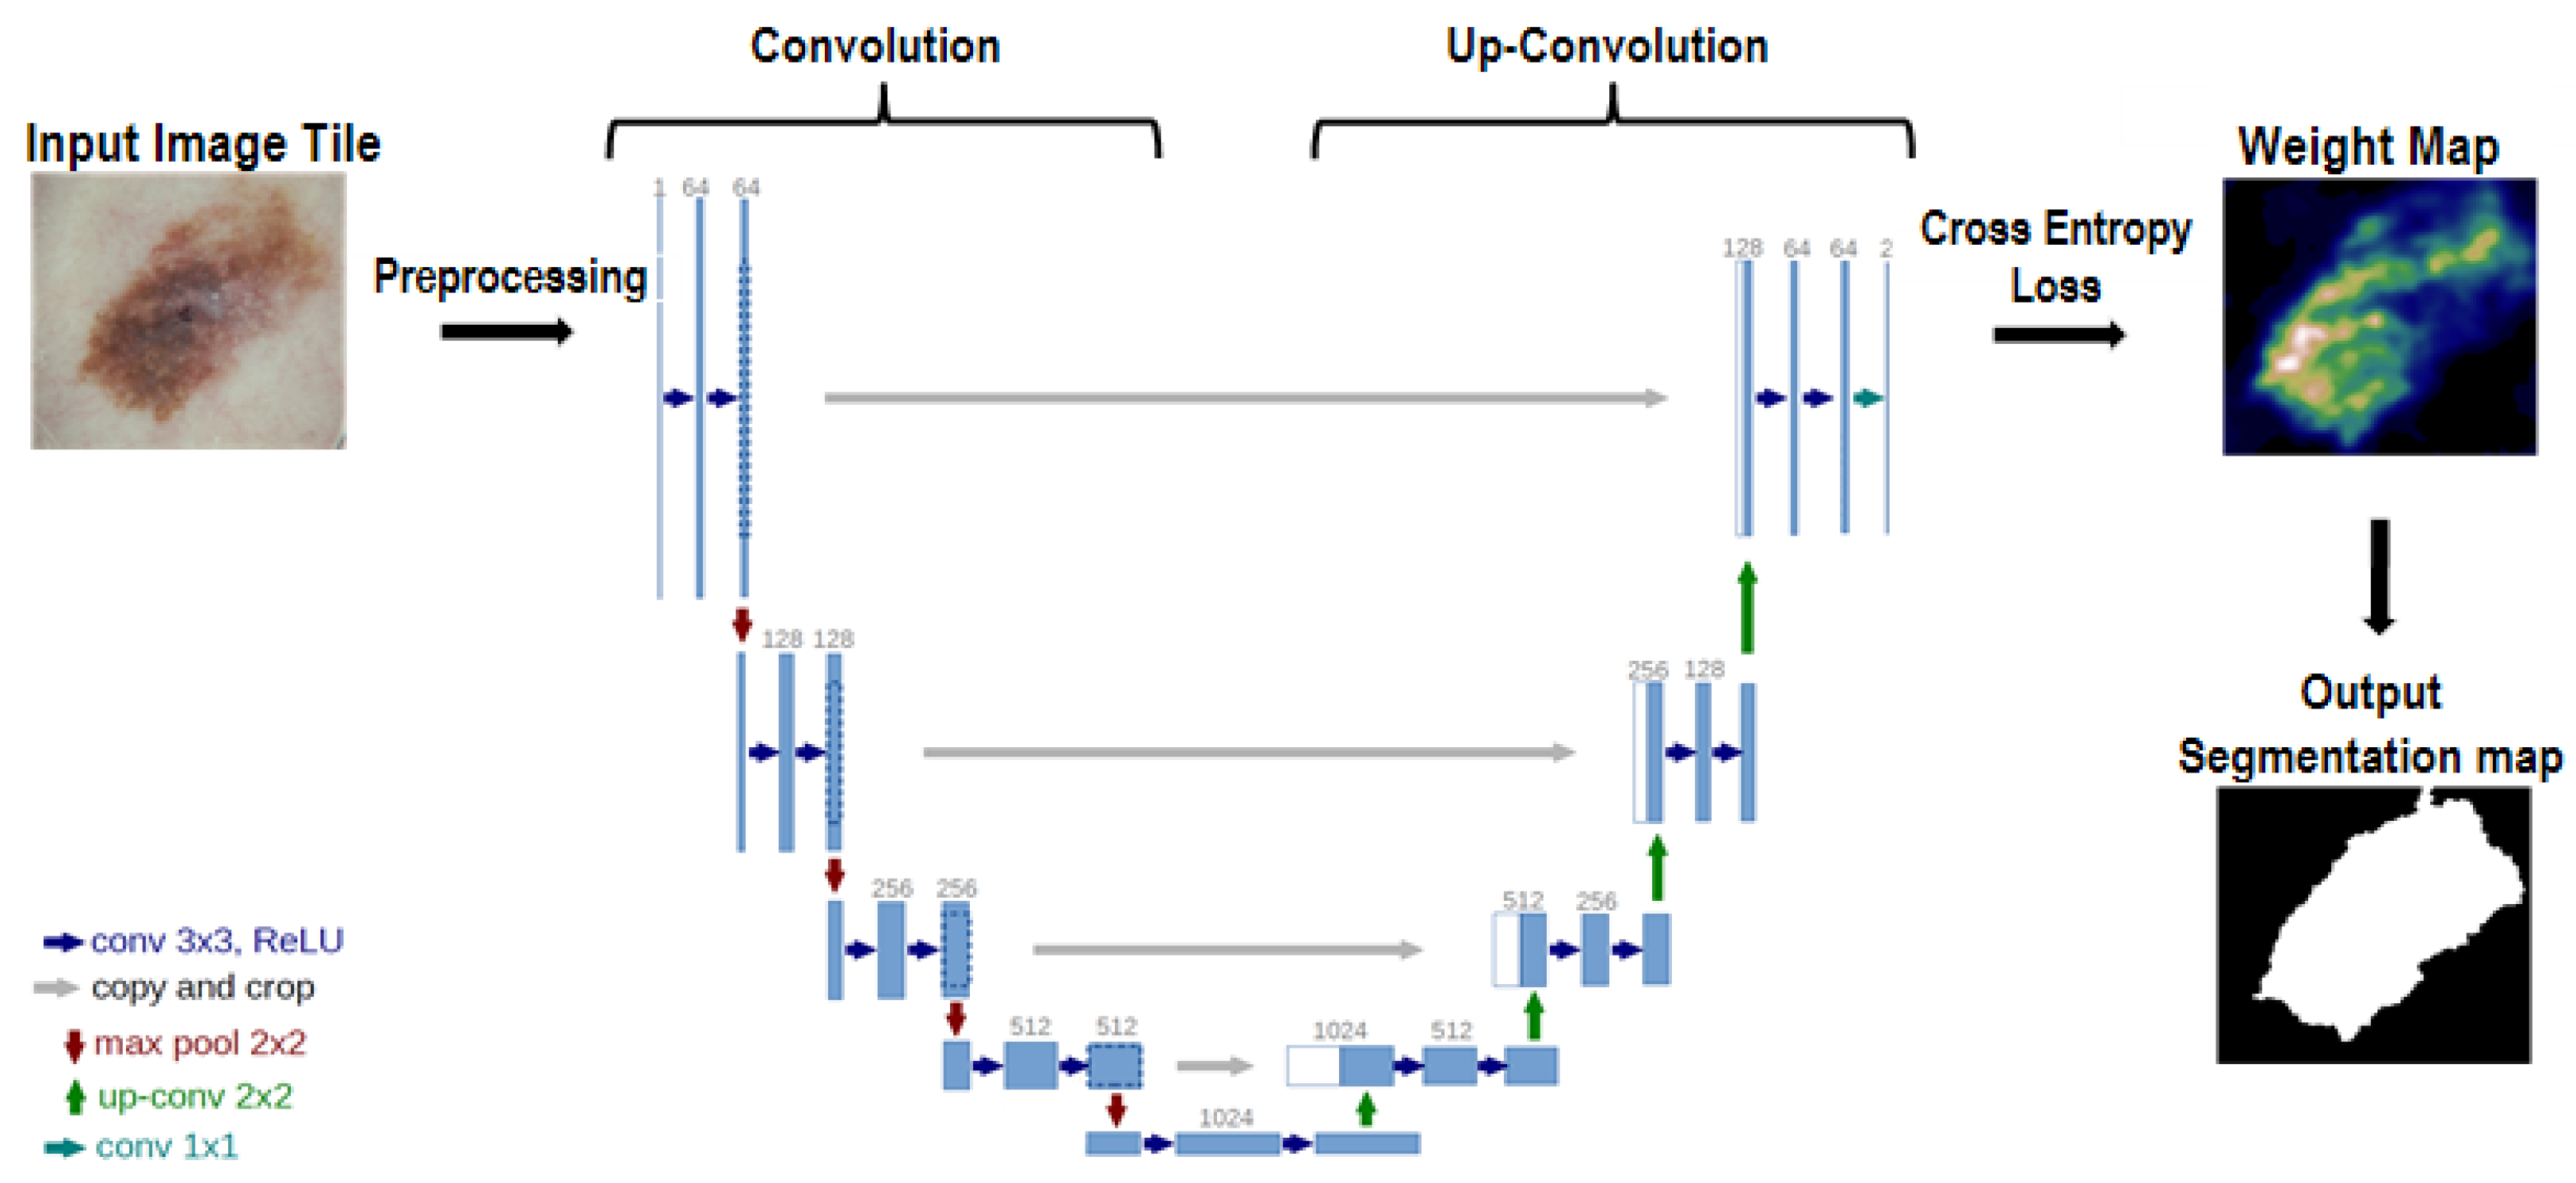
2.3. U-Net
2.4. Learning by U-Net
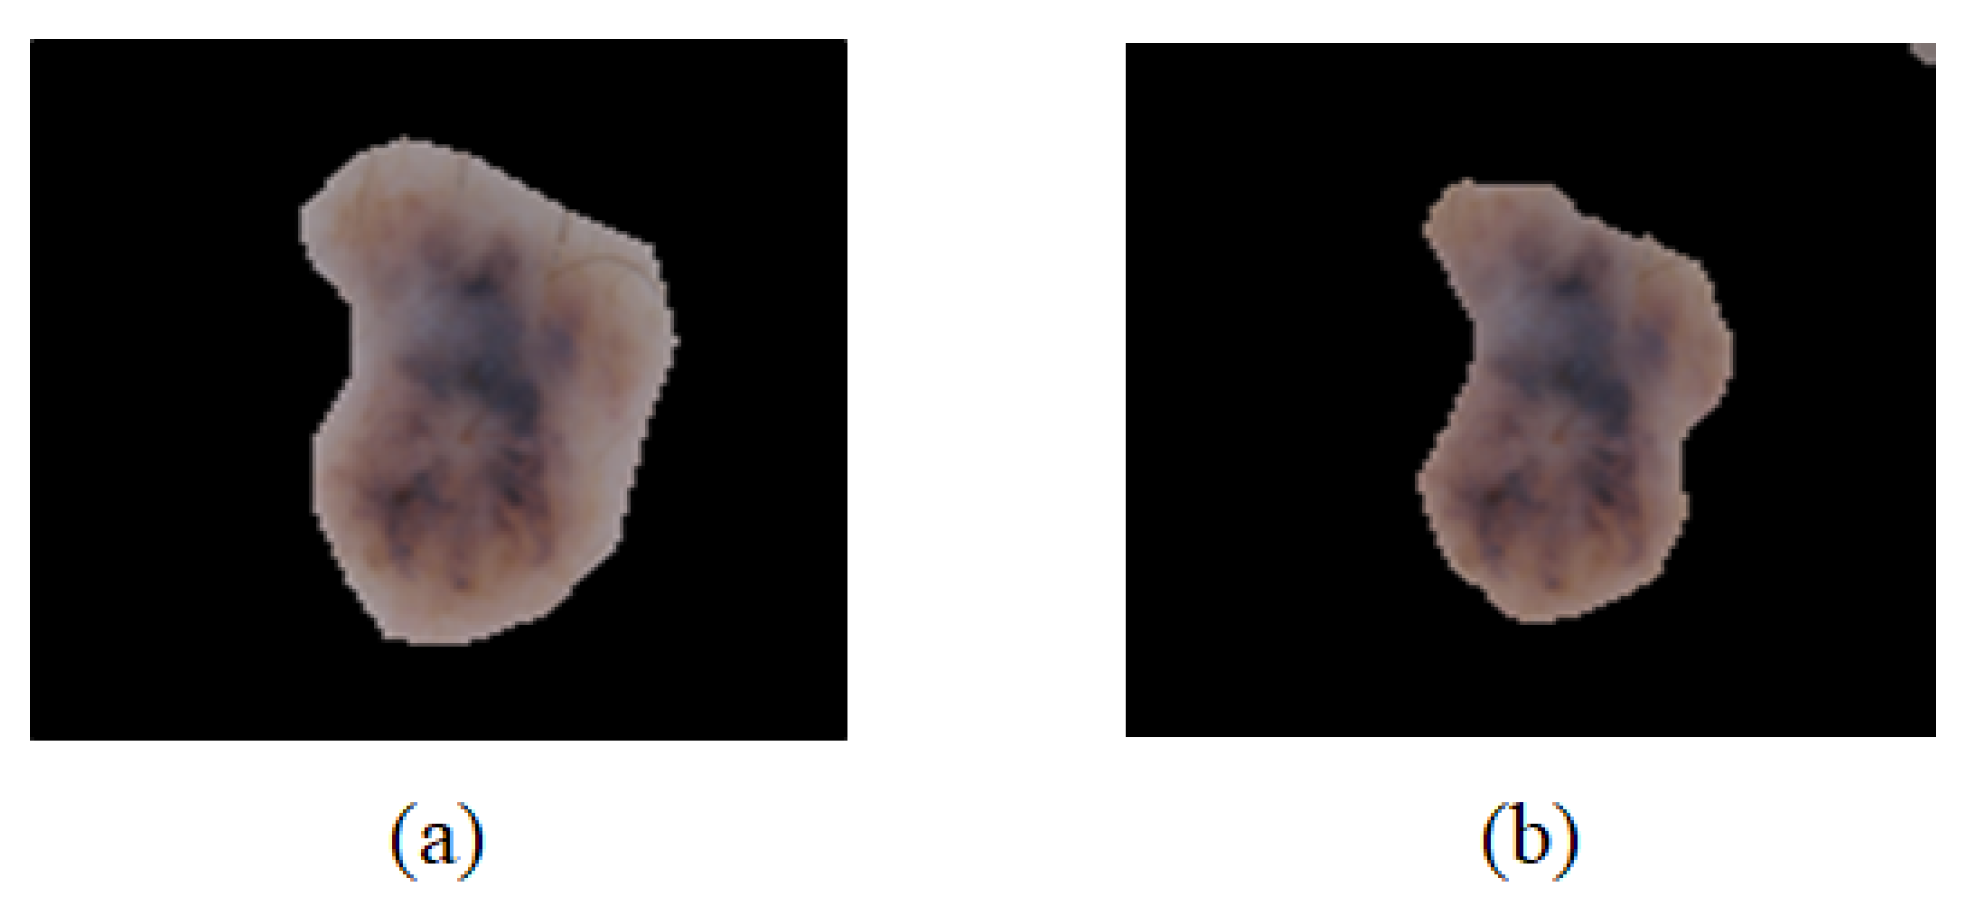
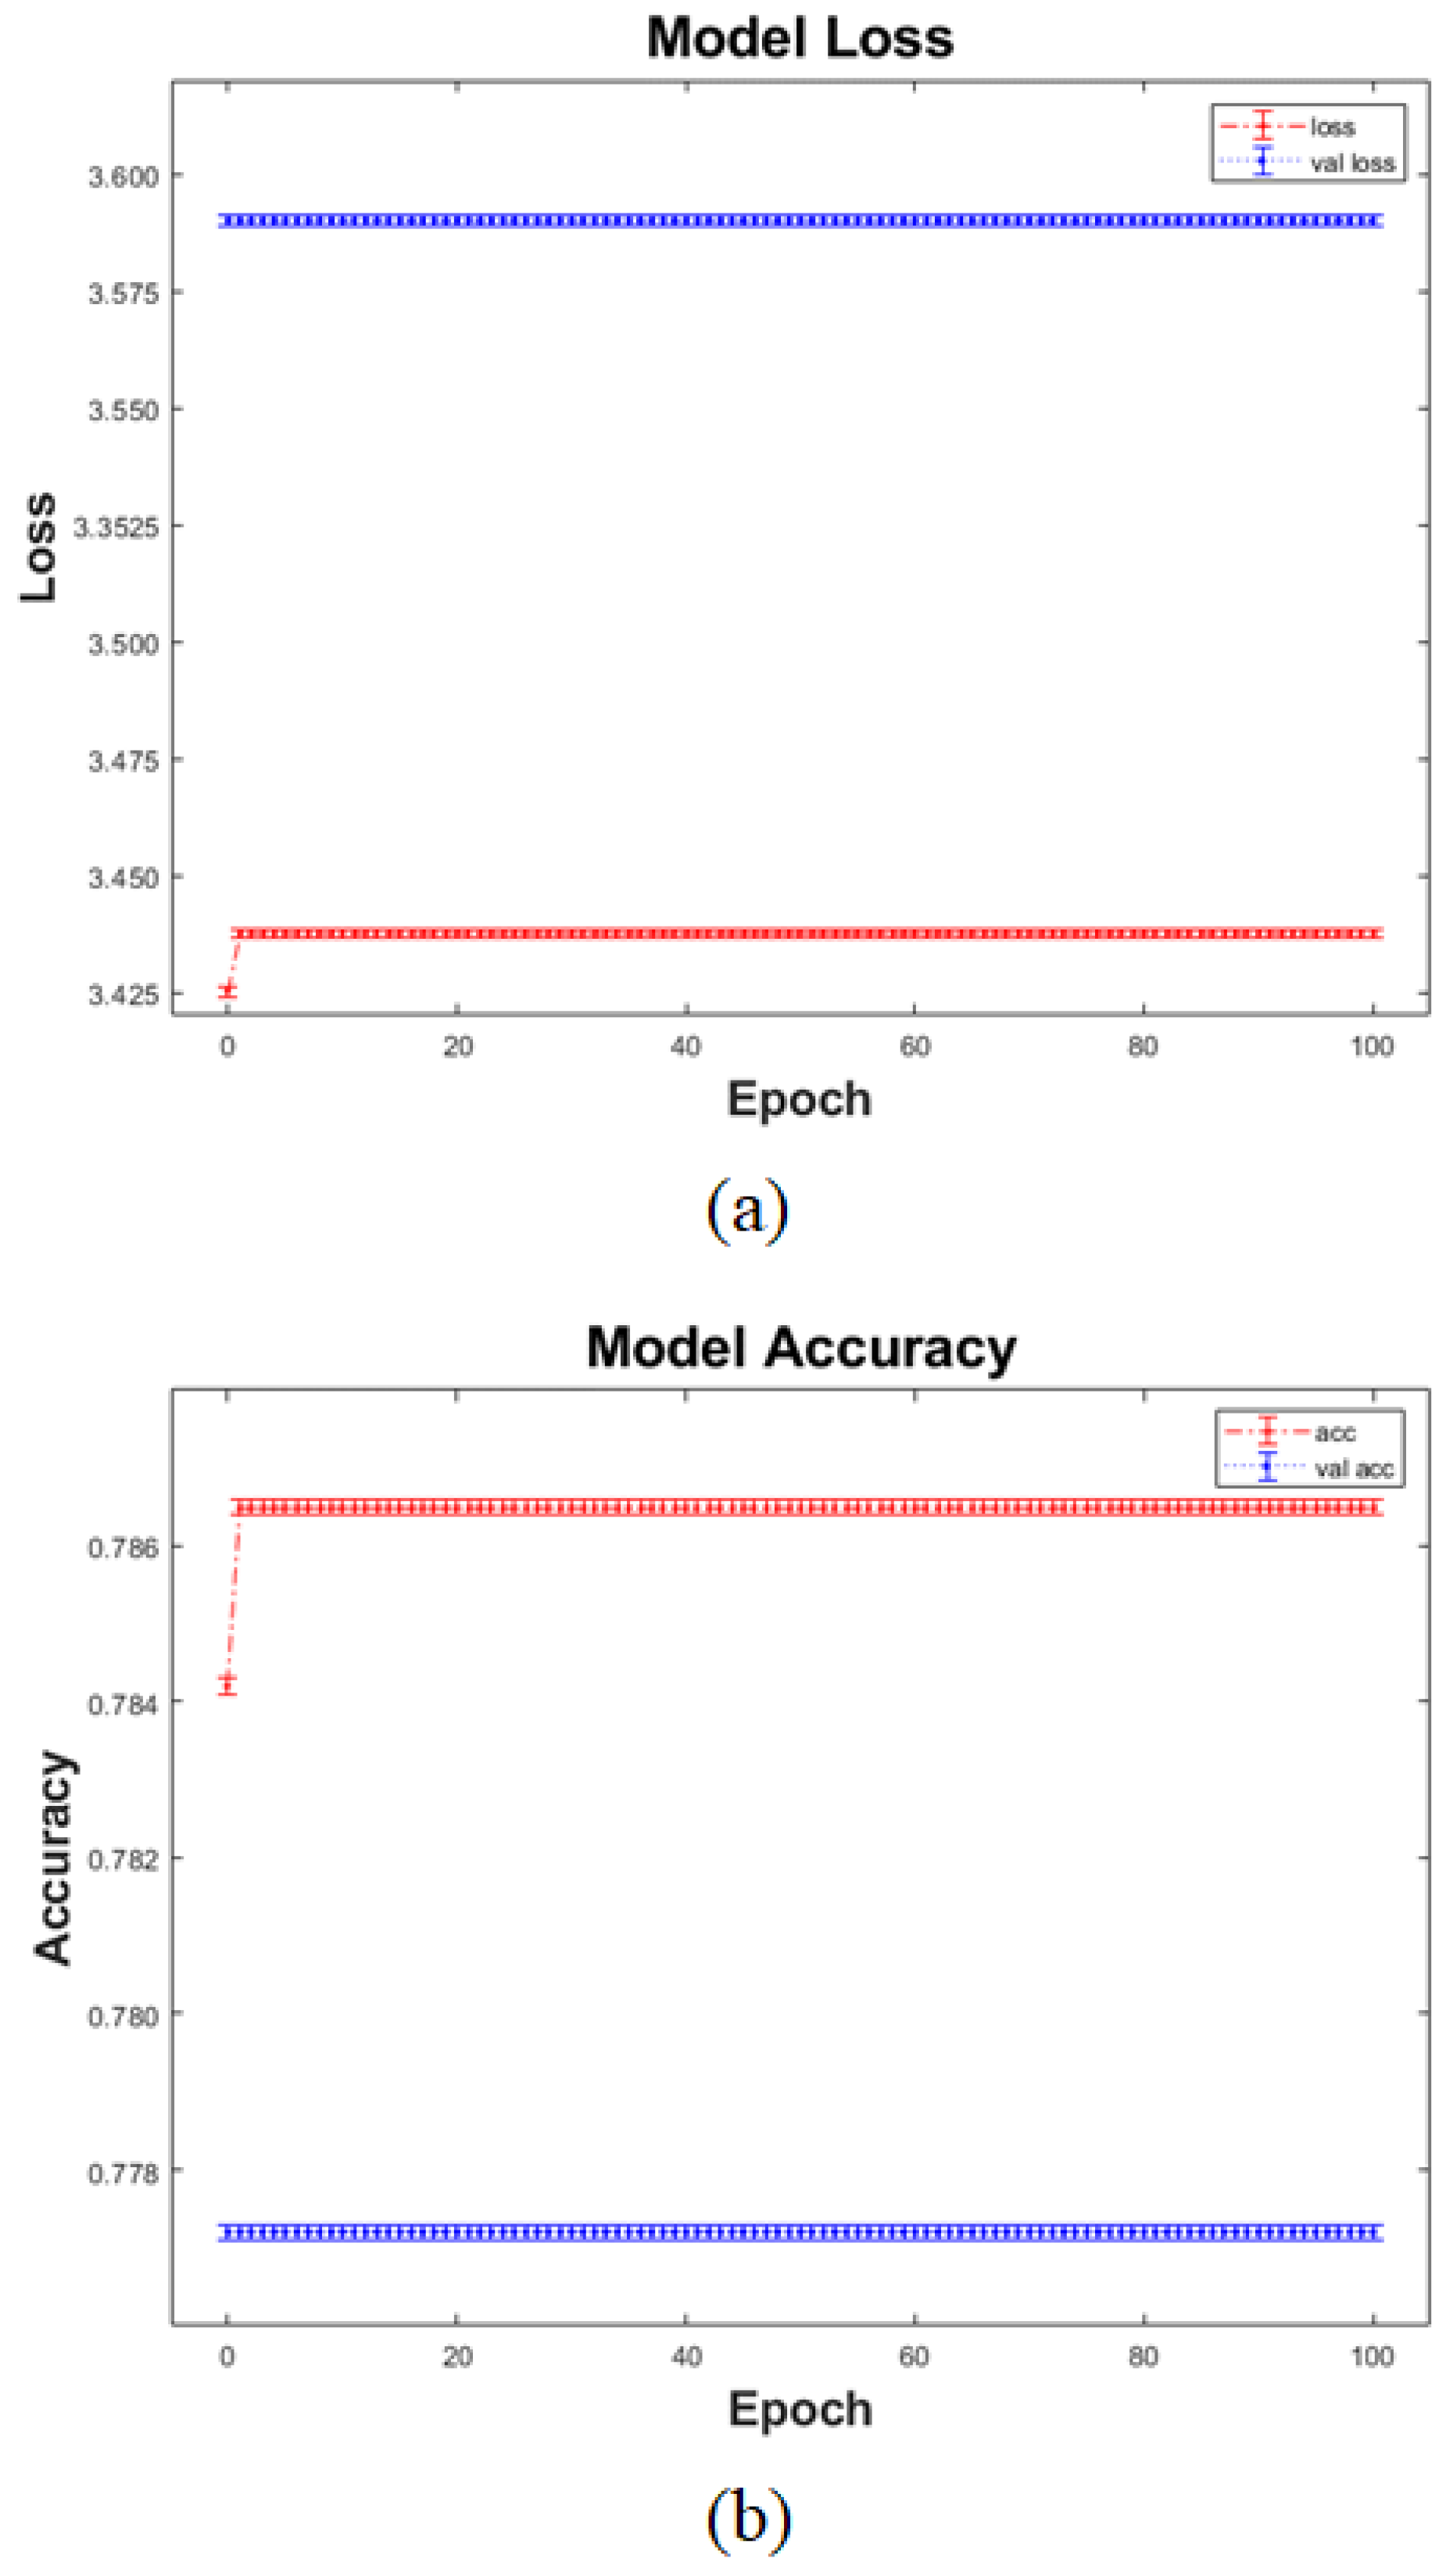
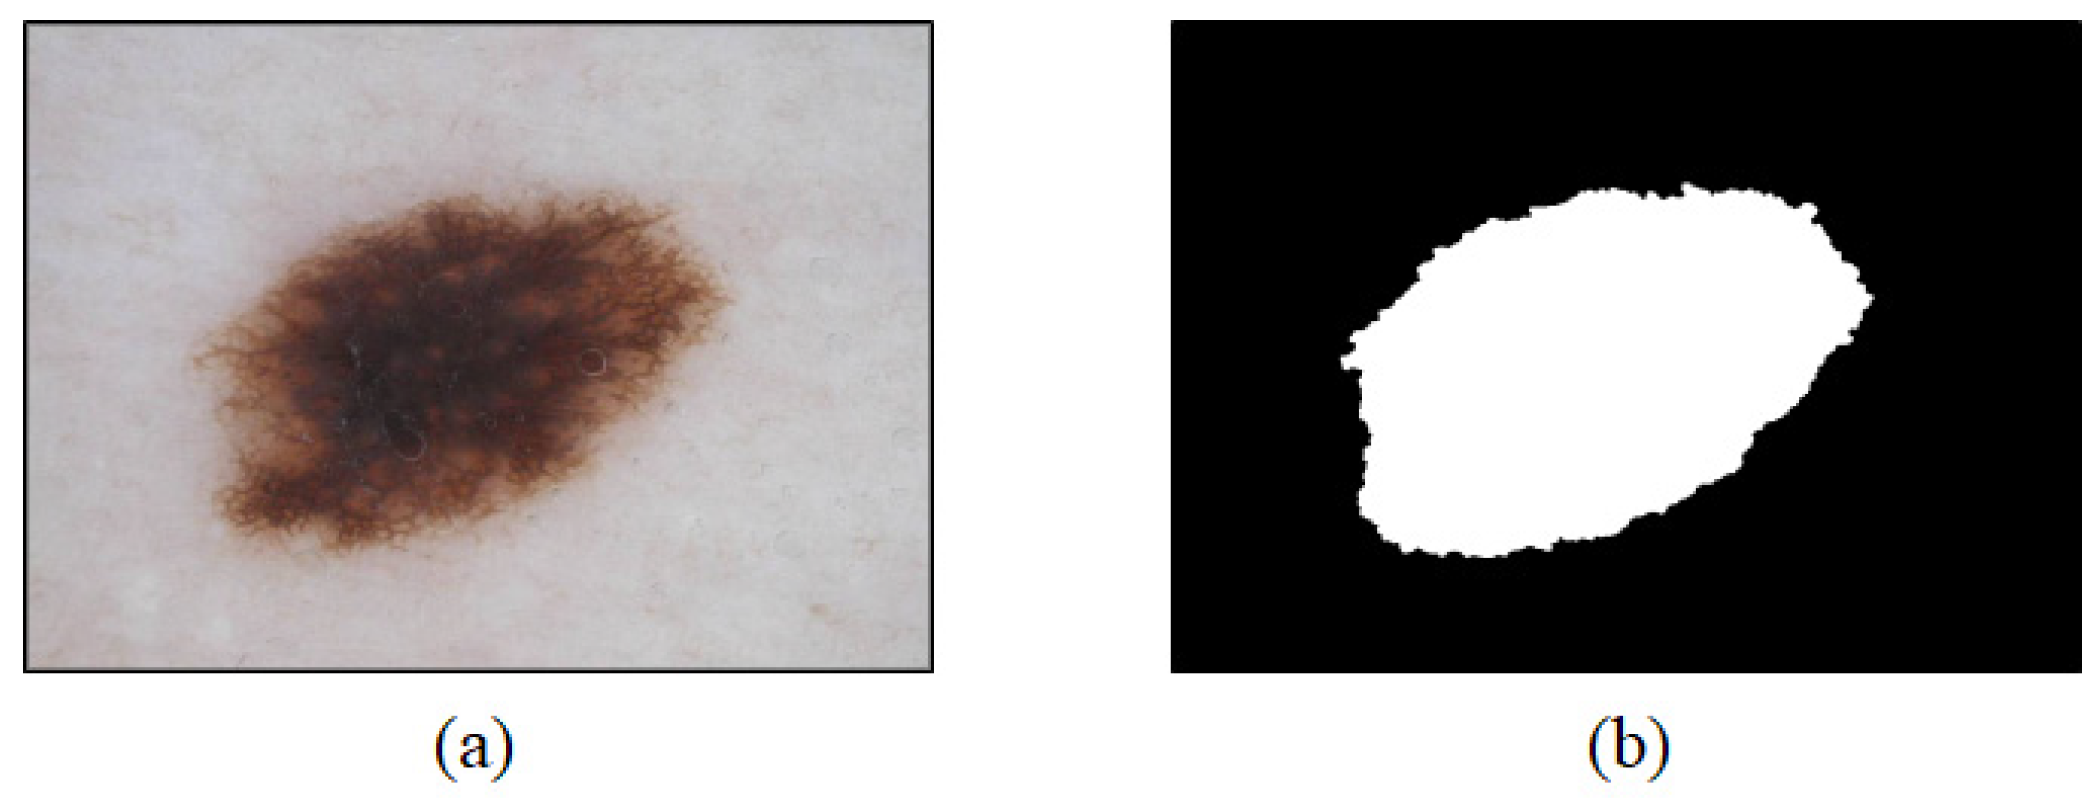
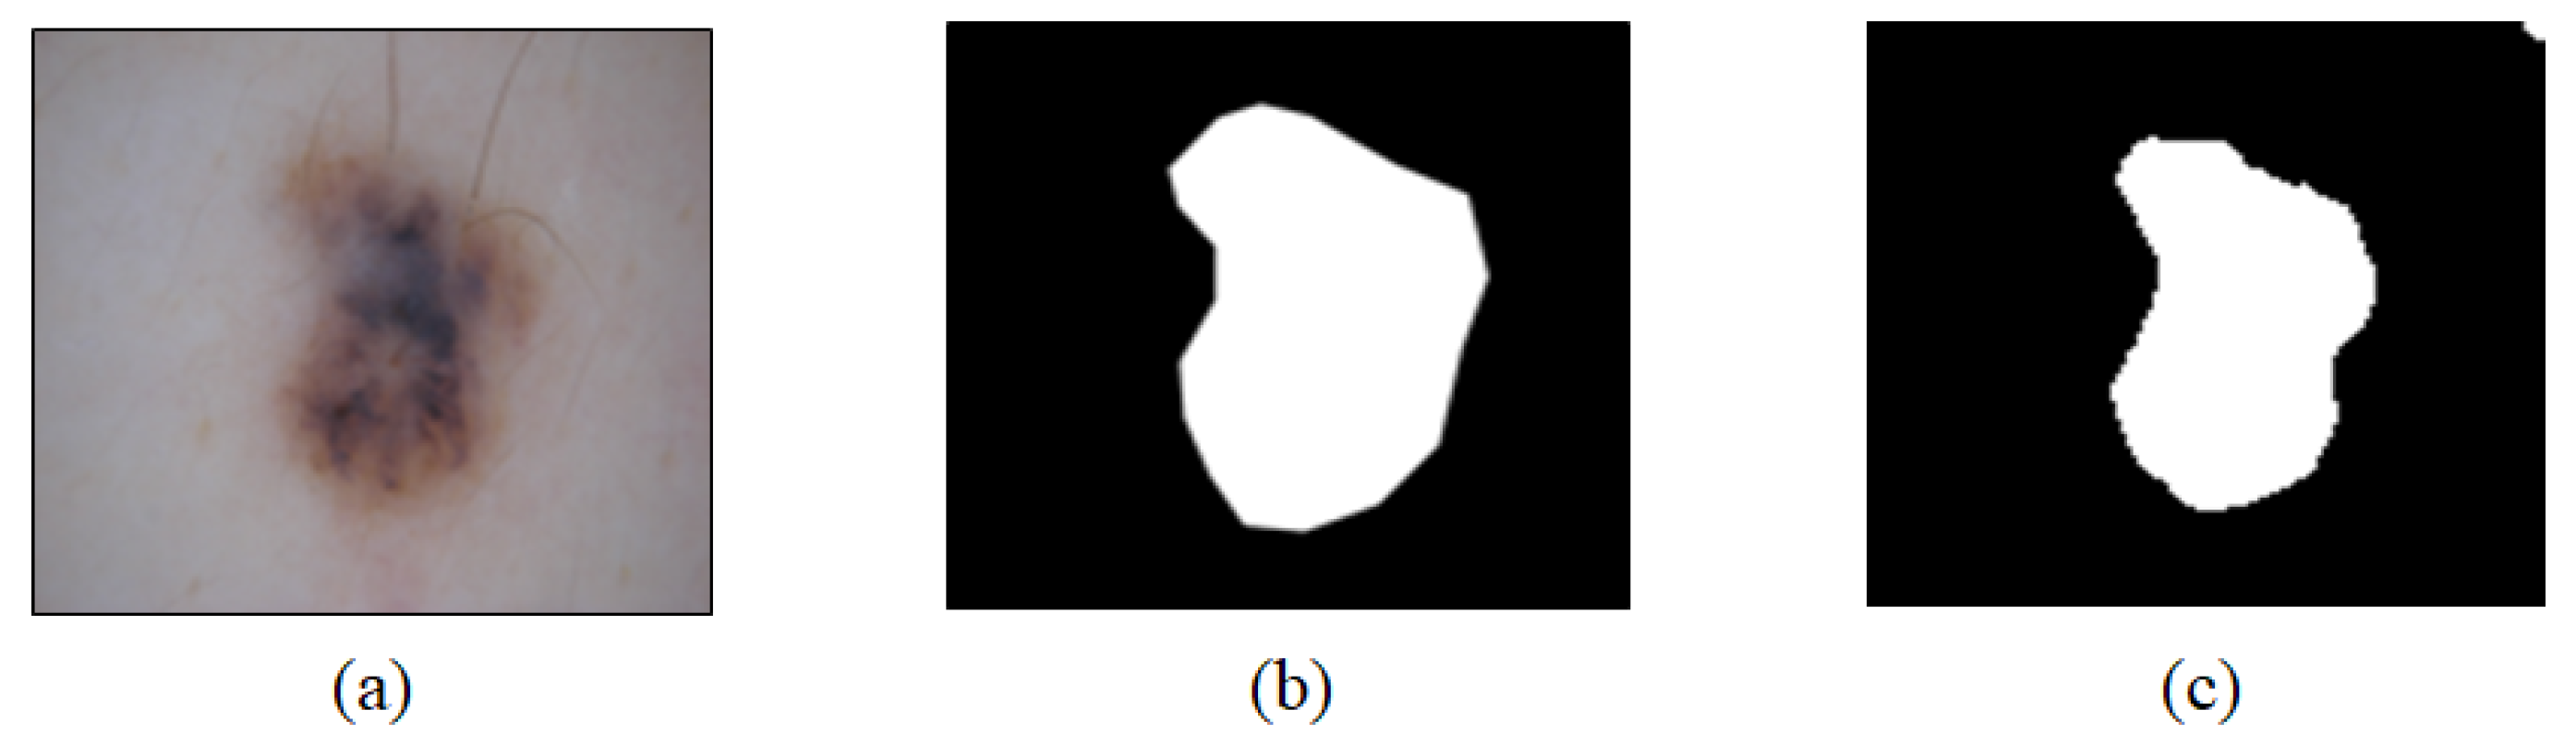
2.5. U-Net Training Results and Analysis
3. Classification of Lesion Segmented Images
3.1. Convolution Calculation
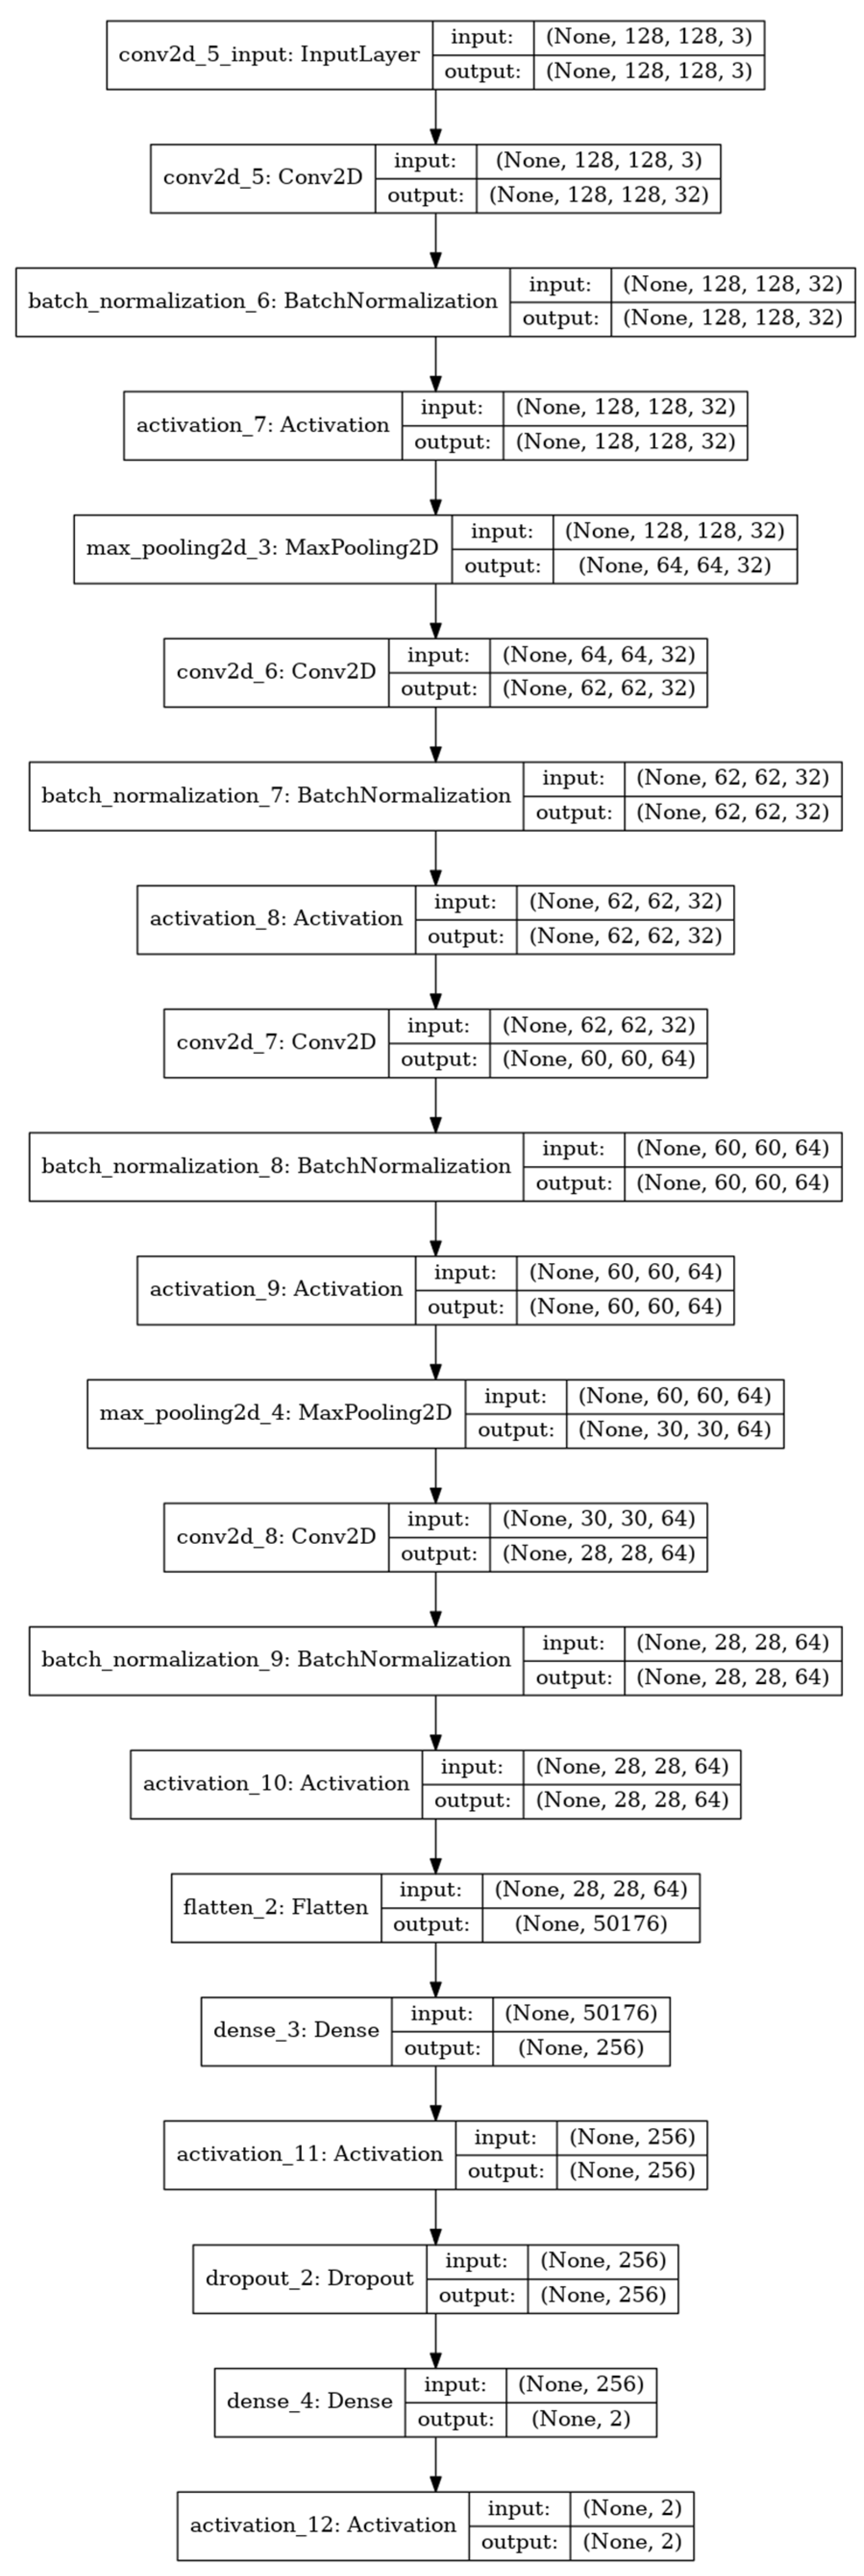
3.2. CNN
3.3. Training by the CNN
3.4. CNN Training Results and Analysis
4. Conclusions
Author Contributions
Funding
Institutional Review Board Statement
Informed Consent Statement
Data Availability Statement
Conflicts of Interest
References
- Kye-yong, S.; Kyeongcheon, J.; Kwanghyun, C.; Jegeun, C.; Eui-Geun, H. Clinicopathological analysis on the 104 cases of malignant melanoma. Korean J. Pathol. 1997, 31, 566–573. [Google Scholar]
- ISIC Archive. Available online: https://www.isic-archive.com/#!/topWithHeader/wideContentTop/main (accessed on 9 August 2021).
- Codella, N.C.F.; Gutman, D.; Emre Celebi, M.; Helba, B.; Marchetti, M.A.; Dusza, S.W.; Kalloo, A.; Liopyris, K.; Mishra, N.K.; Kittler, H.; et al. Skin lesion analysis toward melanoma detection: A challenge at the 2017 international symposium on biomedical imaging (ISBI), hosted by the international skin imaging collaboration (ISIC). In Proceedings of the 2018 IEEE 15th International Symposium on Biomedical Imaging, Washington, DC, USA, 4–7 April 2018; pp. 168–172. [Google Scholar]
- Jerant, A.F.; Johnson, J.T.; Sheridan, C.D.; Caffrey, T.J. Early detection and treatment of skin cancer. Am. Fam. Phys. 2000, 62, 381–382. [Google Scholar]
- Yuexuang, L.S. Skin Lesion analysis towards melanoma detection using deep learning network. Sensors 2018, 18, 556. [Google Scholar] [CrossRef] [PubMed] [Green Version]
- Bowling, J. Diagnostic Dermoscopy: The Illustrated Guide; Wiley-Blackwell: Hoboken, NJ, USA, 2011. [Google Scholar]
- Korean Society of Skin Cancer; Korean Dermatological Association. Skin Cancer in Koreans; Soomoonsa: Gyeonggi, Korea, 2013. [Google Scholar]
- LeCun, Y.; Bottou, L.; Bengio, Y.; Haffner, P. Gradient-based learning applied to document recognition. Proc. IEEE 1998, 86, 2278–2324. [Google Scholar] [CrossRef] [Green Version]
- Gautam, D.; Ahmed, M.; Meena, Y.K.; Haq, A.U. Machine learning-based diagnosis of melanoma using macro images. Int. J. Numer. Method Biomed. Eng. 2018, 34, e2953. [Google Scholar] [CrossRef] [PubMed]
- Codella, N.C.F.; Nguyen, Q.D.; Pankanti, S.; Gutman, D.; Helba, B.; Halpern, A.; Smith, J.R. Deep learning ensembles for melanoma recognition in dermoscopy images. IBM J. Res. Dev. 2017, 61, 1–5. [Google Scholar] [CrossRef] [Green Version]
- Hinton, G.E. Learning multiple layers of representation. Trends Cogn. Sci. 2007, 11, 428–434. [Google Scholar] [CrossRef] [PubMed]
- Hinton, G.E.; Osindero, S.; Teh, Y.W. A fast learning algorithm for deep belief nets. Neural Comput. 2006, 18, 1527–1554. [Google Scholar] [CrossRef] [PubMed]
- Nair, V.; Hinton, G.E. Rectified linear units improve restricted Boltzmann machines. In Proceedings of the International Conference on Machine Learning, Haifa, Israel, 21–24 June 2010. [Google Scholar]
- Dahl, G.E. Improving DNNs for LVCSR using rectified linear units and dropout. In Proceedings of the ICASSP, Vancouver, BC, Canada, 26–31 May 2013. [Google Scholar]
- Ioffe, S.; Szegedy, C. Batch normalization: Accelerating deep network training by reducing internal covariate shift. In Proceedings of the International Conference on Machine Learning, Lille, France, 6–11 July 2015; pp. 448–456. [Google Scholar]
- Bi, L.; Jung, Y.; Ahn, E.; Kumar, A.; Fullham, M.J.; Feng, D. Dermoscopic image segmentation via multistage fully convolutional networks. IEEE Trans. Biomed. Eng. 2017, 64, 2065–2074. [Google Scholar] [CrossRef] [PubMed] [Green Version]
- Bi, L.; Kim, J.; Ahn, E.; Feng, D.; Fullham, M.J. Automatic melanoma detection via multi-scale lesion-biased representation and joint reverse classification. In Proceedings of the IEEE International Symposium on Biomedical Imaging, Prague, Czech Republic, 13–16 April 2016. [Google Scholar]
- Ronneberger, O.; Fischer, P.; Brox, T. U-net: Convolutional networks for biomedical image segmentation. In International Conference on Medical Image Computing and Computer-Assisted Intervention; Springer: Cham, Switzerland, 2015; pp. 234–241. [Google Scholar]
- Zhou, Z.; Siddiquee, M.M.; Tajbakhsh, N.; Liang, J. Unet++: A nested u-net architecture for medical image segmentation. In 4th International Workshop on Deep Learning in Medical Image Analysis; Springer: Cham, Switzerland, 2018; pp. 3–11. [Google Scholar]
- Bojarski, M.; Choromanska, A.; Choromanski, K.; Firner, B.; Jackel, L.D.; Muller, U.; Zieba, K. Visualbackprop: Visualizing cnns for autonomous driving. arXiv 2016, arXiv:1611.05418. [Google Scholar]
- Codella, N.C.F.; Cai, J.; Abedini, M.; Garnavi, R.; Halpern, A.; Smith, J.R. Deep learning, sparse coding, and SVM for melanoma recognition in dermoscopy images. In International Workshop on Machine Learning in Medical Imaging; Springer: Cham, Switzerland, 2015; pp. 118–126. [Google Scholar]
- Cicero, F.; Oliveira, A.; Botelho, G. Deep learning and convolutional neural networks in the aid of the classification of melanoma. In Proceedings of the Conference on Graphics, Patterns and Images, Sao Jose dos Campos, Brazil, 4–7 October 2016; pp. 1–4. [Google Scholar]


| Layer | 3 |
| Feature | 64 |
| Filter Size | 3 × 3 |
| Pool Size | 2 × 2 |
| Stride | 1 |
| Optimizer | ‘Adam’ |
| Ratio of the Dice Value Based on All the Datasets (%) | |
|---|---|
| Ratio of the dice value at 90% or higher | 42.2% |
| Ratio of the dice value at 80% or higher | 25.8% |
| Ratio of the dice value at 70% or higher | 17.4% |
| Ratio of the dice value at 70% or below | 14.3% |
Publisher’s Note: MDPI stays neutral with regard to jurisdictional claims in published maps and institutional affiliations. |
© 2021 by the authors. Licensee MDPI, Basel, Switzerland. This article is an open access article distributed under the terms and conditions of the Creative Commons Attribution (CC BY) license (https://creativecommons.org/licenses/by/4.0/).
Share and Cite
Kim, C.-I.; Hwang, S.-M.; Park, E.-B.; Won, C.-H.; Lee, J.-H. Computer-Aided Diagnosis Algorithm for Classification of Malignant Melanoma Using Deep Neural Networks. Sensors 2021, 21, 5551. https://doi.org/10.3390/s21165551
Kim C-I, Hwang S-M, Park E-B, Won C-H, Lee J-H. Computer-Aided Diagnosis Algorithm for Classification of Malignant Melanoma Using Deep Neural Networks. Sensors. 2021; 21(16):5551. https://doi.org/10.3390/s21165551
Chicago/Turabian StyleKim, Chan-Il, Seok-Min Hwang, Eun-Bin Park, Chang-Hee Won, and Jong-Ha Lee. 2021. "Computer-Aided Diagnosis Algorithm for Classification of Malignant Melanoma Using Deep Neural Networks" Sensors 21, no. 16: 5551. https://doi.org/10.3390/s21165551
APA StyleKim, C.-I., Hwang, S.-M., Park, E.-B., Won, C.-H., & Lee, J.-H. (2021). Computer-Aided Diagnosis Algorithm for Classification of Malignant Melanoma Using Deep Neural Networks. Sensors, 21(16), 5551. https://doi.org/10.3390/s21165551