
Digital Biomarkers of Physical Frailty and Frailty Phenotypes Using Sensor-Based Physical Activity and Machine Learning


Abstract
1. Introduction
2. Materials and Methods
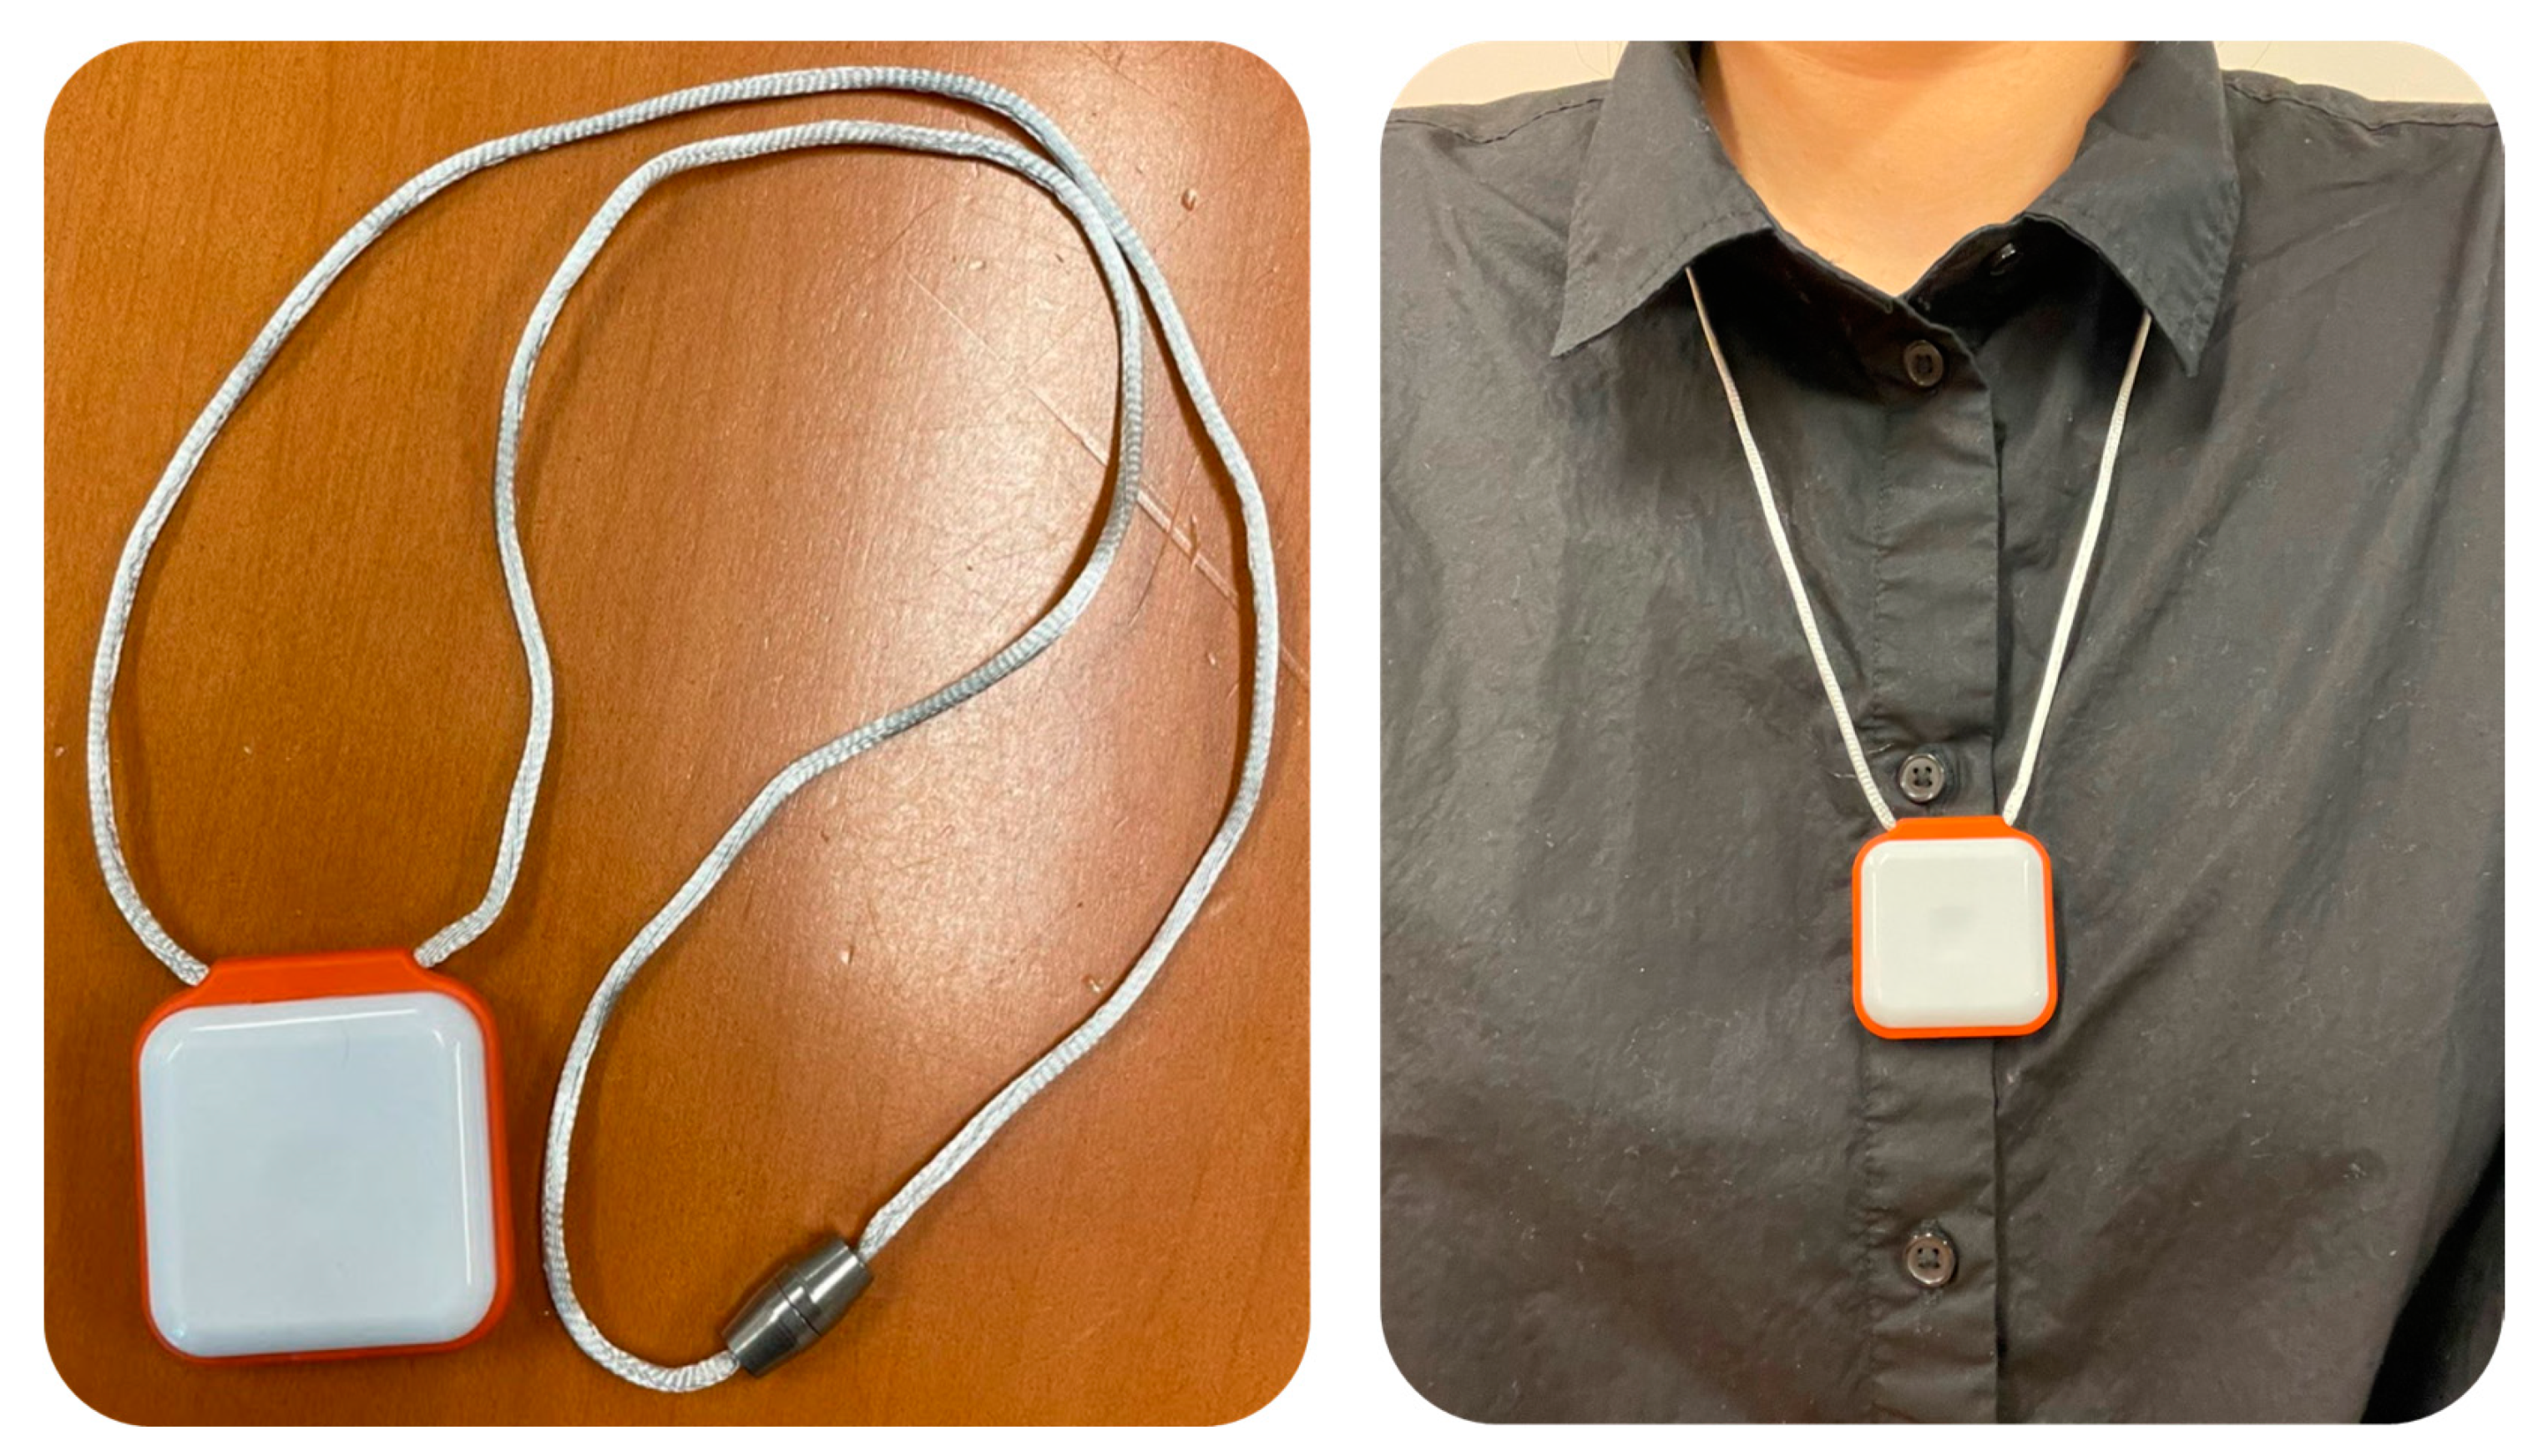
2.1. Participants and Experimental Protocols
2.2. Sensor-Derived Features
2.3. Data Analysis and Optimal Feature Selection Using Machine Learning
- (1)
- In total, 2000 pairs of training and validation datasets were created from the participants’ data (n = 259) using the bootstrapping technique. To avoid the possible misidentifications of physical frailty and frailty phenotypes due to the difference in the number of samples between groups (i.e., RG (n = 73) and FG (n = 186)), the FG was randomly subsampled by 73 at creating each pair of training and validation datasets.
- (2)
- Logistic regression models were built at each recursive loop using the 2000 pairs of training datasets. In each recursive loop, the number of logistic regression models and the number of significant features considered were the same (e.g., the first recursive loop created 14 logistic regression models, and 14 logistic regression models decreased by 1 after each recursive loop).
- (3)
- At each recursive loop, the AUC of each model was calculated.
- (4)
- The AUC values were averaged across 2000 iterations for each model.
- (5)
- A feature with the lowest AUC value was removed.
- (6)
- Steps 2–5 repeated until only one feature remained (steps 2–5 corresponded to one recursive loop, and each recursive loop ran 2000 iterations).
3. Results
3.1. Significant Sensor-Derived Features
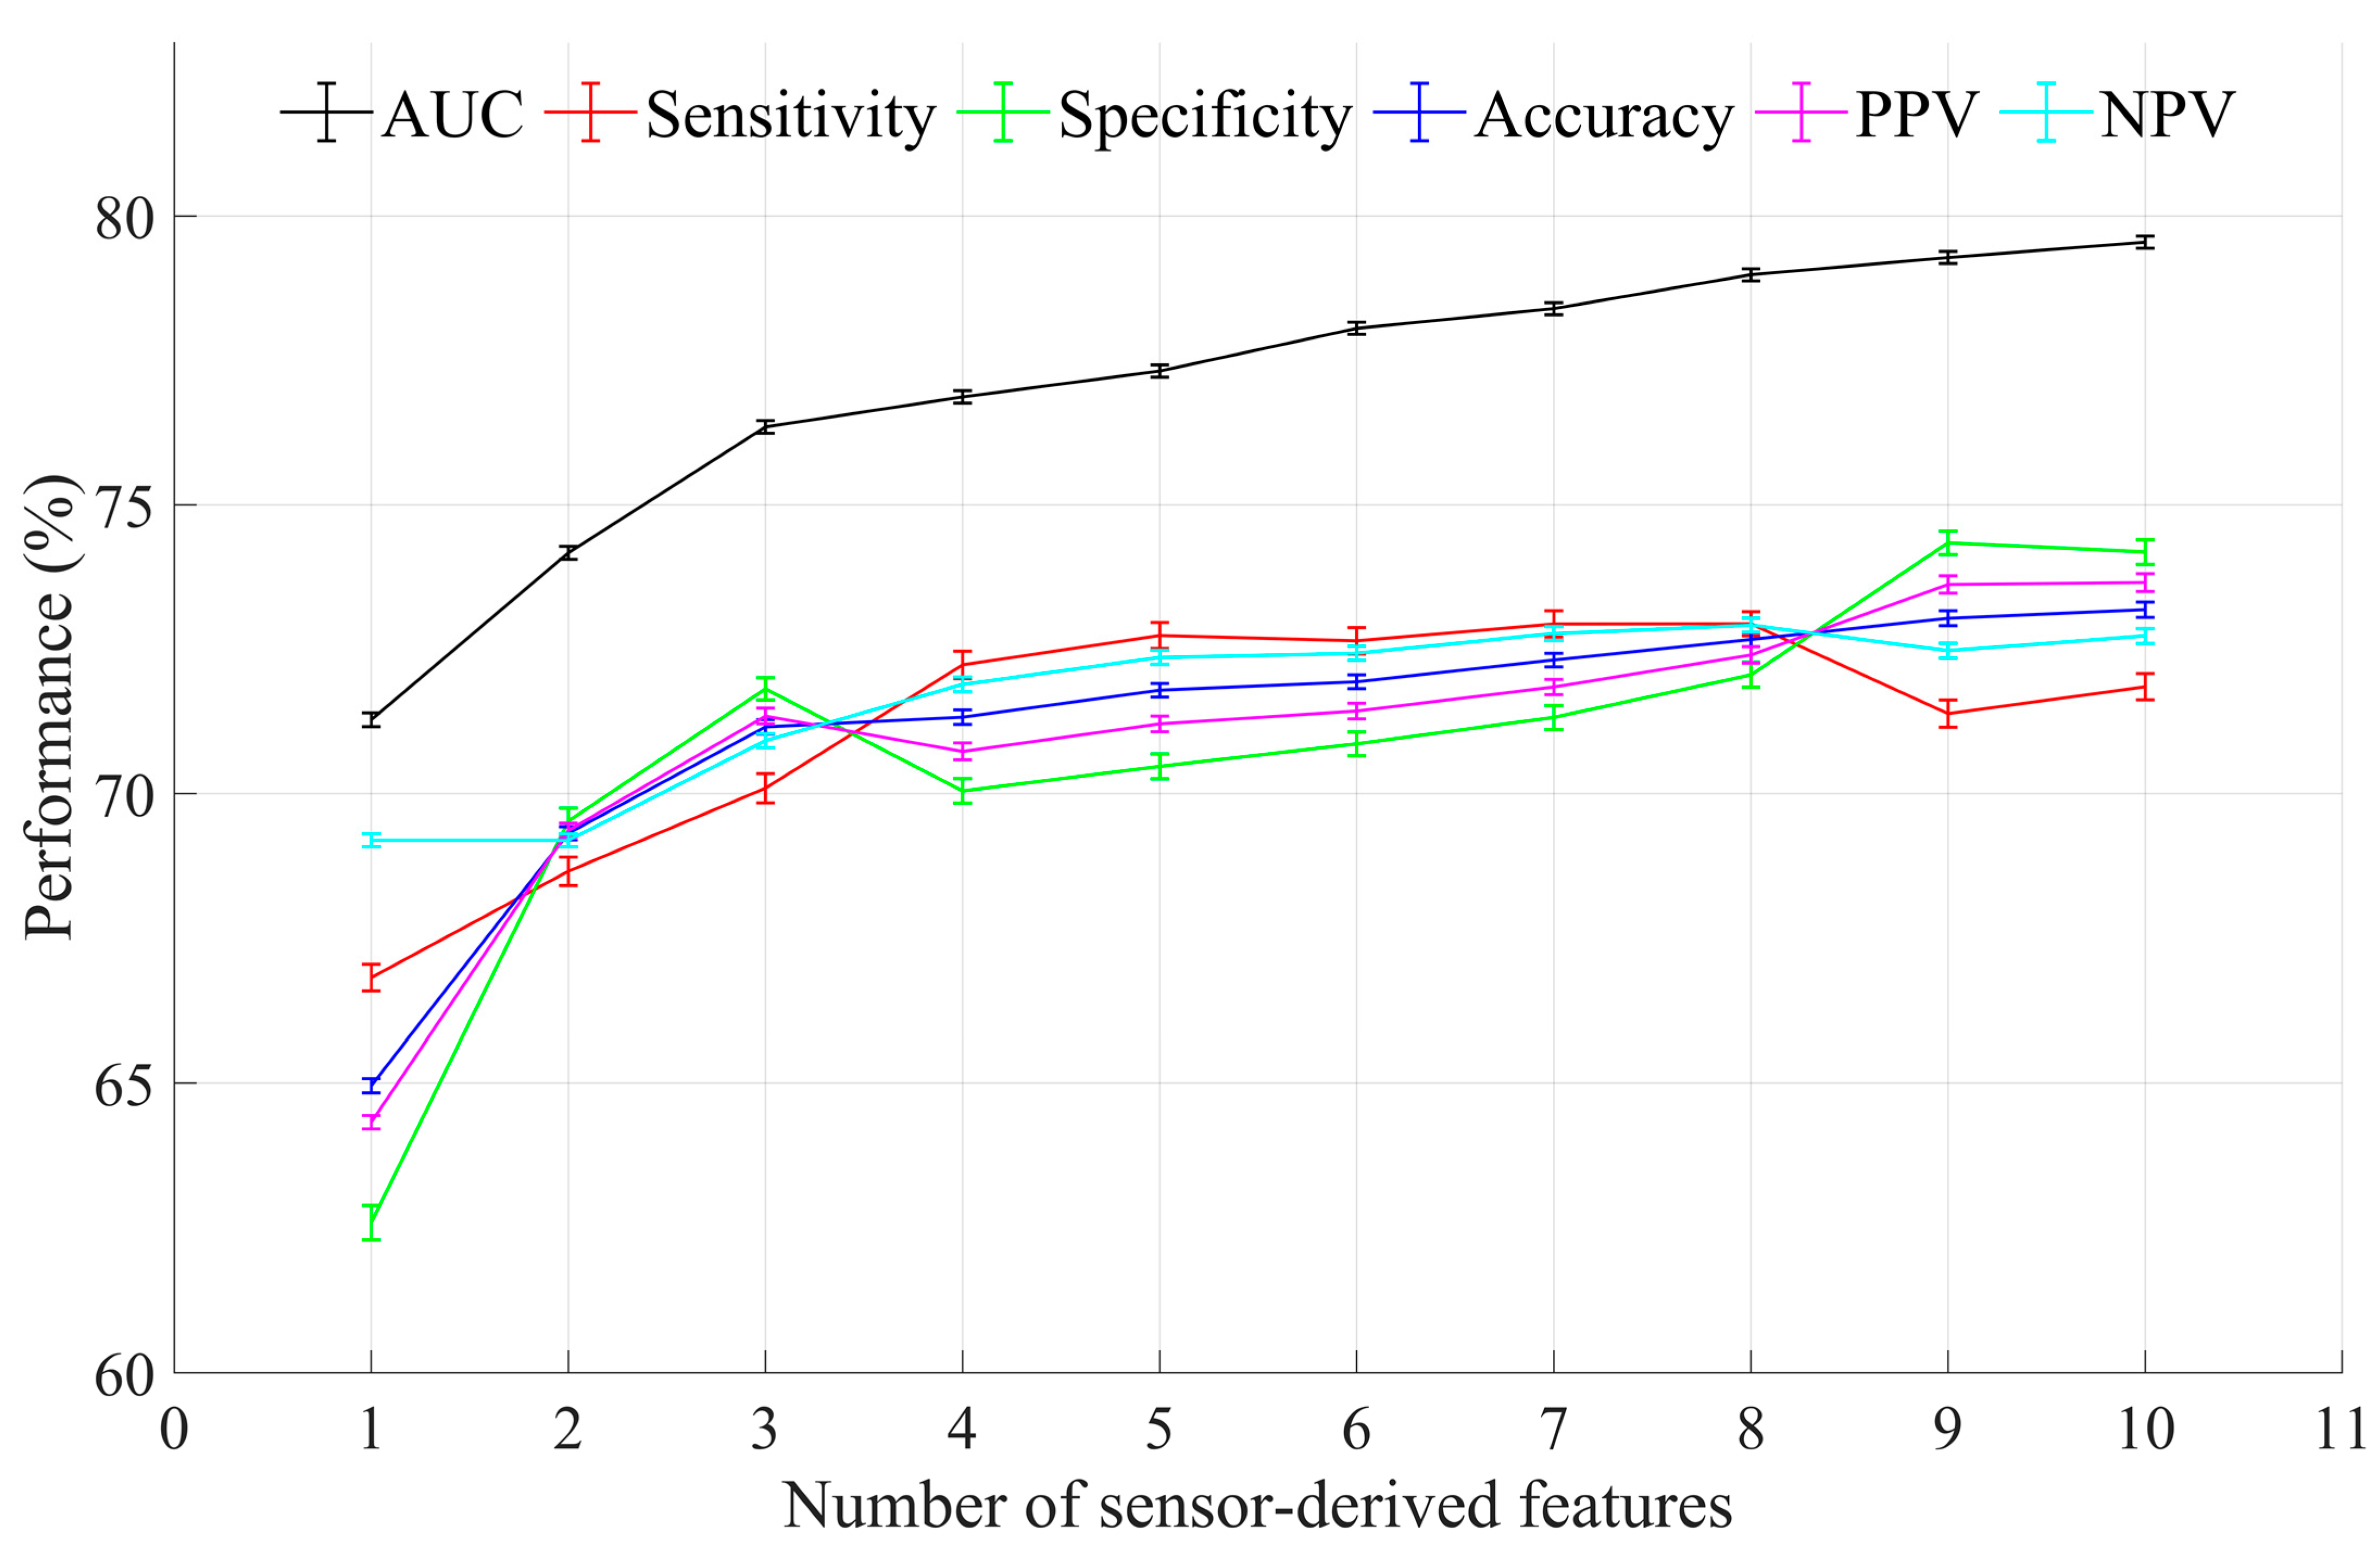
3.2. Optimal Feature Selection and Evaluation
4. Discussion
5. Conclusions
Author Contributions
Funding
Institutional Review Board Statement
Informed Consent Statement
Data Availability Statement
Acknowledgments
Conflicts of Interest
References
- Xue, Q.-L. The frailty syndrome: Definition and natural history. Clin. Geriatr. Med. 2011, 27, 1–15. [Google Scholar] [CrossRef]
- Fried, L.P.; Tangen, C.M.; Walston, J.; Newman, A.B.; Hirsch, C.; Gottdiener, J.; Seeman, T.; Tracy, R.; Kop, W.J.; Burke, G.; et al. Frailty in older adults: Evidence for a phenotype. J. Gerontol. Ser. A Biol. Sci. Med. Sci. 2001, 56, M146–M156. [Google Scholar] [CrossRef]
- Ofori-Asenso, R.; Chin, K.L.; Mazidi, M.; Zomer, E.; Ilomaki, J.; Zullo, A.R.; Gasevic, D.; Ademi, Z.; Korhonen, M.J.; LoGiudice, D.; et al. Global incidence of frailty and prefrailty among community-dwelling older adults: A systematic review and meta-analysis. JAMA Netw. Open 2019, 2, e198398. [Google Scholar] [CrossRef]
- Fedarko, N.S. The biology of aging and frailty. Clin. Geriatr. Med. 2011, 27, 27–37. [Google Scholar] [CrossRef]
- Harrison, J.K.; Clegg, A.; Conroy, S.P.; Young, J. Managing frailty as a long-term condition. Age Ageing 2015, 44, 732–735. [Google Scholar] [CrossRef]
- Koller, K.; Rockwood, K. Frailty in older adults: Implications for end-of-life care. Clevel. Clin. J. Med. 2013, 80, 168–174. [Google Scholar] [CrossRef] [PubMed]
- Bandeen-Roche, K.; Seplaki, C.L.; Huang, J.; Buta, B.; Kalyani, R.R.; Varadhan, R.; Xue, Q.-L.; Walston, J.D.; Kasper, J.D. Frailty in older adults: A nationally representative profile in the United States. J. Gerontol. Ser. A Biol. Sci. Med. Sci. 2015, 70, 1427–1434. [Google Scholar] [CrossRef] [PubMed]
- Siriwardhana, D.D.; Hardoon, S.; Rait, G.; Weerasinghe, M.C.; Walters, K.R. Prevalence of frailty and prefrailty among community-dwelling older adults in low-income and middle-income countries: A systematic review and meta-analysis. BMJ Open 2018, 8, e018195. [Google Scholar] [CrossRef] [PubMed]
- Kojima, G. Frailty as a predictor of emergency department utilization among community-dwelling older people: A systematic review and meta-analysis. J. Am. Med. Dir. Assoc. 2019, 20, 103–105. [Google Scholar] [CrossRef] [PubMed]
- Chi, J.; Chen, F.; Zhang, J.; Niu, X.; Tao, H.; Ruan, H.; Wang, Y.; Hu, J. Impacts of frailty on health care costs among community-dwelling older adults: A meta-analysis of cohort studies. Arch. Gerontol. Geriatr. 2021, 94, 104344. [Google Scholar] [CrossRef] [PubMed]
- Santos-Eggimann, B.; Sirven, N. Screening for frailty: Older populations and older individuals. Public Health Rev. 2016, 37, 7. [Google Scholar] [CrossRef] [PubMed]
- Morley, J.E.; Vellas, B.; van Kan, G.A.; Anker, S.D.; Bauer, J.M.; Bernabei, R.; Cesari, M.; Chumlea, W.C.; Doehner, W.; Evans, J.; et al. Frailty consensus: A call to action. J. Am. Med. Dir. Assoc. 2013, 14, 392–397. [Google Scholar] [CrossRef]
- Puts, M.T.E.; Toubasi, S.; Andrew, M.K.; Ashe, M.C.; Ploeg, J.; Atkinson, E.; Ayala, A.P.; Roy, A.; Rodríguez Monforte, M.; Bergman, H.; et al. Interventions to prevent or reduce the level of frailty in community-dwelling older adults: A scoping review of the literature and international policies. Age Ageing 2017, 46, 383–392. [Google Scholar] [CrossRef]
- Walston, J.; Buta, B.; Xue, Q.L. Frailty screening and interventions: Considerations for clinical practice. Clin. Geriatr. Med. 2018, 34, 25–38. [Google Scholar] [CrossRef] [PubMed]
- Buta, B.J.; Walston, J.D.; Godino, J.G.; Park, M.; Kalyani, R.R.; Xue, Q.L.; Bandeen-Roche, K.; Varadhan, R. Frailty assessment instruments: Systematic characterization of the uses and contexts of highly-cited instruments. Ageing Res. Rev. 2016, 26, 53–61. [Google Scholar] [CrossRef]
- Rockwood, K.; Song, X.; MacKnight, C.; Bergman, H.; Hogan, D.B.; McDowell, I.; Mitnitski, A. A global clinical measure of fitness and frailty in elderly people. CMAJ 2005, 173, 489–495. [Google Scholar] [CrossRef]
- Dent, E.; Kowal, P.; Hoogendijk, E.O. Frailty measurement in research and clinical practice: A review. Eur. J. Intern. Med. 2016, 31, 3–10. [Google Scholar] [CrossRef]
- Toosizadeh, N.; Mohler, J.; Najafi, B. Assessing upper extremity motion: An innovative method to identify frailty. J. Am. Geriatr. Soc. 2015, 63, 1181–1186. [Google Scholar] [CrossRef] [PubMed]
- Buchman, A.S.; Wilson, R.S.; Bienias, J.L.; Bennett, D.A. Change in frailty and risk of death in older persons. Exp. Aging Res. 2009, 35, 61–82. [Google Scholar] [CrossRef] [PubMed]
- Toosizadeh, N.; Wendel, C.; Hsu, C.-H.; Zamrini, E.; Mohler, J. Frailty assessment in older adults using upper-extremity function: Index development. BMC Geriatr. 2017, 17, 117. [Google Scholar] [CrossRef]
- Lee, H.; Joseph, B.; Enriquez, A.; Najafi, B. Toward using a smartwatch to monitor frailty in a hospital setting: Using a single wrist-wearable sensor to assess frailty in bedbound inpatients. Gerontology 2018, 64, 389–400. [Google Scholar] [CrossRef] [PubMed]
- Park, C.; Sharafkhaneh, A.; Bryant, M.S.; Nguyen, C.; Torres, I.; Najafi, B. Toward remote assessment of physical frailty using sensor-based sit-to-stand test. J. Surg. Res. 2021, 263, 130–139. [Google Scholar] [CrossRef]
- Park, C.; Mishra, R.; Sharafkhaneh, A.; Bryant, M.S.; Nguyen, C.; Torres, I.; Naik, A.D.; Najafi, B. Digital biomarker representing frailty phenotypes: The use of machine learning and sensor-based sit-to-stand test. Sensors 2021, 21, 3258. [Google Scholar] [CrossRef]
- Apsega, A.; Petrauskas, L.; Alekna, V.; Daunoraviciene, K.; Sevcenko, V.; Mastaviciute, A.; Vitkus, D.; Tamulaitiene, M.; Griskevicius, J. Wearable sensors technology as a tool for discriminating frailty levels during instrumented gait analysis. Appl. Sci. 2020, 10, 8451. [Google Scholar] [CrossRef]
- Blodgett, J.; Theou, O.; Kirkland, S.; Andreou, P.; Rockwood, K. The association between sedentary behaviour, moderate-vigorous physical activity and frailty in NHANES cohorts. Maturitas 2015, 80, 187–191. [Google Scholar] [CrossRef] [PubMed]
- Del Pozo-Cruz, B.; Mañas, A.; Martín-García, M.; Marín-Puyalto, J.; García-García, F.J.; Rodriguez-Mañas, L.; Guadalupe-Grau, A.; Ara, I. Frailty is associated with objectively assessed sedentary behaviour patterns in older adults: Evidence from the Toledo Study for Healthy Aging (TSHA). PLoS ONE 2017, 12, e0183911. [Google Scholar] [CrossRef]
- Schwenk, M.; Mohler, J.; Wendel, C.; D’Huyvetter, K.; Fain, M.; Taylor-Piliae, R.; Najafi, B. Wearable sensor-based in-home assessment of gait, balance, and physical activity for discrimination of frailty status: Baseline results of the Arizona frailty cohort study. Gerontology 2015, 61, 258–267. [Google Scholar] [CrossRef]
- Parvaneh, S.; Mohler, J.; Toosizadeh, N.; Grewal, G.S.; Najafi, B. Postural transitions during activities of daily living could identify frailty status: Application of wearable technology to identify frailty during unsupervised condition. Gerontology 2017, 63, 479–487. [Google Scholar] [CrossRef]
- Razjouyan, J.; Naik, A.D.; Horstman, M.J.; Kunik, M.E.; Amirmazaheri, M.; Zhou, H.; Sharafkhaneh, A.; Najafi, B. Wearable sensors and the assessment of frailty among vulnerable older adults: An observational cohort study. Sensors 2018, 18, 1336. [Google Scholar] [CrossRef] [PubMed]
- de Bruin, E.D.; Najafi, B.; Murer, K.; Uebelhart, D.; Aminian, K. Quantification of everyday motor function in a geriatric population. J. Rehabil. Res. Dev. 2007, 44, 417–428. [Google Scholar] [CrossRef]
- Cohen, J. Statistical Power Analysis for the Behavioral Sciences, 2nd ed.; Taylor & Francis: New York, NY, USA, 2013. [Google Scholar]
- Bradley, A.P. The use of the area under the ROC curve in the evaluation of machine learning algorithms. Pattern Recognit. 1997, 30, 1145–1159. [Google Scholar] [CrossRef]
- Zhu, W. Making bootstrap statistical inferences: A tutorial. Res. Q. Exerc. Sport 1997, 68, 44–55. [Google Scholar] [CrossRef] [PubMed]
- Efron, B.; Tibshirani, R.J. An Introduction to the Bootstrap; Chapman & Hall: New York, NY, USA; London, UK, 1993. [Google Scholar]
- Mandrekar, J.N. Receiver operating characteristic curve in diagnostic test assessment. J. Thorac. Oncol. 2010, 5, 1315–1316. [Google Scholar] [CrossRef] [PubMed]
- Faller, J.W.; Pereira, D.D.N.; de Souza, S.; Nampo, F.K.; Orlandi, F.S.; Matumoto, S. Instruments for the detection of frailty syndrome in older adults: A systematic review. PLoS ONE 2019, 14, e0216166. [Google Scholar] [CrossRef]
- Clegg, A.; Young, J.; Iliffe, S.; Rikkert, M.O.; Rockwood, K. Frailty in elderly people. Lancet 2013, 381, 752–762. [Google Scholar] [CrossRef]
- Schwenk, M.; Howe, C.; Saleh, A.; Mohler, J.; Grewal, G.; Armstrong, D.; Najafi, B. Frailty and technology: A systematic review of gait analysis in those with frailty. Gerontology 2014, 60, 79–89. [Google Scholar] [CrossRef]
- Greene, B.R.; Doheny, E.P.; O’Halloran, A.; Anne Kenny, R. Frailty status can be accurately assessed using inertial sensors and the TUG test. Age Ageing 2014, 43, 406–411. [Google Scholar] [CrossRef] [PubMed]
- Turabieh, H.; Mafarja, M.; Li, X. Iterated feature selection algorithms with layered recurrent neural network for software fault prediction. Expert Syst. Appl. 2019, 122, 27–42. [Google Scholar] [CrossRef]
- Loncar-Turukalo, T.; Zdravevski, E.; da Silva, J.M.; Chouvarda, I.; Trajkovik, V. Literature on wearable technology for connected health: Scoping review of research trends, advances, and barriers. J. Med. Internet Res. 2019, 21, e14017. [Google Scholar] [CrossRef]
- Tokuçoğlu, F. Monitoring physical activity with wearable technologies. Noro Psikiyatr Ars. 2018, 55, S63–S65. [Google Scholar] [CrossRef]
- Kirk, S. The wearables revolution: Is standardization a help or a hindrance?: Mainstream technology or just a passing phase? IEEE Consum. Electron. Mag. 2014, 3, 45–50. [Google Scholar] [CrossRef]


| Sensor-Derived Feature | Description | Phenotype |
|---|---|---|
| Walking cadence | Number of steps per minute in walking, 90th percentile | Slowness/weakness |
| Number of stand-to-sit | Postural transitions from a standing position to a sitting position | Slowness/weakness |
| Duration of stand-to-sit | Duration of stand-to-sit transitions, 90th percentile | Slowness/weakness |
| Number of sit-to-stand | Postural transitions from a sitting position to a standing position | Slowness/weakness |
| Duration of sit-to-stand | Duration of sit-to-stand transitions, 90th percentile | Slowness/weakness |
| Longest walking bout | Number of steps for longest unbroken walking | Exhaustion |
| Walking steps per episode | Average of number of steps per unbroken walking | Exhaustion |
| Walking steps | Number of total walking steps | Inactivity |
| % of sitting | Percentage of sitting time for 24 h | Inactivity |
| % of standing | Percentage of standing time for 24 h | Inactivity |
| % of walking | Percentage of walking time for 24 h | Inactivity |
| % of lying | Percentage of lying time for 24 h | Inactivity |
| No./Total No. (%) by Group | p-Value | ||
|---|---|---|---|
| RG (n = 73) | FG (n = 186) | ||
| Age, years | 74.4 ± 6.6 | 76.6 ± 8.4 | 0.092 |
| Female, n (%) | 53 (72.6) | 115 (61.8) | 0.102 |
| Height, cm | 165.1 ± 8.9 | 163.3 ± 10.1 | 0.185 |
| Weight, kg | 74.8 ± 19.0 | 79.2 ± 17.9 | 0.056 |
| BMI, kg/m2 | 24.6 ± 8.0 | 29.1 ± 8.0 | <0.0001 * |
| Frailty phenotype, 0–5 | 0 | 1.5 ± 1.3 | – |
| Presence of slowness, n (%) | 0 (0) | 129 (69.4) | – |
| Presence of weakness, n (%) | 0 (0) | 119 (64.0) | – |
| Presence of exhaustion, n (%) | 0 (0) | 56 (30.1) | – |
| Presence of weight loss, n (%) | 0 (0) | 17 (9.1) | – |
| Presence of inactivity, n (%) | 0 (0) | 75 (40.3) | – |
| Sensor-Derived Feature | Unit | RG (n = 73) | FG (n = 186) | p-Value | Effect Size |
|---|---|---|---|---|---|
| Walking cadence | steps/min | 115.3 ± 9.0 | 108.8 ± 16.2 | <0.0001 * | 0.50 |
| Number of stand-to-sit | n | 134.2 ± 70.8 | 114.3 ± 59.9 | 0.032 * | 0.30 |
| Duration of stand-to-sit | s | 3.9 ± 0.6 | 4.3 ± 1.2 | 0.004 * | 0.42 |
| Number of sit-to-stand | n | 137.0 ± 66.0 | 117.1 ± 59.0 | 0.023 * | 0.32 |
| Duration of sit-to-stand | s | 3.9 ± 0.6 | 4.6 ± 1.5 | <0.0001 * | 0.61 |
| Longest walking bout | n | 1372.7 ± 1702.5 | 472.9 ± 749.8 | <0.0001 * | 0.68 |
| Walking steps per episode | n | 32.5 ± 18.9 | 25.4 ± 13.8 | 0.003 * | 0.43 |
| Walking steps | n | 4788.5 ± 2667.6 | 3004.6 ± 2531.5 | <0.0001 * | 0.69 |
| % of sitting | % | 34.3 ± 11.0 | 37.6 ± 13.9 | 0.040 * | 0.26 |
| % of standing | % | 17.9 ± 4.8 | 13.7 ±5.5 | <0.0001 * | 0.81 |
| % of walking | % | 6.8 ± 3.1 | 4.3 ± 3.0 | <0.0001 * | 0.82 |
| % of lying | % | 41.0 ± 12.3 | 44.4 ± 16.4 | 0.117 | 0.24 |
| Model (Dependent Variable) | Features (Independent Variables) | AUC |
|---|---|---|
| Physical frailty | Walking cadence, Number of stand-to-sit, Duration of stand-to-sit, Number of sit-to-stand, Duration of sit-to-stand, Longest walking bout, Walking steps per episode, Walking steps, % of sitting, % of standing, % of walking | 0.80 |
| Slowness | Walking cadence | 0.74 |
| Number of stand-to-sit | ||
| Duration of stand-to-sit | ||
| Number of sit-to-stand | ||
| Duration of sit-to-stand | ||
| Weakness | Walking cadence | 0.71 |
| Number of stand-to-sit | ||
| Duration of stand-to-sit | ||
| Number of sit-to-stand | ||
| Duration of sit-to-stand | ||
| Exhaustion | Longest walking bout | 0.60 |
| Walking steps per episode | ||
| Inactivity | Walking steps | 0.72 |
| % of sitting | ||
| % of standing | ||
| % of walking |
| Rank | Sensor-Derived Features | Phenotype |
|---|---|---|
| 1 | % of standing | Inactivity |
| 2 | % of walking | Inactivity |
| 3 | Walking cadence | Slowness/weakness |
| 4 | Longest walking bout | Exhaustion |
| 5 | Walking steps per episode | Exhaustion |
| 6 | % of sitting | Inactivity |
| 7 | Duration of sit-to-stand | Slowness/weakness |
| 8 | Walking steps | Inactivity |
| 9 | Duration of sit-to-stand | Slowness/weakness |
| 10 | Number of stand-to-sit | Slowness/weakness |
| 11 | Duration of stand-to-sit | Slowness/weakness |
| Validation Metric | Mean | 95% Confidence Interval |
|---|---|---|
| AUC (%) | 75.4 | 75.3 to 75.5 |
| Sensitivity (%) | 70.5 | 70.1 to 70.8 |
| Specificity (%) | 69.0 | 68.7 to 69.3 |
| Accuracy (%) | 69.5 | 69.4 to 69.7 |
| PPV (%) | 69.6 | 69.4 to 69.9 |
| NPV (%) | 70.1 | 69.9 to 70.4 |
Publisher’s Note: MDPI stays neutral with regard to jurisdictional claims in published maps and institutional affiliations. |
© 2021 by the authors. Licensee MDPI, Basel, Switzerland. This article is an open access article distributed under the terms and conditions of the Creative Commons Attribution (CC BY) license (https://creativecommons.org/licenses/by/4.0/).
Share and Cite
Park, C.; Mishra, R.; Golledge, J.; Najafi, B. Digital Biomarkers of Physical Frailty and Frailty Phenotypes Using Sensor-Based Physical Activity and Machine Learning. Sensors 2021, 21, 5289. https://doi.org/10.3390/s21165289
Park C, Mishra R, Golledge J, Najafi B. Digital Biomarkers of Physical Frailty and Frailty Phenotypes Using Sensor-Based Physical Activity and Machine Learning. Sensors. 2021; 21(16):5289. https://doi.org/10.3390/s21165289
Chicago/Turabian StylePark, Catherine, Ramkinker Mishra, Jonathan Golledge, and Bijan Najafi. 2021. "Digital Biomarkers of Physical Frailty and Frailty Phenotypes Using Sensor-Based Physical Activity and Machine Learning" Sensors 21, no. 16: 5289. https://doi.org/10.3390/s21165289
APA StylePark, C., Mishra, R., Golledge, J., & Najafi, B. (2021). Digital Biomarkers of Physical Frailty and Frailty Phenotypes Using Sensor-Based Physical Activity and Machine Learning. Sensors, 21(16), 5289. https://doi.org/10.3390/s21165289