
An Automated Pipeline for Dynamic Detection of Sub-Surface Metal Loss Defects across Cold Thermography Images


Abstract
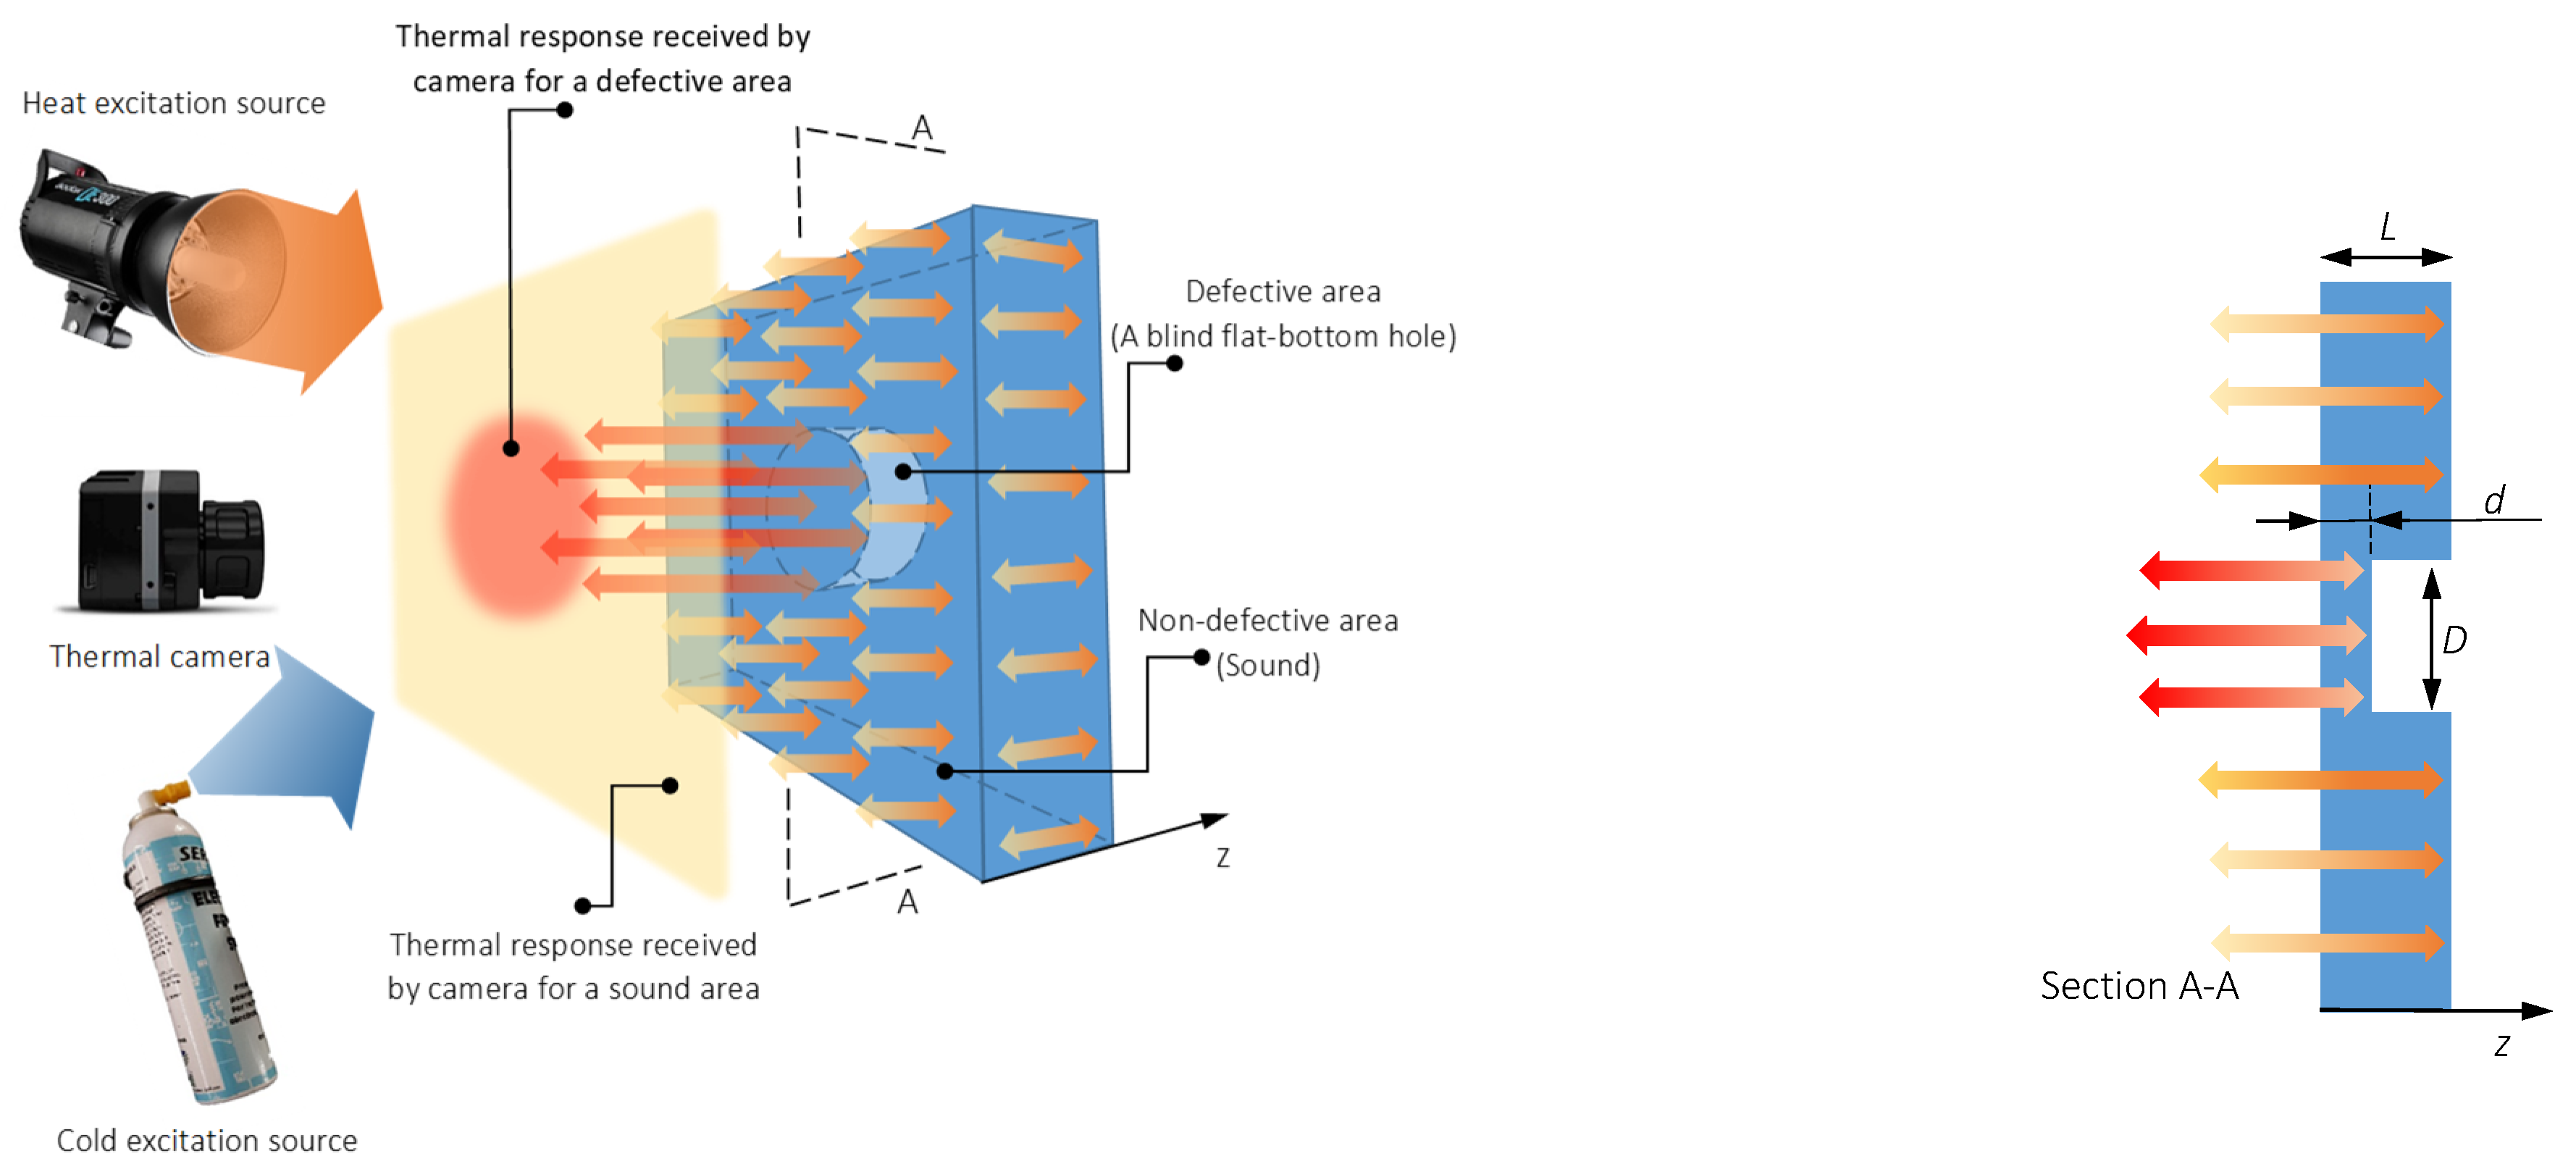
:1. Introduction
2. Materials and Methods
3. Results and Discussions
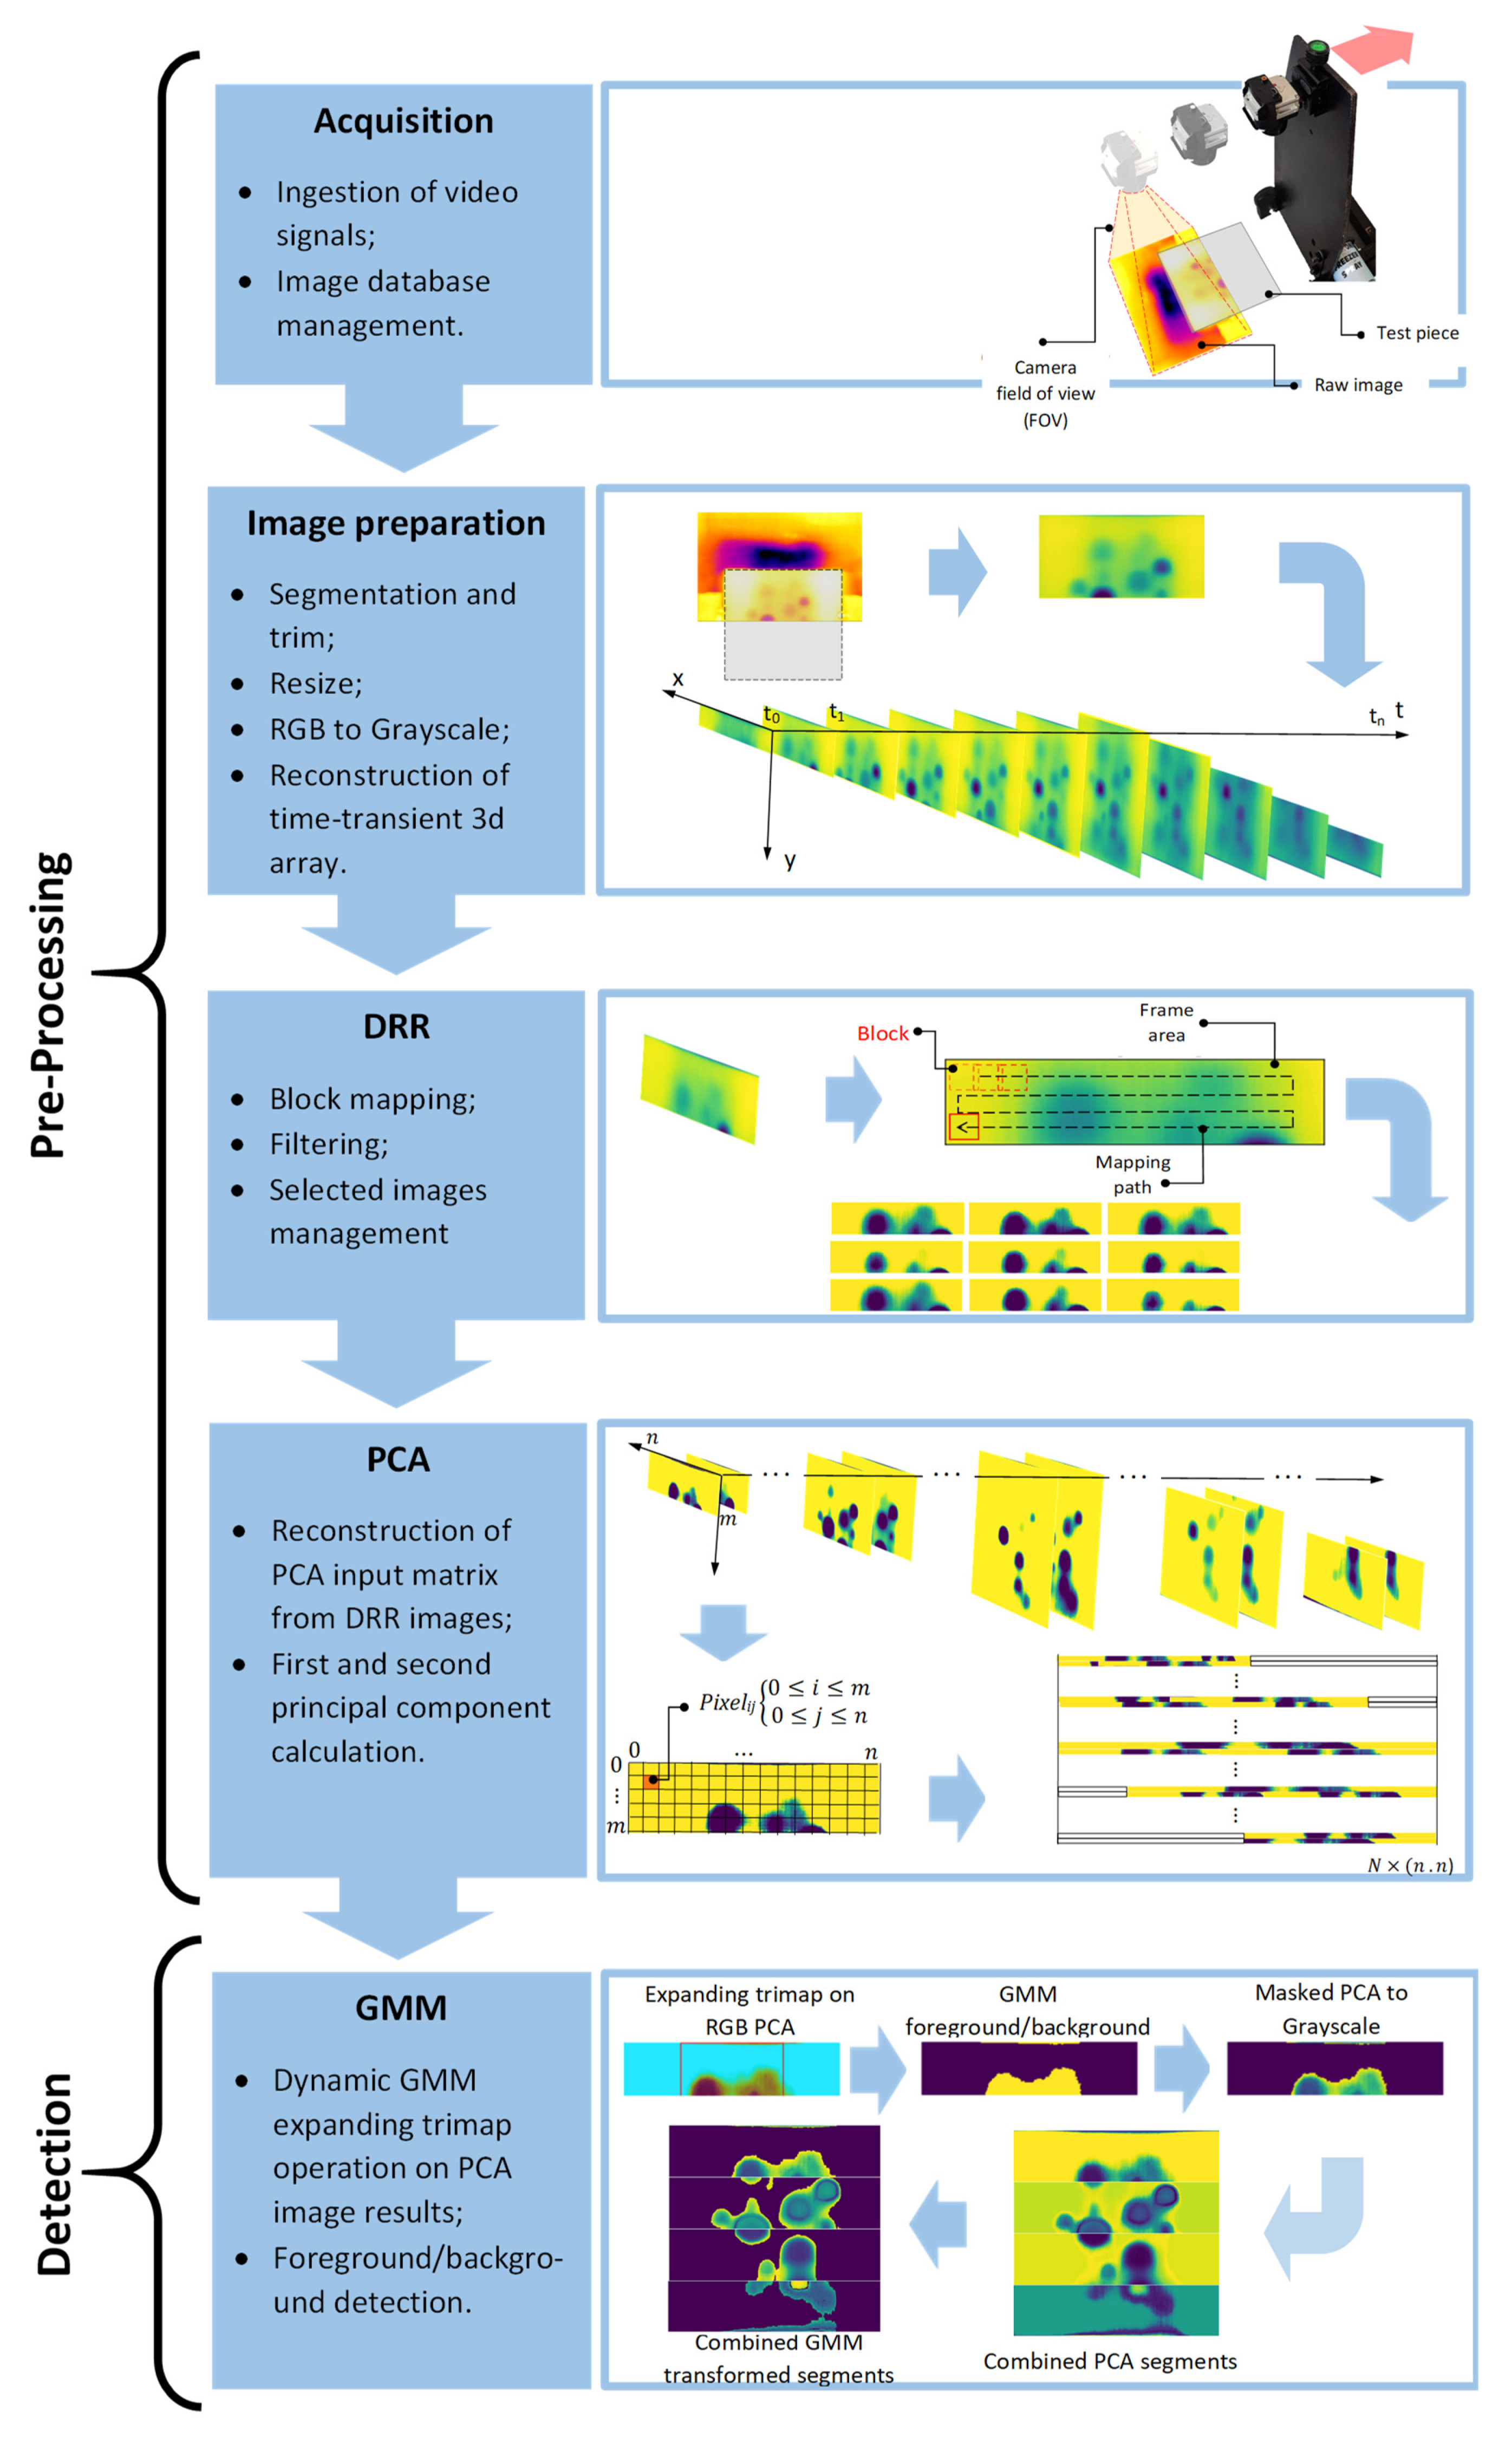
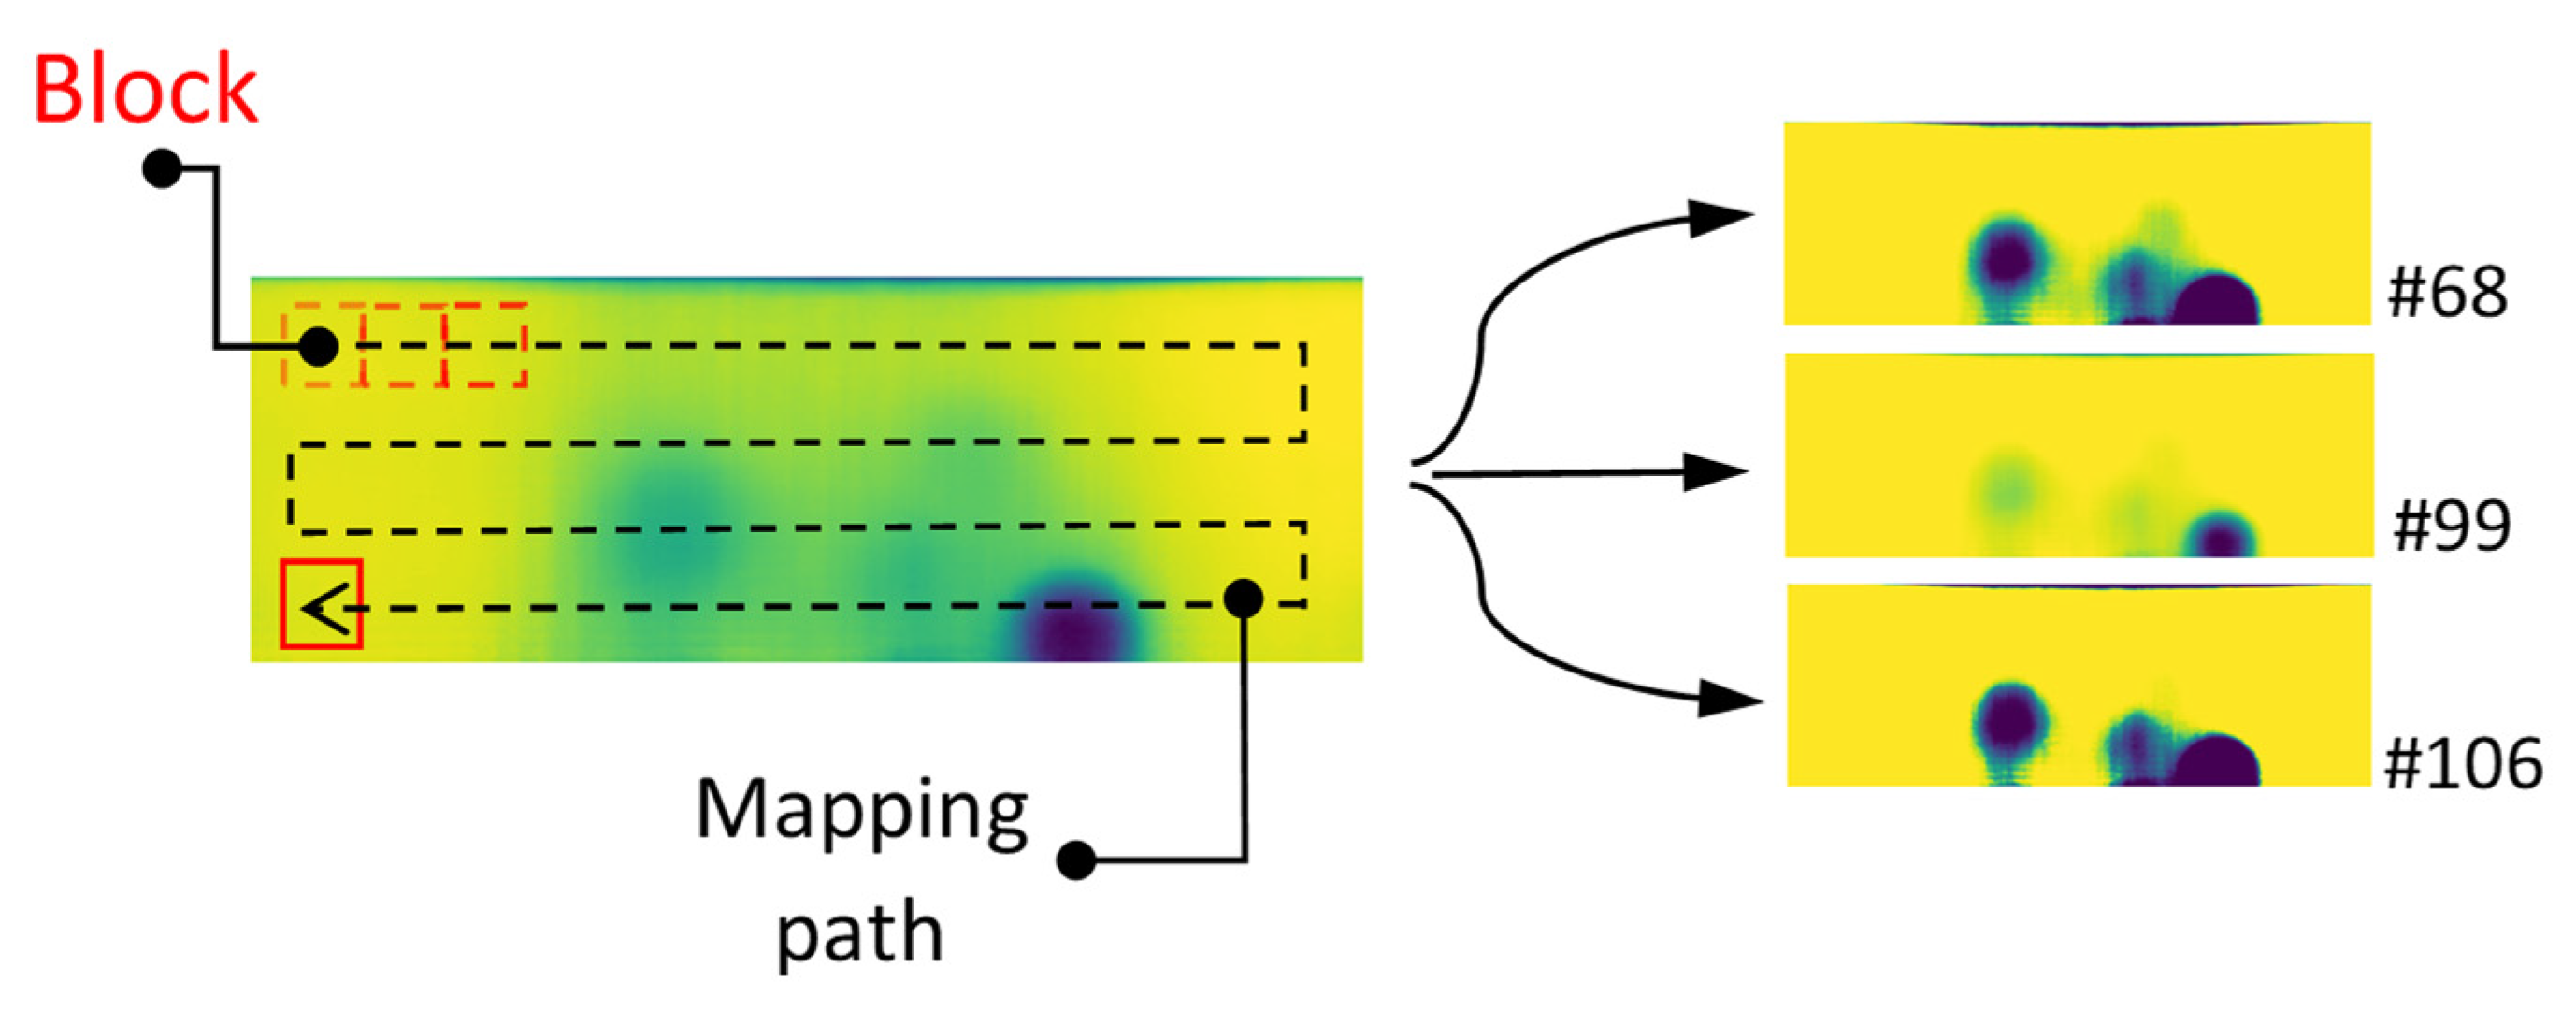
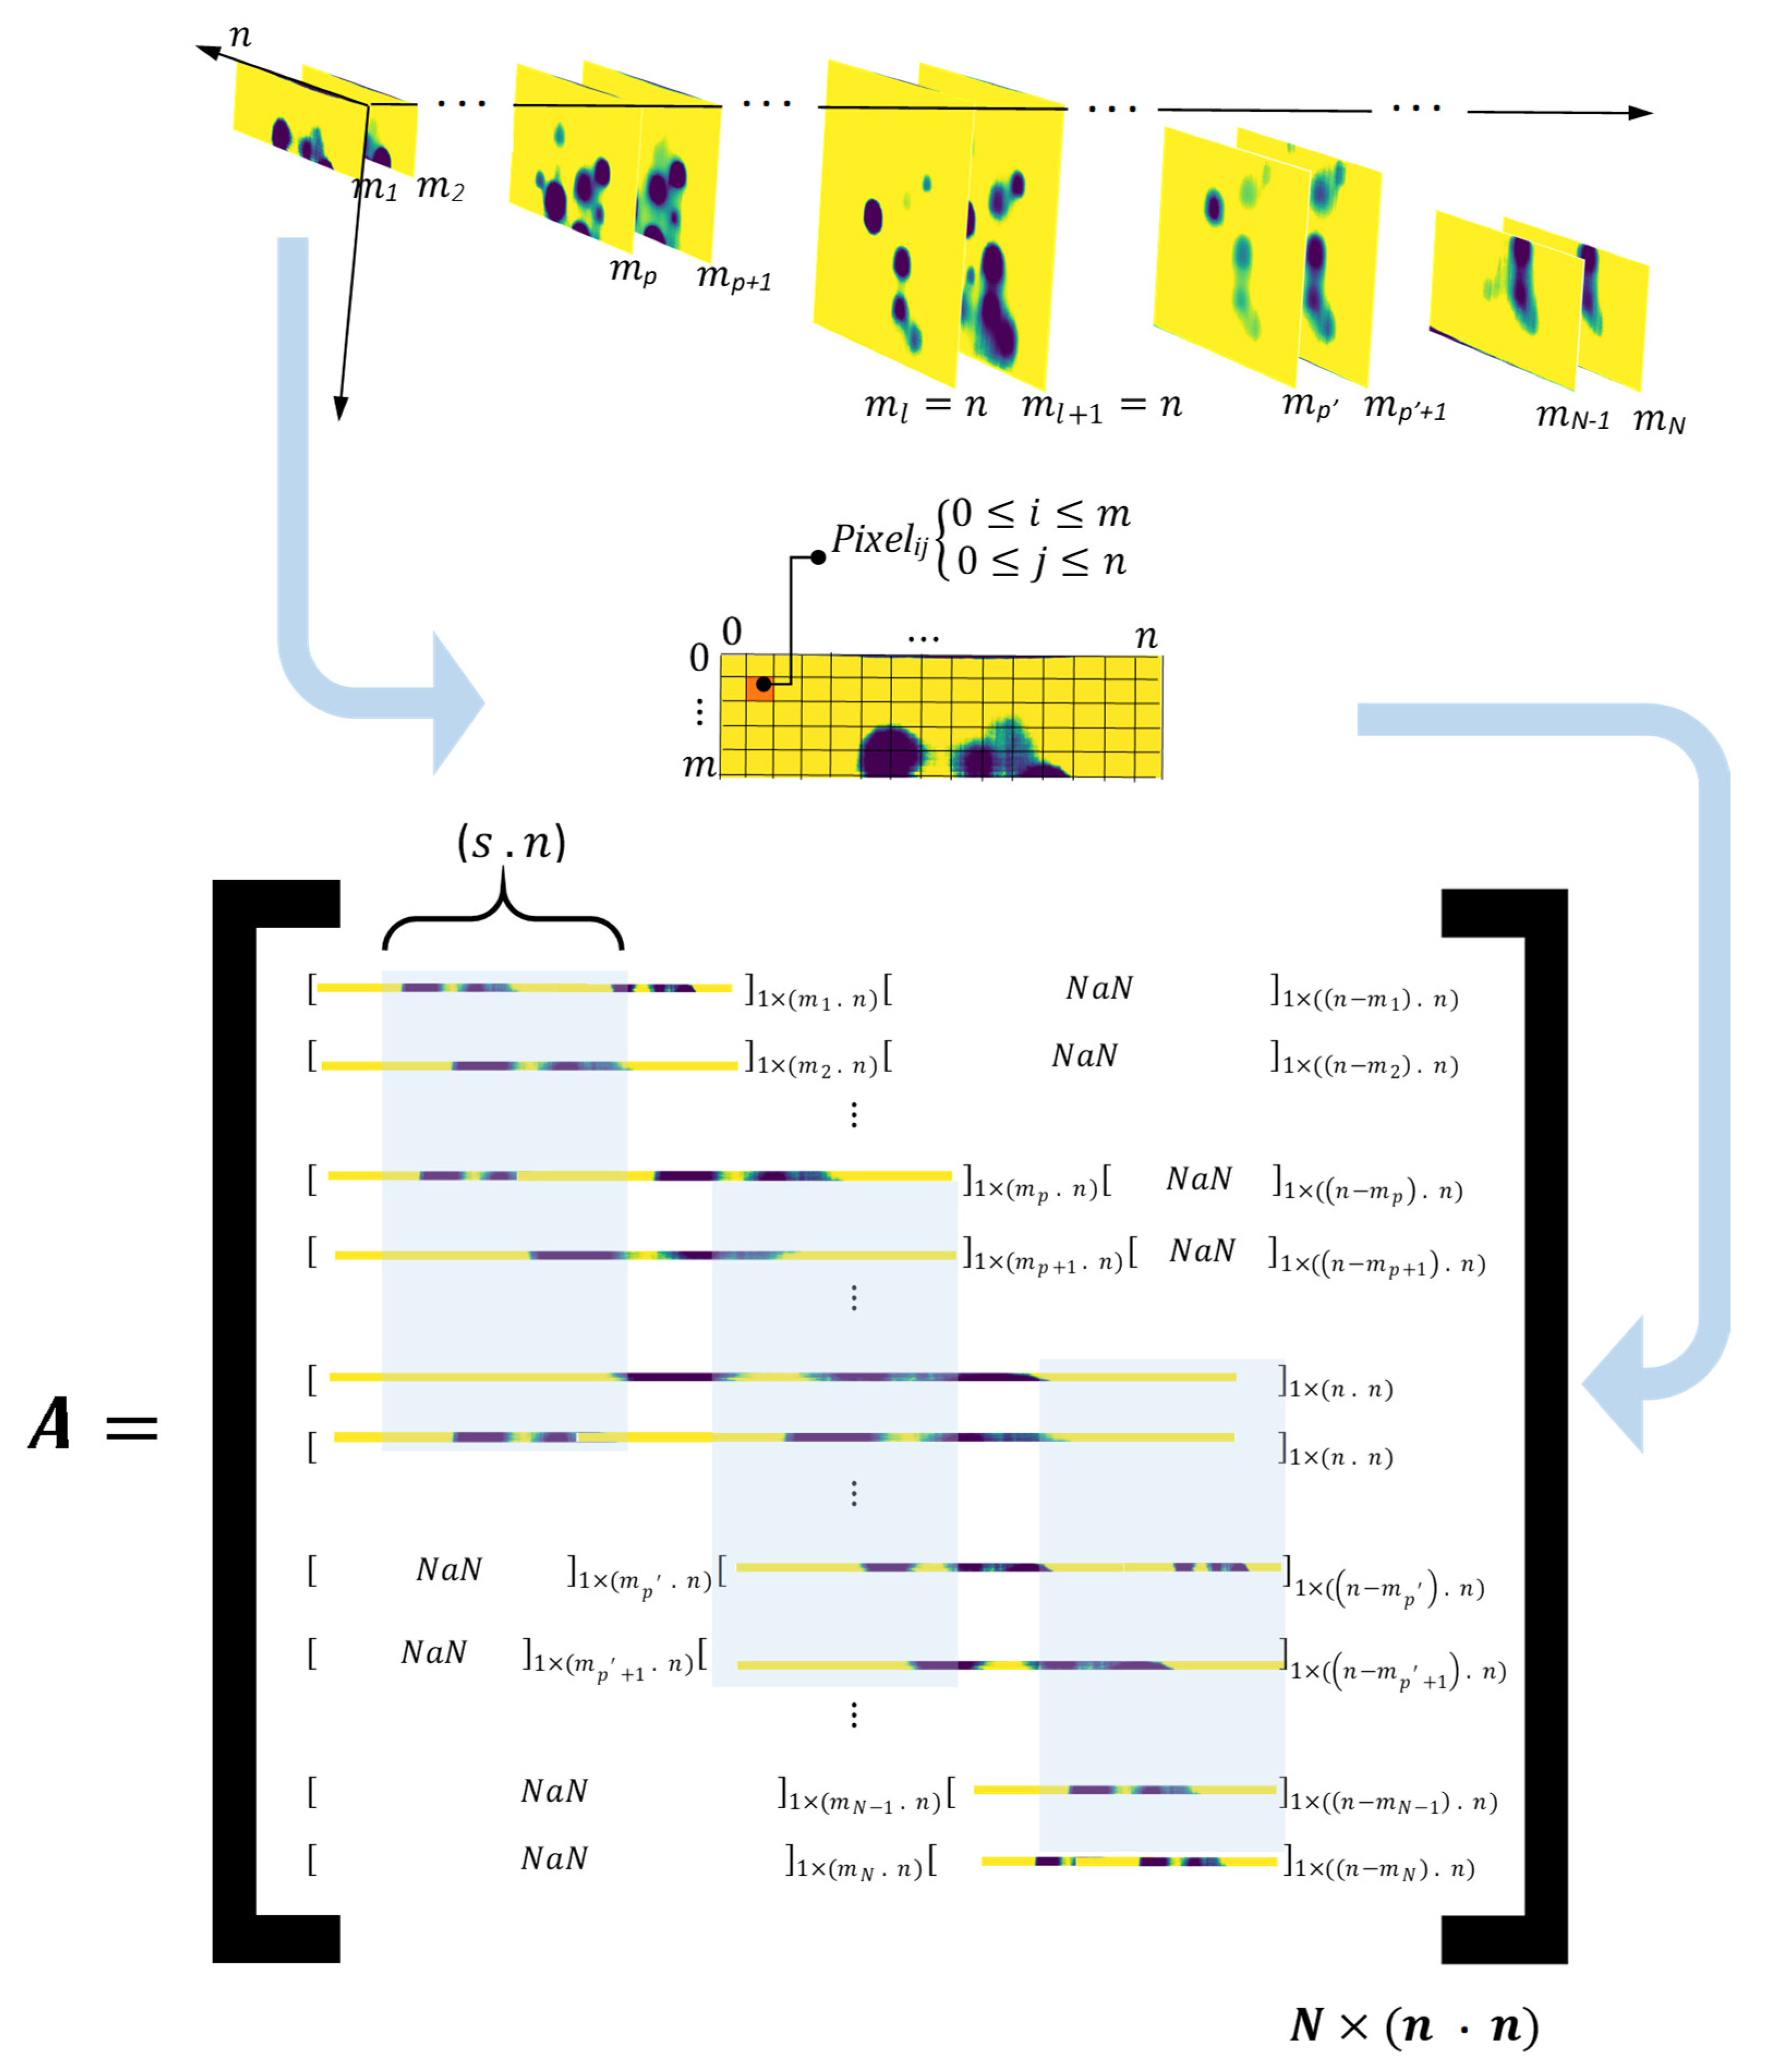
3.1. Image Data Pre-Processing
3.2. Detection
- -
- User initialises a labelled sample of pixels known as trimap in an RGB image with color intensities of and transparency of . This trimap can be either in the form of a manual identification (highlighting) the background/foreground in the original image or selecting an area fully surrounding the foreground, meaning all the pixels out of this area (generally a rectangle) are labelled as definite background. Here, the labelling follows the context of “hard” labelling meaning where any pixel in the background will be labeled as and any pixel in the foreground will be labeled as . In this work, the concept of rectangle trimap is used where only the labelled background pixels are supplied as for (background) and any pixel inside the trimap is assigned to (undefined).
- -
- For each background (definite background) and undefined (probable background or foreground) pixel set a Gaussian distribution function is initialised. Gaussian Mixture is used to model each colour channels distribution, each identified by , where is the number of classes in the data which here is equivalent to 2 (background or foreground) [35,36,37]. In order to find the optimum parameters of each distinct distribution function along the -dimensional data (, for a RGB image), an expectation-maximization algorithm is used. EM is an iterative method to find maximum likelihood or maximum a posteriori estimates of distribution parameters, where the model depends on unobserved latent parameters. These parameters are and the Gaussian distribution can be written as:
4. Conclusions
5. Future Work
Author Contributions
Funding
Institutional Review Board Statement
Informed Consent Statement
Data Availability Statement
Conflicts of Interest
References
- Almond, D.P.; Angioni, S.L.; Pickering, S.G. Long pulse excitation thermographic non-destructive evaluation. NDT E Int. 2017, 87, 7–14. [Google Scholar] [CrossRef] [Green Version]
- Doshvarpassand, S.; Wu, C.; Wang, X. An overview of corrosion defect characterization using active infrared thermography. Infrared Phys. Technol. 2019, 96, 366–389. [Google Scholar] [CrossRef]
- Doshvarpassand, S.; Wang, X.; Zhao, X. Sub-surface metal loss defect detection using cold thermography and dynamic reference reconstruction (DRR). Struct. Health Monit. 2021. [Google Scholar] [CrossRef]
- Li, C.; Sun, L.; Xu, Z.; Wu, X.; Liang, T.; Shi, W. Experimental investigation and error analysis of high precision FBG displacement sensor for structural health monitoring. Int. J. Struct. Stab. Dyn. 2020, 20, 2040011. [Google Scholar] [CrossRef]
- Sun, L.; Li, C.; Zhang, C.; Su, Z.; Chen, C. Early monitoring of rebar corrosion evolution based on FBG sensor. Int. J. Struct. Stab. Dyn. 2018, 18, 1840001. [Google Scholar] [CrossRef]
- Tsai, Y.-H.; Wang, J.; Chien, W.-T.; Wei, C.-Y.; Wang, X.; Hsieh, S.-H. A BIM-based approach for predicting corrosion under insulation. Autom. Constr. 2019, 107, 102923. [Google Scholar] [CrossRef]
- Roberge, P.R. Corrosion Engineering; McGraw-Hill: New York, NY, USA, 2008. [Google Scholar]
- Cao, X.; Huang, Z.; He, C.; Wu, W.; Xi, L.; Li, Y.; Fang, D. In-situ synchrotron X-ray tomography investigation of the imperfect smooth-shell cylinder structure. Compos. Struct. 2021, 267, 113926. [Google Scholar] [CrossRef]
- Sun, L.; Li, C.; Zhang, C.; Liang, T.; Zhao, Z. The strain transfer mechanism of fiber bragg grating sensor for extra large strain monitoring. Sensors 2019, 19, 1851. [Google Scholar] [CrossRef] [Green Version]
- Zhang, C.; Alam, Z.; Sun, L.; Su, Z.; Samali, B. Fibre Bragg grating sensor-based damage response monitoring of an asymmetric reinforced concrete shear wall structure subjected to progressive seismic loads. Struct. Control Health Monit. 2019, 26, e2307. [Google Scholar] [CrossRef] [Green Version]
- Wu, C.; Wang, X.; Chen, M.; Kim, M.J. Differential received signal strength based RFID positioning for construction equipment tracking. Adv. Eng. Inform. 2019, 42, 100960. [Google Scholar] [CrossRef]
- Qin, C.; Jin, Y.; Tao, J.; Xiao, D.; Yu, H.; Liu, C.; Shi, G.; Lei, J.; Liu, C. DTCNNMI: A deep twin convolutional neural networks with multi-domain inputs for strongly noisy diesel engine misfire detection. Measurement 2021, 109548. [Google Scholar] [CrossRef]
- Zuo, C.; Chen, Q.; Tian, L.; Waller, L.; Asundi, A. Transport. of intensity phase retrieval and computational imaging for partially coherent fields: The phase space perspective. Opt. Lasers Eng. 2015, 71, 20–32. [Google Scholar] [CrossRef]
- Bai, Y.; Wang, S.; Mou, B.; Wang, Y.; Skalomenos, K.A. Bi-directional seismic behavior of steel beam-column connections with outer annular stiffener. Eng. Struct. 2021, 227, 111443. [Google Scholar] [CrossRef]
- Qin, C.; Tao, J.; Shi, H.; Xiao, D.; Li, B.; Liu, C. A novel Chebyshev-wavelet-based approach for accurate and fast prediction of milling stability. Precis. Eng. 2020, 62, 244–255. [Google Scholar] [CrossRef]
- Bagavathiappan, S.; Lahiri, B.; Saravanan, T.; Philip, J.; Jayakumar, T. Infrared thermography for condition monitoring—A review. Infrared Phys. Technol. 2013, 60, 35–55. [Google Scholar] [CrossRef]
- Jiang, J.; Bao, W.; Peng, Z.Y.; Dai, X.H. Creep property of TMCP high-strength steel Q690CFD at elevated temperatures. J. Mater. Civ. Eng. 2020, 32, 04019364. [Google Scholar] [CrossRef]
- Zhang, K.; Huo, Q.; Zhou, Y.-Y.; Wang, H.-H.; Li, G.-P.; Wang, Y.-W. Textiles/metal–organic frameworks composites as flexible air filters for efficient particulate matter removal. ACS Appl. Mater. Interfaces 2019, 11, 17368–17374. [Google Scholar] [CrossRef]
- Ibarra-Castanedo, C.; Tarpani, J.R.; Maldague, X.P.V. Nondestructive testing with thermography. Eur. J. Phys. 2013, 34, S91–S109. [Google Scholar] [CrossRef]
- Carslaw, H.S.; Jaeger, J.C. Conduction of Heat in Solids, 2nd ed.; Clarendon Press: Oxford, UK, 1959. [Google Scholar]
- Maldague, X. Applications of infrared thermography in nondestructive evaluation. Trends Opt. Nondestruct. Test. 2000, 591–633. [Google Scholar] [CrossRef]
- Maldague, X.; Marinetti, S. Pulse phase infrared thermography. J. Appl. Phys. 1996, 79, 2694–2698. [Google Scholar] [CrossRef]
- Ibarra-Castanedo, C.; Genest, M.; Piau, J.-M.; Guibert, S.; Bendada, A.; Maldague, X.P.V. Active infrared thermography techniques for the nondestructive testing of materials. In Ultrasonic and Advanced Methods for Nondestructive Testing and Material Characterization; World Scientific: Singapore, 2007; pp. 325–348. [Google Scholar]
- Bracewell, R. The Fourier Transform and Its Applications; McGraw-Hill: New York, NY, USA, 1986; Volume 31999. [Google Scholar]
- Potet, P.; Lesbre, F.; Bathias, C. Quantitative characterization of impact damage in composite materials—a comparison between computerized vibrothermography and X-ray tomography. In Nondestructive Testing and Evaluation for Manufacturing and Construction; dos Reis, H.L.M., Ed.; Elsevier: Amsterdam, The Netherlands, 1989; pp. 95–105. [Google Scholar]
- Lau, S.; Almond, D.; Milne, J. A quantitative analysis of pulsed video thermography. NDT E Int. 1991, 24, 195–202. [Google Scholar] [CrossRef]
- Maldague, X.P. Nondestructive evaluation of materials by infrared thermography. NDT E Int. 1996, 6, 396. [Google Scholar]
- Jiang, Q.; Shao, F.; Lin, W.; Gu, K.; Jiang, G.; Sun, H. Optimizing multistage discriminative dictionaries for blind image quality assessment. IEEE Trans. Multimed. 2018, 20, 2035–2048. [Google Scholar] [CrossRef]
- Omar, T.; Nehdi, M.L. Remote sensing of concrete bridge decks using unmanned aerial vehicle infrared thermography. Autom. Constr. 2017, 83, 360–371. [Google Scholar] [CrossRef]
- Hummel, R. Image Enhancement by Histogram Transformation; Maryland University College Park Computer Science Center: College Park, MD, USA, 1975. [Google Scholar]
- Zhu, Y.; Huang, C. An adaptive histogram equalization algorithm on the image gray level mapping. Phys. Procedia 2012, 25, 601–608. [Google Scholar] [CrossRef] [Green Version]
- Kim, T.K.; Paik, J.; Kang, B.S. Contrast enhancement system using spatially adaptive histogram equalization with temporal filtering. IEEE Trans. Consum. Electron. 1998, 44, 82–87. [Google Scholar]
- Bajwa, I.S.; Naweed, M.; Asif, M.N.; Hyder, S.I. Feature based image classification by using principal component analysis. ICGST Int. J. Graph. Vis. Image Process. GVIP 2009, 9, 11–17. [Google Scholar]
- Khan, M.A.; Kim, Y. Deep Learning-Based Hybrid. Intelligent Intrusion Detection System. CMC Comput. Mater. Contin. 2021, 68, 671–687. [Google Scholar]
- Rajic, N. Principal component thermography for flaw contrast enhancement and flaw depth characterisation in composite structures. Compos. Struct. 2002, 58, 521–528. [Google Scholar] [CrossRef]
- Rother, C.; Kolmogorov, V.; Blake, A. GrabCut: Interactive foreground extraction using iterated graph cuts. In ACM SIGGRAPH 2004 Papers; Association for Computing Machinery: Los Angeles, CA, USA, 2004; pp. 309–314. [Google Scholar]
- Blake, A.; Rother, C.; Brown, M.; Perez, P.; Torr, P.H.S. Interactive image segmentation using an adaptive GMMRF model. In European Conference on Computer Vision; Springer: Berlin/Heidelberg, Germany, 2004. [Google Scholar]
- Zenggang, X.; Zhiwen, T.; Xiaowen, C.; Xue-Min, Z.; Kaibin, Z.; Conghuan, Y. Research on image retrieval algorithm based on combination of color and shape features. J. Signal Process. Syst. 2021, 93, 139–146. [Google Scholar] [CrossRef]
- Boykov, Y.Y.; Jolly, M.-P. Interactive graph cuts for optimal boundary & region segmentation of objects in ND images. In Proceedings of the Eighth IEEE International Conference on Computer Vision. ICCV 2001, Vancouver, BC, Canada, 7–14 July 2001. [Google Scholar]


| Chemical Composition | Mechanical and Thermal Properties | ||
|---|---|---|---|
| Carbon, C | 0.14–0.20% | Density | 7.87×10³ (kg/m3) |
| Iron, Fe | 98.81–99.26% | Tensile Strength, Yield | 370 (MPa) |
| Manganese, Mn | 0.60–0.90% | Thermal Conductivity | 45–64.9 (W/m × K) |
| Phosphorous, P | ≤0.040% | Specific Heat | 510.7 (J/kg × K) |
| Groups | A | B | C | D | E | |||||||||||||||
|---|---|---|---|---|---|---|---|---|---|---|---|---|---|---|---|---|---|---|---|---|
| Sub-groups | 1 | 2 | 3 | 4 | 1 | 2 | 3 | 4 | 1 | 2 | 3 | 4 | 1 | 2 | 3 | 4 | 1 | 2 | 3 | 4 |
| D (mm) | 20 | 15 | 10 | 5 | 20 | 15 | 10 | 5 | 20 | 15 | 10 | 5 | 20 | 15 | 10 | 5 | 20 | 15 | 10 | 5 |
| d * (mm) | 1 | 1 | 1 | 1 | 2 | 2 | 2 | 2 | 3 | 3 | 3 | 3 | 4 | 4 | 4 | 4 | 5 | 5 | 5 | 5 |
| Defect (d, D) mm | S1 | S2 | S3 | S4 | Note |
|---|---|---|---|---|---|
| A1 (1, 20) | √ | √ | √ | √ | S1: represents the status of defect visibility in the best original thermal image. S2: represents the status of defect visibility in the PCA of the original image (Figure 11c,d). S3: represents the status of the defect in the PCA of DRR images (Figure 11e,f). S4: represents the detection status of the defect in the GMM image (Figure 14e,f). |
| A2 (1, 15) | √ | √ | √ | √ | |
| A3 (1, 10) | √ | √ | √ | √ | |
| A4 (1, 5) | |||||
| B1 (2, 20) | √ | √ | √ | √ | |
| B2 (2, 15) | √ | √ | √ | √ | |
| B3 (2, 10) | √ | √ | |||
| B4 (2, 5) | |||||
| C1 (3, 20) | √ | √ | √ | √ | |
| C2 (3, 15) | √ | √ | √ | √ | |
| C3 (3, 10) | √ | √ | |||
| C4 (3, 5) | |||||
| D1 (4, 20) | √ | √ | √ | ||
| D2 (4, 15) | √ | √ | √ | ||
| D3 (4, 10) | √ | √ | |||
| D4 (4, 5) | |||||
| E1 (5, 20) | √ | √ | |||
| E2 (5, 15) | √ | √ | |||
| E3 (5, 10) | |||||
| E4 (5, 5) |
Publisher’s Note: MDPI stays neutral with regard to jurisdictional claims in published maps and institutional affiliations. |
© 2021 by the authors. Licensee MDPI, Basel, Switzerland. This article is an open access article distributed under the terms and conditions of the Creative Commons Attribution (CC BY) license (https://creativecommons.org/licenses/by/4.0/).
Share and Cite
Doshvarpassand, S.; Wang, X. An Automated Pipeline for Dynamic Detection of Sub-Surface Metal Loss Defects across Cold Thermography Images. Sensors 2021, 21, 4811. https://doi.org/10.3390/s21144811
Doshvarpassand S, Wang X. An Automated Pipeline for Dynamic Detection of Sub-Surface Metal Loss Defects across Cold Thermography Images. Sensors. 2021; 21(14):4811. https://doi.org/10.3390/s21144811
Chicago/Turabian StyleDoshvarpassand, Siavash, and Xiangyu Wang. 2021. "An Automated Pipeline for Dynamic Detection of Sub-Surface Metal Loss Defects across Cold Thermography Images" Sensors 21, no. 14: 4811. https://doi.org/10.3390/s21144811
APA StyleDoshvarpassand, S., & Wang, X. (2021). An Automated Pipeline for Dynamic Detection of Sub-Surface Metal Loss Defects across Cold Thermography Images. Sensors, 21(14), 4811. https://doi.org/10.3390/s21144811