1. Introduction
The increasing popularity of cycling as a method of transportation, recreation, and sport has led to an increase in the incidence of musculoskeletal injuries related to its practice [
1]. These injuries often occur due to incorrect cyclist posture on the bicycle, as a product of an incorrect equipment configuration or setup with rider’s body measurements and physical conditions [
2]. This ergonomic adjustment of bicycle components to the anthropometric measurements of the cyclist, aiming at more comfort, less pain and musculoskeletal overloads from repetitive cycling gestures, is known as “Bike fit”, or “Bike fitting” [
3,
4].
There are currently different bike fitting methods, but few of them follow a standardized protocol, limiting comparability, and reliability. The majority of bike fitting methods used today rely on anthropometric and kinematic measurements, to analyze static body dimensions and the cyclist dynamic riding posture, respectively. To the best of our knowledge, none use scientific validated measurement instruments to analysis kinematic data, as high-speed 3D cameras are unaffordable to a sport cycling teams, bike fitting services, or bike shops. The need for an accurate measure system in bike fitting relies on injury risk and performance factors, as small changes in posture can produce different power output and aerodynamics [
5,
6,
7].
During the last decade, affordable 3D camera systems aimed to evaluate cycling become more common. One of the most known 3D camera systems used for bike fitting is the Vantage 3D camera system, manufactured by Retul company, which have a standardized training program aimed to its users. Aided by inertial active-maker LED-emitting infrared harness, this portable 3D camera system has become very popular between athletes, mechanics, and bike fitters. As data are displayed in real time, adjustments can be done on the bicycle while changes occur on a rider’s body. An impossible task while using conventional laboratory high speed 3D cameras.
However, this system uses a slow speed infrared camera (18 Hz) generating doubts about its accuracy even when capturing marker’s location on the slow-speed activity of pedaling. Nevertheless, considering the portability factor, real time data response, and the standardization process of use, this 3D camera system could bring advantages to scientific community, cycling practitioners, and professionals, mostly bike fitters.
Therefore, the purpose of this study is to verify concurrent validation of a commercial bike fitting mixed-sensor LED-emitting 3D camera system with the gold-standard laboratorial 3D camera system. Our hypothesis is that a specific 3D camera system could be used as a kinematic tool with a reasonable accuracy when compared to the gold-standard.
2. Material and Methods
2.1. Design
This is a prospective validation preliminary study using data from a 3D camera system borrowed from a professional bike fitter not enrolled in the study. This research report followed the recommendations of the strengthening the reporting of observational studies in epidemiology (STROBE statement) [
8] and its design followed the recommendations of the improving healthcare decisions task force (ISPOR database recommendations) [
9].
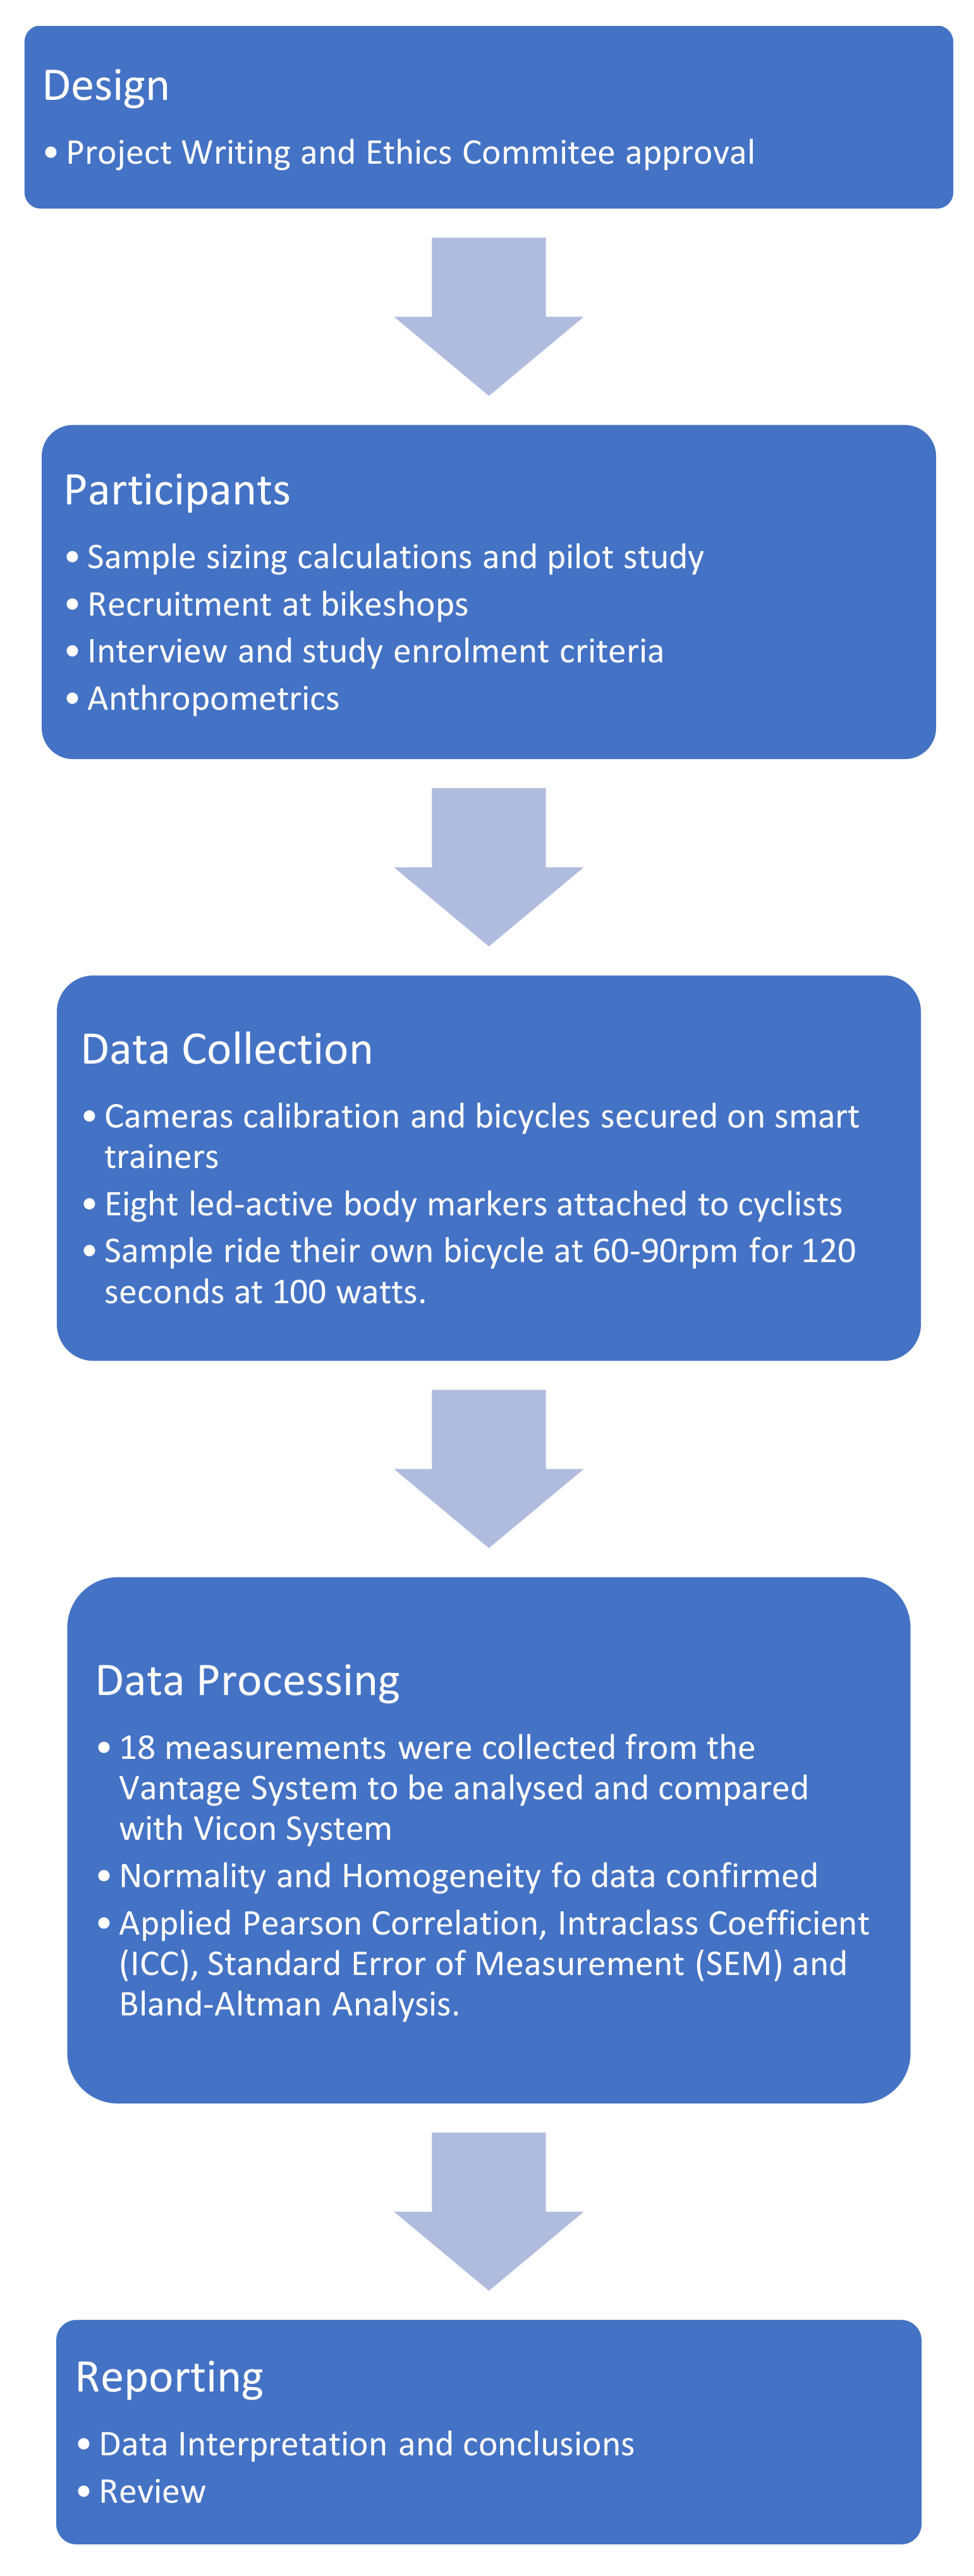
Figure 1 illustrates this study process and stages.
The study was carried out according to the Declaration of Helsinki, following the ethical standards in sports and exercise science research [
10]. A protocol was fully approved by the university human research ethics committee of our university with number #39223556. There was no involvement from patients or members of the public in the design, or conduct, or reporting, or dissemination plans of the research.
2.2. Participants
Participant sample size followed the examples of 8 to 15 subjects used in similar past researches and validation studies with indoor cycling [
11,
12,
13,
14]. A pilot study was conducted with one additional cyclist to previously standardize all procedures. We decided to finish our candidate’s acceptance when we had 11 amateurs, adult male cyclists, in that way reducing statistical damage from possible dropouts. Demographic and anthropometric information of the sample are presented in
Table 1.
The participants were recruited through advertisements in local bicycle shops. They were classified as amateurs according to a recent categorization based on weekly training and practice volume in kilometers [
15]. They should have more than six months familiarity with their current triathlon bicycle, and answer the physical activity readiness questionnaire (PARQ). Two positive responses to this questionnaire were a criterion for exclusion. Other exclusion criteria were cyclists with post-operative complaints; subjects using pain medication; and candidates younger than 18 years old.
The purpose, experimental procedures, possible risks and benefits of the study were explained to the candidates, who provided a written informed consent form to confirm participation in the study. Participants personal data were deleted after extraction to guarantee anonymity. Final data were stored on a password secure, internet cloud-based website, to avoid risk of information leak or lost. Participants personal data were deleted after extraction to guarantee anonymity. Final data were stored on a password secure, internet cloud-based private website, to avoid risk of information leak or lost.
2.3. Instruments
For data collection, three high-speed infrared tridimensional cameras (Bonita Camera System, Vicon Inc., Oxford, UK) were used, capturing infrared-sensitive markers positioned on eight cyclist’s body landmarks. Vicon-Bonita cameras were set to film at 240 Hz and are considered the gold-standard of 3D kinematic analysis in sports biomechanics with an accuracy of 0.4 mm maximal error of measurement. Vicon Bonita Hardware technical specifications can be accessed in the
Supplementary Material.
Simultaneously, a mixed inertial-sensor and led-emitting infrared tridimensional camera system (Vantage Camera System, Retul Inc., Boulder, CO, USA) used in bike fitting (also known as Retul 3D Cameras) were used to capture the same anatomical landmarks. According to manufacturer, the system is set to film at 18 Hz with built-in interpolation processes to improve accuracy of the measurements. Complete Retul Vantage Hardware technical specifications can be accessed in the
Supplementary Material.
Both cameras captured the same active LED-emitting markers partially covered with infrared-reflexive tape. All system’s calibration followed manufacturer’s manual instructions. Vicon cameras use an active led emitting “T” wand for calibration between subjects, while Vantage system self-calibrates using its combination of inertial sensors and 3D cameras.
Each participant own bicycle was connected to a hydraulic indoor direct-drive smart trainer (Suito, Ellite, Italy), equipped with a built-in power meter. A set of common mechanical tools (like screwdrivers and hex keys) was used to adjust and modify bicycle components.
For data storage and processing, a MacBook Pro Notebook (Cupertino, CA, USA) was used equipped with Microsoft Office software package for Mac (version 2011, Redmond, WA, USA) and statistical package for social sciences (SPSS) from IBM (Armonk, NY, USA). All motion capture raw data were extracted and processed by its own dedicated software’s (Vicon Tracker Software v3.6.1 and Vantage Software v7.0). The variables were imported into a custom-made script in MATLAB
® (MathWorks Inc., Natick, MA, USA) for digital filtering of data (second order, zero lag, low pass Butterworth with cut of frequency of 5 Hz) and partition in five consecutive crank cycles. Because the natural frequency of cycling movement was approximately 1 Hz (i.e., for 60 rotations per minute or rpm), we have chosen 5 Hz for kinematics filter in agreement with the minimum sampling frequency of 2.4 times the event frequency, as per the Nyquist theorem commonly used in kinematic studies of cycling [
16].
2.4. Procedure
Participants were requested to bring their bicycle to the clinic on a convenient pre-determined schedule between 8 am and 12 am from Monday to Friday. They receive a list of recommendations including wearing proper cycling clothing and shoes; do not practice strenuous exercise up to 6 h before a bike fit session; and avoid fasting 3 h before a session. During a session, they are allowed to drink fresh water on demand. The indoor temperature was maintained in 23 degrees Celsius, and humidity levels between 68% and 80%. The same physiotherapist, with 7 years of experience, performed all analysis. Both 3D camera systems filmed the rider’s right side using the same body landmarks.
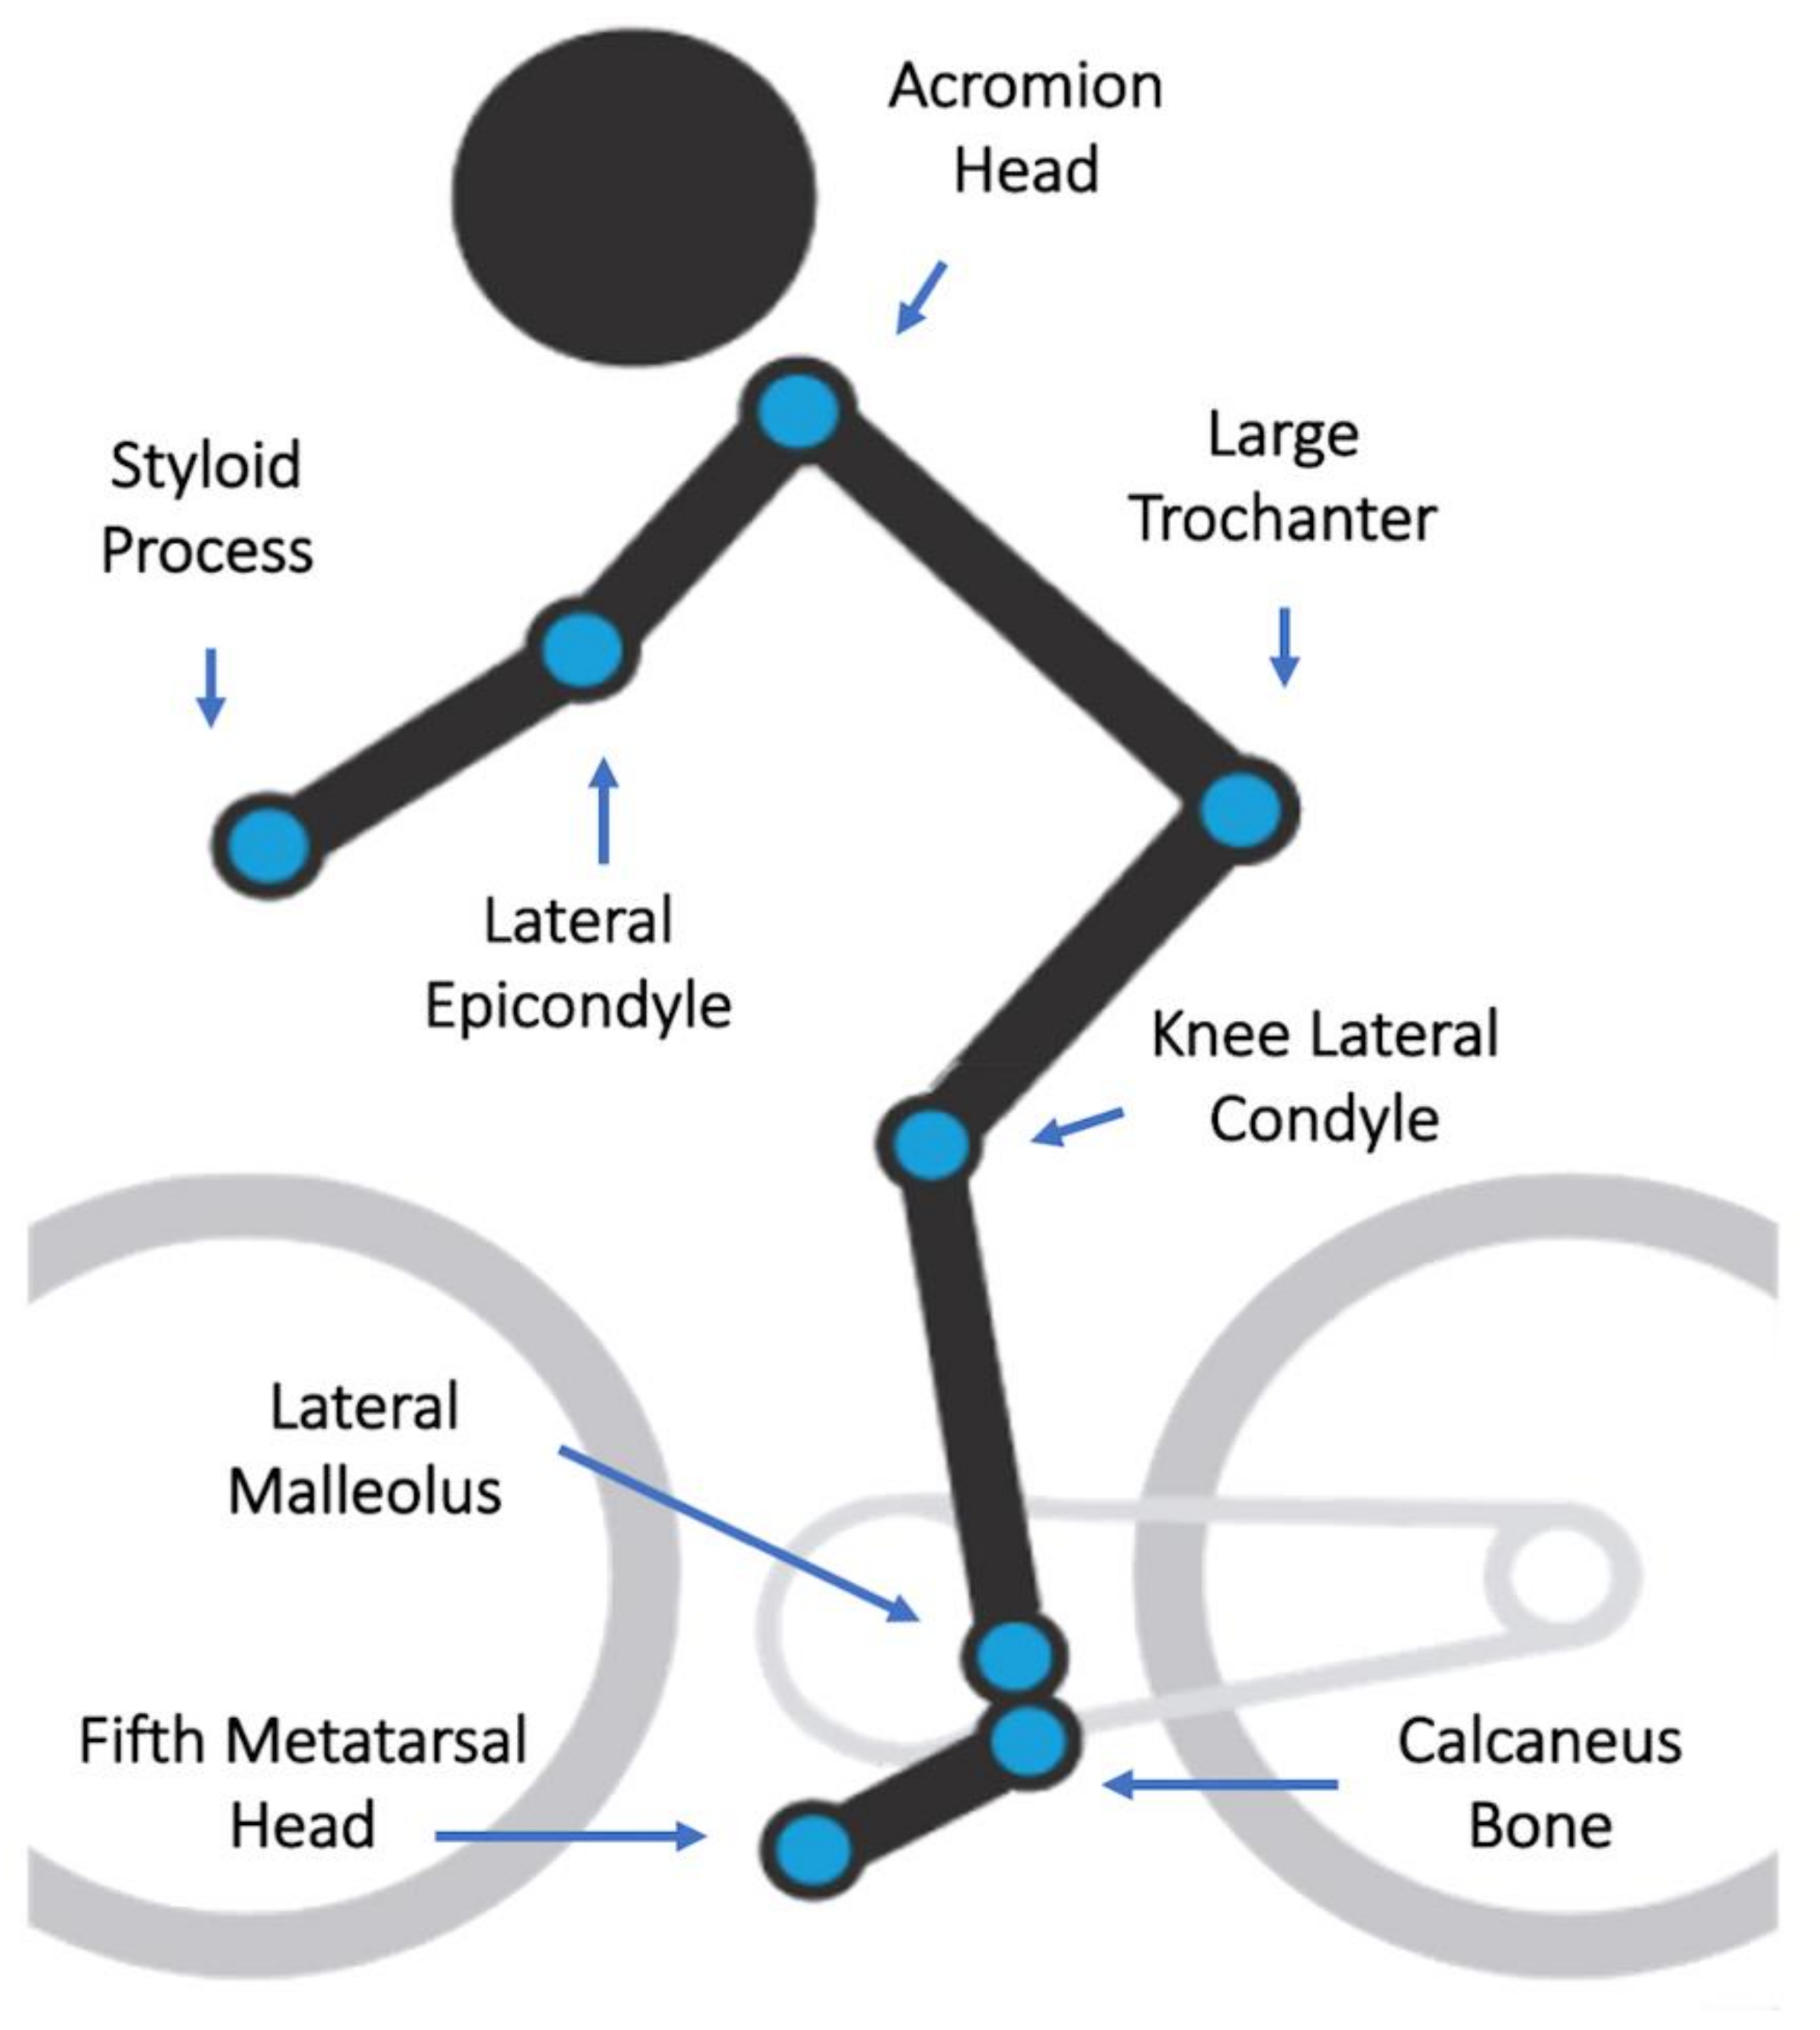
Figure 2 shows the landmarks used to attach each marker on cyclist’s body. Vantage camera systems do not use cluster-markers.
Upon arrival, participants were provided with appropriate explanation and demonstration of all procedures. Cyclists informed their personal data, level of experience with the current bicycle, weekly mileage, objectives, expectations, and complaints. Anthropometric data were recorded before a session began, following International Society for the Advancement of Kineanthropometry (ISAK) Level 1 certified anthropometrist protocol [
17]. The participants were then subjected to a standardized motion capture session while pedaling their own bicycles on the smart trainer. The motion capture session had a duration of 120 s.
After interview and physical assessment, began a standardized motion capture protocol. Each participant’s bicycle was positioned on the trainer while the rider’s body was marked with a harness containing active and passive markers for kinematic tracking. The subjects were asked to ride their bicycles on trainer for 120 s, at 60–90 rpm, with an automatic controlled load of 100 watts [
18]. They could then, drop from the bike and rest, while all data from Vicon and Retul cameras were safely stored.
We used Retul measurement descriptions (
Table 2) to reproduce these on Vicon software. Retul measurements use 5 references to calculate their measurements. Horizontal level and four crank positions: top, front, down, and rear, respectively, in degrees as zero, 30, 60, and 90. As both cameras filmed the cyclist at the same time, the time frame was synchronized, and we could identify the exact instant of each position on Vicon graphs time per position.
After calibration and identification of all 8 markers, the 18 measurements were triangulated, tracked during the pedaling session and extracted. Then we used the mean angular values between the time-frame window of 60 to 70 s to select Vicon measurements while Retul measurements are given by its own software in real time from the same 10 s time frame. Raw data from Vicon cameras were exported from Vicon software to an Excel spreadsheet. Then we selected the chosen time frame to analyze the mean values.
The active LED-emitting marker of Retul system is round and with a similar size to passive markers used in Vicon motion capture. The center of the Retul marker has a small emitting LED (0.2 mm in diameter), so we applied reflective tape around it to film both systems at the same time. As Vicon uses the center of the maker to calculate its measurements, it would have a clinically unimportant offset, if any, when compared to Retul measurements.
During motion capture, 18 kinematic measurements were collected.
Table 2 shows all 18 measurements’ descriptions, their names, abbreviations and commonly angular ranges.
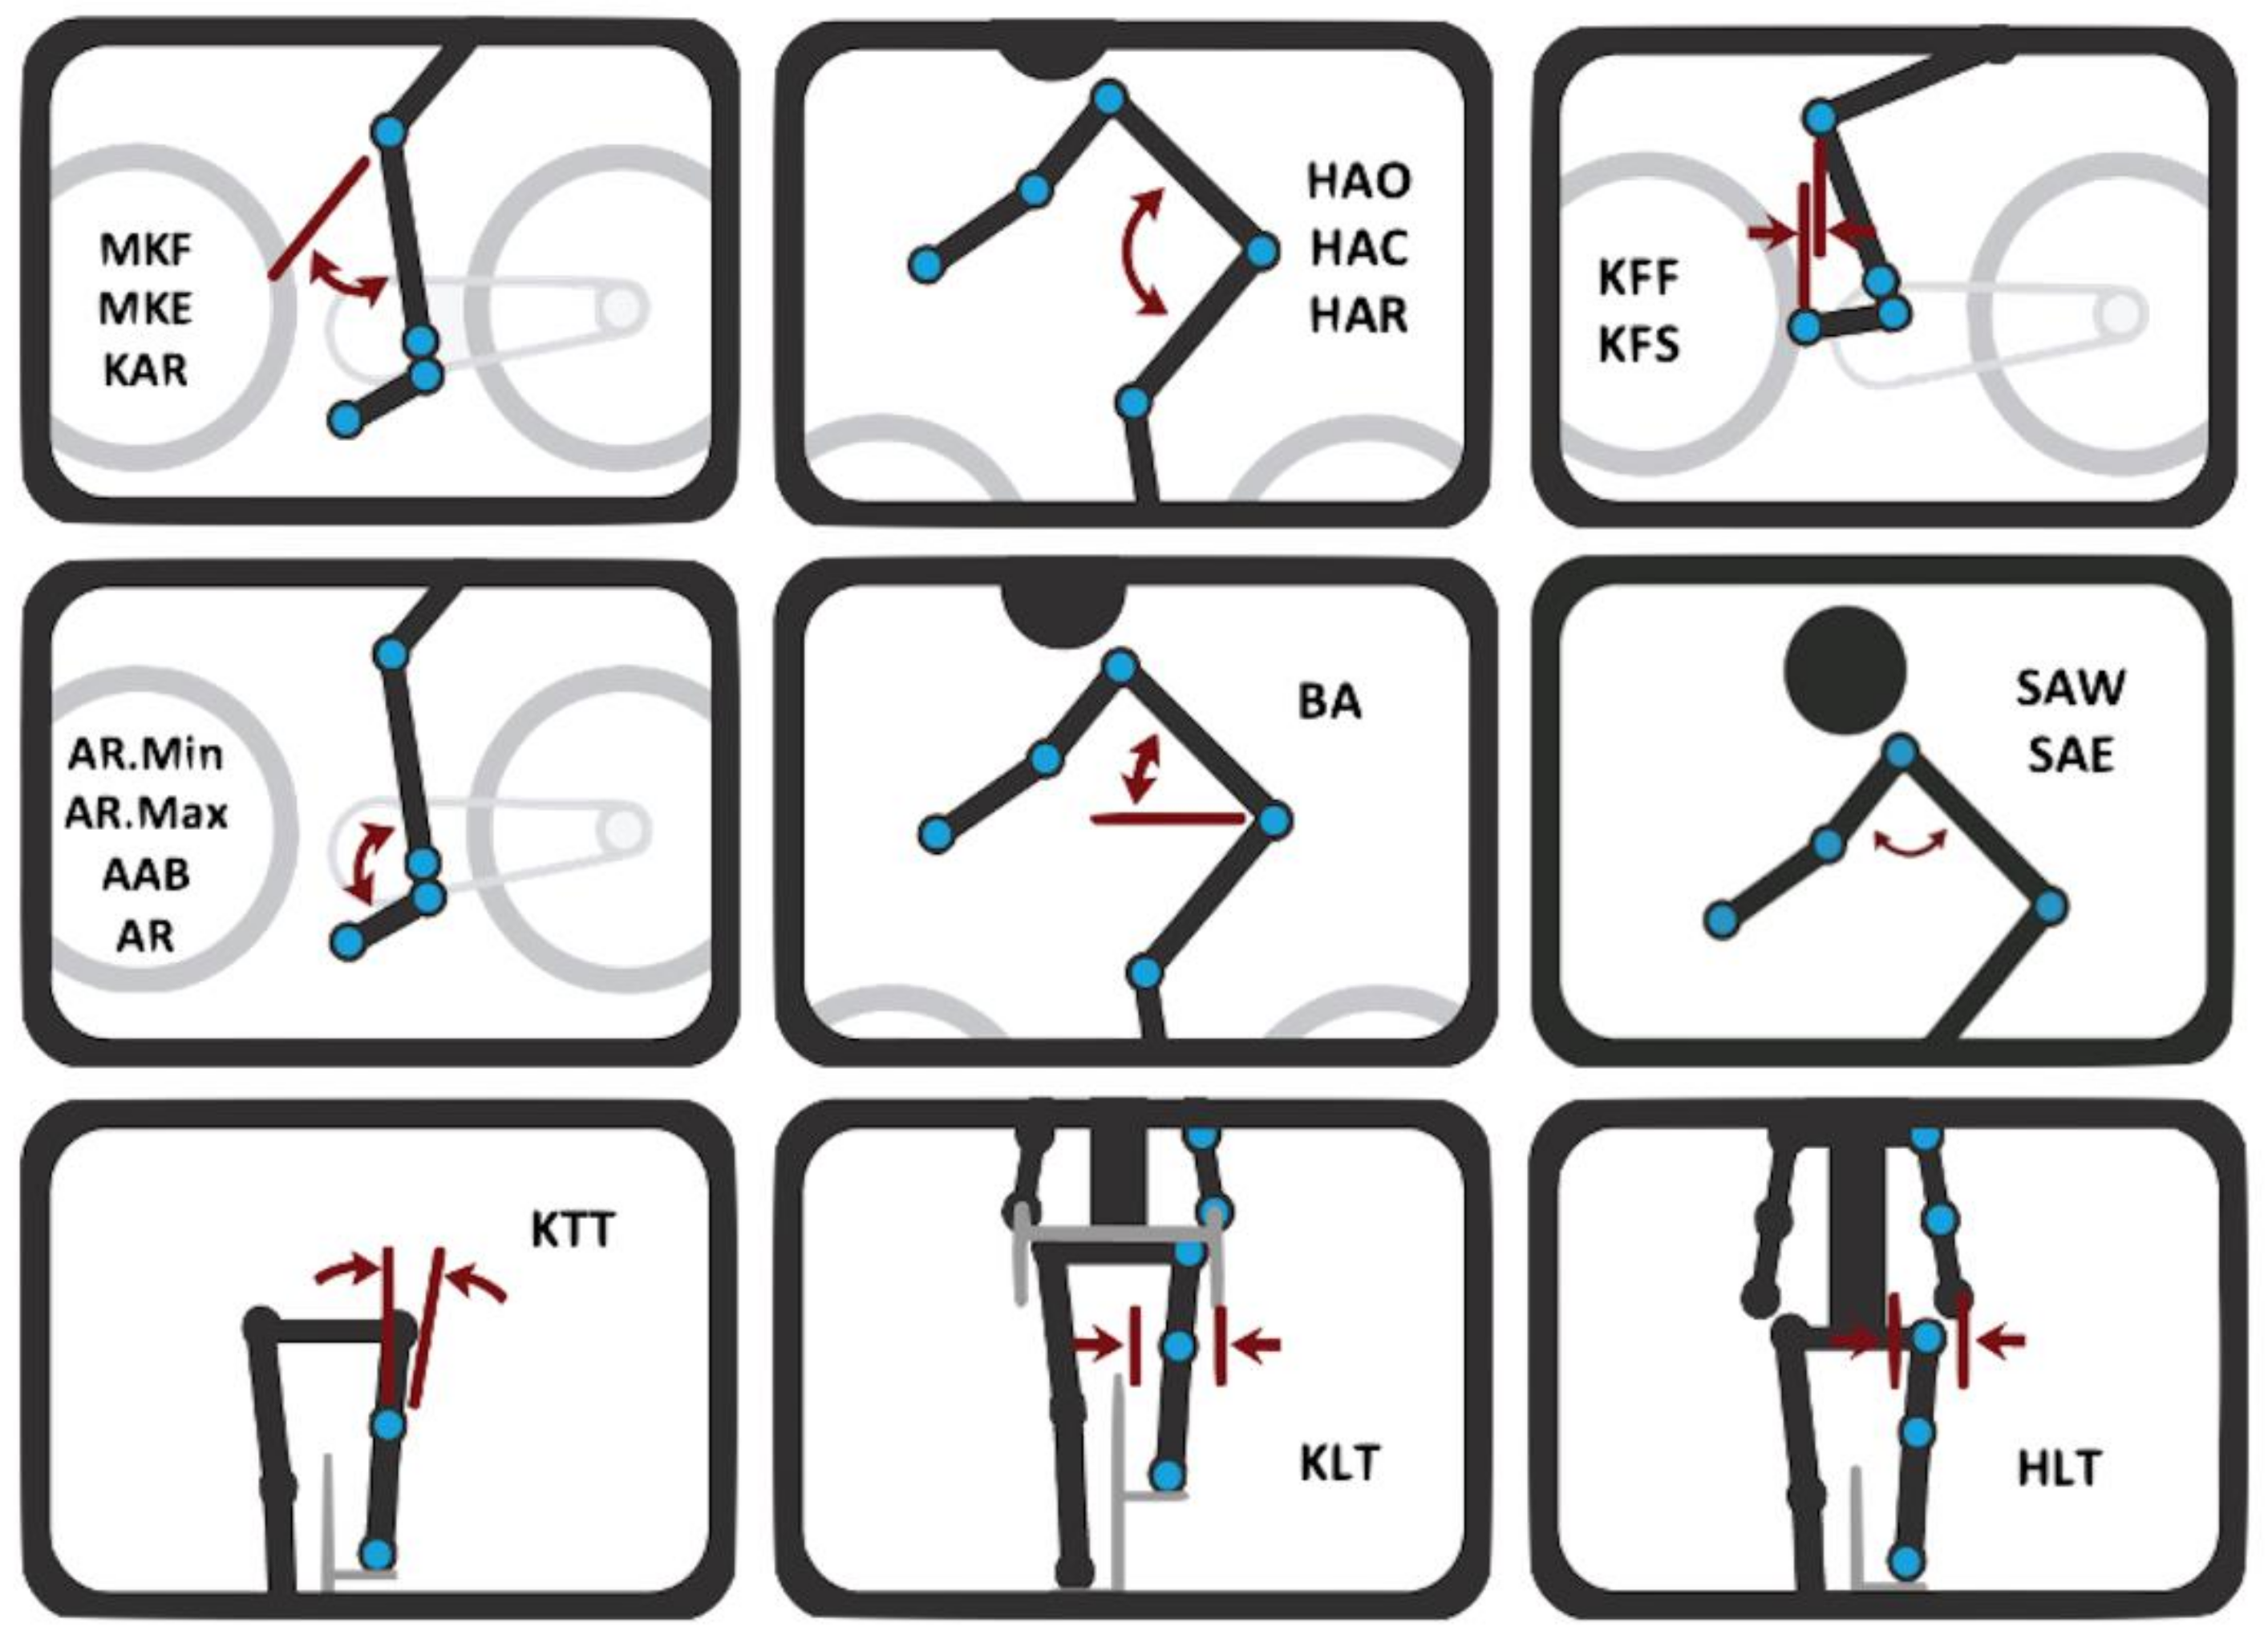
Figure 3 shows a schematic layout of all measurements with rider body markers. Although more measurements are given by Retul-Vantage system, we decided to choose the most used measures in clinical practice by bike fitters and sports medicine professionals.
2.5. Data Analysis
Demographic data extracted were: sex, age, height, weight, wingspan, BMI, experience (familiarity) with the current bicycle in months, rider training (practice) in kilometers per month. These data were recorded for descriptive analysis (mean ± standard deviation (SD)).
Table 1 shows all demographic and anthropometric data of the sample.
Normality of all data was confirmed using visual inspection and the Kolmogorov–Smirnov test. Homogeneity of variance was assessed via Levene’s Test. Pearson correlation (abbreviated as “r”), Intraclass Correlation Coefficient (ICC) were used to identify statistically significant differences between all 18 kinematic measure used.
Bland–Altman analysis was used to identify possible bias tendency in each measure between systems. The student
t-test for the measure difference between systems (showed as “
p” on results table) and the linear regression analysis (abbreviated as “
p” and “reg”, respectively) were calculated and its scatter plots are provided as
Supplementary Material.
Confidence intervals (95%) are provided for all measurements. The degree of correlation was classified as very high (higher than 0.9), high (between 0.7 and 0.9). moderate (between 0.5 and 0.7), low (between 0.3 and 0.5), and very low (between 0 and 0.3) [
19]. Standard error measurement (SEM) was calculated using a customized Microsoft Excel spreadsheet. All data were processed using a SPSS v.20 (IBM, Chicago, IL, USA) with a level of statistical significance set at alpha level
p < 0.05.
3. Results
Descriptive and inferential analysis results are presented on
Table 3. Bland–Altman results are also provided in
Table 3, and its 18 scatter plots can be accessed as
Supplementary Material.
The “
p” value on
Table 3 is the statistical result of a student
t-test between means of both systems kinematic measurements. The student
t-test results demonstrate that all 18 kinematic variables have no statistical difference between both camera systems (
p < 0.05).
A very high correlation between cameras was found on these measurements: Hip Angle Open (0.91), Shoulder Angle to Wrist (0.90), Shoulder Angle to Elbow (0.91), Knee Forward of Foot (0.94), Knee Forward of Spindle (0.95), Hip Lateral Travel (0.91). All other measurements presented a high correlation between cameras (between 0.7 and 0.9).
The six variables indicate a standard error of measurement (SEM) of less than one degree between both camera systems. They are: Ankle Minimum (0.8), Ankle Range (0.9), Maximum Knee Flexion (0.3), Maximum Knee Extension (0.5), Hip Angle Range (0.5), Knee Travel Tilt (0.3). Only two variables indicate a SEM higher than two degrees between camera systems. They are: Knee Lateral Travel (2.1) and Shoulder Angle to Wrist (2.7). All other 10 variables indicate a SEM between one degree and two degrees.
The Bland–Altman analysis indicated 4 measures with bias tendency when calculated their linear regression: Ankle Range (AR), Knee Angle Range (KAR), Knee Lateral Travel (KLT), and Hip Lateral Travel (HLT). All other 14 measures showed no tendency of bias.
4. Discussion
The purpose of this study was to verify concurrent validation of a commercial bike fitting tridimensional led-emitting low-speed 3D camera system with a gold-standard high-speed 3D camera system. Our hypothesis was that an affordable, portable 3D camera system could be used as a kinematic tool with a reasonable accuracy when compared to the gold-standard.
As our results have revealed, all kinematic measurements have a high or very high degree of correlation between Retul/Vantage and Vicon/Bonita cameras. These results indicate a reliable use of the system for indoor cycling kinematic analysis, like commercial bike fitting or even scientific investigations, considering the lower cost, potability and simplicity of the dedicated camera software and hardware. Other researchers have compared bike fitting methods before, but few of them used the gold-standard 3D camera systems [
20,
21].
Retul/Vantage 3D cameras do not have the same high-speed frame rate of Vicon 3D cameras, as the difference in prices are evident. Even so, this possible difference in frequency acquisition did not impact the precision of this portable system when compared with gold-standard cameras. This could be a result of mathematical interpolations using the crank arm length as a circumference radius. Different from a gait or running analysis, cycling has few secondary body movements beyond the primary motor-effort of lower limbs at sagittal plane. Considering a cadence of 60 rotations per minute, an acquisition frequency of 60 Hz should be able to capture 60 dots along all crank arm circumference [
22,
23,
24]. Using 18 Hz and interpolations from a couple of revolutions, this could generate sufficient information needed to calculate all 18 kinematic measurements and display it in real time for the user. Our study used a cadence between 70 and 90 rpm, where the majority of cycling training regimes occur, so it is unclear if higher cadences can be used with this system [
25,
26]. As Bland–Altman analysis have demonstrated, four measures presented tendency of bias to upper or lower limits of standard deviations; and should be used with cautious by sports professionals, like bike fitters. Two of these measures are means of range of motions, calculated from another two measures of upper and lower range of motion limits. Their tendency of bias may be related to this calculation as a secondary measure and not a directly extracted from filming measure.
To the best of our knowledge, only three scientific papers have tried to validate a similar camera system. The most similar to our study design and methods had only three subjects and their data were limited to 15 measurements that do not reconstruct all cycling movements, or the relationship between rider and bicycle. Similar to our results, they found high levels of correlation between a LED-emitting camera system for cycling analysis and the gold standard high-speed Vicon cameras [
27].
In another research, the authors established the validity and reliability of three different kinematic methods for bike fitting: Vicon cameras as comparison gold standard, one high-speed 2D camera and one electrogoniometer [
21]. Images from the 2D camera were separated in frame blocks and analyzed through a generic motion analysis software. They found high correlation between both cameras but the electrogoniometer did not show similar measurements. Although a 2D camera offer a cost-effective alternative to analyze a cyclist kinematically, the post-filming process of digital analysis on a computer frame by frame is too much impeditive and laborious to most bike fitters and researchers.
5. Conclusions
This affordable and portable mixed inertial-sensor, led-emitting tridimensional camera system revealed a high and very high degree of correlation with the gold-standard indoor laboratorial tridimensional camera system. Standard error of measurements of less than two degrees was found in 16 of 18 kinematic measurements.
The measurements presented by this system have an acceptable level of accuracy for both bike fitting analysis and cycling research. With a dedicated software, real time motion capture analysis and up to 18 full body common cycling measurements, this system could improve the speed of studies about cycling biomechanics. Reducing long periods of data management.
6. Limitations
Our study used a free cadence between 70 and 90 rotations per minute, a common cadence used in cycling training. It is unknown if higher cadences would impact the accuracy of this 3D camera system.
Author Contributions
Conceptualization: R.D.S.; Database Research: B.M.O.A., T.R.E., M.F.S.; Data Management: T.R.E., M.F.S.; Writing—Original Draft: R.D.S., B.M.O.A.; Writing—Editing: P.R.d.O.; Writing—Review: L.M.A.F.; Supervision: C.F.A. All authors have read and agreed to the published version of the manuscript.
Funding
No private or governmental organization funded this research.
Institutional Review Board Statement
All procedures performed in studies involving human participants were in accordance with the ethical standards of the institutional or national research committee and with the 1964 Helsinki declaration and its later amendments or comparable ethical standards. A protocol was fully approved by Universidade Cidade de Sao Paulo University Human Research Ethics Committee with number #39223556.
Informed Consent Statement
There was no involvement from patients or members of the public in the design, or conduct, or reporting, or dissemination plans of this research.
Data Availability Statement
Additional data from this study were not allowed to be shared by participant institutions.
Conflicts of Interest
All authors declare having no conflict of interest while working on this research.
References
- Priego Quesada, J.I.; Kerr, Z.Y.; Bertucci, W.M.; Carpes, F.P. A Retrospective International Study on Factors Associated with Injury, Discomfort and Pain Perception among Cyclists. PLoS ONE 2019, 14, e0211197. [Google Scholar] [CrossRef] [PubMed]
- Streisfeld, G.M.; Bartoszek, C.; Creran, E.; Inge, B.; Mcshane, M.D.; Johnston, T. Relationship Between Body Positioning, Muscle Activity, and Spinal Kinematics in Cyclists With and Without Low Back Pain: A Systematic Review. Sports Health 2017, 9, 75–79. [Google Scholar] [CrossRef] [PubMed]
- Priego Quesada, J.I.; Pérez-Soriano, P.; Lucas-Cuevas, A.G.; Salvador Palmer, R.; Cibrián Ortiz de Anda, R.M. Effect of Bike-Fit in the Perception of Comfort, Fatigue and Pain. J. Sports Sci. 2017, 35, 1459–1465. [Google Scholar] [CrossRef] [PubMed]
- Dinsdale, N.; Dinsdale, N. Modern-day bikefitting can offer proactive therapists new opportunities. SportEX Dyn. 2014, 39, 25–32. [Google Scholar]
- Bini, R.; Daly, L.; Kingsley, M. Changes in Body Position on the Bike during Seated Sprint Cycling: Applications to Bike Fitting. Eur. J. Sport Sci. 2020, 20, 35–42. [Google Scholar] [CrossRef]
- Swart, J.; Holliday, W. Cycling Biomechanics Optimization-the (R) Evolution of Bicycle Fitting. Curr Sports Med. Rep. 2019, 18, 490–496. [Google Scholar] [CrossRef]
- Bini, R.R.; Daly, L.; Kingsley, M. Muscle Force Adaptation to Changes in Upper Body Position during Seated Sprint Cycling. J. Sports Sci. 2019, 37, 2270–2278. [Google Scholar] [CrossRef]
- Von Elm, E.; Altman, D.G.; Egger, M.; Pocock, S.J.; Gøtzsche, P.C.; Vandenbroucke, J.P. The Strengthening the Reporting of Observational Studies in Epidemiology (STROBE) Statement: Guidelines for Reporting Observational Studies. Lancet 2007, 370, 1453–1457. [Google Scholar] [CrossRef]
- Motheral, B.; Brooks, J.; Clark, M.A.; Crown, W.H.; Davey, P.; Hutchins, D.; Martin, B.C.; Stang, P. A Checklist for Retrospective Database Studies—Report of the ISPOR Task Force on Retrospective Databases. Value Health 2003, 6, 90–97. [Google Scholar] [CrossRef]
- Harriss, D.J.; MacSween, A.; Atkinson, G. Ethical Standards in Sport and Exercise Science Research: 2020 Update. Int. J. Sports Med. 2019, 40, 813–817. [Google Scholar] [CrossRef]
- Fintelman, D.M.; Sterling, M.; Hemida, H.; Li, F.-X. Effect of Different Aerodynamic Time Trial Cycling Positions on Muscle Activation and Crank Torque. Scand. J. Med. Sci. Sports 2016, 26, 528–534. [Google Scholar] [CrossRef]
- Jaipurkar, R. Evaluation of Sports Persons and Biomechanics. Indian J. Physiol. Pharmacol. 2017, 61, 14–19. [Google Scholar]
- Bini, R.R.; Hume, P.A.; Lanferdini, F.J.; Vaz, M.A. Effects of Body Positions on the Saddle on Pedalling Technique for Cyclists and Triathletes. Eur. J. Sport Sci. 2014, 14, S413–S420. [Google Scholar] [CrossRef] [PubMed]
- Silder, A.; Gleason, K.; Thelen, D.G. Influence of Bicycle Seat Tube Angle and Hand Position on Lower Extremity Kinematics and Neuromuscular Control: Implications for Triathlon Running Performance. J. Appl. Biomech. 2011, 27, 297–305. [Google Scholar] [CrossRef][Green Version]
- Priego Quesada, J.I.; Kerr, Z.Y.; Bertucci, W.M.; Carpes, F.P. The Categorization of Amateur Cyclists as Research Participants: Findings from an Observational Study. J. Sports Sci. 2018, 36, 2018–2024. [Google Scholar] [CrossRef] [PubMed]
- Bini, R.R.; Hume, P. A Comparison of Static and Dynamic Measures of Lower Limb Joint Angles in Cycling: Application to Bicycle Fitting. Hum. Mov. 2016, 17, 36–42. [Google Scholar] [CrossRef]
- da Silva, V.S.; Vieira, M.F.S. International Society for the Advancement of Kinanthropometry (ISAK) Global: International Accreditation Scheme of the Competent Anthropometrist. Rev. Bras. Cineantropom. Desempenho Hum. 2020, 22. [Google Scholar] [CrossRef]
- Ansley, L.; Cangley, P. Determinants of “Optimal” Cadence during Cycling. Eur. J. Sport Sci. 2009, 9, 61–85. [Google Scholar] [CrossRef]
- Kirch, W. (Ed.) Pearson’s Correlation Coefficient. In Encyclopedia of Public Health; Springer: Dordrecht, The Netherlands, 2008; pp. 1090–1091. ISBN 978-1-4020-5614-7. [Google Scholar]
- Holliday, W.; Fisher, J.; Theo, R.; Swart, J. Static versus Dynamic Kinematics in Cyclists: A Comparison of Goniometer, Inclinometer and 3D Motion Capture. Eur. J. Sport Sci. 2017, 17, 1129–1142. [Google Scholar] [CrossRef]
- Fonda, B.; Sarabon, N.; Li, F.-X. Validity and Reliability of Different Kinematics Methods Used for Bike Fitting. J. Sports Sci. 2014, 32, 940–946. [Google Scholar] [CrossRef]
- Jeang, A.; Chiang, A.J.; Chiang, P.C.; Chiang, P.S.; Tung, P.Y. Robust Parameters Determination for Ergonomical Product Design via Computer Musculoskeletal Modeling and Multi-Objective Optimization. Comput. Ind. Eng. 2018, 118, 180–201. [Google Scholar] [CrossRef]
- Bini, R.R.; Dagnese, F. Noncircular Chainrings and Pedal to Crank Interface in Cycling: A Literature Review. Rev. Bras. Cineantropom. Desempenho Hum. 2012, 14, 470–482. [Google Scholar] [CrossRef]
- Bourdon, E.; Mavor, M.; Hay, D.C. Assessment of Three-Dimensional Trunk Kinematics and Muscle Activation during Cycling with Independent Cranks. J. Sports Sci. Med. 2017, 16, 536–542. [Google Scholar]
- Egaña, M.; Columb, D.; O’Donnell, S. Effect of Low Recumbent Angle on Cycling Performance, Fatigue, and V·O2 Kinetics. Med. Sci. Sports Exerc. 2013, 45, 663–673. [Google Scholar] [CrossRef]
- Fontes, E.B.; Smirmaul, B.P.C.; Nakamura, F.Y.; Pereira, G.; Okano, A.H.; Altimari, L.R.; Dantas, J.L.; de Moraes, A.C. The Relationship between Rating of Perceived Exertion and Muscle Activity during Exhaustive Constant-Load Cycling. Int. J. Sports Med. 2010, 31, 683–688. [Google Scholar] [CrossRef]
- Bouillod, A.; Costes, A.; Soto-Romero, G.; Brunet, E.; Grappe, F. Validity and Reliability of the 3D Motion Analyzer in Comparison with the Vicon Device for Biomechanical Pedalling Analysis. In Proceedings of the 4th International Congress on Sport Sciences Research and Technology Support (IcSPORTS), Porto, Portugal, 7 November 2016; pp. 63–66. [Google Scholar]
| Publisher’s Note: MDPI stays neutral with regard to jurisdictional claims in published maps and institutional affiliations. |
© 2021 by the authors. Licensee MDPI, Basel, Switzerland. This article is an open access article distributed under the terms and conditions of the Creative Commons Attribution (CC BY) license (https://creativecommons.org/licenses/by/4.0/).


 ,
, 


